Jtl v07n02p01
21
Key words: willingness to pay; RPL model; rural feeder service; econometric models. Palavras-Chave: disposição a pagar; modelo RPL; serviços alimentadores de viagens; modelos econométricos. Recommended Citation Research Directory Journal of Transport Literature Submitted 8 May 2012; received in revised form 11 Jul 2012; accepted 17 Jul 2012 Vol. 7, n. 2, pp. 8-28, Apr. 2013 Effect of model specification on valuation of travel attributes: a case study of rural feeder service to bus stop [Efeito da especificação do modelo na valoração dos atributos de viagem: estudo de caso dos serviços alimentadores de viagens rurais até pontos de ônibus] IIT Khargpur, India, IIT Khargpur, India, RSR Rungta College of Engineering and Technology, India, Darmstadt University of Technology, Germany Bhargab Maitra*, Santanu Ghosh, Sudhanshu Sekhar Das, Manfred Boltze Abstract In willingness-to-pay (WTP) studies, stated preference (SP) data are analyzed by developing econometric models. However, the variation of WTP across different model specifications has not been studied adequately. This paper reports a comparison of various econometric models and estimated WTP values with reference to a case study of rural feeder service to bus stop. Econometric models included Multinomial Logit (MNL), Heteroskedastic Extreme Value (HEV), Nested Logit (NL), Covariance Heterogeneity Nested Logit (CHNL), and Random Parameter Logit (RPL). Various econometric models are found to be consistent and acceptable in terms of signs of coefficient estimates, statistical significance of coefficient estimates and overall goodness of fit. The WTP values are found to vary across different model specifications, although the variations are not consistent and predominant for all attributes. In the present case study, the effect of model specification is found predominant on WTP for a reduction in access walking distance. Also, RPL models accounting for deterministic heterogeneity are found superior to other econometric models such as MNL, HEV, NL, CHNL and RPL models accounting for only random heterogeneity. The work highlights the importance of model specification in WTP studies. Resumo Nos estudos que tratam da disposição a pagar (“WTP – willingness-to-pay”), os dados de preferência declarada são analisados por meio do desenvolvimento de modelos econométricos. Todavia, a variação do WTP em diferentes especificações não tem sido estudada adequadamente. Uma comparação entre modelos econométricos, no contexto de valor da WTP, é feito com referência ao estudo de caso de serviços alimentadores de viagens rurais até pontos de ônibus. As especificações testadas incluem: Logit Mutinomial (MNL), Valores Extremos com Heterocedasticidade (HEV), Logit Aninhado (NL), Logit Aninhado com Covariância Heterogenênea (CHNL) e Logit com Parâmetros Aleatórios. Diversos modelos econométricos foram testados para se obter consistência e aceitação dos sinais dos coeficientes estimados, da significância estatística dos coeficientes e, ao fim, um bom grau de ajuste. Os valores da WTP encontrados variam entre os diferentes modelos, contudo as variações não são consistentes e predominantes para todos os atributos. No caso estudado, o efeito do modelo especificado é encontrado predominantemente no WTP para a redução do percurso caminhado a pé. O trabalho destaca a importância da especificação de modelos em estudos de WTP e documenta a comparação entre diferentes especificações para um mesmo estudo de caso. Maitra, B., Ghosh, S., Das, S. S. and Boltze, M. (2013) Effect of model specification on valuation of travel attributes: a case study of rural feeder service to bus stop. Journal of Transport Literature, vol. 7, n. 2, pp. 8-28. This paper is downloadable at www.transport-literature.org/open-access. ■ JTL|RELIT is a fully electronic, peer-reviewed, open access, international journal focused on emerging transport markets and published by BPTS - Brazilian Transport Planning Society. Website www.transport-literature.org. ISSN 2238-1031. * Email: [email protected]. B T P S B T P S B T P S B T P S Brazilian Transportation Planning Society www.transport-literature.org JTL|RELIT JTL|RELIT JTL|RELIT JTL|RELIT ISSN 2238-1031
-
Upload
journal-of-transport-literature -
Category
Documents
-
view
227 -
download
1
description
The Journal of Transport Literature ©2014 | BPTS | Brazilian Transport Planning Society
Transcript of Jtl v07n02p01
Key words: willingness to pay; RPL model; rural feeder service; econometric models.
Palavras-Chave: disposição a pagar; modelo RPL; serviços alimentadores de viagens; modelos econométricos.
Recommended Citation
Research Directory
Journal of Transport Literature
Submitted 8 May 2012; received in revised form 11 Jul 2012; accepted 17 Jul 2012
Vol. 7, n. 2, pp. 8-28, Apr. 2013
Effect of model specification on valuation of travel attributes:
a case study of rural feeder service to bus stop
[Efeito da especificação do modelo na valoração dos atributos de viagem: estudo de caso
dos serviços alimentadores de viagens rurais até pontos de ônibus]
IIT Khargpur, India, IIT Khargpur, India, RSR Rungta College of Engineering and Technology, India,
Darmstadt University of Technology, Germany
Bhargab Maitra*, Santanu Ghosh, Sudhanshu Sekhar Das, Manfred Boltze
Abstract
In willingness-to-pay (WTP) studies, stated preference (SP) data are analyzed by developing econometric models. However,
the variation of WTP across different model specifications has not been studied adequately. This paper reports a comparison of
various econometric models and estimated WTP values with reference to a case study of rural feeder service to bus stop.
Econometric models included Multinomial Logit (MNL), Heteroskedastic Extreme Value (HEV), Nested Logit (NL), Covariance
Heterogeneity Nested Logit (CHNL), and Random Parameter Logit (RPL). Various econometric models are found to be consistent
and acceptable in terms of signs of coefficient estimates, statistical significance of coefficient estimates and overall goodness of
fit. The WTP values are found to vary across different model specifications, although the variations are not consistent and
predominant for all attributes. In the present case study, the effect of model specification is found predominant on WTP for a
reduction in access walking distance. Also, RPL models accounting for deterministic heterogeneity are found superior to other
econometric models such as MNL, HEV, NL, CHNL and RPL models accounting for only random heterogeneity. The work
highlights the importance of model specification in WTP studies.
Resumo
Nos estudos que tratam da disposição a pagar (“WTP – willingness-to-pay”), os dados de preferência declarada são analisados
por meio do desenvolvimento de modelos econométricos. Todavia, a variação do WTP em diferentes especificações não tem sido
estudada adequadamente. Uma comparação entre modelos econométricos, no contexto de valor da WTP, é feito com referência
ao estudo de caso de serviços alimentadores de viagens rurais até pontos de ônibus. As especificações testadas incluem: Logit
Mutinomial (MNL), Valores Extremos com Heterocedasticidade (HEV), Logit Aninhado (NL), Logit Aninhado com Covariância
Heterogenênea (CHNL) e Logit com Parâmetros Aleatórios. Diversos modelos econométricos foram testados para se obter
consistência e aceitação dos sinais dos coeficientes estimados, da significância estatística dos coeficientes e, ao fim, um bom grau
de ajuste. Os valores da WTP encontrados variam entre os diferentes modelos, contudo as variações não são consistentes e
predominantes para todos os atributos. No caso estudado, o efeito do modelo especificado é encontrado predominantemente no
WTP para a redução do percurso caminhado a pé. O trabalho destaca a importância da especificação de modelos em estudos de
WTP e documenta a comparação entre diferentes especificações para um mesmo estudo de caso.
Maitra, B., Ghosh, S., Das, S. S. and Boltze, M. (2013) Effect of model specification on valuation of travel attributes: a case study of
rural feeder service to bus stop. Journal of Transport Literature, vol. 7, n. 2, pp. 8-28.
This paper is downloadable at www.transport-literature.org/open-access.
■ JTL|RELIT is a fully electronic, peer-reviewed, open access, international journal focused on emerging transport markets and
published by BPTS - Brazilian Transport Planning Society. Website www.transport-literature.org. ISSN 2238-1031.
* Email: [email protected].
B T P SB T P SB T P SB T P S
Brazilian Transportation Planning Society
www.transport-literature.org
JTL|RELITJTL|RELITJTL|RELITJTL|RELIT
ISSN 2238-1031
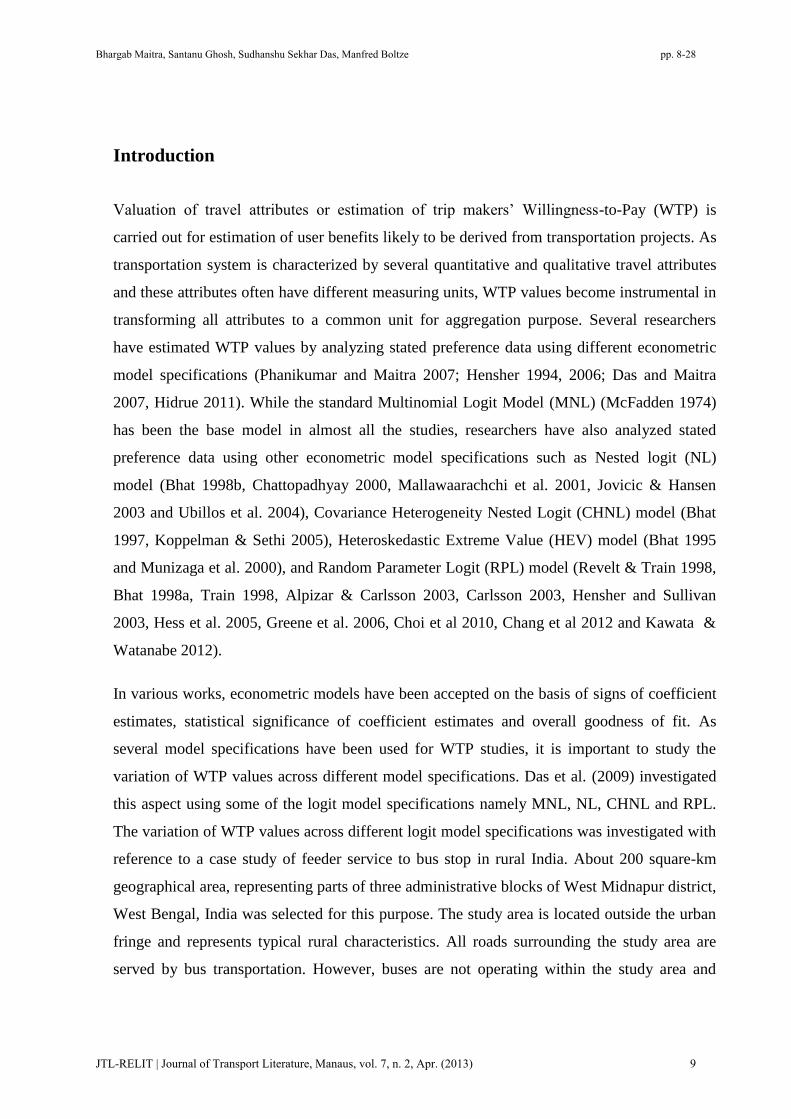
Introduction
Valuation of travel attributes or estimation of trip makers‟ Willingness-to-Pay (WTP) is
carried out for estimation of user benefits likely to be derived from transportation projects. As
transportation system is characterized by several quantitative and qualitative travel attributes
and these attributes often have different measuring units, WTP values become instrumental in
transforming all attributes to a common unit for aggregation purpose. Several researchers
have estimated WTP values by analyzing stated preference data using different econometric
model specifications (Phanikumar and Maitra 2007; Hensher 1994, 2006; Das and Maitra
2007, Hidrue 2011). While the standard Multinomial Logit Model (MNL) (McFadden 1974)
has been the base model in almost all the studies, researchers have also analyzed stated
preference data using other econometric model specifications such as Nested logit (NL)
model (Bhat 1998b, Chattopadhyay 2000, Mallawaarachchi et al. 2001, Jovicic & Hansen
2003 and Ubillos et al. 2004), Covariance Heterogeneity Nested Logit (CHNL) model (Bhat
1997, Koppelman & Sethi 2005), Heteroskedastic Extreme Value (HEV) model (Bhat 1995
and Munizaga et al. 2000), and Random Parameter Logit (RPL) model (Revelt & Train 1998,
Bhat 1998a, Train 1998, Alpizar & Carlsson 2003, Carlsson 2003, Hensher and Sullivan
2003, Hess et al. 2005, Greene et al. 2006, Choi et al 2010, Chang et al 2012 and Kawata &
Watanabe 2012).
In various works, econometric models have been accepted on the basis of signs of coefficient
estimates, statistical significance of coefficient estimates and overall goodness of fit. As
several model specifications have been used for WTP studies, it is important to study the
variation of WTP values across different model specifications. Das et al. (2009) investigated
this aspect using some of the logit model specifications namely MNL, NL, CHNL and RPL.
The variation of WTP values across different logit model specifications was investigated with
reference to a case study of feeder service to bus stop in rural India. About 200 square-km
geographical area, representing parts of three administrative blocks of West Midnapur district,
West Bengal, India was selected for this purpose. The study area is located outside the urban
fringe and represents typical rural characteristics. All roads surrounding the study area are
served by bus transportation. However, buses are not operating within the study area and
JTL-RELIT | Journal of Transport Literature, Manaus, vol. 7, n. 2, Apr. (2013) 9
Bhargab Maitra, Santanu Ghosh, Sudhanshu Sekhar Das, Manfred Boltze pp. 8-28
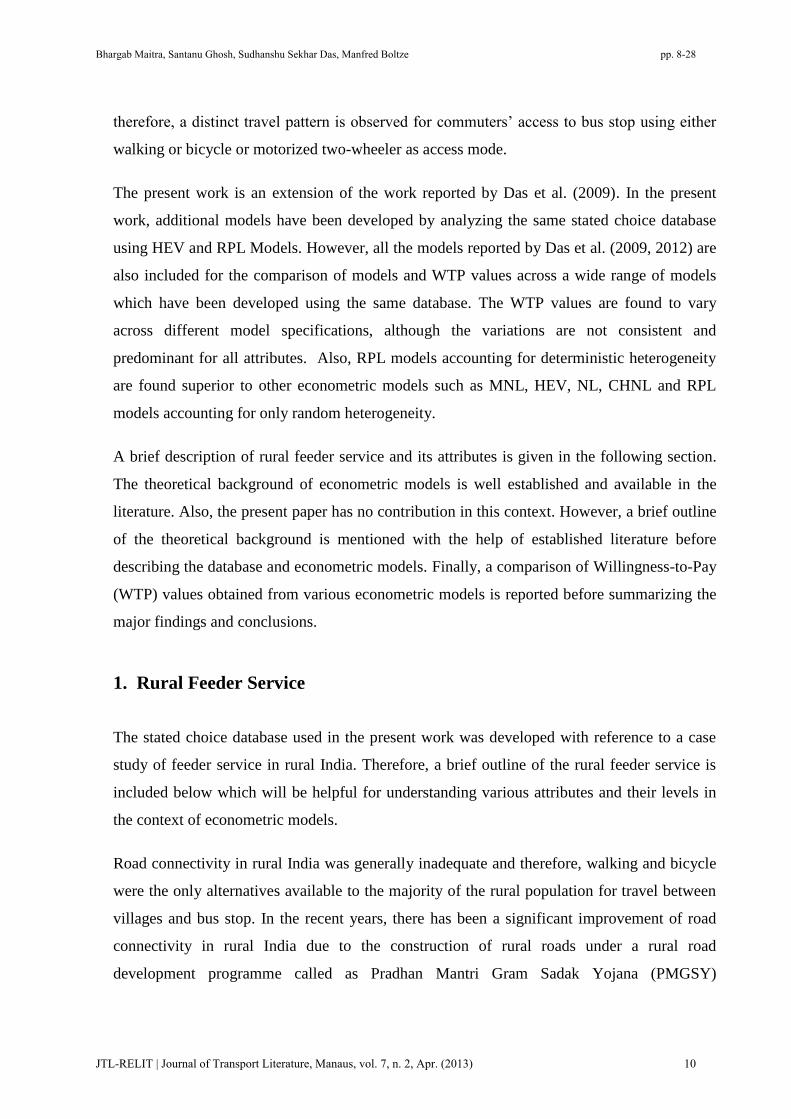
therefore, a distinct travel pattern is observed for commuters‟ access to bus stop using either
walking or bicycle or motorized two-wheeler as access mode.
The present work is an extension of the work reported by Das et al. (2009). In the present
work, additional models have been developed by analyzing the same stated choice database
using HEV and RPL Models. However, all the models reported by Das et al. (2009, 2012) are
also included for the comparison of models and WTP values across a wide range of models
which have been developed using the same database. The WTP values are found to vary
across different model specifications, although the variations are not consistent and
predominant for all attributes. Also, RPL models accounting for deterministic heterogeneity
are found superior to other econometric models such as MNL, HEV, NL, CHNL and RPL
models accounting for only random heterogeneity.
A brief description of rural feeder service and its attributes is given in the following section.
The theoretical background of econometric models is well established and available in the
literature. Also, the present paper has no contribution in this context. However, a brief outline
of the theoretical background is mentioned with the help of established literature before
describing the database and econometric models. Finally, a comparison of Willingness-to-Pay
(WTP) values obtained from various econometric models is reported before summarizing the
major findings and conclusions.
1. Rural Feeder Service
The stated choice database used in the present work was developed with reference to a case
study of feeder service in rural India. Therefore, a brief outline of the rural feeder service is
included below which will be helpful for understanding various attributes and their levels in
the context of econometric models.
Road connectivity in rural India was generally inadequate and therefore, walking and bicycle
were the only alternatives available to the majority of the rural population for travel between
villages and bus stop. In the recent years, there has been a significant improvement of road
connectivity in rural India due to the construction of rural roads under a rural road
development programme called as Pradhan Mantri Gram Sadak Yojana (PMGSY)
JTL-RELIT | Journal of Transport Literature, Manaus, vol. 7, n. 2, Apr. (2013) 10
Bhargab Maitra, Santanu Ghosh, Sudhanshu Sekhar Das, Manfred Boltze pp. 8-28
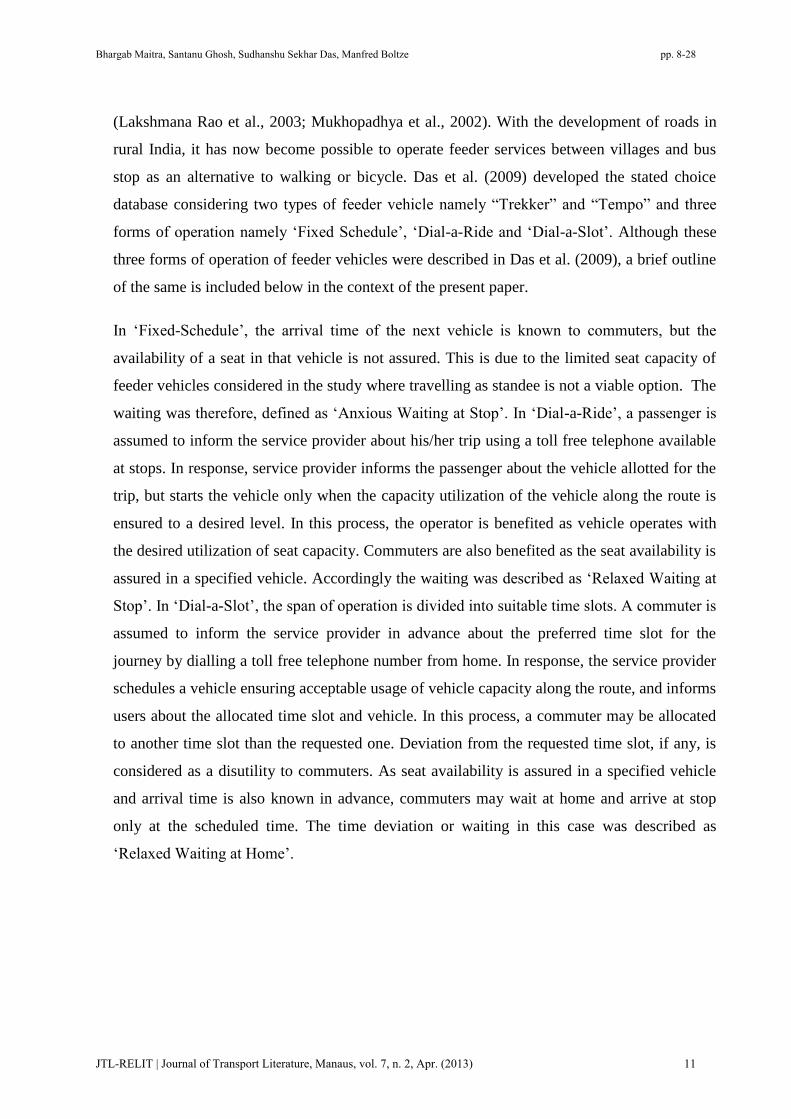
(Lakshmana Rao et al., 2003; Mukhopadhya et al., 2002). With the development of roads in
rural India, it has now become possible to operate feeder services between villages and bus
stop as an alternative to walking or bicycle. Das et al. (2009) developed the stated choice
database considering two types of feeder vehicle namely “Trekker” and “Tempo” and three
forms of operation namely „Fixed Schedule‟, „Dial-a-Ride and „Dial-a-Slot‟. Although these
three forms of operation of feeder vehicles were described in Das et al. (2009), a brief outline
of the same is included below in the context of the present paper.
In „Fixed-Schedule‟, the arrival time of the next vehicle is known to commuters, but the
availability of a seat in that vehicle is not assured. This is due to the limited seat capacity of
feeder vehicles considered in the study where travelling as standee is not a viable option. The
waiting was therefore, defined as „Anxious Waiting at Stop‟. In „Dial-a-Ride‟, a passenger is
assumed to inform the service provider about his/her trip using a toll free telephone available
at stops. In response, service provider informs the passenger about the vehicle allotted for the
trip, but starts the vehicle only when the capacity utilization of the vehicle along the route is
ensured to a desired level. In this process, the operator is benefited as vehicle operates with
the desired utilization of seat capacity. Commuters are also benefited as the seat availability is
assured in a specified vehicle. Accordingly the waiting was described as „Relaxed Waiting at
Stop‟. In „Dial-a-Slot‟, the span of operation is divided into suitable time slots. A commuter is
assumed to inform the service provider in advance about the preferred time slot for the
journey by dialling a toll free telephone number from home. In response, the service provider
schedules a vehicle ensuring acceptable usage of vehicle capacity along the route, and informs
users about the allocated time slot and vehicle. In this process, a commuter may be allocated
to another time slot than the requested one. Deviation from the requested time slot, if any, is
considered as a disutility to commuters. As seat availability is assured in a specified vehicle
and arrival time is also known in advance, commuters may wait at home and arrive at stop
only at the scheduled time. The time deviation or waiting in this case was described as
„Relaxed Waiting at Home‟.
JTL-RELIT | Journal of Transport Literature, Manaus, vol. 7, n. 2, Apr. (2013) 11
Bhargab Maitra, Santanu Ghosh, Sudhanshu Sekhar Das, Manfred Boltze pp. 8-28
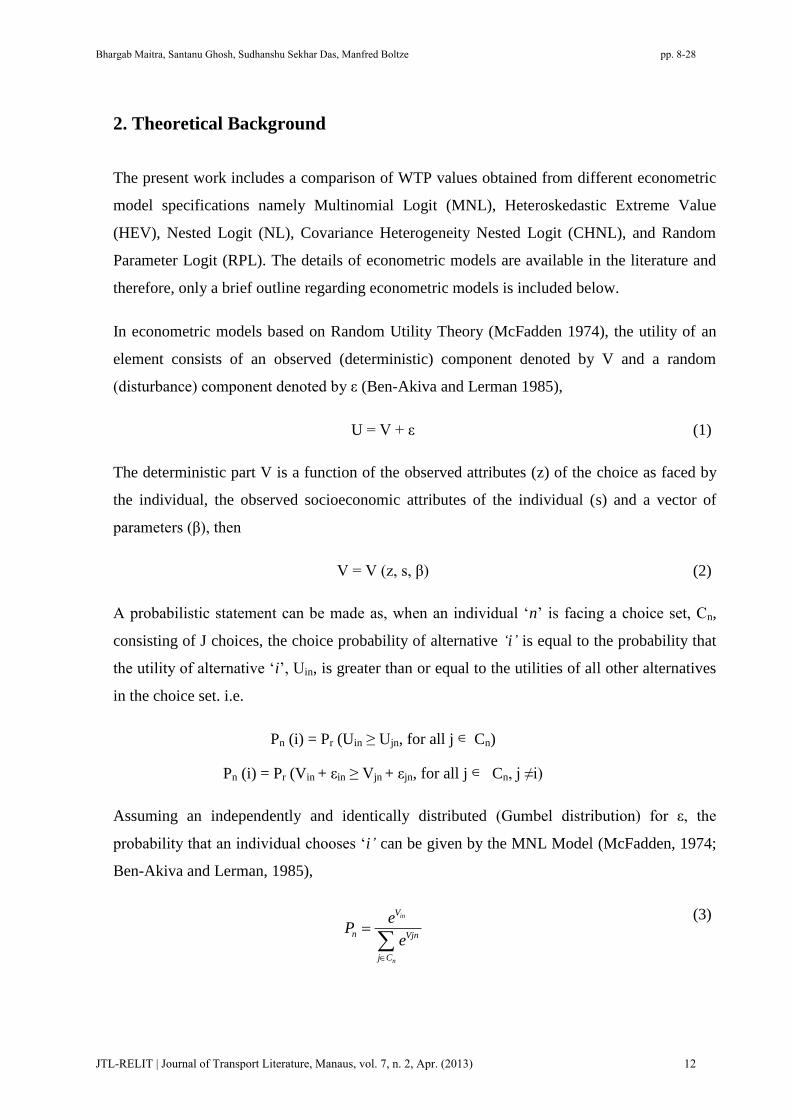
2. Theoretical Background
The present work includes a comparison of WTP values obtained from different econometric
model specifications namely Multinomial Logit (MNL), Heteroskedastic Extreme Value
(HEV), Nested Logit (NL), Covariance Heterogeneity Nested Logit (CHNL), and Random
Parameter Logit (RPL). The details of econometric models are available in the literature and
therefore, only a brief outline regarding econometric models is included below.
In econometric models based on Random Utility Theory (McFadden 1974), the utility of an
element consists of an observed (deterministic) component denoted by V and a random
(disturbance) component denoted by ε (Ben-Akiva and Lerman 1985),
U = V + ε (1)
The deterministic part V is a function of the observed attributes (z) of the choice as faced by
the individual, the observed socioeconomic attributes of the individual (s) and a vector of
parameters (β), then
V = V (z, s, β) (2)
A probabilistic statement can be made as, when an individual „n‟ is facing a choice set, Cn,
consisting of J choices, the choice probability of alternative ‘i’ is equal to the probability that
the utility of alternative „i‟, Uin, is greater than or equal to the utilities of all other alternatives
in the choice set. i.e.
Pn (i) = Pr (Uin ≥ Ujn, for all j Cn)
Pn (i) = Pr (Vin + εin ≥ Vjn + εjn, for all j Cn, j ≠i)
Assuming an independently and identically distributed (Gumbel distribution) for ε, the
probability that an individual chooses „i’ can be given by the MNL Model (McFadden, 1974;
Ben-Akiva and Lerman, 1985),
in
n
V
n Vjn
j C
eP
e
(3)
JTL-RELIT | Journal of Transport Literature, Manaus, vol. 7, n. 2, Apr. (2013) 12
Bhargab Maitra, Santanu Ghosh, Sudhanshu Sekhar Das, Manfred Boltze pp. 8-28
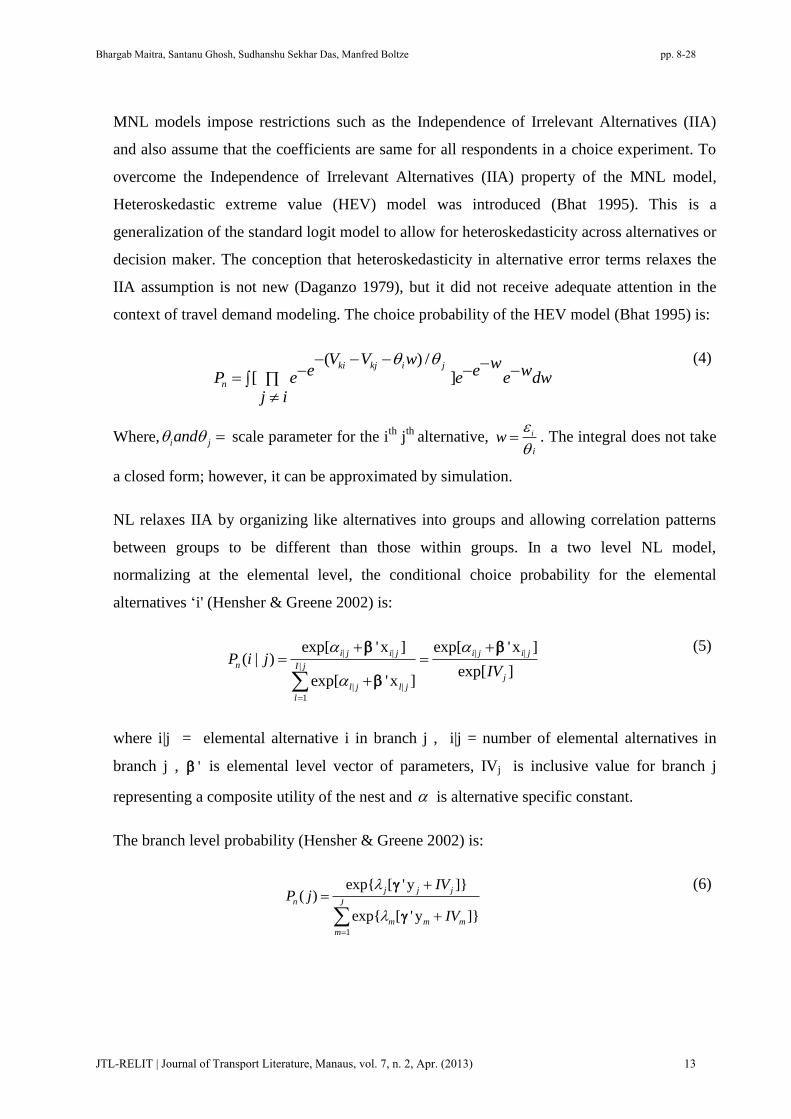
MNL models impose restrictions such as the Independence of Irrelevant Alternatives (IIA)
and also assume that the coefficients are same for all respondents in a choice experiment. To
overcome the Independence of Irrelevant Alternatives (IIA) property of the MNL model,
Heteroskedastic extreme value (HEV) model was introduced (Bhat 1995). This is a
generalization of the standard logit model to allow for heteroskedasticity across alternatives or
decision maker. The conception that heteroskedasticity in alternative error terms relaxes the
IIA assumption is not new (Daganzo 1979), but it did not receive adequate attention in the
context of travel demand modeling. The choice probability of the HEV model (Bhat 1995) is:
( ) /
[ ]ki kj i j
n
V V w we e wP e e e dw
j i
(4)
Where, i jand scale parameter for the ith
jth
alternative, i
i
w
. The integral does not take
a closed form; however, it can be approximated by simulation.
NL relaxes IIA by organizing like alternatives into groups and allowing correlation patterns
between groups to be different than those within groups. In a two level NL model,
normalizing at the elemental level, the conditional choice probability for the elemental
alternatives „i' (Hensher & Greene 2002) is:
| | | |
|
| |
1
exp[ 'x ] exp[ 'x ]( | )
exp[ ]exp[ 'x ]
i j i j i j i j
n I j
jl j l j
l
P i jIV
(5)
where i|j = elemental alternative i in branch j , i|j = number of elemental alternatives in
branch j , ' is elemental level vector of parameters, IVj is inclusive value for branch j
representing a composite utility of the nest and is alternative specific constant.
The branch level probability (Hensher & Greene 2002) is:
1
exp{ [ ' y ]}( )
exp{ [ ' y ]}
j j j
n J
m m m
m
IVP j
IV
(6)
JTL-RELIT | Journal of Transport Literature, Manaus, vol. 7, n. 2, Apr. (2013) 13
Bhargab Maitra, Santanu Ghosh, Sudhanshu Sekhar Das, Manfred Boltze pp. 8-28
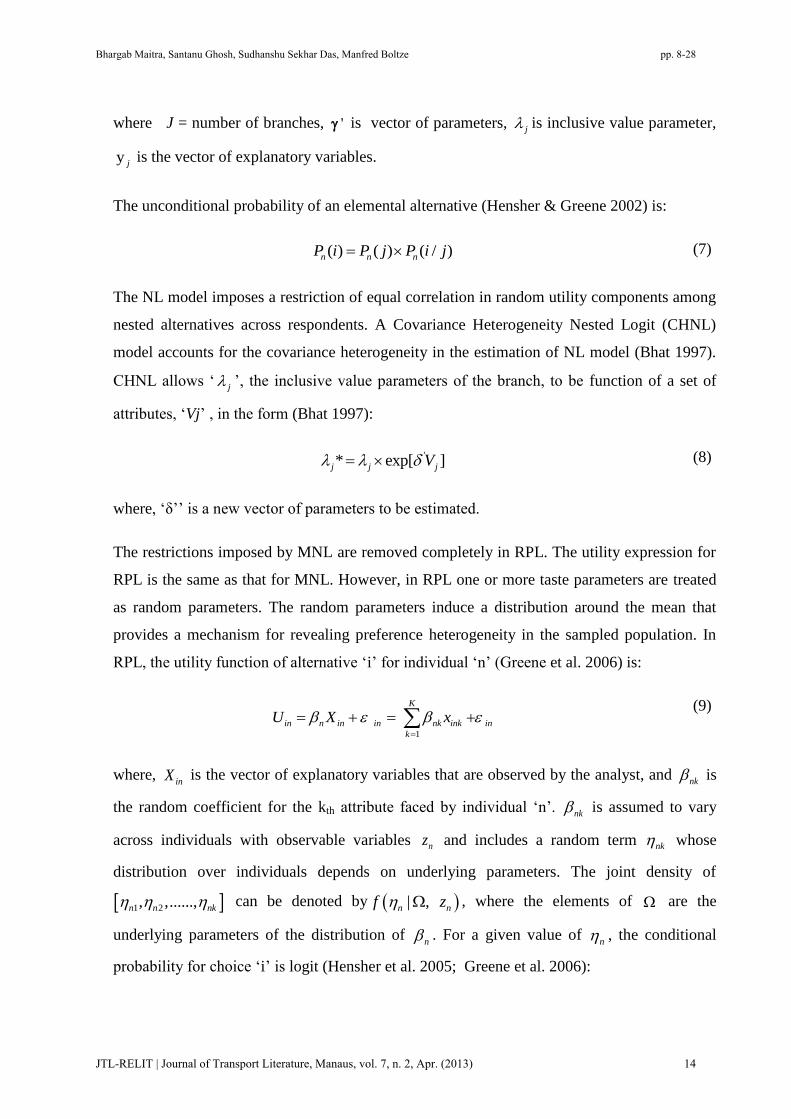
where J = number of branches, ' is vector of parameters, j is inclusive value parameter,
y j is the vector of explanatory variables.
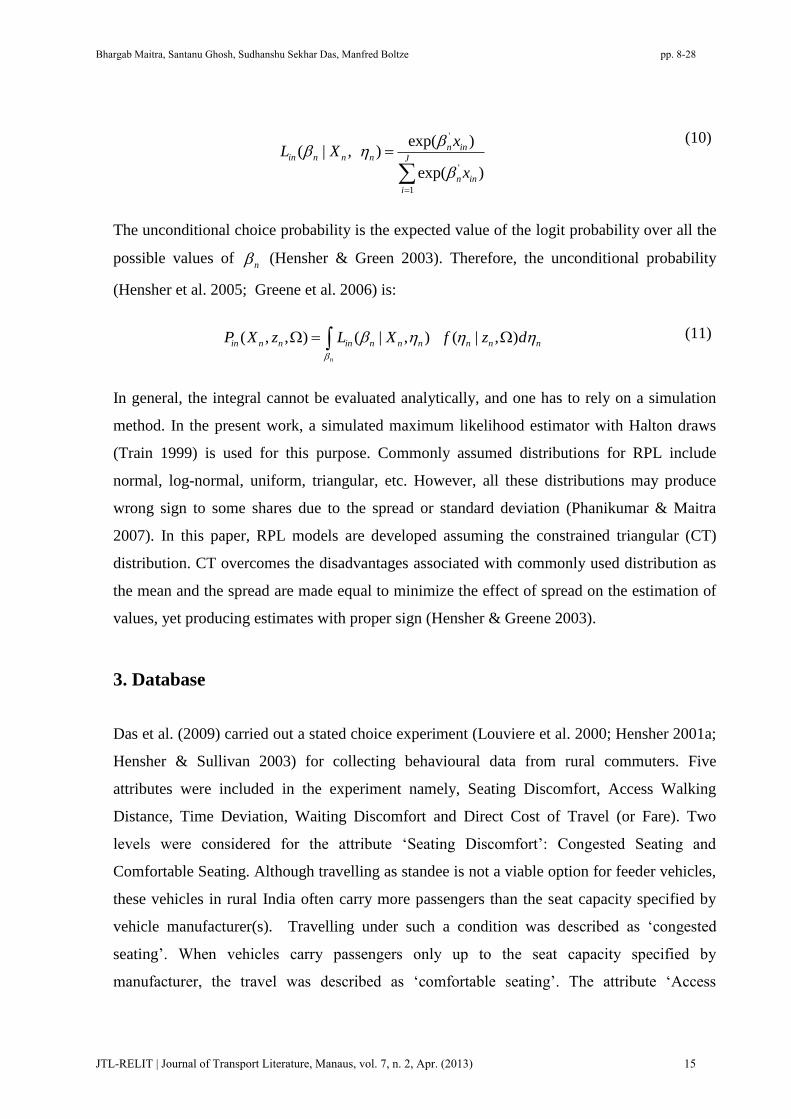
The unconditional probability of an elemental alternative (Hensher & Greene 2002) is:
( ) ( ) ( / )n n nP i P j P i j (7)
The NL model imposes a restriction of equal correlation in random utility components among
nested alternatives across respondents. A Covariance Heterogeneity Nested Logit (CHNL)
model accounts for the covariance heterogeneity in the estimation of NL model (Bhat 1997).
CHNL allows „j ‟, the inclusive value parameters of the branch, to be function of a set of
attributes, „Vj‟ , in the form (Bhat 1997):
'* exp[ ]j j jV
(8)
where, „δ‟‟ is a new vector of parameters to be estimated.
The restrictions imposed by MNL are removed completely in RPL. The utility expression for
RPL is the same as that for MNL. However, in RPL one or more taste parameters are treated
as random parameters. The random parameters induce a distribution around the mean that
provides a mechanism for revealing preference heterogeneity in the sampled population. In
RPL, the utility function of alternative „i‟ for individual „n‟ (Greene et al. 2006) is:
1
K
in n in in nk ink in
k
U X x
(9)
where, inX is the vector of explanatory variables that are observed by the analyst, and
nk is
the random coefficient for the kth attribute faced by individual „n‟. nk is assumed to vary
across individuals with observable variables nz and includes a random term nk whose
distribution over individuals depends on underlying parameters. The joint density of
1 2, ,......,n n nk can be denoted by | ,n nf z , where the elements of are the
underlying parameters of the distribution of n . For a given value of
n , the conditional
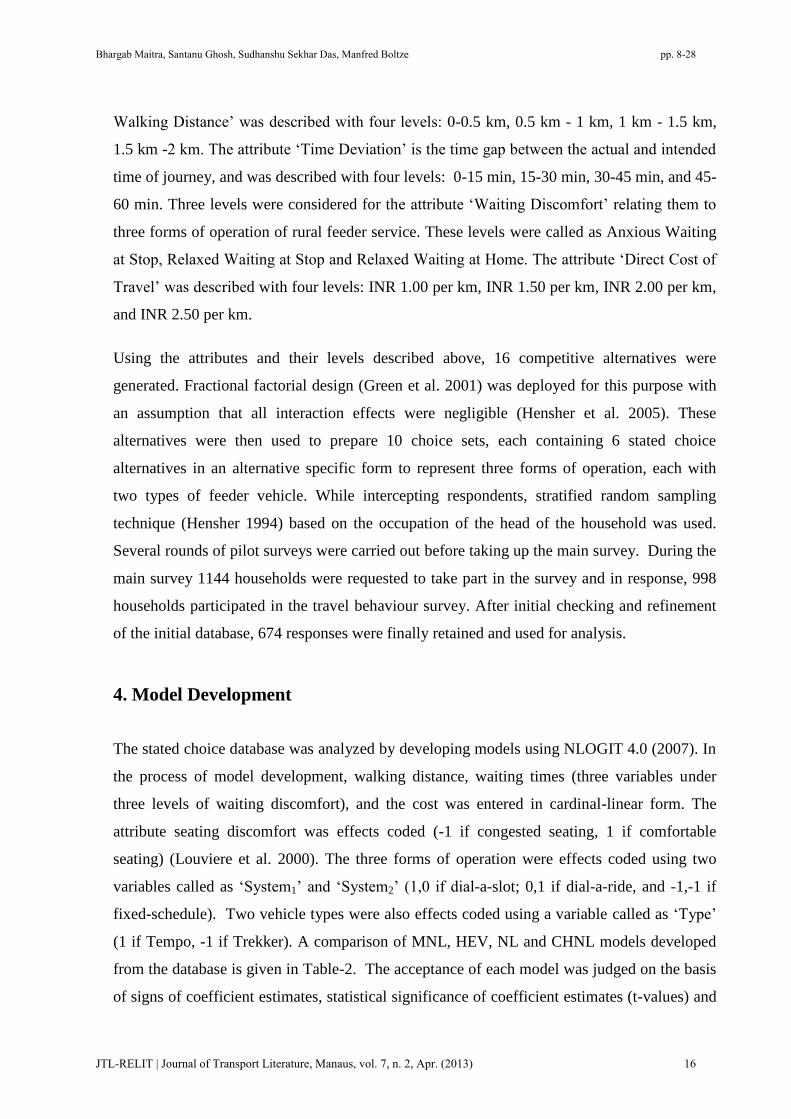
probability for choice „i‟ is logit (Hensher et al. 2005; Greene et al. 2006):
JTL-RELIT | Journal of Transport Literature, Manaus, vol. 7, n. 2, Apr. (2013) 14
Bhargab Maitra, Santanu Ghosh, Sudhanshu Sekhar Das, Manfred Boltze pp. 8-28
'
'
1
exp( )( | , )
exp( )
n inin n n n J
n in
i
xL X
x
(10)
The unconditional choice probability is the expected value of the logit probability over all the
possible values of n (Hensher & Green 2003). Therefore, the unconditional probability
(Hensher et al. 2005; Greene et al. 2006) is:
( , , ) ( | , ) ( | , )
n
in n n in n n n n n nP X z L X f z d
(11)
In general, the integral cannot be evaluated analytically, and one has to rely on a simulation
method. In the present work, a simulated maximum likelihood estimator with Halton draws
(Train 1999) is used for this purpose. Commonly assumed distributions for RPL include
normal, log-normal, uniform, triangular, etc. However, all these distributions may produce
wrong sign to some shares due to the spread or standard deviation (Phanikumar & Maitra
2007). In this paper, RPL models are developed assuming the constrained triangular (CT)
distribution. CT overcomes the disadvantages associated with commonly used distribution as
the mean and the spread are made equal to minimize the effect of spread on the estimation of
values, yet producing estimates with proper sign (Hensher & Greene 2003).
3. Database
Das et al. (2009) carried out a stated choice experiment (Louviere et al. 2000; Hensher 2001a;
Hensher & Sullivan 2003) for collecting behavioural data from rural commuters. Five
attributes were included in the experiment namely, Seating Discomfort, Access Walking
Distance, Time Deviation, Waiting Discomfort and Direct Cost of Travel (or Fare). Two
levels were considered for the attribute „Seating Discomfort‟: Congested Seating and
Comfortable Seating. Although travelling as standee is not a viable option for feeder vehicles,
these vehicles in rural India often carry more passengers than the seat capacity specified by
vehicle manufacturer(s). Travelling under such a condition was described as „congested
seating‟. When vehicles carry passengers only up to the seat capacity specified by
manufacturer, the travel was described as „comfortable seating‟. The attribute „Access
JTL-RELIT | Journal of Transport Literature, Manaus, vol. 7, n. 2, Apr. (2013) 15
Bhargab Maitra, Santanu Ghosh, Sudhanshu Sekhar Das, Manfred Boltze pp. 8-28
Walking Distance‟ was described with four levels: 0-0.5 km, 0.5 km - 1 km, 1 km - 1.5 km,
1.5 km -2 km. The attribute „Time Deviation‟ is the time gap between the actual and intended
time of journey, and was described with four levels: 0-15 min, 15-30 min, 30-45 min, and 45-
60 min. Three levels were considered for the attribute „Waiting Discomfort‟ relating them to
three forms of operation of rural feeder service. These levels were called as Anxious Waiting
at Stop, Relaxed Waiting at Stop and Relaxed Waiting at Home. The attribute „Direct Cost of
Travel‟ was described with four levels: INR 1.00 per km, INR 1.50 per km, INR 2.00 per km,
and INR 2.50 per km.
Using the attributes and their levels described above, 16 competitive alternatives were
generated. Fractional factorial design (Green et al. 2001) was deployed for this purpose with
an assumption that all interaction effects were negligible (Hensher et al. 2005). These
alternatives were then used to prepare 10 choice sets, each containing 6 stated choice
alternatives in an alternative specific form to represent three forms of operation, each with
two types of feeder vehicle. While intercepting respondents, stratified random sampling
technique (Hensher 1994) based on the occupation of the head of the household was used.
Several rounds of pilot surveys were carried out before taking up the main survey. During the
main survey 1144 households were requested to take part in the survey and in response, 998
households participated in the travel behaviour survey. After initial checking and refinement
of the initial database, 674 responses were finally retained and used for analysis.
4. Model Development
The stated choice database was analyzed by developing models using NLOGIT 4.0 (2007). In
the process of model development, walking distance, waiting times (three variables under
three levels of waiting discomfort), and the cost was entered in cardinal-linear form. The
attribute seating discomfort was effects coded (-1 if congested seating, 1 if comfortable
seating) (Louviere et al. 2000). The three forms of operation were effects coded using two
variables called as „System1‟ and „System2‟ (1,0 if dial-a-slot; 0,1 if dial-a-ride, and -1,-1 if
fixed-schedule). Two vehicle types were also effects coded using a variable called as „Type‟
(1 if Tempo, -1 if Trekker). A comparison of MNL, HEV, NL and CHNL models developed
from the database is given in Table-2. The acceptance of each model was judged on the basis
of signs of coefficient estimates, statistical significance of coefficient estimates (t-values) and
JTL-RELIT | Journal of Transport Literature, Manaus, vol. 7, n. 2, Apr. (2013) 16
Bhargab Maitra, Santanu Ghosh, Sudhanshu Sekhar Das, Manfred Boltze pp. 8-28
overall goodness of fit (pseudo R2 or ρ
2). A ρ
2 value in the range of 0.2 to 0.4 is said to be
good model fit (Louviere et al. 2000). The MNL and NL models reported in Table-2 are same
as those reported by Das et al. (2009). It may be noted that variables „System1‟ and „System2‟
were found insignificant during initial model runs and therefore, were omitted in all the
models.
Two HEV models are reported in Table-2, which are called as HEV1 and HEV2. In HEV1, the
convergence was obtained when the scale parameter of fixed schedule alternatives (i.e. Fixed
schedule tempo and Fixed schedule trekker) were restricted to unity. The HEV1 model
included in Table-2 is same as reported by Das et al. (2012) while investigating the issue of
the tree structure in NL models. Monthly household income of travellers in the study area
varied in the range of INR 600 to INR 30000. In HEV2, individual heterogeneity in the
variance of the extreme value distribution was considered with respect to household monthly
income. In the development of HEV2 model, the household monthly income was entered in
cardinal linear form.
The NL model reported in Table-2 included a two level vehicle based tree structure with type
of vehicle at branch (upper) level and system of operation at twig (lower/elemental) level. The
NL model was accepted from the random utility maximization point of view as inclusive
value parameters of branch „Tempo‟ and „Trekker‟ and all variables (except for „type‟)
describing the feeder service were found significant. In NL model estimations, all the
parameters of MNL were included in the utility of the lower level. The variable „type‟ was not
included in the NL model as the coefficient estimate associated with this variable was found
insignificant during the initial model run. Heteroskedasticity in NL model was accounted for
in CHNL model where the household monthly income was found to have a statistically
significant effect. In the CHNL model the household monthly income was taken in the
cardinal linear form.
JTL-RELIT | Journal of Transport Literature, Manaus, vol. 7, n. 2, Apr. (2013) 17
Bhargab Maitra, Santanu Ghosh, Sudhanshu Sekhar Das, Manfred Boltze pp. 8-28
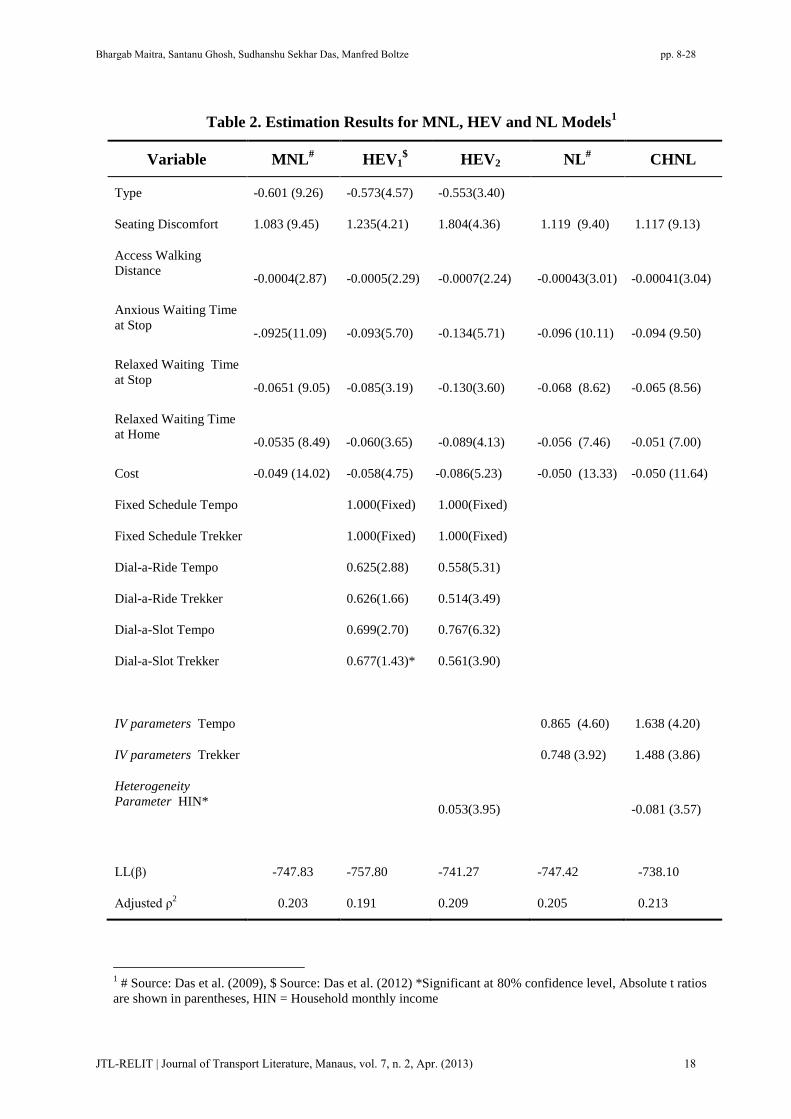
Table 2. Estimation Results for MNL, HEV and NL Models1
Variable MNL# HEV1
$ HEV2 NL
# CHNL
Type -0.601 (9.26) -0.573(4.57) -0.553(3.40)
Seating Discomfort 1.083 (9.45) 1.235(4.21) 1.804(4.36) 1.119 (9.40) 1.117 (9.13)
Access Walking
Distance -0.0004(2.87)
-0.0005(2.29)
-0.0007(2.24)
-0.00043(3.01)
-0.00041(3.04)
Anxious Waiting Time
at Stop -.0925(11.09)
-0.093(5.70)
-0.134(5.71)
-0.096 (10.11)
-0.094 (9.50)
Relaxed Waiting Time
at Stop -0.0651 (9.05)
-0.085(3.19)
-0.130(3.60)
-0.068 (8.62)
-0.065 (8.56)
Relaxed Waiting Time
at Home -0.0535 (8.49)
-0.060(3.65)
-0.089(4.13)
-0.056 (7.46)
-0.051 (7.00)
Cost -0.049 (14.02) -0.058(4.75) -0.086(5.23) -0.050 (13.33) -0.050 (11.64)
Fixed Schedule Tempo 1.000(Fixed) 1.000(Fixed)
Fixed Schedule Trekker 1.000(Fixed) 1.000(Fixed)
Dial-a-Ride Tempo 0.625(2.88) 0.558(5.31)
Dial-a-Ride Trekker 0.626(1.66) 0.514(3.49)
Dial-a-Slot Tempo 0.699(2.70) 0.767(6.32)
Dial-a-Slot Trekker 0.677(1.43)* 0.561(3.90)
IV parameters Tempo 0.865 (4.60) 1.638 (4.20)
IV parameters Trekker 0.748 (3.92) 1.488 (3.86)
Heterogeneity
Parameter HIN*
0.053(3.95)
-0.081 (3.57)
LL(β) -747.83 -757.80 -741.27 -747.42 -738.10
Adjusted ρ2 0.203 0.191 0.209 0.205 0.213
1 # Source: Das et al. (2009), $ Source: Das et al. (2012) *Significant at 80% confidence level, Absolute t ratios
are shown in parentheses, HIN = Household monthly income
JTL-RELIT | Journal of Transport Literature, Manaus, vol. 7, n. 2, Apr. (2013) 18
Bhargab Maitra, Santanu Ghosh, Sudhanshu Sekhar Das, Manfred Boltze pp. 8-28
Three RPL models developed from the stated choice database are reported in Table-3. While
RPL1 considered only random heterogeneity, RPL2 also accounted for deterministic
heterogeneity around the mean of the random parameter(s). RPL3 also accounted for
deterministic heterogeneity both around the mean and variance of random parameter(s)
(RPL3). RPL1 reported in Table-3 is same as reported by Das et al. (2009). RPL models are
developed assuming all attributes other than the cost as random parameters. Ruud (1996)
pointed out that RPL models have a tendency to be unstable when all attributes are allowed to
vary. Fixing the cost parameter resolves this instability. With a fixed cost parameter, the
distribution of other attribute value is same as the parameter of the attributes (Hensher 2001b).
Therefore, in the present work in RPL models, all attributes other than travel cost were
considered as random and assumed to follow constrained triangular distribution (Phanikumar
& Maitra 2007).
The models were estimated with simulated maximum likelihood technique with intelligent
halton draws with 1000 replications. The „mean heterogeneity‟ was investigated with respect
to all relevant socioeconomic attributes. However, only the household income is found to
have a statistically significant decomposition effect on the mean of parameter estimate for
„seating discomfort‟, „access walking distance‟ , „anxious waiting time at stop‟ and „relaxed
waiting time at stop‟. RPL2 was developed considering household monthly income in the
cardinal linear form. RPL3 was developed allowing heterogeneity around the mean and
variance of the random parameter(s). But, variance heterogeneity was found statistically
significant only on „access walking distance‟. In RPL3 also the household monthly income
was taken in the cardinal linear form.
JTL-RELIT | Journal of Transport Literature, Manaus, vol. 7, n. 2, Apr. (2013) 19
Bhargab Maitra, Santanu Ghosh, Sudhanshu Sekhar Das, Manfred Boltze pp. 8-28
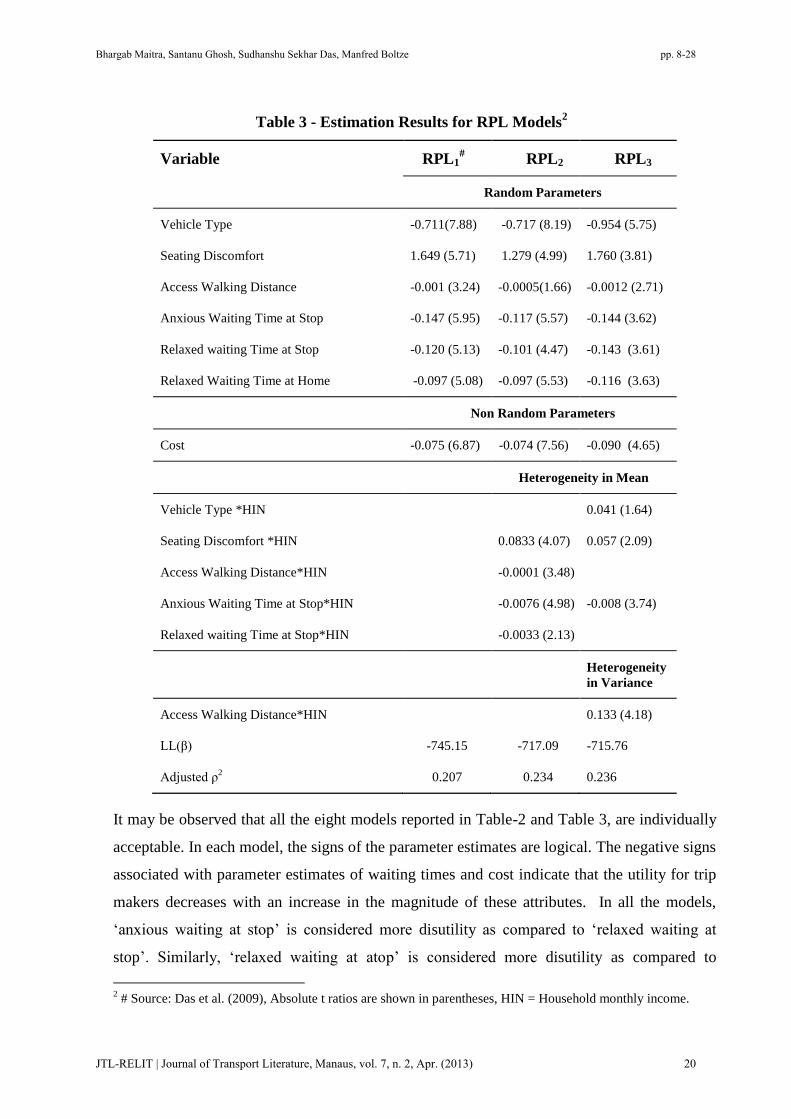
Table 3 - Estimation Results for RPL Models2
Variable RPL1# RPL2 RPL3
Random Parameters
Vehicle Type -0.711(7.88) -0.717 (8.19) -0.954 (5.75)
Seating Discomfort 1.649 (5.71) 1.279 (4.99) 1.760 (3.81)
Access Walking Distance -0.001 (3.24) -0.0005(1.66) -0.0012 (2.71)
Anxious Waiting Time at Stop -0.147 (5.95) -0.117 (5.57) -0.144 (3.62)
Relaxed waiting Time at Stop -0.120 (5.13) -0.101 (4.47) -0.143 (3.61)
Relaxed Waiting Time at Home -0.097 (5.08) -0.097 (5.53) -0.116 (3.63)
Non Random Parameters
Cost -0.075 (6.87) -0.074 (7.56) -0.090 (4.65)
Heterogeneity in Mean
Vehicle Type *HIN 0.041 (1.64)
Seating Discomfort *HIN 0.0833 (4.07) 0.057 (2.09)
Access Walking Distance*HIN -0.0001 (3.48)
Anxious Waiting Time at Stop*HIN -0.0076 (4.98) -0.008 (3.74)
Relaxed waiting Time at Stop*HIN -0.0033 (2.13)
Heterogeneity
in Variance
Access Walking Distance*HIN 0.133 (4.18)
LL(β) -745.15 -717.09 -715.76
Adjusted ρ2 0.207 0.234 0.236
It may be observed that all the eight models reported in Table-2 and Table 3, are individually
acceptable. In each model, the signs of the parameter estimates are logical. The negative signs
associated with parameter estimates of waiting times and cost indicate that the utility for trip
makers decreases with an increase in the magnitude of these attributes. In all the models,
„anxious waiting at stop‟ is considered more disutility as compared to „relaxed waiting at
stop‟. Similarly, „relaxed waiting at atop‟ is considered more disutility as compared to
2 # Source: Das et al. (2009), Absolute t ratios are shown in parentheses, HIN = Household monthly income.
JTL-RELIT | Journal of Transport Literature, Manaus, vol. 7, n. 2, Apr. (2013) 20
Bhargab Maitra, Santanu Ghosh, Sudhanshu Sekhar Das, Manfred Boltze pp. 8-28
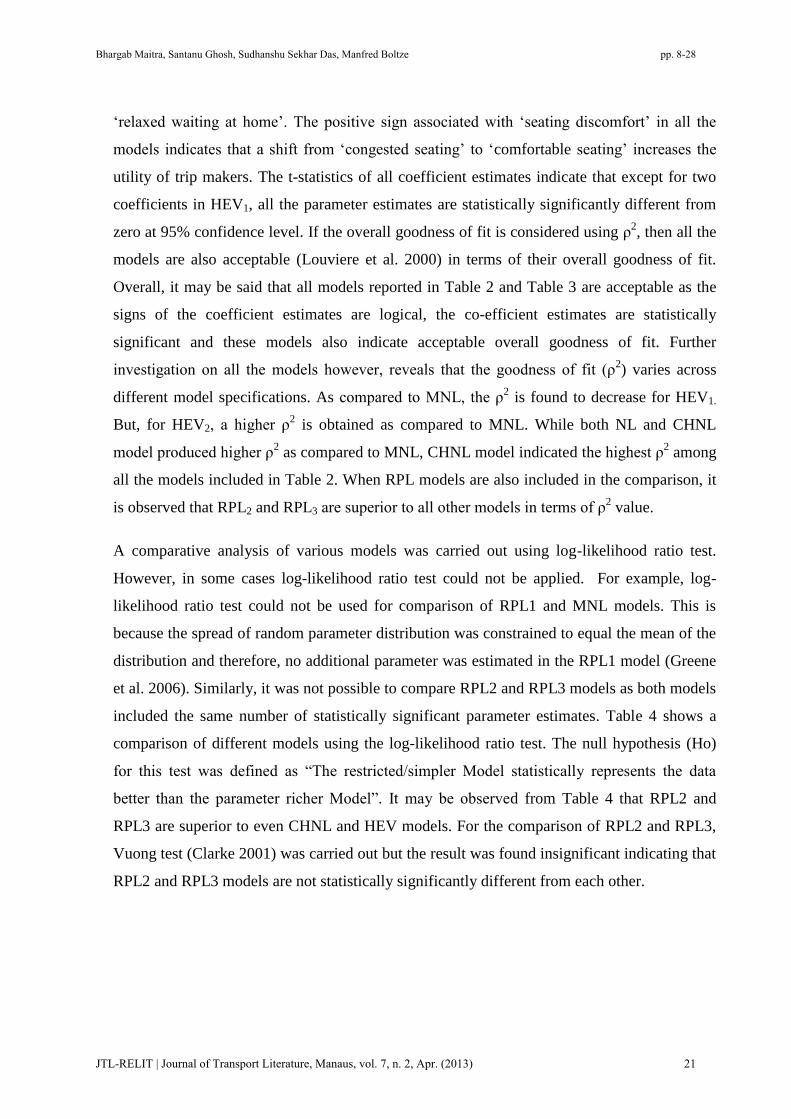
„relaxed waiting at home‟. The positive sign associated with „seating discomfort‟ in all the
models indicates that a shift from „congested seating‟ to „comfortable seating‟ increases the
utility of trip makers. The t-statistics of all coefficient estimates indicate that except for two
coefficients in HEV1, all the parameter estimates are statistically significantly different from
zero at 95% confidence level. If the overall goodness of fit is considered using ρ2, then all the
models are also acceptable (Louviere et al. 2000) in terms of their overall goodness of fit.
Overall, it may be said that all models reported in Table 2 and Table 3 are acceptable as the
signs of the coefficient estimates are logical, the co-efficient estimates are statistically
significant and these models also indicate acceptable overall goodness of fit. Further
investigation on all the models however, reveals that the goodness of fit (ρ2) varies across
different model specifications. As compared to MNL, the ρ2 is found to decrease for HEV1.
But, for HEV2, a higher ρ2 is obtained as compared to MNL. While both NL and CHNL
model produced higher ρ2 as compared to MNL, CHNL model indicated the highest ρ
2 among
all the models included in Table 2. When RPL models are also included in the comparison, it
is observed that RPL2 and RPL3 are superior to all other models in terms of ρ2 value.
A comparative analysis of various models was carried out using log-likelihood ratio test.
However, in some cases log-likelihood ratio test could not be applied. For example, log-
likelihood ratio test could not be used for comparison of RPL1 and MNL models. This is
because the spread of random parameter distribution was constrained to equal the mean of the
distribution and therefore, no additional parameter was estimated in the RPL1 model (Greene
et al. 2006). Similarly, it was not possible to compare RPL2 and RPL3 models as both models
included the same number of statistically significant parameter estimates. Table 4 shows a
comparison of different models using the log-likelihood ratio test. The null hypothesis (Ho)
for this test was defined as “The restricted/simpler Model statistically represents the data
better than the parameter richer Model”. It may be observed from Table 4 that RPL2 and
RPL3 are superior to even CHNL and HEV models. For the comparison of RPL2 and RPL3,
Vuong test (Clarke 2001) was carried out but the result was found insignificant indicating that
RPL2 and RPL3 models are not statistically significantly different from each other.
JTL-RELIT | Journal of Transport Literature, Manaus, vol. 7, n. 2, Apr. (2013) 21
Bhargab Maitra, Santanu Ghosh, Sudhanshu Sekhar Das, Manfred Boltze pp. 8-28
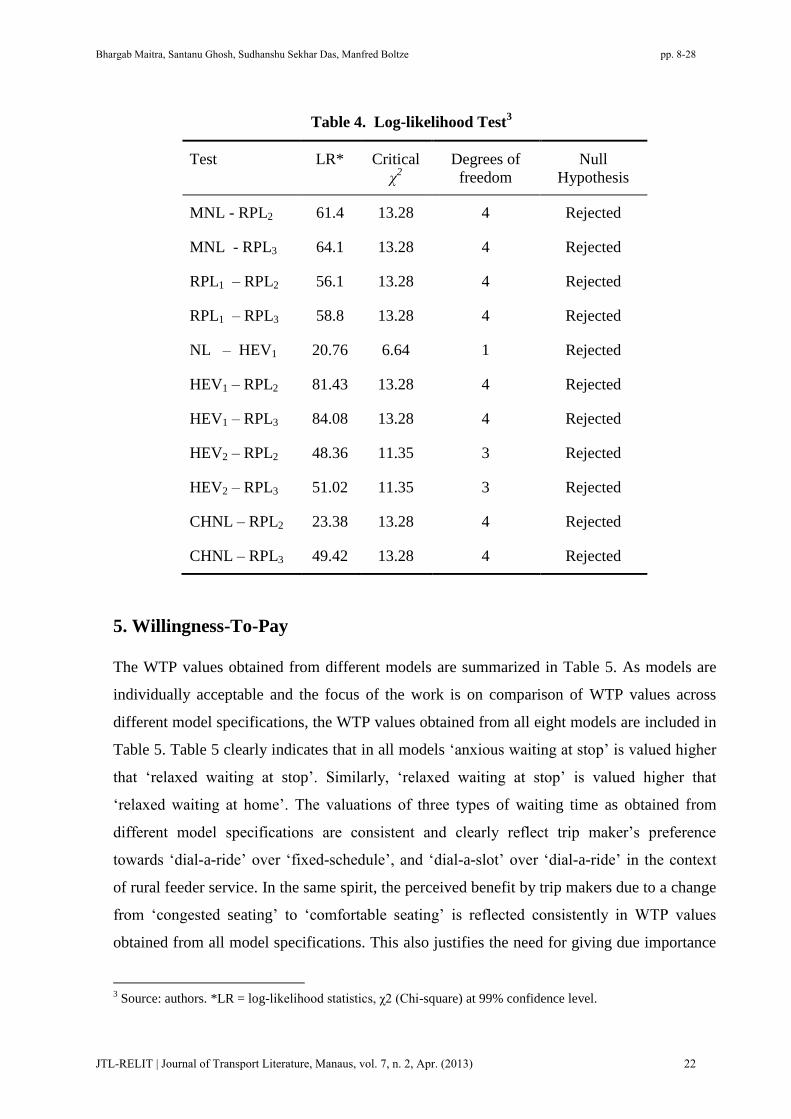
Table 4. Log-likelihood Test3
Test LR* Critical
χ2
Degrees of
freedom
Null
Hypothesis
MNL - RPL2 61.4 13.28 4 Rejected
MNL - RPL3 64.1 13.28 4 Rejected
RPL1 – RPL2 56.1 13.28 4 Rejected
RPL1 – RPL3 58.8 13.28 4 Rejected
NL – HEV1 20.76 6.64 1 Rejected
HEV1 – RPL2 81.43 13.28 4 Rejected
HEV1 – RPL3 84.08 13.28 4 Rejected
HEV2 – RPL2 48.36 11.35 3 Rejected
HEV2 – RPL3 51.02 11.35 3 Rejected
CHNL – RPL2 23.38 13.28 4 Rejected
CHNL – RPL3 49.42 13.28 4 Rejected
5. Willingness-To-Pay
The WTP values obtained from different models are summarized in Table 5. As models are
individually acceptable and the focus of the work is on comparison of WTP values across
different model specifications, the WTP values obtained from all eight models are included in
Table 5. Table 5 clearly indicates that in all models „anxious waiting at stop‟ is valued higher
that „relaxed waiting at stop‟. Similarly, „relaxed waiting at stop‟ is valued higher that
„relaxed waiting at home‟. The valuations of three types of waiting time as obtained from
different model specifications are consistent and clearly reflect trip maker‟s preference
towards „dial-a-ride‟ over „fixed-schedule‟, and „dial-a-slot‟ over „dial-a-ride‟ in the context
of rural feeder service. In the same spirit, the perceived benefit by trip makers due to a change
from „congested seating‟ to „comfortable seating‟ is reflected consistently in WTP values
obtained from all model specifications. This also justifies the need for giving due importance
3 Source: authors. *LR = log-likelihood statistics, χ2 (Chi-square) at 99% confidence level.
JTL-RELIT | Journal of Transport Literature, Manaus, vol. 7, n. 2, Apr. (2013) 22
Bhargab Maitra, Santanu Ghosh, Sudhanshu Sekhar Das, Manfred Boltze pp. 8-28
to the qualitative aspects of travel (like discomfort) in the planning of rural feeder service. It
may be mentioned that qualitative aspects are often ignored in improvement planning of
transportation services in developing countries, especially in rural areas.
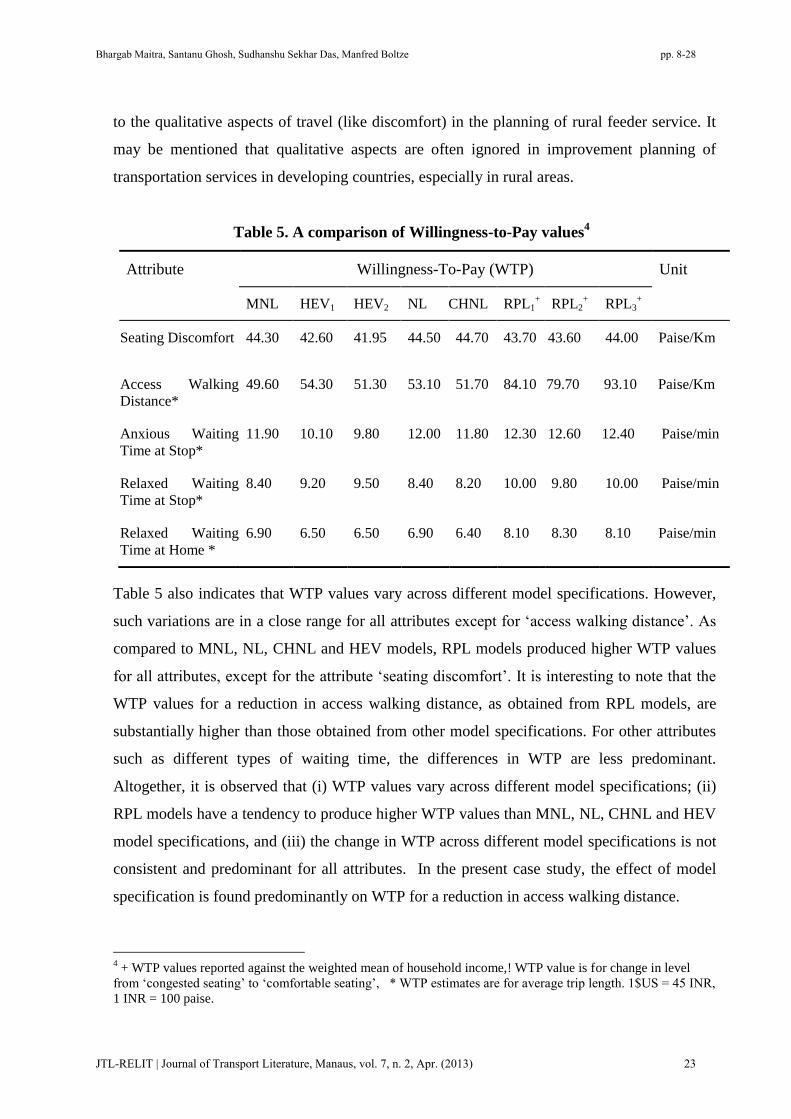
Table 5. A comparison of Willingness-to-Pay values4
Attribute Willingness-To-Pay (WTP) Unit
MNL HEV1 HEV2 NL CHNL RPL1+ RPL2
+ RPL3
+
Seating Discomfort
44.30 42.60 41.95 44.50 44.70 43.70 43.60 44.00 Paise/Km
Access Walking
Distance*
49.60 54.30 51.30 53.10 51.70 84.10 79.70 93.10 Paise/Km
Anxious Waiting
Time at Stop*
11.90 10.10 9.80 12.00 11.80 12.30 12.60 12.40 Paise/min
Relaxed Waiting
Time at Stop*
8.40 9.20 9.50 8.40 8.20 10.00 9.80 10.00 Paise/min
Relaxed Waiting
Time at Home *
6.90 6.50 6.50 6.90 6.40 8.10 8.30 8.10 Paise/min
Table 5 also indicates that WTP values vary across different model specifications. However,
such variations are in a close range for all attributes except for „access walking distance‟. As
compared to MNL, NL, CHNL and HEV models, RPL models produced higher WTP values
for all attributes, except for the attribute „seating discomfort‟. It is interesting to note that the
WTP values for a reduction in access walking distance, as obtained from RPL models, are
substantially higher than those obtained from other model specifications. For other attributes
such as different types of waiting time, the differences in WTP are less predominant.
Altogether, it is observed that (i) WTP values vary across different model specifications; (ii)
RPL models have a tendency to produce higher WTP values than MNL, NL, CHNL and HEV
model specifications, and (iii) the change in WTP across different model specifications is not
consistent and predominant for all attributes. In the present case study, the effect of model
specification is found predominantly on WTP for a reduction in access walking distance.
4 + WTP values reported against the weighted mean of household income,! WTP value is for change in level
from „congested seating‟ to „comfortable seating‟, * WTP estimates are for average trip length. 1$US = 45 INR,
1 INR = 100 paise.
JTL-RELIT | Journal of Transport Literature, Manaus, vol. 7, n. 2, Apr. (2013) 23
Bhargab Maitra, Santanu Ghosh, Sudhanshu Sekhar Das, Manfred Boltze pp. 8-28
It is understood that there may be some unobserved effects (Hensher 2001b) a trip maker
considers and correlates with travel attributes. Also, in RPL models, such unobserved effects
are generally more correlated with attribute(s) other than the travel cost and accordingly,
higher WTP values may be obtained from RPL models (Hensher 2001b; Phanikumar &
Maitra 2007). Das et al. (2009) also indicated that unobserved effects may not be correlated
evenly with all non-cost attributes. The observations made in the present work in the context
of WTP values obtained from RPL and other model specifications are in agreement with
observations made by other researchers. Unobserved effects are found to correlate more with
access walking distance than other non-cost attributes and accordingly, the WTP value of a
reduction in access walking distance is found significantly higher in all the RPL models.
The above mentioned observations and discussions indicate the importance of model
specification in WTP studies. As WTP values cannot be validated, it should not be used as a
basis for selection of model specification. Rather, it's the rationality of model development
and the goodness-of-fit statistics which should guide the selection of model for the calculation
of WTP values. Less restrictive RPL models (say, RPL2 and RPL3) reveal more behavioral
information including random and deterministic heterogeneity of the underlying data set. Log-
likelihood ratio tests also indicate that among all the models, RPL2 and RPL3 are superior to
other models. It is also found that other model specifications may underestimate WTP values
in comparison to RPL model specifications. The RPL models accounting for both
deterministic and random heterogeneity (i.e. RPL2 and RPL3) are found superior in the RPL
model accounting for only random heterogeneity (i.e. RPL1). A comparison of different
models also indicates that parameter richer models are generally superior to restricted/simpler
models. Therefore, it is desirable to investigate the decomposition effect of socioeconomic or
trip characteristics on parameter estimates in RPL model. Also, if a model is obtained with the
statistically significant decomposition effect then it is also likely to be superior to the RPL
model accounting for only random heterogeneity. However, accounting for both mean and
variance heterogeneity (RPL3) instead of only mean heterogeneity (RPL2), failed to produce a
statistically significant superior model.
JTL-RELIT | Journal of Transport Literature, Manaus, vol. 7, n. 2, Apr. (2013) 24
Bhargab Maitra, Santanu Ghosh, Sudhanshu Sekhar Das, Manfred Boltze pp. 8-28
Conclusion
A comparison of various econometric models and WTP values has been carried out with
reference to a case study of rural feeder service to bus stop. Econometric models included
Multinomial Logit (MNL), Heteroskedastic Extreme Value (HEV), Nested Logit (NL),
Covariance Heterogeneity Nested Logit (CHNL), and Random Parameter Logit (RPL).
Various econometric models are found to be consistent and acceptable in terms of signs of
coefficient estimates, statistical significance of coefficient estimates and overall goodness of
fit. The models and WTP values consistently reflected users‟ preferences towards demand
responsive forms of operation (i.e. dial-a-ride and dial-a-slot) over the conventional fixed-
schedule form of operation of feeder vehicles, and the need for giving due importance to the
qualitative aspects of travel (such as discomfort) in the planning of rural feeder service.
WTP values were found to vary across different model specifications. However, the variations
were not consistent and predominant for all attributes. RPL models indicated a tendency of
producing higher WTP values as in RPL models unobserved effects are generally more
correlated with attribute(s) other than the travel cost. The work also confirmed that
unobserved effects might not be correlated evenly with all non-cost attributes in RPL models.
In the present case study, such unobserved effects are found to be correlated more with access
walking distance as compared to other non-cost attributes. Accordingly, the WTP value for a
reduction in access walking distance is found substantially higher in all RPL models.
The work indicates that the rationality of model development and the goodness-of-fit statistics
are the two key aspects in the context of WTP studies. RPL models not only reveal more
behavioral information including deterministic and random heterogeneity of the underlying
data set, but the Log-likelihood ratio tests also indicate that RPL models accounting for
deterministic and random heterogeneity are superior to other models included in the present
work. Also, parameter richer models are found superior to other models. The work
encourages accounting for deterministic heterogeneity (i.e. decomposition effect of
socioeconomic or trip characteristics on parameter estimates) in RPL models because such
models are likely to be superior to RPL models accounting for only random heterogeneity.
However, accounting for both mean and variance heterogeneity (RPL3) instead of only mean
heterogeneity (RPL2), failed to produce a statistically significant superior model in the present
case study.
JTL-RELIT | Journal of Transport Literature, Manaus, vol. 7, n. 2, Apr. (2013) 25
Bhargab Maitra, Santanu Ghosh, Sudhanshu Sekhar Das, Manfred Boltze pp. 8-28
Acknowledgements
The work presented in this paper is carried out with support from Deutscher Akademischer Austausch
Dienst (DAAD) and Alexander von Humboldt Stiftung. The authors express their sincere thanks to
Deutscher Akademischer Austausch Dienst (DAAD) and Alexander von Humboldt Stiftung for their
support towards international exchange and research.
References
Alpizar, F. and Carlsson, F. (2003) Policy implications and analysis of the determinants of travel mode
choice: an application of choice experiments to metropolitan Costa Rica. Environment and
Development Economics, vol. 8, pp. 603-619.
Ben-Akiva, M., and Lerman, S. R. (1985) Discrete choice analysis: theory and applications to travel
demand. Cambridge: MIT Press.
Bhat, C. R. (1995) A heteroscedastic extreme value model of intercity travel mode choice.
Transportation Research B, vol. 29, n. 6, pp. 471-483.
Bhat, C. R. (1997) Covariance heterogeneity in nested logit models: econometric structure and
application to intercity travel. Transportation Research B, vol. 31, n. 1, pp. 11-21.
Bhat, C. R. (1998a) Analysis of travel mode and departure time choice for urban shopping trips.
Transportation Research B, vol. 32, n. 6, pp. 361-371.
Bhat, C. R. (1998b) Accommodating variations in responsiveness to level-of-service measures in
travel mode choice modeling. Transportation Research A, vol. 32, n. 7, pp. 495-507.
Carlsson, F. (2003) The demand for intercity public transport: the case of business passengers. Applied
Economics, vol. 35, n. 1, pp. 41-50.
Chang, J. B., Moon, W. and Balasubramanian, S. K. (2012) Consumer valuation of health attributes
for soy-based food: a choice modeling approach. Food Policy, vol. 37, Issue 3, pp. 335-342.
Chattopadhyay, C. (2000) The effectiveness of McFaddens‟s nested logit model in valuing amenity
improvement. Regional Science and Urban Economics, vol. 30, n. 1, pp. 23-43.
Choi, A. S., Ritchie, B. W., Papandrea, F. and Bennett, J. (2010) Economic valuation of cultural
heritage sites: a choice modeling approach. Tourism Management, vol. 31, n. 2, pp. 213-220.
Clarke, K. A. (2001) Testing nonnested models of international relations: reevaluating realism.
American Journal of Political Science, vol. 45, n. 3, pp. 724-744.
Daganzo, C. (1979) Multinomial probit: the theory and its application to demand forecasting. New
York: Academic Press.
Das, S. S., and Maitra, B. (2007) A covariance heterogeneity nested logit model for choice of rural
feeder service to bus stop. Indian Highways, IRC, vol. 35, n. 12, pp. 31-37.
Das, S. S., Maitra, B. and Boltze, M. (2009) Valuing travel attributes of rural feeder service to bus
stop: a comparison of different logit model specifications. Journal of Transportation
Engineering, vol. 135, n. 6, pp. 330-337.
Das, S. S., Ghosh, S., Maitra, B. and Boltze, M. (2012) Search strategy for nested logit tree structure:
rural feeder service to bus stop: a case study. Working paper IIT Kharagpur.
JTL-RELIT | Journal of Transport Literature, Manaus, vol. 7, n. 2, Apr. (2013) 26
Bhargab Maitra, Santanu Ghosh, Sudhanshu Sekhar Das, Manfred Boltze pp. 8-28
Green, P. E., Krieger, A. M., and Wind, Y. (2001) Thirty years of conjoint analysis: reflections and
prospects. Interfaces, vol. 31, n. 3, pp. S56-S73.
Greene, W.H., Hensher, D.A. and Rose, J. (2006) Accounting for heterogeneity in the variance of
unobserved effects in mixed logit models. Transportation Research Part B, vol. 40, n. 1, pp. 75-
92.
Hensher, D.A. (1994) Stated preference analysis of travel choices: the state of practice.
Transportation, vol. 21, n. 2, pp. 107-133.
Hensher, D. A. (2001a) The valuation of commuter travel time savings for car drivers in New Zealand:
evaluating alternative model specifications. Transportation, vol. 28, n. 2, pp. 101-118.
Hensher, D. A. (2001b) Measurement of the valuation of travel time savings. Journal of Transport
Economics and Policy, vol. 35, n. 1, pp. 71- 98.
Hensher, D. A. (2006) Reducing sign violation for VTTS distributions through recognition of an
individual‟s attribute processing strategy. Working Paper ITLS-WP-06-13. Institute of Transport
and Logistics Studies, University of Sydney.
Hensher, D. A., and Greene, W. H. (2002) Specification and estimation of the Nested Logit model
alternative normalization. Transportation Research Part B, vol. 36, n. 1, pp. 1 - 17.
Hensher, D.A., and Greene, W.H., (2003) Mixed logit models: state of practice. Transportation, vol.
30, n. 2, pp. 133-176.
Hensher, D. A., and Sullivan, C. (2003) Willingness to pay for road curviness and road type.
Transportation Research D, vol. 8, n. 2, pp. 139-155.
Hensher, D. A., Rose, J., and Greene, W. H. (2005) Applied choice analysis: a primer. Cambridge
University Press.
Hess S., Bierlaire. M., and Polak, J. W. (2005) Estimation of value of travel-time saving using mixed
logit models. Transportation Research Part A, vol. 39, n. 2-3, pp. 221-236.
Hidrue, M. K., Parsons, G. R., Kempton, W, and Gardner, M. P. (2011) Willingness to pay for electric
vehicles and their attributes. Resource and Energy Economics, vol. 33, n. 3, pp. 686-705
Jovicic, G., Hansen, C. O., (2003) A passenger travel demand model for Copenhagen. Transportation
Research A, vol. 37, n. 4, pp. 333-349.
Kawata, Y. and Watanabe, M. (2012), Valuing the mortality risk of wildlife reintroduction:
Heterogeneous risk preferences. Ecological Economics, vol. 76, pp. 79-86.
Koppelman, S. F. and Sethi, V. (2005) Incorporating variance and covariance heterogeneity in the
Generalized Nested Logit model: an application to modeling long distance travel choice
behavior. Transportation Research Part B, vol. 39, n. 9, pp. 825-853.
Lakshmana Rao, K.M., Jayasree, K., (2003) Rural infrastructure planning with emphasis on road
network connectivity by coplanar concurrent theory. Proc. Map India Conference.
Louviere, J. J., Hensher, D. A., and Swait. D. J. (2000) Stated choice methods. Analysis and
applications. Cambridge University Press, Cambridge, Mass.
Mallawaarachchi, T., Blamey R. K., Morrison, M. D., Johnson, A. K. L. and Bennett, J. W. (2001)
Community values for environmental protection in a cane farming catchment in Northern
Australia: a choice modeling study. Journal of Environmental Management, vol. 62, n. 3, pp.
301-316.
McFadden, D. (1974) Conditional logit analysis of qualitative choice behavior. In: Zarembka, P. (ed.)
Frontiers in econometrics. New York: Academic Press.
JTL-RELIT | Journal of Transport Literature, Manaus, vol. 7, n. 2, Apr. (2013) 27
Bhargab Maitra, Santanu Ghosh, Sudhanshu Sekhar Das, Manfred Boltze pp. 8-28
Mukhopadhyay, D., Sikdar, P. K., (2002) Strategic planning and programming of rural road network
using HDM-4. Proc. Conference on Advances on Civil Engineering, I. I. T. Kharagpur,
Kharagpur India.
Munizaga, M. A., Heydecker, B. G. and Ortuzar, J. D. (2000) Representation of heteroskedasticity in
discrete choice models. Transportation Research Part B, vol. 34, n. 3, pp. 219-240.
NLOGIT 4.0 (2007) Reference Guide, Econometrics Software, Inc.
Phanikumar, C. V. and Maitra, B. (2007) Willingness to pay and preference heterogeneity for rural bus
attributes. Journal of Transportation Engineering, vol. 133, n. 1, pp. 62-69.
Revelt, D. and Train, K. (1998) Mixed logit with repeated choices: households choices of appliance
efficiency level. Review of Economics and Statistics, vol. 80, n. 4, pp. 647-657.
Ruud, P. (1996). Approximation and simulation of the multinomial probit model: an analysis of
covariance matrix estimation. Working Paper, Department of Economics, University of
California, Berkeley.
Train, K. (1998) Recreation demand models with taste differences over people. Land Economics, vol.
74, n. 2, pp. 230-239.
Train, K. (1999) Halton sequences for mixed logit. Working Paper, Department of Economics,
University of California, Berkeley.
Ubillos, J. B., A. Ferna´ndez Sainz, A. (2004) The influence of quality and price on the demand for
urban transport: The Case of University Students. Transportation Research Part A, vol. 38, n. 8,
pp. 607-614.
JTL-RELIT | Journal of Transport Literature, Manaus, vol. 7, n. 2, Apr. (2013) 28
Bhargab Maitra, Santanu Ghosh, Sudhanshu Sekhar Das, Manfred Boltze pp. 8-28