JSE 281 online FINAL - Crop circle · crop circle “believers,” who could fi nally reference a...
17
Journal of Scientific Exploration, Vol. 28, No. 1, pp. 17–33, 2014 0892-3310/14 RESEARCH ARTICLE An Experimental Study for Reproduction of Biological Anomalies Reported in the Hoeven 1999 Crop Circle ELTJO H. HASELHOFF [email protected] ROBERT J. BOERMAN JAN-WILLEM BOBBINK Dutch Centre for Crop Circle Studies Submitted 9/9/2013, Accepted 2/21/2014 Abstract—This paper revisits the controversial case of a “crop circle,” a circular imprint of flattened crop, which appeared in the summer of 1999 in The Netherlands in the presence of an alleged eyewitness. Sampling of plant stems at various locations in the circle revealed a strong lengthening of the growth nodes, with a symmetrical distribution that was aligned with the flattened area itself. This effect has been attributed by some researchers to the effect of electromagnetic energy. In the case of this particular crop circle, the symmetry was indeed identical to the energy distribution of a spherical radiation source, which supported the claim of the eyewitness that a “ball of light” was hovering above the field at the time the crop circle was formed. However, others have suggested the results were simply the effect of sunlight, shadows, or wind over the flattened area, or some simple natural effect related to the fact that the crop in the circle had been flattened. The authors created a man-made control circle and repeated the growth node measurements that were carried out in the original 1999 crop circle using an identical test protocol. It was concluded that the findings in the 1999 circle could not be reproduced and hence remain anomalous. Keywords: crop circles—gravitropism—BOL model—pulvini—auxins Introduction Crop circles are patterns in fields created by the flattening of crops or other forms of vegetation. Their dimensions range from less than a meter to several hundreds of meters, and their designs vary from simple circular imprints to complex geometrical patterns. The number of documented cases of crop circles have increased substantially since the 1970s, whereas their origin remains subject to much controversy. Explanations include the work
Transcript of JSE 281 online FINAL - Crop circle · crop circle “believers,” who could fi nally reference a...

Journal of Scientifi c Exploration, Vol. 28, No. 1, pp. 17–33, 2014 0892-3310/14
RESEARCH ARTICLE
An Experimental Study for Reproduction of Biological
Anomalies Reported in the Hoeven 1999 Crop Circle
ELTJO H. HASELHOFF [email protected]
ROBERT J. BOERMAN
JAN-WILLEM BOBBINK
Dutch Centre for Crop Circle Studies
Submitted 9/9/2013, Accepted 2/21/2014
Abstract—This paper revisits the controversial case of a “crop circle,” a circular imprint of fl attened crop, which appeared in the summer of 1999 in The Netherlands in the presence of an alleged eyewitness. Sampling of plant stems at various locations in the circle revealed a strong lengthening of the growth nodes, with a symmetrical distribution that was aligned with the fl attened area itself. This eff ect has been attributed by some researchers to the eff ect of electromagnetic energy. In the case of this particular crop circle, the symmetry was indeed identical to the energy distribution of a spherical radiation source, which supported the claim of the eyewitness that a “ball of light” was hovering above the fi eld at the time the crop circle was formed. However, others have suggested the results were simply the eff ect of sunlight, shadows, or wind over the fl attened area, or some simple natural eff ect related to the fact that the crop in the circle had been fl attened. The authors created a man-made control circle and repeated the growth node measurements that were carried out in the original 1999 crop circle using an identical test protocol. It was concluded that the fi ndings in the 1999 circle could not be reproduced and hence remain anomalous.
Keywords: crop circles—gravitropism—BOL model—pulvini—auxins
Introduction
Crop circles are patterns in fi elds created by the fl attening of crops or other forms of vegetation. Their dimensions range from less than a meter to several hundreds of meters, and their designs vary from simple circular imprints to complex geometrical patterns. The number of documented cases of crop circles have increased substantially since the 1970s, whereas their origin remains subject to much controversy. Explanations include the work

18 Eltjo H. Haselhoff, Robert J. Boerman, and Jan-Willem Bobbink
of human pranksters, a natural phenomenon, and the work of an unknown intelligence.
In the summer of 1999, Dutchman Robbert van den Broeke reported that he saw a luminescent sphere hovering above a farm fi eld while a crop circle was apparently forming underneath (Haselhoff 2001a, 1999; http://www.robbertvandenbroeke.com). This happened in the village of Hoeven, The Netherlands, and since then the Hoeven 1999 circle has become a famous and controversial case in crop circle history. It is famous because biophysical studies of plants sampled from the circle, performed independently by researchers Eltjo Haselhoff and William Levengood, revealed biological anomalies (Haselhoff 1999, Levengood 2001). These anomalies varied over the circle’s area, with a symmetry similar to the radiation intensity distribution of an electromagnetic point source. These fi ndings enticed crop circle “believers,” who could fi nally reference a scientifi c argument that “crop circles were made by balls of light,” and infuriated crop circle skeptics, who stated that the research methods applied by Haselhoff and Levengood were fl awed and that their fi ndings had natural explanations. The controversy ignited because Robert van den Broeke’s reputation as a self-acclaimed paranormal medium was severely damaged six years later after accusations of fraud during his appearance on several Dutch television shows (http://en.wikipedia.org/wiki/Stichting_Skepsis). The result was a plethora of heated arguments and articles on the Internet, in magazines, and in the scientifi c literature. However, despite all the energy spent by many to re-interpret the work of Levengood and Haselhoff, little or no effort was put into the creation of new, original data. This article revisits the Hoeven 1999 formation and presents new experimental results in an attempt to fi nd natural explanations for the alleged anomalous fi ndings.
Node Length Increase
One morphological anomaly in cereal-type plants taken from crop circles is an abnormal increase of pulvini (growth nodes). This phenomenon, fi rst observed in 1990 by American biophysicist William Levengood, can be easily observed and measured and is the most consistent and best-documented anomaly related to crop circles (Levengood 1994). An example of node lengthening is shown in Figure 1. The phenomenon can be easily quantifi ed by comparing the (average) node length in any area of interest inside a crop circle with the node length of control samples taken from various locations in the undisturbed standing crop and far away from the circle. An increased node length can sometimes be explained as a natural effect that occurs when cereal-type plants are fl attened. Auxins (plant hormones) in the pulvini are responsible for promoting cell elongation, a

Study for Reproduction of Biological Anomalies in a Crop Circle 19
process that is required before the differentiation of a cell. This occurs by promoting the intake of water and increasing the elasticity of the cell. In fl attened crops, the vertical migration of auxin to the lower side of the stems caused by gravity increases cell growth rates locally.
This effect is known as gravitropism. In control studies, where maturing cereal grain plants were placed in a horizontal position, it was determined that gravitropism can account for a node length increase of ~20% after fi ve days, and up to 40% after 10 days (Levengood 1994). However, reported node length increase in crop circles has been considerably higher (Haselhoff 1999, Levengood 2001, 1994). Moreover, it is not only the length increase itself that is remarkable, but also the manifestation of a structured variation of node length over the circles with a clear correlation to the physical imprints that also extends outside the visibly fl attened area. Abnormal increase in node length is also found in remaining standing tufts inside fl attened areas, which rules out gravitropism as an explanation.
Figure 1. Node length increase in a crop circle. Shown are samples taken at three diff erent locations from the edge (top row) to the center (bottom row) of the Hoeven 1999 circle. The pulvini (dark node section near the middle of each stem) are seen to be markedly and structurally increased in length.

20 Eltjo H. Haselhoff, Robert J. Boerman, and Jan-Willem Bobbink
These fi ndings have sometimes been misinterpreted, with the conclusion that the observed node length increase is apparently not abnormal, because it manifests itself in and around crop circles both in fl attened as well as in standing crop. This conclusion is not correct because the normal values for node length in cereal-type crops are well-known numbers in the various stages of a plant’s life cycle, and are easily determined by considering the control samples.
Abnormal Node Length Increase in the Hoeven 1999 Formation
In the summer of 1999, Dutchman Robbert van den Broeke claimed he had seen a crop circle appear in a fi eld of barley (hordeum vulgare) while a bright pinkish, almost white ball of light was hovering at a height of several meters above the fi eld. He stated that the air around the ball of light was trembling as if it were very hot. After the light faded and disappeared, he inspected the fi eld at the location where he had seen the ball of light and found a crop circle. The crop, the soil, and the air felt physically warm. It should be mentioned that six years later, after his appearances on a commercial Dutch television show, and subsequently, fi erce and apparently appropriate criticism was brought forward with respect to Robert van den Broeke’s self-acclaimed paranormal gifts (http://en.wikipedia.org/wiki/Stichting_Skepsis, http://www.colinandrews.net/Robbert-van-den-Broeke-Message-Colin_Andrews.html). We will take this for granted at the moment, because van den Broeke’s testimony for this particular case took place many years later, whereas his testimony was supported by unambiguous biological changes to the fl attened crop that could easily be observed and quantifi ed (Haselhoff 2001a, 1999). We will summarize the main fi ndings here.
On June 13, 1999, six days after its appearance, the Hoeven circle was sampled for independent biophysical analysis by one of the authors (EH). At each of the locations indicated in Figure 2, a total of 20 to 25 stems were cut at their bases, tied together, and labeled. A control set was assembled by taking 8 sets of approximately 20 stems at 9 different locations in the fi eld, away from the crop circle, in the standing crop. After three months, during which the plants were hung in a dry room, the penultimate nodes were measured with the aid of digital photography and a computer program based on a straightforward pattern recognition algorithm. The average value of the control samples, a total of approximately 180 stems, was 2.0 mm. This value was used as a normalization factor, and all node length results in the crop circle were expressed as a percentage of this average control value. The results are shown in Figure 3. Three observations were made:

Study for Reproduction of Biological Anomalies in a Crop Circle 21
1. There was a large increase in average node length in the fl attened area. The longest nodes were 214% of the control value (in the circle’s center, i.e. sample A4), considerably more than the 20% increase that can be attributed to gravitropism, according to Levengood.
2. The node lengthening was highest in the center and fell off in all radial directions, reaching control levels at the edges.
3. By simple eyeballing, it can be observed that each sampling line reveals a strong symmetry with respect to the circle’s center.
The samples of the Hoeven 1999 formation were then sent to William Levengood, without the analysis report. No information was shared until
Figure 2. Sampling diagram used for the studies described in this paper. Three traces, A, B, and C, were defi ned, running through the circle, with the A trace running north–south. Inside the circle, samples were taken at equidistant positions (1.5 m) from edge to edge and labeled 1 through 7. Just outside the circle, samples numbered 0 and 8 were taken for each trace out of the standing crop. By symmetry arguments, samples A4 and C4 were not taken as they are represented by sample A4 (in the center).

22 Eltjo H. Haselhoff, Robert J. Boerman, and Jan-Willem Bobbink
Figure 3. Average node length in the Hoeven 1999 crop circle. Each sample consisted of 20 stems taken at the locations indicated in Figure 2. The vertical bars indicate the average node length as a percentage compared with the average control value of 2.0 mm. The error bars indicate the 95% confi dence intervals.

Study for Reproduction of Biological Anomalies in a Crop Circle 23
Levengood independently confi rmed the measurements. The fi ndings were considered important because for the fi rst time an abundant sampling scheme revealed a clear radial symmetry in node length increase. Earlier studies were mostly limited to a few samples inside the fl attened areas.
Model
In an earlier paper (Levengood & Talbott 1999), Levengood hypothesized that node lengthening in crop circles was the result of the viscoelastic nature of plant cell walls in combination with the heat-induced internal pressure caused by electromagnetic energy absorption. Based on the statement of the eyewitness that a “ball of light” was hovering above the fi eld at the time of the circle’s creation (Haselhoff 2001a, 1999), and assuming that the node expansion has a linear correlation with the electromagnetic radiation intensity, a simple linear regression analysis was performed for the node expansion and the electromagnetic radiation intensity of a point source located at a height h above the fi eld, with h as a free parameter. In this case, the radiation intensity on the ground depends on the value of h. The best correlation was found for a value of h = 4.1 meters, with a Pearson correlation coeffi cient R = 0.99 for the B-trace (Haselhoff 2001a, 1999). These fi ndings supported the hypothesis that the node length increase was caused by a small electromagnetic radiation source “hovering above the fi eld at a height of several meters,” as stated by the eyewitness. A revision of earlier node length measurements published by Levengood (Levengood & Talbott 1999) showed that these also correlated well to this ball-of-light model, later known as the BOL model. After mutual agreement with the original authors, it was decided to send a Letter to the Editor of the publishing journal (Haselhoff 2001b) suggesting the ball-of-light model as a viable alternative to the Beer-Lambert absorption model, as suggested in the original paper (Levengood & Talbott 1999).
Criticism
The scientifi c communication about node lengthening and the BOL model was soon embraced by crop circle enthusiasts, who now claimed that scientists had proven crop circles were made by balls of light. These statements were soon counterattacked by skeptical voices questioning the methodology and conclusions of Levengood and Haselhoff. Most of the communications took place on Internet forums and magazines directed to the general public. The traditional controversy around the study of crop circles was refl ected by emotionally loaded articles and online discussions that can still be read today. Many of them, however, demonstrated an

24 Eltjo H. Haselhoff, Robert J. Boerman, and Jan-Willem Bobbink
insuffi cient understanding of the essentials of the scientifi c fi ndings that had been published.
More elaborate objections were presented by several skeptic organizations, in particular the Italian CICAP group. In November 2003, Italian researcher and CICAP member Francesco Grassi requested that Eltjo Haselhoff share the raw data of his fi eld studies, including the data used for his 2001 paper (Haselhoff 2001a). In the summer of 2005, Grassi published a paper in this Journal (Grassi, Cocheo, & Russo 2005) in which he stated that the conclusions of both BLT papers (Levengood 1994, Levengood & Talbott 1999) and Haselhoff’s Letter to the Editor (Haselhoff 2001b) were invalid. Grassi and coauthors had performed their own analysis on the raw data provided by the original authors and concluded that the claims about the involvement of electromagnetic radiation during the creation of crop circles were not supported by the available evidence. Their primary concerns included the omission of important aspects in the presented BOL model, a questionable sampling strategy with respect to the choice of controls, the criteria for inclusion or exclusion of standing stems, and particularly a lack of statistical signifi cance in Levengood’s fi ndings. Summarizing, Grassi, Cocheo, and Russo concluded that the presented fi ndings in Levengood’s papers (Levengood 1994, Levengood & Talbott 1999) demonstrated nothing but a difference in node elongation between fl attened and upright plants, which could be the result of any fl attening mechanism. Their concerns were rebutted by Haselhoff (2007), who stated that Grassi’s most important conclusions were the result of an erroneous statistical analysis. This had happened because Grassi had not contacted the original authors prior to publication of his paper. As a result, Levengood’s node length values had been incorrectly interpreted as single stem measurements instead of the average values of many stems. Consequently, Grassi missed the fact that standard t-tests had been performed and that all results obeyed the common p < 0.05 criteria. In addition, the positions of control samples that Grassi, Cocheo, and Russo had assumed in their analysis were wrong.
Hypothesis
In order to explain the structured node length variation inside crop circles, Grassi suggested “the dynamics of wind near the circle borders and the behavior of circlemakers” (Grassi, Cocheo, & Russo 2005). However, it is not self-explanatory how wind could cause a radially symmetric decrease of node length in a crop circle with the longer nodes in the center, nor how the apparently well-organized node length distribution shown in Figure 3 can be attributed to mechanical plant damage caused by random footsteps. Others have suggested that the center of a crop circle receives more direct

Study for Reproduction of Biological Anomalies in a Crop Circle 25
radiation from the sun because the standing crop around the edges will cast a shadow over the fl attened area, and that node length increase is somehow related to higher levels of accumulated sunlight over the day. Arguments of this kind are speculative and will never provide defi nite answers without new, original research.
We therefore hypothesized that the structured node length variation inside crop circles as reported earlier (Haselhoff 1999, Levengood 1994, Levengood & Talbott 1999) is the result of the geometrical symmetry of a fl attened circle in a fi eld of vegetation in combination with one or more natural effects caused by sunlight, shadows of standing crop along the edges of the circle, wind, or any other naturally occurring phenomenon, or by mechanical damage caused during the construction of the circle. If this hypothesis were correct, we would expect to fi nd node length increases of comparable magnitude and symmetry as found in the Hoeven 1999 formation in the crop circle made by the authors.
Methods
An experiment was conducted to test the validity of the previously reported fi ndings of symmetric variance in node length within crop laying in fi elds, reportedly from anomalous mechanisms. A circle was created with a well-known method used by human circlemakers. A wooden board was used, with dimensions of approximately 1.0 × 0.2 m2, and a rope was attached to both ends. Holding the rope, this board can be held under one foot to trod down the crop while walking through the fi eld. The circle was created in the same crop as the Hoeven 1999 formation (barley, or hordeum vulgare). The barley was at approximately the same stage of maturity (height ~60 cm) and the circle was of the same diameter (9 m) as the Hoeven circle of 1999. For the node length analysis, we used the same test protocol as for the Hoeven 1999 formation. Sampling was performed six days after the creation of the circle using the same sampling scheme and the same number of stems per sample at each sampling location (Figure 3). A control set was assembled by taking 3 sets of approximately 27 stems at 3 different locations in the fi eld, away from the crop circle, in the standing crop. Also, the drying time was identical (three months), after which the penultimate nodes were measured with the same computer program.
Results and Discussion
If the symmetric node length distribution shown in Figure 3 had a natural explanation, one would expect similar observations for the man-made control circle. This was not the case, however, as can be seen in Figure 4.

26 Eltjo H. Haselhoff, Robert J. Boerman, and Jan-Willem Bobbink
Figure 4. Average node length in a test formation created by the authors. The crop, sampling scheme, and timings were identical to those of the Hoeven 1999 formation shown in Figure 3. The vertical bars indicate average node length as a percentage compared with the average control value of 2.4 mm. The error bars indicate the 95% confi dence intervals.

Study for Reproduction of Biological Anomalies in a Crop Circle 27
The average node length of the control set amounted to 2.4 mm and was used as a normalization parameter. Although in Figure 4 we do observe a signifi cant increase of node length in the fl attened crop, none of the 3 graphs show the near-perfect centric symmetry found in the Hoeven 1999 circle. The maximum node length was 144% of the average control length (sample B3). This is more than the 120% reported in Levengood’s control study (1994). However, these numbers cannot be directly compared, because Levengood reported the average node length of one single sample, whereas sample B4 represents the largest average value of 25 different samples. In fact, several of our samples also showed an average node length close to 120% (for example, B5: 121%, B6: 118%, C6: 118%), similar to Levengood’s fi ndings. When the average node length of all fl attened stems in our control circle was calculated, we found a node length of 111% of the control value, less than that reported by Levengood. In comparison, the Hoeven formation revealed a maximum value of 171% (average of all fl attened stems) and a peak value in the circle’s center of 214% of the control value. These results are summarized in Table 1.
The numbers presented above provide a global insight only. In order to gain insight into the regional behavior of node lengthening, the average node length in each of the sampling points in the Hoeven 1999 formation and the control circle can be directly compared in a simple correlation diagram. Figure 5 shows the result. Each point in the graph corresponds to one sampling location. The x-coordinate indicates the average node length of the control sample in that sampling location, and the vertical coordinate indicates the average node length of the Hoeven formation in the same sampling location. It can be seen that the points appear randomly distributed, which means there is no obvious similarity in the geometric distribution of node length in both circles. This is confi rmed by a low Pearson correlation coeffi cient of R = 0.06. This demonstrates that whatever mechanism caused the symmetry in the Hoeven node length distribution did not manifest itself in the control circle.
TABLE 1Comparison of Node Length Parameters of the
Hoeven 1999 Formation and a Man-Made Control Circle
Hoeven (1999) Control Circle
Average node length of all flattened stems 171% 111%
Peak node length 214% 144%
Position of peak node length Center of circle 3 meters off-center

28 Eltjo H. Haselhoff, Robert J. Boerman, and Jan-Willem Bobbink
Despite the fact that the node length distribution in the control circle lacks the clear bell shape seen in the Hoeven case, the B-trace in particular seems to reveal a slight tendency toward longer nodes in the center of the circle (see Figure 4). In order to check if this could be the effect of the varying intensity of sunlight, a straightforward computer model was created to calculate the cumulative solar energy at ground level inside the Hoeven circle, based on the sun’s azimuth and elevation in June from sunrise to sunset. Figure 6 shows the result in the form of an intensity diagram. It
Figure 5. Regional correlation between average node length in the Hoeven 1999 crop circle and the man-made control circle. Each point represents one sampling position, with the horizontal coordinate indicating the average node length in the control circle and the vertical coordinate indicating the average node length in the Hoeven 1999 circle. The error bars represent the 95% confi dence intervals for each measurement. The straight line shows the “best fi t” for a linear correlation of the two datasets, which shows a very poor correlation with a Pearson coeffi cient of R = 0.0613.

Study for Reproduction of Biological Anomalies in a Crop Circle 29
shows the circle’s area, with higher levels of accumulated solar energy indicated by a lighter shade of grey. It can be seen that the solar energy has a uniform distribution over the largest part of the circle with only a few shadow effects, predominantly at the southern edge, caused by the standing crop with a measured height of 60 cm. This result can be easily understood by anyone who has ever visited a crop circle on a sunny summer day. The sun shines uniformly almost everywhere in the circle, except for the area near the perimeter on the side the sun is shining from. This part is covered by the shadow of standing crop, which is usually only a small rim because of the limited height of the crop in comparison with the circle’s diameter and because of the sun standing high in the sky most of the day.
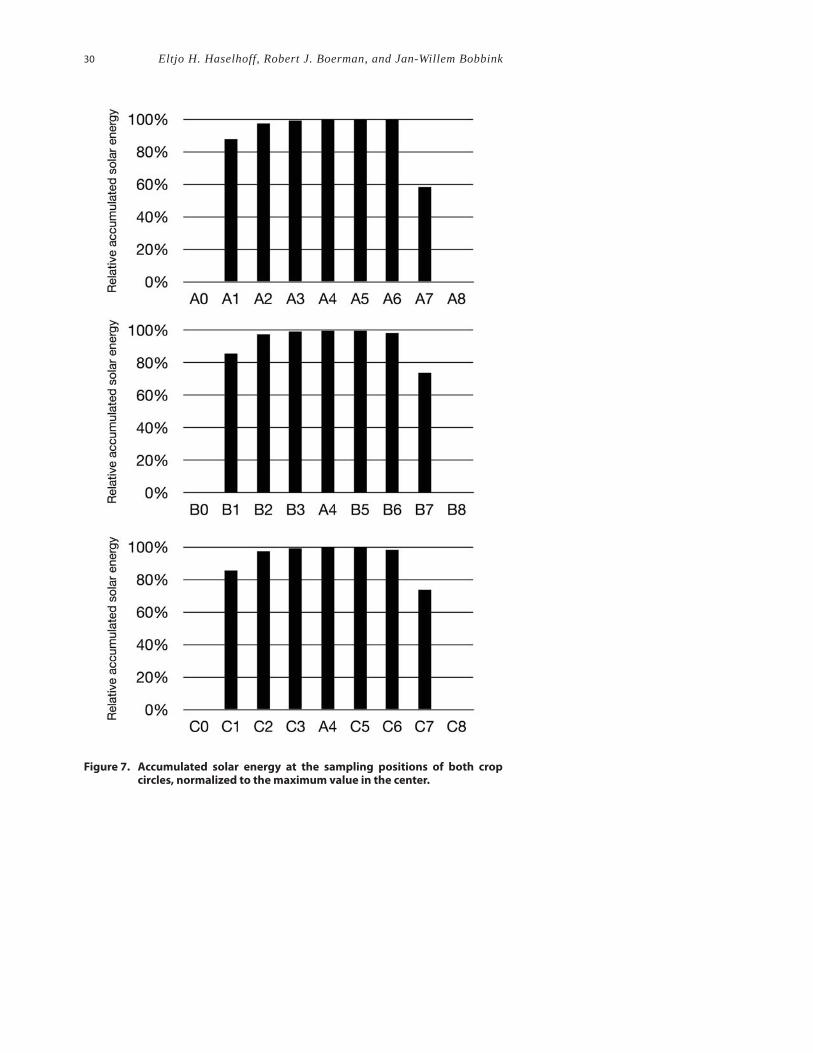
Figure 7 shows a quantitative display of the relative accumulated solar energy at the positions corresponding to the sampling points of the Hoeven study, normalized to the maximum level. It can be seen that the energy is indeed somewhat lower at the edges, in particular at the southern edges (rightmost in the graphs). As was said before, this is the effect of the shadow of the standing crop along the circle’s perimeter. One can only speculate as to what the net effect of direct solar radiation could be. Sunlight is known
Figure 6. Relative accumulated sunlight displayed in shades of grey in a 9 m diameter crop circle between June 7 and June 13 (the dates between creation and sampling of the crop circle) at the geographical position of the village of Hoeven, The Netherlands. The height of the standing crop, casting a shadow over the fl attened area, was measured as 60 cm.
30 Eltjo H. Haselhoff, Robert J. Boerman, and Jan-Willem Bobbink
Figure 7. Accumulated solar energy at the sampling positions of both crop circles, normalized to the maximum value in the center.

Study for Reproduction of Biological Anomalies in a Crop Circle 31
to lower auxin levels and reduce soil humidity, which reduces growth, but it also increases the local temperature, stimulating growth. However, if there were a strong effect caused by sunlight it should be refl ected by a structural difference between the node lengths measured in sample points A7, B7, and C7 compared with the samples numbered 1 through 6 in the rest of the circle. In Figure 4 it can be seen that this was not the case. This is confi rmed by the graphs shown in Figure 8, which show the average node length in each sample location of both the Hoeven circle and the control circle as a function of the accumulated solar energy at that sample location over a day. It can be seen that for both crop circles there is no obvious dependency between node length and accumulated solar energy. It was concluded that sunlight has no signifi cant effect on node lengthening in crop circles.
Conclusion
An experiment was conducted to test the validity of previously reported fi ndings of node length variance within cereal crops laying in fi elds, reportedly from anomalous mechanisms. Therefore, a crop circle was created in The Netherlands by fl attening the crop with the well-known board and rope method. The time of the year, the type and maturity of the crop, and the circle’s diameter were identical to those of a formation found in Hoeven, The Netherlands, in 1999. The latter circle was allegedly created by unknown forces in the presence of a ball of light.
Stems were taken from the control circle for node length measurements. A sampling scheme was applied that was identical to the one used earlier for the Hoeven 1999 formation so that all results could be directly compared. In addition, the time span between creation and sampling and the time span between sampling and performed node length measurements were identical. The control circle did not reveal the strong radial symmetry in node length distribution that was found in the Hoeven 1999 formation. Moreover, the average node length increase was signifi cantly less (11%, compared with 71% for the Hoeven formation), which was attributed to the effect of gravitropism, in agreement with earlier fi ndings by other researchers. A computer simulation demonstrated that differences in accumulated solar energy over the circle area have no effect on node lengthening, which also excludes the effect of sunlight as a potential cause for the Hoeven anomalies.
Clearly, it was impossible to reproduce exactly all environmental circumstances during the six days between the creation and the sampling of the Hoeven 1999 formation. First, because these are largely unknown, but also because it is not straightforward to reproduce wind, temperature, humidity, soil composition, sunlight, and all aspects that are known to effect plant growth, over a period of six days. Future control experiments could

32 Eltjo H. Haselhoff, Robert J. Boerman, and Jan-Willem Bobbink
Figure 8. Correlation between node length (vertical axis) and relative accumulated solar energy (horizontal axis) in the control crop circle (top) and the Hoeven 1999 circle (bottom).

Study for Reproduction of Biological Anomalies in a Crop Circle 33
be improved by creating circles in a controlled environment that reproduces temperature, humidity, and wind based on meteorologic records of the environment of the circle to be reproduced. In addition, such an experiment could also be executed in blind fashion, meaning that the samples are measured by independent researchers with no knowledge of the sample positions. This would be particularly important when node lengths are measured by hand, and not automatically by a computer as was the case in our experiement. However, by creating an identical control formation at the same time of the year, in the same geographical area, in the same type of crop, and by applying an identical test protocol, it is fair to assume that “obvious causes” for the observations in the Hoeven 1999 formation should also be revealed to some extent by our control formation. This was not the case.
To summarize, the node lengthening in the Hoeven formation was experimentally duplicated with signifi cant success. However, no support was found for the hypothesis that the node lengthening in the Hoeven 1999 circle was created by natural causes such as gravitropism or the effect of wind or sun. It is therefore concluded that the node lengthening found in the Hoeven 1999 formation could not be explained and remains anomalous.
References Cited
Grassi, F., Cocheo, C., & Russo, P. (2005). Balls of light: The questionable science of crop circles. Journal of Scientifi c Exploration, 19(2) 159–170.
Haselhoff , E. (1999). Lab Report #37, Report on Pulvinis Length Measurements: Hoeven Crop Circles. German Association for Crop Circle Research. http://archiv.fgk.org/99/Berichte/Hoeven99/index.shtml
Haselhoff , E. (2001a). The Deepening Complexity of Crop Circles. Berkeley, CA: Frog. pp. 78–80.Haselhoff , E. H. (2001b). Letter to the Editor: Opinions and comments on Levengood, W. C., &
Talbott, N. P. (1999), Dispersion of energies in worldwide crop formations. Physiologia Plantarum, 111, 123–125.
Haselhoff , E. H. (2007). Letter to the Editor: Haselhoff responds to “Balls of light: The questionable science of crop circles.” Journal of Scientifi c Exploration, 21(3) 576–579.
Levengood, W. C. (1994). Anatomical anomalies in crop formation plants. Physiologia Plantarum, 92, 356–363.
Levengood, W. C. (2001). Lab Report #123. http://www.iccra.org/levengood/CircleScans3/ResearchReport123-03Mar2001-HoevenNetherlands.pdf
Levengood, W. C., & Talbott, N. P. (1999). Dispersion of energies in worldwide crop formations. Physiologia Plantarum, 105, 615–624.