Correction: Biphasic targeting and cleavage furrow ingression ...

JSCSEN 7 ( ) (200 )3 12 1139–1269 8
BEL GR A D E 2008
NO 12
VOLUME 73Available on line at
www.shd.org.rs/JSCS
The full search of JSCSis available through
www.doaj.org
electronic
ersionv

J. Serb. Chem. Soc. Vol. 73, No. 12 (2008)
CONTENTS
Organic Chemistry and Biochemistry Z. Knežević-Jugović, D. Bezbradica, Ž. Jakovljević, S. Branković-Dimirijević and D. Mijin:
Lipase catalyzed synthesis of flavor esters in non-aqueous media: Optimization of the yield of pentyl 2-methylpropanoate by statistical analysis.................................... 1139
S. O. Podunavac-Kuzmanović, V. M. Leovac and D. D. Cvetković: Antibacterial activity of cobalt(II) complexes with some benzimidazole derivatives ................................... 1153
N. Jocković, P. B. Andrade, P. Valentão and M. Sabovljević: HPLC–DAD of phenolics in bryophytes Lunularia cruciata, Brachytheciastrum velutinum and Kindbergia praelonga .................................................................................................................... 1161
Inorganic Chemstry M. R. Vegi, P. L. Muddapu, S. R. Tirukkuvalluri and N. R. Gollapalli: Computer augu-
mented modelling studies of Pb(II), Cd(II), Hg(II), Co(II), Ni(II), Cu(II) and Zn(II) complexes of L-glutamic acid in 1,2-propanediol–water mixtures ............................. 1169
Physical Chemstry E. Makrlík, J. Budka, P. Vaňura and P. Selucký: Solvent extraction of Ca2+, Ba2+, Cu2+,
Zn2+, Cd2+, Pb2+, +22UO , Mn2+, Co2+ and Ni2+ into nitrobenzene using strontium di-
carbollylcobaltate and tetra-tert-butyl p-tert-butylcalix[4]arene tetraacetate (Short communication) .......................................................................................................... 1181
Z. Wang and S. Wu: Electronic structures and spectra of conducting anthracene deri-vatives ......................................................................................................................... 1187
Electrochemistry M. D. Obradović, B. M. Babić, A. Kowal, V. V. Panić and S. Lj. Gojković: Electrochemi-
cal properties of mixed WC and Pt-black powders ..................................................... 1197 V. V. Panić, S. I. Stevanović, V. B. Mišković-Stanković, B. Ž. Jovanović and B. Ž. Nikolić:
Photoelectrochemical properties of sol–gel obtained titanium oxide.......................... 1211
Analytical Chemistry Y.-Z. Xu, H.-R. Lin, A.-C. Lua and C. Chen: Determination of dimethoxyphenethylamine
derivatives in urine by deuterium labeled internal standards ...................................... 1223
Chemical Engineering M. N. Roy, L. Sarkar and B. K. Sarkar: Study of solute–solvent interactions of nicotinic
acid and benzoic acid in methanol and its binary solvent systems.............................. 1235 Errata (printed version only) ............................................................................................... 1247 Contents of Volume 73 ....................................................................................................... 1249 Subject index....................................................................................................................... 1259 Author index ....................................................................................................................... 1265
Published by the Serbian Chemical Society Karnegijeva 4/III, 11000 Belgrade, Serbia
Printed by the Faculty of Technology and Metallurgy Karnegijeva 4, P.O. Box 35-03, 11120 Belgrade, Serbia

J. Serb. Chem. Soc. 73 (12) 1139–1151 (2008) UDC 547.521–326:542.913+577.15 JSCS–3793 Original scientific paper
doi: 10.2298/JSC0812139K 1139
Lipase catalyzed synthesis of flavor esters in non-aqueous media: Optimization of the yield of pentyl
2-methylpropanoate by statistical analysis ZORICA KNEŽEVIĆ-JUGOVIĆ1*#, DEJAN BEZBRADICA1#, ŽIVANA JAKOVLJEVIĆ2,
SUZANA BRANKOVIĆ-DIMITRIJEVIĆ1# and DUŠAN MIJIN1#
1Faculty of Technology and Metallurgy, University of Belgrade, Karnegijeva 4, 11120 Belgrade and 2Faculty of Mechanical Engineering, University of
Belgrade, Kraljice Marije 16, 11120 Belgrade, Serbia
(Received 19 March, revised 3 June 2008)
Abstract: In this study, the synthesis of pentyl 2-methylpropanoate employing a commercial lipase from Candida rugosa was investigated, the emphasis being placed on analyzing the effects of various process conditions on the yield of ester. The response surface methodology (RSM) and five-level-five-factor cen-tral composite rotatable design (CCRD) were used to evaluate the effects of variables, namely the initial water content, 0.0–2.0 % (w/v), the reaction tem-perature, 35–75 °C, the enzyme concentration, 1.0–5.0 g dm-3, the acid/alcohol mole ratio, 1:2–5:2, and the reaction time, 4–48 h, on the yield (%) of ester. The production of pentyl 2-methylpropanoate was optimized and an ester yield response equation was obtained, enabling the prediction of ester yields from known values of the five main factors. It seems that the enzyme concentration, reaction time and acid/alcohol mole ratio predominantly determine the conver-sion process, while the amount of added water amount had no significant in-fluence on the ester yield. Conversion of around 92 % of the substrate to ester could be realized using a concentration of lipase as low as 4.0 g dm-3 and in a relatively short time (26 h) at 35 °C, when a high substrate mole ratio of 2.5 was used.
Keywords: factorial design; surface response analysis; Candida rugosa lipase; flavor esters; esterification.
INTRODUCTION
Short chain aliphatic esters play a relevant role in the food industry as flavor and aroma constituents.1 They are responsible for the particular fruity aroma or smell of a particular flower. Current processes for the production of esters consist
* Corresponding author. E-mail: [email protected] # Serbian Chemical Society member.

1140 KNEŽEVIĆ-JUGOVIĆ et al.
of the esterification of a carboxylic acid with an alcohol in the presence of non-se-lective inorganic catalysts at high temperatures or extraction from natural sources. Esters extracted from plant materials are often either too scarce or expensive for commercial use while those produced by chemical synthesis are not considered as natural products. The replacement of inorganic catalysts by lipases in the syn-thesis of flavor esters avoids side product formation and is less polluting and energy consuming because of the mild conditions employed.2 More importantly, the quality of the product of so enzyme-synthesized esters is normally better than the chemically-derived product due to the lower reaction temperature and avoid-ance of degradation products resulting from the strong acid-catalysis. Conse-quently, numerous attempts have been made to develop an efficient lipase system for the synthesis of food acceptable esters.3–5
Lipase from Candida rugosa (formerly Candida cylindracea) is an enzyme of considerable physiological significance and industrial potential in that it can catalyze numerous reactions, such as hydrolysis, transesterification, esterifica-tion, alcoholysis, acidolysis and aminolysis.6–8 Several researchers have reported the synthesis of short-chain esters using free or immobilized lipase in non-aque-ous, solvent-free or biphasic organic phase reaction systems.3,9–11 In order to maximize the yield of the esters, serious attention was given to the optimization of the process parameters, the development of appropriate kinetic models of es-terification and the monitoring and control of the water concentration in the re-action mixture. However, most of the studies were based on conventional one-at--a-time variation of parameters, which often do not demonstrate the interactive effects of the parameters.Moreover, the widely different substrates and reaction systems employed led to an enormous amount of quantitative data, which, however, cannot be directly compared. Thus, to make the enzymatic processes competitive, they should be studied and compared in a systematic way.
It was shown that the statistical designs could be very useful tool not only in optimizing esterification reactions, but also in explaining qualitatively and quan-titatively the esterification behavior of the employed lipase.12 In addition to redu-cing the number of experiments required for optimization, this technique enables the quantification of the individual effect of each factor and to investigate their possible interactions. An increasing number of results published in the field of ester synthesis in an organic solvent were based on experimental design.13–15 Most of these studies were focused on the optimization of the conditions for the synthesis of ethanoic acid esters with immobilized lipase from Rhizomucor mie-hei as the catalyst. However, comparatively few have related to systematic studies of the synthesis of butanoic acid and 2-methyl propanoic acid esters with lipase from C. rugosa.16
The object of this study was to investigate the process conditions relevant for the synthesis of flavor esters aiming at a better control of the enzymatic process.

ENZYMATIC SYNTHESIS OF FLAVOR ESTERS 1141
The results of previously reported investigations implied that the influence of reaction factors varies strongly with both substrate types. Each ester synthesis seems to be a specific problem. In this study, the synthesis of pentyl 2-methyl-propanoate in isooctane was chosen as a model reaction because of its impor-tance in the food industry. This short chain ester, which contributes to the natural aroma of fruits such as pineapple and banana, is widely used in the food industry for flavor enhancement. Lipase from C. rugosa was chosen for present work because of its commercial availability in large quantities at relatively low cost and the number of immobilization procedures developed with this enzyme.17–19 Response surface methodology and 5-level-5-factor central composite rotatable design were performed to identify the factors that influence the ester synthesis and to verify whether any changes should be made in their settings to improve this reaction. In spite of the importance of pentyl 2-methylpropanoate, to the best of our knowledge, there are no reports about the use of C. rugosa for the syn-thesis of this ester in a non-aqueous system. Moreover, this is the first time that this system has been analyzed by the statistical approach at this level of detail.
EXPERIMENTAL
Materials Commercial Candida rugosa lipase (EC 3.1.1.3), trizma buffer, thymolphthalein indi-
cator solution and olive oil emulsion were purchased from Sigma Chemical Co. (St. Louis, MO, USA). The lipase was a crude preparation with 10 % protein based on the Lowry method for protein assay.20 2-Methylpropanoic acid and n-pentanol were purchased from Merck (Darmstadt, Germany). 2,2,4-Trimethylpentane of p.a. grade, purchased from Merck (Darm-stadt, Germany), was dried over 0.3 nm molecular sieves for at least 24 h prior to use and, as such, was regarded as nearly anhydrous. The solvents used in the analytical procedures, stan-dards and other reagents were reagent grade and purchased either from Aldrich Chemical Co. (St. Louis, MO, USA) or Sigma Chemical Co. (St. Louis, MO, USA).
Lipase activity assay The lipase activity was estimated by the standard olive oil emulsion method.21 This acti-
vity assay was performed with reaction mixtures containing 3.0 cm3 of Sigma lipase substrate, 1.0 cm3 of trizma buffer, and 3.5 cm3 of distilled water. Negative and positive controls were also studied. The positive control was the reaction mixture in which investigated solution or biocatalyst was added at the beginning of the reaction time, whereas the negative control was one with samples added just before titration with NaOH. The reaction mixtures were agitated and incubated for 30 min in a water bath at 37 °C. The formed fatty acids were quantified by titration with 0.050 M sodium hydroxide. The activities are expressed as international units (IU), where 1 IU is defined as the amount of enzyme required to produce 1 μmol min-1 of free fatty acid under the assay conditions (37 °C, pH 7.7). The determined activity of the lipase was 1.55 IU mg-1 enzyme.
Pentyl 2-methylpropanoate synthesis The esterification reactions were performed in screw-capped 100 cm3 flasks in 2,2,4-tri-
methylpentane. n-Pentanol and 2-methylpropanoic acid were added at different molar ratios followed by different amounts of water, according to the experimental design. The reaction mixture was then diluted up to the volume of 10 cm3 with 2,2,4-trimethylpentane and incu-

1142 KNEŽEVIĆ-JUGOVIĆ et al.
bated on a shaker at 150 rpm and at different temperatures prior to the addition of the lipase. The various quantities of enzyme were added to the reaction mixture only after the correct temperature had been attained and samples were taken for analysis after 4, 15, 26, 37 and 48 h reaction time. Control experiments were also conducted without lipase under similar conditions.
Analysis
The reactions were monitored by determination of the residual acid content by titration against standard sodium hydroxide using phenolphthalein as the indicator and methanol as a quenching agent. The molar conversion was determined from the values obtained for the blank and the test samples. The reactions were also monitored by measuring the concentrations of the products by gas chromatography (model: Varian 3400) equipped with a Carbowax 20-M column (3.0 m length, 3.175 mm internal diameter) and a flame ionization detector (FID). Nitrogen was used as the carrier gas at a flow rate of 30 cm3 min-1. The column oven, injector and detector temperatures were at 100, 200, and 250 °C, respectively.14 The reported percent-age yield of ester was defined as the amount of ester produced to the amount of initial sub-strate in defect ((mol ester/mol initial substrate in defect)100). The percentage esterification determined by both GC analysis and titration were found to be in good agreement.
Experimental design and analysis
A five-level-five-factor central composite design was employed in this study, requiring 32 experiments, which consisted of 16 factorial points, 10 axial points and 6 central points.22 The variables and their levels selected for the study of the ester synthesis were: water content (0.0–2.0 % (w/v)); temperature (35–75 °C); enzyme concentration (1.0–5.0 g dm-3); acid/alco-hol mole ratio (1:2–5:2) and reaction time (4–48 h). These variables were chosen based on the results obtained in a preliminary study and are the most commonly used for modeling esterification reactions. In a preliminary study, the effects of reactant concentration on the initial rate of production of pentyl 2-methylpropanoate were investigated with the reactants added in stoichiometric proportions. It seems that the initial reaction rate increases rapidly with concentration up to about 0.50 mol dm-3 and thereafter becomes essentially constant be-tween 0.50 and 0.75 mol dm-3 before dropping at higher concentrations (data not shown). This appears to be caused by inactivation of the lipase by the alcohol. In separate experiments in which an excess of 2-methylpropanoic acid was used, it was shown that the acid did not de-activate the enzyme in concentrations up to 1.25 mol dm-3. Therefore, the effect of acid/alco-hol mole ratio was investigated fixing the initial alcohol concentration at a lower value (500 mmol dm-3) at different concentrations of acid.
The actual and coded settings of each of the five experimental factors are given in Table I. The experiments were run at random to minimize errors due to possible systematic trends in the variables. The ester yield was taken as the response variable. The design of experiments employed is presented in Table II. The data obtained were fitted to a second-order polynomial equation:
4
1
5
1k
5
1
2k
5
1k0k
i ijjiij
iiii
iii XXXXY (1)
where Y is the response (ester yield in mol %), k0,ki, kii and kij are regression coefficients for the intercept, linear, quadratic and interaction terms, respectively and Xi and Xj are in-dependent variables. The coefficients of the response function and their statistical significance were evaluated by the method of least squares using Matlab software (version 6.5, Release 13, The MathWorks, Juc, Matick, MA, USA). Only the significant terms (p 0.05) were con-sidered for the final reduced model. The lack-of-fit test was used to determine whether the

ENZYMATIC SYNTHESIS OF FLAVOR ESTERS 1143
constructed model was adequate to describe the obtained data. The goodness of fit of the mo-del was evaluated by the determination of R2 and r coefficients, complemented by a graphic plot of the values predicted by the model vs. the observed experimental values. High values of both R2 and r suggest a good fit of the model to the experimental data. Response surfaces and contour plots were obtained using the fitted model by keeping two independent variables at a constant value while changing the other two variables. The regression analysis, statistical significance and response surfaces were also realized using Matlab software.
TABLE I. Coded and actual values of the variables for the design of the experiments
Coded levels of the variables Variables
–2 –1 0 1 2 Water content, X1 / % (w/v) 0 0.5 1.0 1.5 2.0 Temperature, X2 / C 35 45 55 65 75 Enzyme amount, X3 /g dm-3 1 2 3 4 5 Substrate mole ratio, X4 1:2 1:1 3:2 2:1 5:2 Reaction time, X5 / h 4 15 26 37 48
RESULTS AND DISCUSSION
Response surface analysis
The response surface methodology (RSM) is an optimization technique, which determines the optimum process condition by testing several variables simulta-neously, uses special experimental designs to reduce the number of required de-terminations and measures several effects by objective tests. In this study, RSM and 5-level-5-factor central composite rotatable design were employed to optimi-ze and understand the relationship between the important reaction parameters in the lipase-catalyzed synthesis of pentyl 2-methylpropanoate in a non-aqueous system.
The data showing the predicted and experimental yields of ester for the 32 experiments of the statistical design are given in Table II. According to this study, the maximum ester yield can be obtained at a low temperature, low level of water content and high levels of lipase concentration, initial acid/alcohol mole ratio, and reaction time. Among the various syntheses, the greatest molar conver-sion (96.8 %) was achieved in run No. 13 (water content of 0.5 %, 45 °C, enzyme concentration of 4 g dm–3, substrate mole ratio 2:1, 37 h), while the smallest conversion (only 11.85 %) was achieved in run No. 26 (water content of 1.0 %, 55 °C, enzyme concentration 3 g dm–3, substrate mole ratio 3:2, 4 h).
A statistical analysis was performed on the experimental data, whereby the main effects and interaction effects of the variables were estimated. Both the t-test and p-value statistical parameters were used to confirm the significance of factors studied. The effects of the parameters on the ester synthesis and their significance are shown in the Pareto chart of effects (Fig. 1). It seems that the most relevant variables for the ester synthesis are reaction time and enzyme concentration with estimated effects of 13.00 and 11.61, respectively. The effects of substrate mole

1144 KNEŽEVIĆ-JUGOVIĆ et al.
TABLE II. Experimental setup for five-level, five-factor surface response design and the ex-perimental data
Run No.
Water content, X1 / %
TemperatureX2 / C
Enzyme concentration
X3 /g dm–3
Substrate mole ratio, X4
Reaction time X5 / h
Experi-mental
1 1 1 1 1 1 56.20 2 1 1 1 –1 –1 27.05 3 1 1 –1 1 –1 30.80 4 1 1 –1 –1 1 15.40 5 1 –1 1 1 –1 49.20 6 1 –1 1 –1 1 62.90 7 1 –1 –1 1 1 56.50 8 1 –1 –1 –1 –1 13.80 9 –1 1 1 1 –1 52.90 10 –1 1 1 –1 1 36.30 11 –1 1 –1 1 1 36.70 12 –1 1 –1 –1 –1 14.30 13 –1 –1 1 1 1 96.80 14 –1 –1 1 –1 –1 30.00 15 –1 –1 –1 1 –1 29.30 16 –1 –1 –1 –1 1 42.60 17 2 0 0 0 0 24.00 18 –2 0 0 0 0 36.22 19 0 2 0 0 0 13.05 20 0 –2 0 0 0 33.45 21 0 0 2 0 0 76.57 22 0 0 –2 0 0 14.25 23 0 0 0 2 0 61.75 24 0 0 0 –2 0 29.45 25 0 0 0 0 2 80.92 26 0 0 0 0 –2 11.85 27a 0 0 0 0 0 48.30 28a 0 0 0 0 0 29.10 29a 0 0 0 0 0 28.42 30a 0 0 0 0 0 41.02 31a 0 0 0 0 0 31.35 32a 0 0 0 0 0 35.92 aCenter point
ratio, temperature, and temperature–reaction time interaction were also signify-cant (p 0.05). It appears that while the substrate mole ratio has a positive effect (8.87), temperature and reaction time–temperature interaction have a significant negative influence on the ester yield (–6.93 and –7.09, respectively) which is in agreement with thermal stability data for this lipase in non-aqueous medium.10,23,24 The results also indicate the importance of working at high levels of enzyme con-centration, reaction time and substrate mole ratio. Due to the bars that extend beyond the vertical line on the plot which correspond to effects that are stati-

ENZYMATIC SYNTHESIS OF FLAVOR ESTERS 1145
stically significant at the 95 % confidence level, quadratic terms of incubation time, mole ratio and enzyme concentration were also significant. Interestingly, the effect of the water content on the conversion was not significant and could be neglected in the range tested. Perhaps, this is because a water content in this range was sufficient to preserve the catalytic conformation of the enzyme and the lipase itself contained sufficient water to maintain its activity. In general, it was observed that only a very small amount of water was required to successfully em-ploy enzymes in organic solvents.10 However the optimal level of water should be determined for each particular reaction system. In the present experimental setup, the water content did not significantly influence the ester yield. Therefore, the added water was constant at 0 level (1 %) in the following discussion.
Fig. 1. Pareto diagram of the effect of the re-action parameters on the ester synthesis and their significance calculated from the experi-mental design. For abbreviations, see Table I.
The multiple regression coefficients, obtained by employing a least squares technique to predict a second-order polynomial model (Eq. (1)) for ester yield (Y, %), after backward elimination, their significance (student's t-test and p-values) and the results of the statistical analysis are summarized in Table III. According to the results of the student’s t-test, four linear coefficients and one cross-product term had a highly significant effect at the 99 % confidence level. Three quadratic terms were also significant (p 0.05). The quadratic term of temperature and nine cross-product terms corresponding to X1 with X2, X3, X4 and X5, X2 with X3 and X4, X3 with X4 and X5 and X4 with X5 were found to be insignificant (p 0.05). The final response equation obtained after eliminating the insignifi-cant terms is as follows:
Y = 31.959 – 6.935X2 + 11.767X3 + 9.019X4 + 12.849X5 – 7.093X2X5 + + 3.207 2
3X + 3.254 24X + 3.451 2
5X (2)
The fit of the model was checked by the R2 values, which was calculated to be 0.912, indicating that 91.2 % of the variability in the response could be ex-plained by the model. The model also showed statistically insignificant lack of fit, as is evident from the lower calculated F value (1.06) than the theoretical F0.05 value (4.58) at the 5 % level. The plot of experimental values of ester yield

1146 KNEŽEVIĆ-JUGOVIĆ et al.
(%), versus those calculated from the above equation, indicated a good fit (Fig. 2), with a correlation coefficient, r of 0.944. Overall, these results revealed good agreement between the predicted and experimental values, implying that the em-pirical model derived from RSM can be used to adequately describe the rela-tionship between the factors and the response in the lipase-catalyzed synthesis of pentyl 2-methylpropanoate.
TABLE III. Regression coefficients () and significance (student's t-test and p-values) of the predicted second-order polynomial model for the response (Y) after backward elimination and the results of the statistical analysis
Factors Coefficient () Standard error t-Values p-Values Average 31.9595 3.11 11.31 0.0000 Temperature, X2 –6.9348 1.68 –4.23 0.0027a
Lipase concentration, X3 11.7673 1.68 6.93 0.0002a
Substrate mole ratio, X4 9.0193 1.68 5.29 0.0009a
Reaction time, X5 12.8494 1.68 7.76 0.0001a
X2X5 –7.0930 2.32 –3.50 0.0064a
23X 3.2070 1.45 2.06 0.0422b
24X 3.2539 1.44 2.10 0.0404b
25X 3.4507 1.45 2.23 0.0335b
Results of the statistical analysis Source of variation Sum of square Degrees of freedom Mean square F-test
Regression 1455.8 23 63.3 – Lack of fit 1153.2 18 64.1 1.06 Pure error 302.6 5 60.5 – ap 0.01; bp 0.05
Fig. 2. Correlation of the calculated versus the ex-perimental values for the synthesis of pentyl 2- -methylpropanoate catalyzed by lipase from C. rugosa.
Influence of process conditions on the molar conversion
The influence of the variables, reaction temperature, enzyme concentration, substrate mole ratio and reaction time on the yield of ester is discussed using the statistical model shown by Eq. (2).
Temperature showed an interactive effect with the reaction time of esterifi-cation. The shape of the three-dimensional surface, representing yield of ester versus temperature and reaction time, is shown in Fig. 3a. It appears that the

ENZYMATIC SYNTHESIS OF FLAVOR ESTERS 1147
surface is smooth showing an increase/decrease in one axis and a decrease/ /increase in the other axis, which reflects that the temperature may affect the re-action rate in opposite ways. Specifically, as the temperature increases, the ex-pected increase in reaction rate resulting from more productive molecule colli-sions per unit time is offset by the increasing rate of enzyme denaturation. The effect of temperature on the ester synthesis during the initial period was observed to follow Arrhenius law (between 298 and 338 K) with an activation energy of 18.34 kJ mol–1, which is typical for enzymatic reactions occurring in a reaction- -limited regime.25 At intermediate and high levels of reaction time, however, a different behavior was observed as the surface decreased with increasing reaction temperature. This could be the result of a negative temperature–reaction time in-teraction, probably caused by thermal deactivation of the enzyme. The maximum yield of ester could be obtained when working at low temperatures and a high level of reaction time. The result suggests that the C. rugosa lipase, like some other lipases such as Novozym SP 435 from Candida antarctica26,27 or porcine pancreatic lipase,12 was inactivated when it was subjected to a high temperature for a long period under non-aqueous conditions.
Another important parameter affecting the economic feasibility of the pro-cess is the acid to alcohol mole ratio. Figure 3b shows the predicted percentage of esterification as a function of the substrate molar ratio at different tempera-tures for an enzyme concentration of 3 g dm–3 (4.5 IU cm–3) and an incubation period of 26 h. It seems that while the temperature exerted a negative influence, excess of acid had a significant positive effect on the ester yield, indicating the importance of using an excess of acid over the stoichiometric amount for the maximum conversion to ester. Minimum esterification was observed at a sub-strate mole ratio of 0.8 at 55 °C (11 %) and a maximum esterification was ob-served at a substrate ratio of 2.5 at 35 °C (≈ 77 %). The beneficial effect of ex-cess acyl donor was also observed for the synthesis of short-chain esters using microbial lipases by several authors. For example, studying the synthesis of ethyl butanoate with the same lipase as the catalyst, Chen9 verified that the mole ratio between ethanol and butanoic acid was a critical factor for attaining a high yield of ethyl butanoate, requiring an amount of butanoic acid of the order of 3.3 times that of ethanol. Yadav and Lathi27 also found that there was an increase in the reaction rate with increasing amount of 2-methylpropanoic acid using Novozym SP 435 lipase during the synthesis of butyl 2-methylpropanoate. The possible ex-planation is related to reaction mechanism. Lipase is known to catalyze esterifi-cation through an acyl-intermediate formed between the fatty acid substrate and the enzyme. Free enzyme can either bind the fatty acid to produce this inter-mediate or the ester product. In an excess of fatty acid, most of the enzyme is found in the acylated form, preventing it from binding the product. In addition, a higher concentration of free 2-methylpropanoic acid in the reaction system was

1148 KNEŽEVIĆ-JUGOVIĆ et al.
beneficial for the incorporation of acid from the view of reaction equilibrium, but excessive free fatty acid could also result in substrate inhibition.10,25,28 In the present experimental setup, the substrate mole ratio had a positive influence on the ester yield and it was found that the acid did not deactivate the catalyst at concentrations up to 1.25 mol dm–3.
a) b)
c) d)
Fig. 3. Correlation of the calculated versus the experimental values for the synthesis of
pentyl 2-methylpropanoate catalyzed by lipase from C. rugosa.
The response surface plot for the predicted values for the yield of ester ver-sus temperature and catalyst concentration after 26 h at a fixed substrate mole ra-tio of 1.5 are shown in Fig. 3c. It appears that predicted yield of ester increased with increasing enzyme concentration at all temperatures. For an illustration, at 55 °C, the response varied from 21.2 to 68.3 % on increasing the enzyme con-centration from 1–5 g dm–3 (1.5–7.5 IU cm–3). A similar behavior was observed during the Rhizopus lipase-catalyzed synthesis of 3-methylbutyl butanoate, since an increase in yield by 32.2 % was recorded when the amount lipase was chan-ged from 1 to 10 %.29 Therefore, to maximize the ester yield, the enzyme con-centration must be kept at the highest tested levels.

ENZYMATIC SYNTHESIS OF FLAVOR ESTERS 1149
Similar trends were observed for the interaction of both enzyme concentra-tion and substrate mole ratio versus reaction time. However, the most interesting result of the part of study focused on the statistically analyzed influence of en-zyme concentration and mole ratio in a 3-dimensional graph (Fig. 3d). In addi-tion, the contour plot could also indicate the desirable combination of variables, which can be selected by the manufacturer, because there were several optimal combinations available to obtain the highest ester yield (Fig. 4). The ester pro-duction is represented by a concave surface described by a second order polyno-mial with a minimum at an enzyme concentration of about 1.2 g dm–3 (3.6 IU cm–3) for a mole acid/alcohol ratio equal to 0.8. Figure 4 shows the contour plot for the predicted values for the yield of ester versus catalyst concentration and substrate mole ratio after 26 h at 35 °C. The results indicate that high yields are possible with small amounts of enzyme when high substrate mole ratio levels are used,
which is beneficial from the economic viewpoint since the cost of enzyme is usu-ally higher than that of substrates. In general, for enzymatic esterification reac-tions, the lipase concentrations required to achieve higher yields of esters are often too high and the reaction times relatively too long for industrial application. Welsh et al.4 reported 75.8 % conversion in 48 h with 2 % native lipase from C. cylindracea at 0.050 M substrate (the E/S ratio was 400 g mol–1). Chowdary et al.30 reported an 85 % conversion of 3-methylbutanoic acid to 3-methylbutyl 3-me-thylbutanoate with 0.50 M acid concentration and 1.0 % enzyme concentration during an incubation time of 144 h in n-hexane (the E/S ratio was 20), by using Lipozyme IM-20 lipase from R. miehei. In this study, it was shown that a high conversion of 91.9 % could be achieved at 0.50 M alcohol concentration (sub-strate in deficit), using amounts of enzyme as low as 4.0 g dm–3 and in a relati-vely short time (26 h) at 35 °C at a fixed acid/alcohol mole ratio of 2.5, as can be inferred from the contour plot in Fig. 4. Namely, under this condition (E/S ratio of ≈ 8 g mol–1), a rather high ester concentration of around 70 g dm–3 was
Fig. 4. Contour plot for the yield of ester as a function of enzyme concen-tration and substrate mole ratio after 26 h at 35 °C.

1150 KNEŽEVIĆ-JUGOVIĆ et al.
achieved, which was in the proximity of results previously reported in related studies28,30 or much higher.4,5,31 The feasibility of the ester synthesis by C. ru-gosa lipase under solvent-free condition was also explored, and a reasonably high yield of esters (62 %) was achieved under optimal conditions (data not shown).
CONCLUSIONS
The aim of this work was to evaluate the performance of lipase from C. ru-gosa in the synthesis of pentyl 2-methylpropanoate using a reaction system of in-terest from an industrial point of view. A surface response methodology based on CCRD design was employed to study the effects of the five most important fac-tors influencing the yield of ester. An ester yield response equation was obtained, making it possible to predict the operating conditions required to obtained well- -defined amounts of the ester. It seems that the lipase concentration, reaction time and substrate mole ratio have positive influences on the ester synthesis while the temperature and reaction time–temperature interaction have negative influences on the process. It appears that high yields of esters are possible with small amounts of enzyme when high substrate mole ratios are used, which is beneficial from the economic viewpoint. These findings should stimulate the application of such li-pase-catalyzed reactions for the preparation of food acceptable short chain esters. Further studies should be concentrated on improvement of the lipase stability by its immobilization and extension of its application to other non-aqueous and sol-vent-free reaction systems.
Acknowledgements. The authors thank Ministry of Science and Technological Develop-ment of the Republic of Serbia for the financial support (Project: TR-20064).
И З В О Д
СИНТЕЗА МИРИСНИХ ЕСТАРА КАТАЛИЗОВАНА ЛИПАЗАМА У НЕВОДЕНОЈ СРЕДИНИ: ОПТИМИЗАЦИЈА ПРИНОСА ПЕНТИЛ-2-МЕТИЛПРОПАНОАТА
СТАТИСТИЧКОМ АНАЛИЗОМ
ЗОРИЦА КНЕЖЕВИЋ-ЈУГОВИЋ1, ДЕЈАН БЕЗБРАДИЦА1, ЖИВАНА ЈАКОВЉЕВИЋ2,
СУЗАНА БРАНКОВИЋ-ДИМИТРИЈЕВИЋ1 и ДУШАН МИЈИН1
1Tehnoloko–metalurki fakultet, Univerzitet u Beogradu, Karnegijeva 4, 11120 Beogad i 2Mainski fakultet, Univerzitet u Beogradu, Kraqice Marije 16, 11120 Beograd
У раду су испитани утицаји различитих процесних параметара на синтезу пентил-2-ме-тилпропаноата катализовану липазом из Candida rugosa. У циљу оптимизације ензимске син-тезе естара примењена је методологија одзивних површина у складу са одабраним централ-ним композиционим ротабилним планом (пет фактора на пет нивоа). Испитани су утицаји про-цесних параметара на принос естра у следећим интервалима: почетног садржаја воде (0,0–2,0 %), температуре (35–75 C), концентрације ензима (1,0–5,0 g dm-3), почетног молског удела суп-страта (1:2–5:2) и реакционог времена (4–48 h). Добијен је адекватан математички модел на основу кога се може предвидети понашање система у функцији ових пет фактора. Показано је да концентрација ензима, почетни молски однос супстрата и реакционо време имају нај-

ENZYMATIC SYNTHESIS OF FLAVOR ESTERS 1151
већи утицај на процес, док садржај воде не утиче значајно на принос естра. Под оптималним условима ензимске синтезе остварен је принос естра око 92 %.
(Примљено 19. марта, ревидирано 3. јуна 2008)
REFERENCES
1. M. Liaquat, R. K. Owusu, Food Chem. Toxicol. 65 (2000) 295 2. U. Krings, R. G. Berger, Appl. Microbiol. Biotechnol. 49 (1998) 1 3. F. W. Welsh, R. E. Williams, Enzym. Microb. Technol. 12 (1990) 743 4. F. W. Welsh, R. E. Williams, K. H. Dawson, J. Food Sci. 55 (1990) 1679 5. H. Razafindralambo, C. Blecker, G. Lognoy, M. Marlier, J. P. Wathlet, M. Severin,
Biotechnol. Lett. 16 (1994) 247 6. S. Benjamin, A. Pandey, Yeast 14 (1998) 1069 7. D. Bezbradica, I. Karalazić, N. Ognjanović, D. Mijin, S. S. Marinković, Z. Knežević, J.
Serb. Chem. Soc. 71 (2006) 31 8. Z. Knežević, S. S. Marinković, L. Mojović, Appl. Microbiol. Biotechnol. 49 (1998) 267 9. J. P. Chen, J. Ferment. Bioeng. 82 (1996) 404
10. G. Carta, J. L. Gainer, A. H. Benton, Biotechnol. Bioeng. 37 (1991) 1004 11. D. Bezbradica, D. Mijin, S. S. Marinković, Z. Knežević, J. Mol. Catal. B: Enzym. 38
(2006) 11 12. B. Manohar, S. Divakar, Process Biochem. 39 (2004) 847 13. C. J. Shieh, S. W. Chang, J. Agric. Food Chem. 49 (2001) 1203 14. S. H. Krishna, B. Manohar, S. Divakar, S. G. Prapulla, N. G. Karanth, Enzym. Microb.
Technol. 26 (2000) 131 15. B. Manohar, S. Divakar, World J. Microbiol. Biotechnol. 18 (2002) 745 16. I. L. Shih, S. H. Hung, F. Y. Chen, H. Y. Ju, C. J. Shieh, Food Chem. 100 (2007) 1223 17. S. H. Chiou, W. T. Wu, Biomaterials 25 (2004) 197 18. Z. Knežević, L. Mojović, B. Adnađević, J. Serb. Chem. Soc. 63 (1998) 257 19. J. M. Moreno, J. V. Sinisterra, J. Mol. Catal. 93 (1994) 357 20. O. H. Lowry, N. J. Resebrough, A. L. Farr, R. J. Randall, J. Biol. Chem. 193 (1951) 265 21. N. Tietz, E. Fiereck, Clin. Chim. Acta 13 (1966) 352 22. G. E. P. Box, W. G. Hunter, J. S. Hunter, Statistics for experimenters: an introduction to
design, data analysis and model building, Wiley, New York, 1978, p. 653 23. F. M. Gomes, E. B. Pereira, H. F. Castro, Biomacromolecules 5 (2004) 17 24. Z. Knežević, N. Milosavić, D. Bezbradica, Ž. Jakovljević, R. Prodanović, Biochem. Eng.
J. 30 (2006) 269 25. A. Zaidi, J. L. Gainer, G. Carta, A. Mrani, T. Kadiri, Y. Belarbi, A. Mir, J. Biotechnol. 93
(2002) 209 26. J. M. Rodriguez-Nogales, E. Roura, E. Contreras, Process Biochem. 40 (2005) 63 27. G. D. Yadav, P. S. Lathi, Biochem. Eng. J. 16 (2003) 245 28. S. H. Krishna, S. G. Prapulla, N. G. Karanth, J. Ind. Microbiol. Biotechnol. 25 (2000) 147 29. G. A. Macedo, G. M. Pastore, M. I. Rodrigues, Process Biochem. 39 (2004) 687 30. G. V. Chowdary, M. N. Ramesh, S. G. Prapulla, Process Biochem. 36 (2000) 331 31. G. Langrand, N. Rondot, C. Triantaphylides, J. Baratti, Biotechnol. Lett. 18 (1990) 581.


J. Serb. Chem. Soc. 73 (12) 1153–1160 (2008) UDC 546.732+547.582.4:615.281–188 JSCS–3794 Original scientific paper
doi: 10.2298/JSC0812153P 1153
Antibacterial activity of cobalt(II) complexes with some benzimidazole derivatives
S. O. PODUNAVAC-KUZMANOVIĆ1*#, V. M. LEOVAC2# and D. D. CVETKOVIĆ1 1Faculty of Technology, Bul. Cara Lazara 1, 21000 Novi Sad and 2Department of Chemistry,
Faculty of Sciences, Trg D. Obradovića 3, 21000 Novi Sad, Serbia
(Received 21 March, revised 26 May 2008)
Abstract: The antibacterial activities of cobalt(II) complexes with two series of benzimidazoles were evaluated in vitro against three Gram-positive bacterial strains (Bacillus cereus, Staphylococcus aureus, and Sarcina lutea) and one Gram-negative isolate (Pseudomonas aeruginosa). The minimum inhibitory con-centration was determined for all the complexes. The majority of the investti-gated complexes displayed in vitro inhibitory activity against very persistent bacteria. They were found to be more active against Gram-positive than Gram-ne-gative bacteria. It may be concluded that the antibacterial activity of the com-pounds is related to the cell wall structure of the tested bacteria. Comparing the inhibitory activities of the tested complexes, it was found that the 1-substituted--2-aminobenzimidazole derivatives were more active than complexes of 1-sub-stituted-2-amino-5,6-dimethylbenzimidazoles. The effect of chemical structure on the antibacterial activity is discussed.
Keywords: benzimidazole derivatives; complexes; cobalt(II); antibacterial; in vitro studies.
INTRODUCTION
The benzimidazole nucleus, which is a useful structure for further research and for the development of new pharmaceutical molecules, has received a great deal of attention in the last decade. Due to their antimicrobial activities, new benzimidazoles have been synthesized and investigated for medical applications. The position and type of the substituents on the benzimidazole ring are respon-sible for the variety of their biological activities. Many derivatives of benzimi-dazole are well known as antibacterial agents.1–7 This class of compounds has been found to show antimicrobial activities against Gram-positive and Gram-ne-gative bacteria, primarily because of the potential bio-activity of benzimidazole- -based ligands.8–10 Hence, the incorporation of imidazole and benzimidazole nuclei is an important synthetic strategy in drug discovery.
* Corresponding author. E-mail: [email protected] # Serbian Chemical Society member.

1154 PODUNAVAC-KUZMANOVIĆ, LEOVAC and CVETKOVIĆ
Extensive biochemical and pharmacological activities have confirmed that these molecules are effective against RNA viruses and inhibit the formation of virus-induced RNA polymerase, thereby preventing or retarding RNA synthesis of various strains of microorganisms.11–14 Antimicrobial activity of this class of compounds against Helicobacter pylori15 and oral Streptococci16 has also been reported. The synthesis of benzimidazoles fused to another heterocyclic ring has attracted widespread attention due to their diverse application as antioxidant,17,18 antifungal,19 antitubercular,20 anticancer,21,22 and antiallergic drugs.23 Various benz-imidazoles are also effective inhibitors of the growth of the HIV-virus.24,25
In the last period, possible therapeutical properties of metal complexes with derived benzimidazoles have also excited wide interest. It was found that the complexes of transition metal salts with benzimidazole derivatives showed greater antimicrobial activity than the ligands applied alone.26
The development of resistance to current antibacterial therapy continues to drive the search for more effective agents. In order to obtain more potent com-pounds, our previous studies4–9 prompted us to investigate the antibacterial acti-vity of cobalt(II) complexes containing 1-benzylbenzimidazoles against three Gram-positive bacterial strains and one Gram-negative isolate. The effect of the ligand and complex structure on the inhibitory activity of tested compounds was also examined.
EXPERIMENTAL
In the present study, the antibacterial activity of cobalt(II) complexes with the following starting ligands: 2-amino-1-(3-chlorobenzyl)benzimidazole (L1), 2-amino-1-(3-fluorobenzyl)–benzimidazole (L2), 2-amino-1-(3-chlorobenzyl)-5,6-dimethylbenzimidazole (L3), 2-amino-1--(3-fluorobenzyl)-5,6-dimethylbenzimidazole (L4) and 2-amino-5,6-dimethyl-1-(3-methylben-zyl)benzimidazole (L5), was evaluated (Table I).
TABLE I. Structural formulae of the ligands
Series I
R1 R2 R3 R4 L1 –m-Cl NH2 H H L2 –m-F NH2 H H
Series II L3 –m-Cl NH2 CH3 CH3 L4 –m-F NH2 CH3 CH3 L5 –m-CH3 NH2 CH3 CH3

ANTIBACTERIAL ACTIVITY OF COBALT(II) COMPLEXES 1155
All the ligands were synthesized by Vlaović et al. according to a procedure described earlier.27 The cobalt(II) complexes were prepared following the same procedure described in a previous paper.7
Antibacterial investigations
All the cobalt(II) complexes were tested for their in vitro growth inhibitory activity against Bacillus cereus ATCC 10876, Staphylococcus aureus ATCC 25923, Sarcina lutea ATCC 9341 and Pseudomonas aeruginosa ATCC 27853.
The antibacterial activities of the complexes were tested by the disc-diffusion method under standard conditions using Mueller-Hinton agar medium, as described by NCCLS.28 Each of the investigated isolates of bacteria was seeded in tubes with nutrient broth (NB). 1 cm3 of seeded NB was homogenized in tubes with 9 cm3 of melted (45 °C) nutrient agar (NA). The homogenous suspension was poured out in Petri dishes. The discs of filter paper (dia-meter 5 mm) were ranged on the cool medium. After cooling on the formed solid medium, 0.02 cm3 of the investigated compounds (c = 1000 g/ml) were placed by micropipette. After incubation of 24 h at 25–27 °C, the inhibition (sterile) zone diameters (including disc) were measured (in mm). An inhibition zone diameter over 8 mm indicates the tested compound is active against the microorganism. Every test was done in triplicate. Antimicrobial activities of the free ligands against the same bacteria were tested in a previous study.8
Minimum inhibitory concentration (MIC) was determined by the agar dilution method according to guidelines established by the NCCLS standard M7-A5.29 The MIC is described as the lowest concentration of a compound that visibly inhibited the growth of a colony. Stock solutions of the compounds were prepared in dimethylformamide (DMF). Further dilutions were performed with distilled water. The concentration range of the compounds tested was between 60–750 g/ml in two-fold dilution steps. The inoculated plates were than incubated at 35 °C for 16–20 h. A control using DMF without any test complex was included for each or-ganism. It was found that the solvent had no activity against any of the test micro-organisms.
RESULTS AND DISCUSSION
The results of the antibacterial studies of the cobalt(II) complexes with the two series of 1-benzylbenzimidazole derivatives tested by the agar disc-diffusion method are summarized in Table II.
TABLE II. In vitro antibacterial activity of the complexes at a concentration of 1000 g/ml
Inhibition zone diameter, mm Complex Pseudomonas
aeruginosa Bacillus cereus
Staphylococcus aureus
Sarcina lutea
Co(L1)2Cl2 22 26 26 29 Co(L2)2Cl2 17 24 24 25 Co(L3)2Cl2 9 17 17 18 Co(L4)2Cl2 8 16 17 17 Co(L5)2Cl2 5 16 17 16
It is evident that the majority of the investigated compounds displayed in vitro antimicrobial activity against very persistent micro-organisms. The investi-gated complexes were found to be more active against Gram-positive than Gram-negative bacteria (P. aeruginosa). In the case of Gram-negative isolate, only com-

1156 PODUNAVAC-KUZMANOVIĆ, LEOVAC and CVETKOVIĆ
plexes of ligands from Series I exhibited significant antibacterial activity. The cobalt(II) complexes of L3, L4 and L5 were slightly active against P. aeruginosa. In the case of B. cereus and S. aureus, the cobalt(II) complexes of ligands L1 and L2 also expressed higher activity than the complexes of ligands from Series II. The Gram-positive bacterium S. lutea was persistent in all investigated cases. The cobalt(II) complexes containing L1 and L2 were very highly or highly active, respectively. On the other hand, complexes of L3, L4 and L5 were moderately active against the same bacteria.
In the second phase, the MIC of the tested compounds was determined by the agar dilution method. The results are presented in Tables III–VI. The com-pounds which are not shown in the tables had no antibacterial activity at the tested concentration.
TABLE III. Antibacterial activities of the complexes against P. aeruginosa at different con-centrations (inhibition zone diameter in mm)
MIC / g ml-1 Complex
750 500 250 125 62.5 Co(L1)2Cl2 18 8 5 0 0 Co(L2)2Cl2 15 6 0 0 0 Co(L3)2Cl2 5 0 0 0 0 Co(L4)2Cl2 5 0 0 0 0 Co(L5)2Cl2 0 0 0 0 0
From the results presented in Table III, it is seen that cobalt(II) complex containing L1 was active against P. aeruginosa with a MIC value of 250 g/ml, whilst Co(L2)2Cl2 was less toxic with a MIC value of 500 g/ml. However, Co(L3)2Cl2 and Co(L4)2Cl2 had the same activity with a MIC value of 750 g/ml, but the complex of L5 had a low activity against the same bacteria.
TABLE IV. Antibacterial activities of the complexes against B. cereus at different concen-trations (inhibition zone diameter in mm)
c / g ml-1 Complex
750 500 250 125 62.5 Co(L1)2Cl2 20 16 10 5 0 Co(L2)2Cl2 19 14 8 3 0 Co(L3)2Cl2 14 9 4 0 0 Co(L4)2Cl2 12 7 4 0 0 Co(L5)2Cl2 11 5 0 0 0
In the case of B. cereus and S. aureus (Tables IV and V, respectively), the complexes containing ligands of Series I were more active (MIC = 125 g/ml) than the complexes of second series. Co(L3)2Cl2 had the same activity as Co(L4)2Cl2 with a high MIC value of 250 g/ml against the same bacteria, whilst the complex containing L5 expressed a MIC value of 500 g/ml.

ANTIBACTERIAL ACTIVITY OF COBALT(II) COMPLEXES 1157
TABLE V. Antibacterial activities of the complexes against S. aureus at different concen-trations (inhibition zone diameter in mm)
c / g ml-1 Complex
750 500 250 125 62.5 Co(L1)2Cl2 20 15 9 4 0 Co(L2)2Cl2 19 13 8 3 0 Co(L3)2Cl2 14 9 5 0 0 Co(L4)2Cl2 13 9 4 0 0 Co(L5)2Cl2 12 6 0 0 0
On the other hand, the complexes of both series were more active against S. lutea (Table VI). The complex of L3 with a MIC value of 125 g/ml had the same activity as Co(L4)2Cl2 but the complexes of Series I were more active and a MIC value of 62.5 g/ml was obtained. Co(L5)2Cl2 had the lowest activity against this Gram-positive bacterium (MIC = 250 g/ml).
TABLE VI. Antibacterial activities of the complexes against S. lutea at different concen-trations (inhibition zone diameter in mm)
c / g ml-1 Complex
750 500 250 125 62.5 Co(L1)2Cl2 25 20 16 8 5 Co(L2)2Cl2 21 17 14 7 3 Co(L3)2Cl2 14 10 7 3 0 Co(L4)2Cl2 13 9 5 3 0 Co(L5)2Cl2 11 7 3 0 0
Comparing the activities of the tested complexes, it was found that the 1-sub-stituted-2-aminobenzimidazole derivatives (L1, L2) formed cobalt(II) complexes which were more active than the complexes of the 1-substituted-2-amino-5,6-di-methylbenzimidazoles (L3, L4, L5). It can be concluded that the basic antibac-terial activity of the benzimidazoles was produced by the presence of an amino group at position 2 of the benzimidazole ring. Simultaneously, methyl groups at the 5 or 6 positions decreased the general antibacterial activity of the relevant benzimidazoles. Also, the antibacterial results show that if the benzimidazole nucleus was substituted with a 3-chlorobenzyl group at the N1 atom, the anti-bacterial activity was increased.
By comparing the antimicrobial activity of the ligands8 and their complexes, it was found that the complexes were more effective against all bacteria. This is the result of the coordinated cobalt which plays a significant role for the anti-bacterial activity. The chelation theory explains that a decrease in the polarizabi-lity of the metal can change the lipophilicity or hydrophobicity of complexes. These properties are now seen as important parameters related to membrane permeation in biological systems. Many of the processes of drug disposition depend on the ability or inability to cross membranes and hence there is a high correlation with

1158 PODUNAVAC-KUZMANOVIĆ, LEOVAC and CVETKOVIĆ
measures of lipophilicity. Moreover, many of the proteins involved in drug dis-position have hydrophobic binding sites, further adding to the importance of lipo-philicity.
By consideration of the structures of compounds that exhibit antimicrobial activity, it can be concluded that substituted ligands and the metal moiety may play a role in determining the antibacterial activity. From the results which in-dicated that the tested compounds were more active against Gram-positive than Gram-negative bacteria, it may be concluded that the inhibitory activity of the studied compounds is related to the cell wall structure of the bacteria. This is pos-sible because the cell wall is essential to the survival of bacteria and some anti-biotics are able to kill bacteria by inhibiting a step in the synthesis of peptido-glycan. Gram-positive bacteria possess a thick cell wall containing many layers of peptidoglycan and teichoic acids, but in contrast, Gram-negative bacteria have a relatively thin cell wall consisting of a few layers of peptidoglycan surrounded by a second lipid membrane containing lipopolysaccharides and lipoproteins. These differences in cell wall structure can produce differences in antibacterial suscep-tibility and some antibiotics can kill only Gram-positive bacteria and is ineffec-tive against Gram-negative pathogens.30
CONCLUSIONS
The antibacterial activity of cobalt(II) complexes with two series of 1-ben-zylbenzimidazole derivatives was tested against very persistent microorganisms: Pseudomonas aeruginosa, Bacillus cereus, Staphylococcus aureus and Sarcina lutea. All the complexes displayed in vitro inhibitory activity, but the 1-substitu-ted-2-aminobenzimidazole derivatives formed cobalt(II) complexes which were more active than the complexes of the 1-substituted-2-amino-5,6-dimethylbenz-imidazoles. The basic antibacterial activity of the benzimidazoles was produced by the presence of an amino group at position 2 of the benzimidazole ring. Me-thyl groups at the 5 or 6 position decreased the general antibacterial activity of the relevant benzimidazole. Also, the results indicated that the tested complexes were more active against Gram-positive than Gram-negative bacteria. It may be concluded that the antibacterial activity of the compounds is related to the cell wall structure of the bacteria. This is possible because the cell wall is essential to the survival of many bacteria and some antibiotics are able to kill bacteria by inhibiting a step in the synthesis of peptidoglycan.
Acknowledgement. These results are the part of the project No. 142028, supported by the Ministry of Science of the Republic of Serbia.

ANTIBACTERIAL ACTIVITY OF COBALT(II) COMPLEXES 1159
И З В О Д
АНТИБАКТЕРИЈСКА АКТИВНОСТ КОБАЛТ(II)-КОМПЛЕКСА СА НЕКИМ ДЕРИВАТИМА БЕНЗИМИДАЗОЛА
С. О. ПОДУНАВАЦ-КУЗМАНОВИЋ1, В. М. ЛЕОВАЦ2 и Д. Д. ЦВЕТКОВИЋ1
1Tehnoloki fakultet, Bulevar Cara Lazara 1, 21000 Novi Sad i 2Departman za hemiju, PMF,
Trg Dositeja Obradovia 3, 21000 Novi Sad
Испитана је in vitro антибактеријска активност кобалт(II) комплекса са две серије бенз-имидазола према три грам-позитивне бактерије (Bacillus cereus, Staphylococcus aureus и Sar-cina lutea) и једној грам-негативној бактерији (Pseudomonas aeruginosa). За све комплексе одређена је минимална инхибиторна концентрација. Већина испитиваних комплекса показала је in vitro инхибиторну активност према веома отпорним бактеријама. Утврђено је да испити-вани комплекси показују већу активност према грам-позитивним него према грам-негативној бактерији, што указује на то да антибактеријска активност једињења зависи од грађе ћелијског зида. Поређењем инхибиторне активности тестираних комплекса дошло се до закључка да су комплекси дериватa 1-супституисаних-2-аминобензимидазола aктивнији од дериватa 1-супсти-туисаних-2-амино-5,6-диметилбензимидазола. Продискутован је утицај хемијске структуре на антибактеријску активност.
(Примљено 21. марта, ревидирано 26. маја 2008)
REFERENCES
1. Z. Kazimiercyuk, J. A. Upcroft, P. Upcroft, A. Gorska, B. Starosciak, A. Laudy, Acta Biochim. Polon. 49 (2002) 185
2. H. Goker, C. Kus, D. W. Boykin, S. Yildiz, N. Altanlar, Bioorg. Med. Chem. 17 (2007) 2233
3. O. G. Ozden, T. Erdogan, H. Goker, S. Yildiz, Bioorg. Med. Chem. 13 (2005) 1587 4. S. O. Podunavac-Kuzmanović, D. M. Cvetković, Centr. Eur. J. Occupat. Environ. Med.
12 (2006) 55 5. S. O. Podunavac-Kuzmanović, S. L. Markov, Centr. Eur. J. Occupat. Environ. Med. 12
(2006) 61 6. N. U. Perišić-Janjić, S. O. Podunavac-Kuzmanović, J. S. Balaž, Đ. Vlaović, J. Planar
Chromatogr. 13 (2000) 123 7. S. O. Podunavac-Kuzmanović, V. M. Leovac, N. U. Perišić-Janjić, J. Rogan, J. Balaž, J.
Serb. Chem. Soc. 64 (1999) 381 8. S. O. Podunavac-Kuzmanović, D. Cvetković, J. Serb. Chem. Soc. 75 (2007) 459 9. S. O. Podunavac-Kuzmanović, S. L. Markov, D. J. Barna, J. Theor. Comput. Chem. 6
(2007) 687 10. H. Kucukbay, R. Durmaz, E. Orhan, S. Gunal, Farmaco 58 (2003) 431 11. V. K. Pandey, M. Upadhay, V. Dev Gupta, M. Tandon, Acta Pharm. 55 (2005) 47 12. L. Garuti, M. Roberti, C. Cermelli, Bioorg. Med. Chem. Lett. 9 (1999) 2525 13. V. K. Pandey, M. N. Joshi, M. Tandon, S. K. Bajpai, Acta Pharm. 50 (2000) 293 14. V. K. Pandey, Z. Tusi, S. Tusi, M. N. Joshi, S. K. Bajpai, Indian J. Heterocycl. Chem.
111 (2002) 309 15. L. Gata, F. Perna, N. Figura, C. Ricci, J. Holton, L. DAnna, M. Miglioli, D. Vaira, J.
Antimicrob. Chemother. 51 (2003) 439

1160 PODUNAVAC-KUZMANOVIĆ, LEOVAC and CVETKOVIĆ
16. P. T. M. Nguyen, J. D. Baldeck, J. R. Olsson, R. E. Marquis, Oral Microbiol. Immunol. 20 (2005) 93
17. C. Kus, G. Ayhan-Kilcigil, B. Can-Eke, M. Iscan, Arch. Pharm. Res. 27 (2004) 156 18. G. Ayhan-Kilcigil, C. Kus, T. Coban, B. Can-Eke, M. Iscan, J. Enzyme Inhib. Med.
Chem. 19 (2004) 129 19. G. Ayhan-Kilcigil, N. Altanlar, Turk. J. Chem. 30 (2006) 223 20. B. G. Mohamed, M. A. Hussein, A. M. Abdel-Alim, M. Hashem, Arch. Pharm. Res. 29
(2006) 26 21. S. A. El-Hawash, E. A. Badawey, T. Kappe, Pharmazie 54 (1999) 341 22. K. J. Soderlind, B. Gorodetsky, A. Singh, N. Bachur, G. Miller, J. Lown, Anti-Cancer
Drug Des. 14 (1999) 19 23. H. Nakano, T. Inoue, N. Kawasaki, H. Miyataka, H. Matsumoto, T. Taguchi, N. Inagaki,
H. Nagai, T. Satoh, Chem. Pharm. Bull. 47 (1999) 1573 24. S. Demirayak, U. Abu-Mohsen, A. Cagri Karaburun, Eur. J. Med. Chem. 37 (2002) 255 25. S. M. Rida, S. A. El-Hawash, H. T. Fahmy, A. A. Hazzaa, M. M. El-Meligy, Arch.
Pharm. Res. 29 (2006) 826 26. F. Gumus, O. Algul, G. Eren, H. Eroglu, N. Diril, S. Gur, A. Ozkul, Eur. J. Med. Chem.
38 (2003) 303 27. Đ. Vlaović, J. Čanadanović-Brunet, J. Balaž, I. Juranić, D. Đoković, K. Mackenzie,
Biosci., Biotechnol., Biochem. 56 (1992) 199 28. National Committee for Clinical Laboratory Standards, NCCLS Approval Standard
Document M2-A7, Vilanova, PA, 2000 29. National Committee for Clinical Laboratory Standards, NCCLS Approval Standard
Document M7-A5, Vilanova, PA, 2000 30. A. L. Koch, Clin. Microbiol. Rev. 16 (2003) 673.

J. Serb. Chem. Soc. 73 (12) 1161–1167 (2008) UDC 54+582.33:547.261:547.56 JSCS–3795 Original scientific paper
doi: 10.2298/JSC0812161J 1161
HPLC–DAD of phenolics in bryophytes Lunularia cruciata, Brachytheciastrum velutinum and Kindbergia praelonga NEBOJŠA JOCKOVIĆ1, PAULA B. ANDRADE2, PATRÍCIA VALENTÃO2
and MARKO SABOVLJEVIĆ3*
1Institute of Pharmaceutical Biology, Martin-Luther-University Halle-Wittenberg, Hoher Weg 8, 06120 Halle/Saale, Germany, 2Requimte, Institute of Pharmacognosy,
Faculty of Pharmacy, University of Oporto, Rua Aníbal Cunha, 4050-047, Porto, Portugal and 3Institute of Botany and Garden, Faculty of Biology, University of
Belgrade, Takovska 43, 11000 Belgrade, Serbia
(Received 27 March, revised 30 May 2008)
Abstract: The chemistry of bryophytes is not well known. The available data indicate interesting chemical constitutions of some bryophyte species, i.e., ac-tive and new compounds are to be found within bryophytes, especially liver-worts. In this study, one liverwort and two moss species were studied: Lunu-laria cruciata (L.) Dumort, Brachytheciastrum velutinum (Hedw) Ignatov & Huttunen and Kindbergia praelonga (Hedw) Ochyra. The phenolic compo-sitions of these bryophyte species have not hitherto been reported. Their metha-nolic extracts were analyzed by reversed-phase HPLC, coupled to a diode-array detector (DAD). Luteolin-7-O-glucoside and quercetin were found in the L. cruciata extract. The extract obtained from B. velutinum contained four phe-nolic acids (4-O-caffeoylquinic, 5-O-caffeoylquinic, caffeic and ellagic acids) and three flavonoids (apigenin-7-O-glucoside, luteolin and apigenin). The K. praelonga extract was characterized by the presence of several phenolic acids and their derivatives (4-O-caffeoylquinic, 5-O-caffeoylquinic, caffeic, p-cou-maric, ferulic and ellagic acids, and caffeic and p-coumaric acid derivatives) and three flavonoids (apigenin-7-O-glucoside, luteolin, apigenin and an un-identified flavanone).
Keywords: bryophytes; phenolics; Lunularia cruciata; Brachytheciastrum velu-tinum; Kindbergia praelonga.
INTRODUCTION
Bryophytes (mosses, liverworts and hornworts) with approximately 15,000––25,000 species1 are, after flowering plants, worldwide the most diverse plant group. They are to be found in all ecosystems, from desert to alpine, except ma-rine, and the bryophyte biomass productivities can vary in each ecosystem, from
* Corresponding author. E-mail: [email protected]

1162 JOCKOVIĆ et al.
negligible to the most significant producers. However, the ecological role of bryophytes in any ecosystems is significant.
The chemistry of bryophytes is poorly known and the results on are very scattered.2–4 The reason for this is the difficulty in identification and small amount of the same species available for analyses, usually by sophisticated me-thods. Liverworts are very interesting for chemical analysis due to their oil bo-dies containing many scientifically new compounds.
However, worldwide bryophytes are known to be used in ethno-botany and are applied to cure diseases, threat to plants and animals, or in the household.5–7 Therefore, bryophytes are indicated as a source of chemically new and unknown compounds.3,4,8–10 Studies of the chemical constituents of bryophytes were re-cently performed but are still inadequate and neglected.2,11–18 These data help in the systematics of barely morphologically classified bryophytes.19 Also, some scattered data on the biological activities of bryophyte extracts and/or chemical constituents are available for not very many bryophyte taxa.20–23
Generally, based on the species studied to date, bryophytes are known to possess extremely high amounts of terpenoids, phenolics (flavonoids and biben-zyl derivatives), glycosides, fatty acids and also some rare aromatic compounds. Bryophytes are considered as a “remarkable reservoir” of new, natural products or secondary compounds, many of which have shown interesting biological acti-vity. These activities of bryophytes include antimicrobial, antifungal, cytotoxic, antitumor, vasopressin (VP) antagonist, cardiotonic, allergy causing, irritancy and tumour effecting, insect anti-feedant, insecticidal, molluscicidal, pesticidal, plant growth regulatory, superoxide anion radical release inhibition and 5-lipo-xygenase, calmodulin, hyaluronidase and cyclooxygenase inhibition features. Some latest results also predict a beneficial influence of bryophytes in AIDS therapy (some bibenzyls of liverworts).24–36
The liverwort Lunularia cruciata, a Mediterranean Atlantic species, expres-ses antimicrobial and, to a less extent, antifungal activities.37–39 The plant- -growth-regulator lunularic acid was isolated for the first time from this spe-cies.40 The chemical constituents of L. cruciata are unknown.4,41
The palearctic mosses Brachytheciastrum velutinum and Kindbergia prae-longa have hitherto not been chemically screened; nor are their bioactive effects known.4
EXPERIMENTAL
Samples
Fresh material was collected in July 2003 in the Oporto City Park (Portugal). A voucher of each Bryophyte sample is deposited in the Bryophyte Collection of Belgrade University (BEOU).
The material was cleaned and dried to constant weight at room temperature.

HPLC–DAD OF PHENOLICS IN BRYOPHYTES 1163
Extraction of phenolics
5 g dry mass of each bryophyte sample was used for the extraction of the phenolics. The material was previously ground in an electric mill to a rough powder. The extraction consisted of two consecutive steps employing 175 and 125 mL methanol, respectively, on a magnetic stirrer for 10 min. These two extracts were combined and the solvent removed under reduced pressure at 30 °C To this residue, 20 mL of 2.0 M HCl were added and the obtained solution was passed through a C18 Bond Elut cartridge, preconditioned with methanol and 2.0 M HCl. The retained phenolics were eluted with methanol. This solution was taken to dryness under reduced pressure (30 °C), dissolved in methanol and 20 µL were analyzed by HPLC–DAD.
HPLC–DAD analysis of the phenolics
The extracts were analyzed on an analytical HPLC instrument (Gilson), using a Sphe-risorb ODS2 column (25.0 cm0.46 cm; 5 µm particle size Waters, Milford, MA, USA) with a C18 ODS guard column. The mobile phase consisted of solvent A (water–formic acid (19:1)) and solvent B (methanol) (Table I).
The flow rate was 0.9 mL/min and the injection volume 20 μL. Detection was performed using a Gilson diode array detector. The phenolic compounds in each sample were identified by comparing their retention times and UV–Vis spectra in the 200–600 nm range with in-dividual standards. The chromatograms were registered at 280, 320 and 350 nm.
TABLE I. Gradient flow
Time, min Solvent A content, % Solvent B content, % 0.00 95 5 3.00 85 15 13.00 75 25 25.00 70 30 35.00 65 35 39.00 60 40 42.00 55 45 44.00 50 50 47.00 45 55 50.00 30 70 56.00 25 75 60.00 0 100 62.00 5 95
RESULTS AND DISCUSSION
The chromatogram of the methanol extract of Lunularia cruciata is pre-sented in Fig. 1. Based on a comparison of the retention time (Rt) and UV–Vis spectra with standard substances, the presence of the flavonoid heteroside luteo-lin-7-O-glucoside and the flavonoid aglycone quercetin was confirmed. The pre-sence of these two compounds is for the first time reported in L. cruciata.
The chromatogram of the methanol extract of Brachytheciastrum velutinum is presented in Fig. 2. The following substances were evidenced as constituents of this species: phenolic acids, i.e., 4-O-caffeoylquinic, 5-O-caffeoylquinic, caf-feic and ellagic acid, flavonoids, i.e., heteroside apigenin-7-O-glucoside, and fla-vonoid aglycones, i.e., luteolin and apigenin.

1164 JOCKOVIĆ et al.
0 20 40 60
0.0
0.2
21
Inte
nsity
, a.
u.
/ min
Fig. 1. Chromatograms of the methanol extract of liverwort L. cruciata: luteolin-7-O-
-glucoside (1) and quercetin (2).
0 20 40 60
0.0
0.2
76
54321
Inte
nsity
, a.
u.
/ min Fig. 2. Chromatogram of the moss methanol extract of B. velutinum: 4-O-caffeoylquinic
acid (1), 5-O-caffeoylquinic acid (2), caffeic acid (3) and ellagic acid (5), apigenin-7-O-
glucoside (4), luteolin (6) and apigenine (7).
0 20 40 60
0.0
0.2
**
*
9
876
54
321
Inte
nsity
, a.
u.
/ min
Fig. 3. Chromatogram of the methanol extract of the moss K. praelonga: 4-O-caffeoylquinic acid (1), 5-O-caffeoylquinic acid (2), caffeic acid (3), p-coumaric acid (4), ferulic acid (5), ellagic acid (7), caffeic acid derivative (*), p-coumaric acid derivative (**), apigenin-7-O--glucoside (6), luteolin (8), apigenin (9) and un-identified flavanone ().
In the methanol extract of the moss Kindbergia praelonga, 4-O-caffeoylqui-nic, 5-O-caffeoylquinic, caffeic, p-coumaric, ferulic and ellagic acid, caffeic acid derivative, p-coumaric acid derivative, flavonoid heteroside apigenin-7-O-gluco-side, aglycones luteolin and apigenin, as well as one unidentified flavanone were evidenced, as shown in Fig. 3.
The chemical contents of B. velutinum and K. praelonga have not been screened previously.

HPLC–DAD OF PHENOLICS IN BRYOPHYTES 1165
Luteolin is present in many vascular plants, especially from the family Rese-daceae, Genista tinctoria (Fabaceae) and Petroselinum crispum (Apiaceae).42 How-ever, the heteroside form of luteolin-7-O-glucoside is not common and this com-pound was not previously known from L. cruciata. This form is known from some Mentha plants.43 The yellowish pigment quercetin is widespread in many plants but was not detected previously in L. cruciata. Quercetin was found to be the most biologically active of the flavonoids and many medicinal plants owe much of their activity to their high quercetin content.44
Artichoke (Cynara scolymus) is known to have rich content of 4-O-caffeoyl-quinic and 5-O-caffeoylquinic acids.45 Previously they were not evidenced from mosses among the other phenolic acids.4
Caffeic acid is already known from some mosses.46 Apigenine is a pale yel-low pigment present in many plants from the families Apiaceae and Asteraceae with an antitumor effect. Apigenin and its derivates are known to be present in mosses and to have biological effects.47 In mosses, p-coumaric and ferulic acids are known to be present in moss spores. They are precursors of lignin, which is not common in moss gametophytes, but both p-coumaric and ferulic are present in moss gametophytes where lignin was not detected.48
Although phenolic compounds are known to be present in bryophytes, this knowledge is mainly based on liverworts not mosses and their presence; diversity and distribution within different species remain for further studies.49–51
Thus, the paper presents one first approach to the identification of phenolics in the bryophytes L. cruciata, B. velutinum and K. praelonga, until now unknown.
Acknowledgements. M. Sabovljević thanks the Serbian Ministry of Science for support (Grant No. 143015).
И З В О Д
HPLC–DAD ФЕНОЛА КОД БРИОФИТА Lunularia cruciata, Brachytheciastrum velutinum И Kindbergia praelonga
NЕБОЈША JОЦКОВИЋ1, PAULA B. ANDRADE2, PATRÍCIA VALENTÃO2 и MАРКО САБОВЉЕВИЋ3
1Institute of Pharmaceutical Biology, Martin-Luther-University Halle-Wittenberg, Hoher Weg 8, 06120 Halle/Saale, Germany, 2Requimte, Institute of Pharmacognosy, Faculty of Pharmacy,
University of Oporto, Rua Aníbal Cunha, 4050-047, Porto, Portugal и 3Institut za botaniku
i botani~ka bata,Bioloki fakultet, Univerzitet u Beogradu, Takovska 43, 11000 Beograd
Хемијски састав бриофита је слабо познат. Dосадашњи подаци указују на интересантне хемијске састојке бриофита, биолошки активна и нова једињења, нарочито код јетрењача. У овом раду изучаване су једна јетрењача Lunularia cruciata (L.) Dumort и две маховине Bra-chytheciastrum velutinum (Hedw) Ignatov & Huttunen и Kindbergia praelonga (Hedw) Ochyra. Фенолни састав ових врста бриофита од раније није познат. Њихови метанолни екстракти су анализирани путем HPLC типа реверсне фазе, повезаног са DAD детектором. U екстракту L. cruciata пронађени су лутеолин-7-O-глукозид и кверцетин. Eкстракт добијен од B. velutinum показао је присуство четири фенолне киселине (4-O-кафеоилхина, 5-O-кафеоилхина, кофе-инска и елагинска киселина) и три флавоноида (флавоноидни агликони лутеолин и апиге-

1166 JOCKOVIĆ et al.
нин, и његов хетерозид апигенин-7-O-глукозид). Eкстракт од K. praelonga је окарактерисан присуством неколико фенолних киселина и њихових деривата (4-O-кафеоилхина, 5-O-ка-феоилхина, кофеинска, н-кумаринска, ферула и елагинска киселина, деривати кофеинске и н-кумаринске киселине) и следећих флавоноида: апигенина, апигенин-7-O-глукозида, лутео-лина и једног неидентификованог флаванона.
(Примљено 27. марта, ревидирано 30. маја 2008)
REFERENCES
1. J. M. Glime, Bryophyte ecology, Michigan Technological University and the International Association of Bryologists, Houghton, MI, 2007, p. 714
2. Y. Asakawa, in Chemical Constituents of the Bryophytes, W. Herz, G. W. Kirby, R. W. Moore, W. Steglich, Ch. Tamm, Eds., Springer Verlag, Wien, 1995, p. 266
3. H. D. Zinsmeister, H. Becker, T. Eicher, Angew. Chem. 30 (2003) 130 4. A. Sabovljević, M. Sabovljević, in Phytopharmacology and Therapeutic Values IV, J. N.
Govil, V. K Singh, Eds., Studium Press LLC, Houston, TX, 2008, p. 9 5. H. Ando, Proc. Bryol. Soc. Japan 3 (1983) 124 6. H. Ando, H. Matsuo, Appl. Bryol. Adv. Bryol. 2 (1984) 133 7. K. Kumar, K. Singh, A. K. Asthana, V. Nath, Pharm. Biol. 38 (2001) 353 8. Y. Asakawa, Pure Appl. Chem. 66 (1994) 2193 9. Y. Asakawa, Phytochemistry 56 (2001) 297
10. M. Sabovljević, A. Bijelović, D. Grubišić, Lek. Sirov. 21 (2001) 17 (in Serbian) 11. M. Toyota, K. Masuda, Y. Asakawa, Phytochem. 48 (1998) 297 12. H. Edelmann, C. Neinhuis, M. C. Jarvis, B. Evans, E. Fischer, W. Barthlott, Planta 206
(1998) 315 13. A. Speicher, K. Hollemeyer, E. Heinzle, Rapid Commun. Mass Spectrom. 15 (2000) 124 14. A. Speicher, K. Hollemeyer, E. Heinzle, Phytochemistry 57 (2001) 303 15. J. W. van Klink, J. Zapp, H. Becker, Z. Naturforsch. 57 (2002) 413 16. Z. A. Popper, S. C. Fry, Ann. Bot. 91 (2003) 1 17. U. M. Hertewich, J. Zapp, H. Becker, Phytochemistry 63 (2003) 227 18. N. Jocković, M. Pavlović, M. Sabovljević, N. Kovačević, Natura Montenegrina 6 (2007) 123 19. Y. Asakawa, Phytochemistry 65 (2004) 623 20. A. Basile, S. Sorbo, S. Giordano, A. Lavitola, R. Castaldo-Cobianchi, Int. J. Antimicrob.
Agents 10 (1998) 169 21. A. Basile, S. Giordano, S. Sorbo, M. L. Vuotto, M. T. L. Ielpo, R. Castaldo Cobianchi,
Pharm. Biol. 36 (1998) 25 22. A. Dulger, Ö. Tonguç-Yayintas, A. Gonuz, Fitoterapia 76 (2005) 730 23. A. Sabovljević, M. Soković, M. Sabovljević, D. Grubišić, Fitoterapia 77 (2006) 144 24. Y. Asakawa, Prog. Chem. Org. Nat. Prod. 42 (1982) 1 25. Y. Asakawa, M. Toyota, T. Takemoto, Phytochemistry 19 (1980) 1799 26. Y. Asakawa, R. Matsuda, M. Toyota, T. Takemoto, J. D. Connolly, W. P. Phillips, Phyto-
chemistry 22 (1983) 961 27. Y. Asakawa, L. J. Harrison, M. Toyota, Phytochemistry 24 (1985) 261 28. R. D. Banerjee, S. P. Sen, Bryologist 82 (1979) 141 29. J. L. Hartwell, Lloydia 34 (1971) 386 30. T. Hashimoto, H. Suzuki, M. Tori, Y. Asakawa, Phytochemistry 30 (1991) 1523 31. T. Kanaski, K. Ohta, Agric. Biol. Chem. 40 (1976) 1239

HPLC–DAD OF PHENOLICS IN BRYOPHYTES 1167
32. J. A. McCleary, P. S. Sypherd, D. L. Walkington, Science 131 (1960) 108 33. Y. Ohta, N. H. Andersen, C. B. Liu, Tetrahedron 33 (1977) 617 34. L. Van Hoof, D. A. Vanden Berghe, E. Petit, A. J. Vlietinck, Fitoterapia 52 (1981) 223 35. J.-P. Frahm, K. Kirchhoff, Cryptog. Bryol. 23 (2002) 271 36. T. Mekuria, U. Steiner, H. Hindorf, J.-P. Frahm, H.-W. Dehne J. Appl. Bot. Food Qual.
79 (2005) 89 37. A. Basile, S. Giordano, S. Sorbo, R. Castaldo Cobianchi, M. L. Vuotto, M. T. L. Ielpo,
Pharm. Biol. 36 (1998) 25 38. A. Basile, S. Giordano, S. Sorbo, M. L. Vuotto, M. T. L. Ielpo, R. C. Cobianchi, Int. J.
Pharm. 36 (1998) 1 39. M. T. Ielpo, P. De Sole, A. Basile, V. Moscatiello, E. Laghi., R. C. Cobianchi, M. L.
Vuotto, Immunopharmacol. Immunotoxicol. 20 (1998) 555 40. R. J. Pryce, Planta 97 (1971) 354 41. A. Basile, V. Spagnuolo, S. Giordano, R. C. Cobianchi, Giorn. Bot. Ital. 112 (1993) 549 42. J. Mann, Secondary Metabolism, 2nd Ed., Oxford University Press, Oxford, 1992, p. 280 43. T. Cserháti, Monograph. J. Chrom. Lib. 71 (2006) 587 44. H. Su-Lan, H. Yu-Chi, W. Yao-Horng, T. Chih-Wan, S. Sheng-Fang, L. C. Pei-Dawn,
Life Sci. 72 (2002) 227 45. K. Schütz, D. Kammerer, R. Carle, A. Schieber, J. Agric. Food Chem. 52 (2004) 4090 46. V. Chobot, L. Kubicová, S. Nabbout, L. Jahodář, J. Vytlačilová, Fitoterapia 77 (2006)
598 47. A. Basile, S. Giordano, J. A. López-Sáez, R. Castaldo-Cobianchi, Phytochemistry 52
(1999) 1479 48. S. M. Siegel, Am. J. Bot. 56 (1969) 175 49. Y. Asakawa, Current Pharm. Des. 14 (2008) 3067 50. J.-P. Frahm, Biologie der Moose, Gustav Fischer, Verlag, 2001, p. 357 51. H. D. Zinsmeister, R. Mues, Bryophytes, their chemistry and chemical taxonomy, Claren-
don Press, Oxford, 1990, p. 470.


J. Serb. Chem. Soc. 73 (12) 1169–1180 (2008) UDC 547.466.64+546.3+54–145.2:66.011 JSCS–3796 Original scientific paper
doi: 10.2298/JSC0812169V 1169
Computer augumented modelling studies of Pb(II), Cd(II), Hg(II), Co(II), Ni(II), Cu(II) and Zn(II) complexes of L-glutamic acid in 1,2-propanediol–water mixtures MAHESWARA RAO VEGI, PADMA LATHA MUDDAPU, SIVA RAO
TIRUKKUVALLURI and NAGESWARA RAO GOLLAPALLI*
School of Chemistry, Andhra University, Visakhapatnam-530003, India
(Received 25 April 2007, revised 16 June 2008)
Abstract: Chemical speciation of Pb(II), Cd(II), Hg(II), Co(II), Ni(II), Cu(II) and Zn(II) complexes of L-glutamic acid was studied at 303 K in 0–60 vol. % 1,2-propanediol–water mixtures, whereby the ionic strength was maintained at 0.16 mol dm-3. The active forms of the ligand are
3LH , LH2 and LH–. The pre-dominant detected species were ML, ML2, MLH, ML2H and ML2H2. The trend of the variation in the stability constants with changing dielectric constant of the medium is explained based on the cation stabilizing nature of the co-sol-vents, specific solvent–water interactions, charge dispersion and specific inter-actions of the co-solvent with the solute. The effect of systematic errors in the concentrations of the substances on the stability constants is in the order alkali > > acid > ligand > metal. The bioavailability and transportation of metals are explained based on distribution diagrams and stability constants.
Keywords: chemical speciation; L-glutamic acid; 1,2-propanediol; bioavailabi-lity; metals.
INTRODUCTION
Investigations of acido–basic equilibria of amino acids, their interaction with metal ions in media varying ionic strength, temperature and dielectric constant throw light on the mechanism of enzyme-catalyzed reactions. Although it is known that the polarity of the active site cavities in proteins is lower than that of the bulk, a direct measurement of the dielectric constant is not possible. Com-paring the formation constants of acido–basic equilibria and/or metal complex equilibria with those at biological centres offers a way to estimate the effective dielectric constant or equivalent solution dielectric constant for the active site cavity.1 This brought a renaissance in the study of complex equilibria in aqua–or-ganic mixtures apart from its established utility in understanding solute–solvent interactions, increasing sensitivity of reactions of analytical and industrial impor-tance and solubilising ligands or their metal complexes.
* Corresponding author. E-mail: [email protected]

1170 VEGI et al.
Chemical speciation of metals is important for an understanding of their dis-tribution, mobility, bioavailability, toxicity and for setting environmental quality standards.2 Bioavailability of a particular metal depends on its complex chemical reactions of dissolution, binding and complexation with the constituents of the environmental aquatic phase.3 The activities of bacteria increase the concentra-tion of dissolved organic carbon and decreases the pH value of water. This causes an increase in the complexation and mobility of a metal.4 Complexation signify-cantly decreases bioavailability.5
Due to the multiple biological roles of glutamic acid,6–9 speciation studies of L-glutamic acid (Glu) with Co(II), Cu(II) and Zn(II) in DMF–water mixtures and Pb(II), Cd(II), Hg(II), Co(II), Ni(II), Cu(II) and Zn(II) in urea–water mixtures were reported earlier.10,11 Ionic strength dependence of the formation constants of Glu with uranium(VI) and beryllium(II) and pH-metric and spectrophoto-metric studies of oxovanadium(IV) with Glu, aspartic acid and imidazoles were also reported.12–14 Herein, the results of chemical speciation of Glu complexes of Pb(II), Cd(II), Hg(II), Co(II), Ni(II), Cu(II) and Zn(II) in 1,2-propanediol–water mixtures are reported.
EXPERIMENTAL
Chemicals
1,2-Propanediol (propylene glycol, PG), obtained from Merck, Mumbai, was used as re-ceived. Aqueous solutions of L-glutamic acid, Pb(II), Cd(II) and Hg(II) nitrates, Co(II), Ni(II), Cu(II) and Zn(II) chlorides, nitric acid, sodium hydroxide and sodium nitrate were prepared by dissolving GR Grade (Merck, Germany) samples in triple distilled water. To increase the solubility of Glu and to suppress the hydrolysis of metal salts, the nitric acid concentration was maintained at 0.050 mol dm-3. All the solutions were standardized by usual standard me-thods. To assess the errors that might have entered into the determinations of the concentra-tions, the data were subjected to analysis of variance of one way classification (Anova).15 The strength of the alkali was determined using the Gran plot method.16
Apparatus
The titrimetric data were obtained with a calibrated Elico (Model L1-120) pH meter (readability 0.01), which can monitor changes in the H+ concentration. The pH meter was ca-librated with a 0.050 mol dm-3 potassium hydrogen phthalate solution in the acidic region and a 0.010 mol dm-3 borax solution in the basic region. The glass electrode was equilibrated in a well-stirred PG–water mixture containing an inert electrolyte. The effects of variations in the asymmetry potential, liquid junction potential, activity coefficient, sodium ion error and dis-solved carbon dioxide on the response of the glass electrode were accounted for in the form of correction factors.17,18
Procedure
The titrations were performed at 303±0.1 K in media containing 0–60 vol. % PG, whereby the ionic strength was maintained constant at 0.16 mol dm-3 with sodium nitrate. The electrode was kept, usually for 2–3 days, in the required solvent system for equilibration. To verify whether the electrode was equilibrated, a strong acid was titrated with an alkali every day until no appreciable differences were observed between the pH values of two titrations at

SPECIATION STUDY OF L-GLUTAMIC ACID COMPLEXES 1171
the corresponding volumes of titrant. Under the above conditions, the electrode was assumed to be equilibrated. A calomel electrode was refilled with PG–water mixture of the equivalent composition to that of the titrand. Free acid titrations were performed before the metal–ligand titrations to calculate the correction factor. In each of the titrations, the titrand consisted of a mineral acid of approximately 1 mmol in a total volume of 50 cm3. Titrations with different ratios (1:2.5, 1:3.5 and 1:5) of metal–ligand were performed with 0.40 mol dm-3 sodium hyd-roxide. Other experimental details are given elsewhere.19
Modelling strategy
The approximate complex stability constants of metal–Glu complexes were calculated with the computer program SCPHD.20 The best fit chemical model for each investigated sys-tem was arrived at using Miniquad75.21
RESULTS AND DISCUSSION
The results of the best fit models that contain the type of species and overall formation constants along with some of the important statistical parameters are given in Tables I and II. A very low standard deviation in the log values indi
TABLE I. Parameters of the best fit chemical models of Pb(II), Cd(II) and Hg(II)–glutamic complexes in PG–water mixtures. Temperature 303 K, ionic strength 0.16 mol dm-3
log mlh(SD) y(PG) vol. % ML MLH ML2 ML2H2
NP* 8-
**corr
10
U Skew-ness
χ2 R
factorKur-tosis
pH Range
Pb(II)
00.00 6.58(14) – – – 15 3.817 –0.57 10.64 0.0137 2.79 3.7–4.7 10.00 6.81(11) – – – 13 1.778 –0.81 9.21 0.0090 3.50 3.7–4.6 20.00 6.54(9) – – – 29 0.448 –0.80 34.47 0.0091 3.73 3.8–4.7 30.00 6.78(8) – – – 36 3.332 –0.68 47.26 0.0135 2.85 3.7–4.9 40.00 6.85(8) – – – 34 3.096 –0.71 31.96 0.0129 3.39 3.8–4.9 50.00 6.70(7) – – – 28 1.267 –0.70 22.86 0.0080 3.52 4.0–4.9 60.00 6.74(8) – – – 29 1.358 –0.84 39.99 0.0082 4.23 4.0–5.0
Cd(II)
00.00 3.99(12) – 7.22(10) 22.38(50) 23 0.892 0.26 4.16 0.0090 3.08 5.0–9.3 10.00 4.14(7) – 7.46(6) 23.21(10) 55 1.015 0.19 27.44 0.0076 5.46 3.0–9.5 20.00 4.10(8) – 7.05(8) 22.36(71) 21 0.363 –0.11 3.92 0.0061 4.24 6.0–9.5 30.00 4.33(13) – 7.69(12) 22.96(54) 22 0.732 0.16 16.42 0.0084 7.41 5.6–9.5 40.00 4.46(13) – 7.83(12) 23.20(43) 22 0.622 0.16 16.91 0.0078 6.15 5.6–9.5 50.00 4.49(9) – 7.96(9) 22.72(71) 27 0.526 0.35 6.60 0.0074 4.72 5.5–9.8 60.00 4.48(10) – 7.95(11) 23.39(33) 34 1.756 0.23 20.20 0.0127 5.14 5.0–10
Hg(II)
00.00 10.96(4) 13.41(5) – – 82 7.997 1.00 85.84 0.0028 6.66 1.7–2.6 10.00 11.60(4) 14.32(4) – – 48 0.365 –0.08 9.78 0.0025 4.75 2.1–2.6 20.00 11.52(8) 14.48(5) – – 31 0.206 –0.14 16.68 0.0018 5.36 2.1–2.5 30.00 12.13(2) 14.81(4) – – 29 0.059 –0.52 11.30 0.0011 6.14 2.1–2.5 40.00 12.68(3) 15.02(11) – – 25 0.416 0.11 2.55 0.0024 3.45 2.1–2.5 50.00 12.71(3) 15.48(4) – – 19 0.070 –0.78 7.14 0.0009 7.02 2.1–2.5 60.00 12.24(7) 15.63(3) – – 10 0.014 0.18 0.93 0.0004 3.01 2.3–2.5 *NP = number of experimental points; **Ucorr = U/(NP – m), where m = number of species

1172 VEGI et al.
Tab
le I
I. P
aram
eter
s of
the
bes
t fi
t ch
emic
al m
odel
s of
Co(
II),
Ni(
II),
Cu(
II)
and
Zn(
II)–
glut
amic
aci
d co
mpl
exes
in
PG
–wat
er m
ixtu
res.
T
empe
ratu
re 3
03 K
, ion
ic s
tren
gth
0.16
/mol
dm
-3

SPECIATION STUDY OF L-GLUTAMIC ACID COMPLEXES 1173
cates the precision of these parameters. The small values of Ucorr (sum of the squares of the deviations in the concentrations of ligand and hydrogen ions at all experimental points corrected for degrees of freedom) indicate that the experi-mental data can be represented by the model. Small values of the mean, standard deviation and mean deviation for the systems corroborate that the residuals are around a zero mean with little dispersion. For an ideal normal distribution, the values of the kurtosis and skewness should be three and zero, respectively. The kurtosis values in the present study indicate that the residuals form a leptokurtic pattern and a few form a platykurtic pattern. The values of the skewness given in the Tables are between –1.50 and 2.23. These data evince that the residuals form a part of a normal distribution, hence, the least squares method can be applied to the present data. The sufficiency of the model is further evident from the low crystallographic R-value recorded. Thus, these statistical parameters show that the best fit models portray the metal–ligand species in PG–water mixtures. The stability constants of the metal–ligand species are compared with literature re-ported values in Table III.
TABLE III. Comparison of the results of the present study with the binary stability constants of Glu complexes reported in the literature in aqueous medium
Metal ion Species Presented values Literature reported value Ref. Co(II) ML, ML2 4.58, 7.75 4.56, 7.86 22 Ni(II) ML, ML2
ML, ML2 5.14, 9.56 5.14, 9.56
5.62, 9.82 5.60, 9.76
22 23
Cu(II) ML ML, MLH ML, MLH
7.99 7.99, 12.52 7.99, 12.52
7.87 8.07, 12.39 8.39, 12.49
23 24 25
ML, MLH, ML2, ML2H, ML2H2
7.99, 12.52, 14.49, 19.50, 24.11
8.55, 12.73, 15.22, 20.57, 25.18
26
Zn(II) ML, ML2 4.90, 8.88 4.69, 8.55 27
Effect of systematic errors on best fit model
Miniquad75 does not provide for a study of the effect of systematic errors in influential parameters, such as the concentrations of the reactants, on the magni-tude of the equilibrium constant. In order to rely upon the best chemical model for critical evaluation and application under varied experimental conditions with different accuracies of data acquisition, an investigation was made by introducing pessimistic errors in the concentrations of alkali, mineral acid, ligand and metal (Table IV). The order of the compounds that influence the magnitudes of the sta-bility constants due to incorporation of errors is alkali > acid > ligand > metal. Some species, such as ML2 and ML2H2, were even rejected when errors were in-troduced in the concentrations of the components. This shows that any deviation from the experimental concentrations of the components increases the standard deviation in the log values and results ultimately in the rejection of the species.

1174 VEGI et al.
This study infers that the experimental concentrations are appropriate and the proposed models are adequate for the experimental data.
TABLE IV. Effect of errors in the influential parameters on the metal–glutamic acid equilibria in a 30 vol. % v/v PG–water mixture
Log (SD) Component Error, %
ML ML2 ML2H2 Cd(II)
0 4.33(13) 7.69(12) 22.96(53) –5 2.13(60) Rejected Rejected –2 3.76(30) 6.15(33) 22.48(256) +2 4.73(17) 8.78(14) Rejected
Alkali
+5 6.10(69) 10.97(66) Rejected –5 5.74(36) 10.19(37) Rejected –2 4.97(32) 8.82(31) 23.63(64) +2 3.84(29) 6.61(26) 22.16(467)
Acid
+5 3.12(24) Rejected Rejected –5 4.44(10) 8.28(9) Rejected –2 4.36(12) 7.92(11) 22.64(84) +2 4.29(20) 7.43(19) 23.16(61)
Ligand
+5 4.22(33) 6.98(33) 23.34(82) –5 4.32(15) 7.81(13) 22.95(59) –2 4.33(14) 7.74(13) 22.96(56) +2 4.33(13) 7.64(12) 22.97(52)
Metal
+5 4.33(12) 7.56(11) 22.97(50) Zn(II)
0 4.89(18) 8.88(16) 22.80(96) –5 3.13(42) Rejected Rejected –2 4.41(39) 7.26(43) 22.53(340) +2 5.35(12) 9.96(11) Rejected
Alkali
+5 6.31(52) 11.72(43) Rejected –5 6.06(28) 11.09(26) Rejected –2 5.24(9) 9.69(8) Rejected +2 4.46(16) 7.74(21) Rejected
Acid
+5 3.83(29) Rejected Rejected –5 5.07(8) 9.46(7) Rejected –2 4.94(14) 9.10(12) 22.38(154) +2 4.85(25) 8.63(24) 23.03(94)
Ligand
+5 4.80(38) 8.20(38) 23.27(105) Metal –5 4.85(18) 9.00(16) 22.66(115)
–2 4.88(18) 8.93(16) 22.75(101) +2 4.90(18) 8.82(17) 22.85(91) +5 4.92(19) 8.74(18) 22.92(86)
Effect of solvent
The presence of PG in aqueous solutions considerably decreases the dielec-tric constant of the medium and these solutions are expected to mimic physio-

SPECIATION STUDY OF L-GLUTAMIC ACID COMPLEXES 1175
logical conditions where the concept of equivalent solution dielectric constant for protein cavities is applicable. Hence, PG was selected for the biomimetic study. The dielectric constants of PG at different percentages (0–60 vol. %) of water were taken from literature.28 PG is an amphiprotic and coordinating solvent. It is a structure former and hence it enhances the structure of water in PG–water mixtures. It also removes water from coordination sphere of metal ions, making them more reactive towards ligands. As a result, the stability of the complexes is expected to increase with increasing concentration of PG. On the other hand, PG is a coordinating solvent and competes with ligands for coordination with the metals. This decreases the stability of the complexes. Hence, variation in the sta-bility of complex with solvent is a result of both the opposing behaviours.
The variation of the values of the overall stability constant or change in free energy with content of co-solvent depends upon two factors, viz. electrostatic and non-electrostatic. The Born classical treatment accounts well for the electrostatic contribution to the free energy change.29 According to this treatment, the energy of electrostatic interaction is related to the dielectric constant. Hence, the log values should vary linearly with the reciprocal of the dielectric constant of the medium. The plots given in Fig. 1 show that the values of log increase linearly with decreasing value of the dielectric constant. This trend indicates the domi-nance of the structure forming nature of PG over its complexing ability. The cation stabilizing nature of co-solvents, specific solvent–water interactions, charge dispersion and specific interactions of the co-solvent with the solute (indicated by the changes in the solubility of different species in aqua–organic mixtures) ac-count for the small deviation from a linear relationship. Since the complex for-mation can be viewed as the competition between pure and solvated forms of the ligand and metal ion, solute–solvent interactions, relative thermodynamic stabi-lities, kinetic labilities play an important role.30,31
Distribution diagrams
Glu has two dissociable carboxyl protons and an amino group that can asso-ciate with a proton. The different forms of Glu that exist in the pH regions 2.0– –4.0, 2.0–5.0, 4.0–9.0 and 8.0–10.0 are
3LH , LH2, LH– and L2–, respectively. Hence, the probable species existing in different systems can be predicted from these data. The species formed in the present study for different metals, as given in Tables I and II, are ML for Pb(II); ML and MLH for Hg(II); ML, ML2 and ML2H2 for Cd(II), Co(II), Ni(II) and Zn(II); ML, MLH, ML2, ML2H and ML2H2 for Cu(II).
Distribution diagrams were drawn for various complex species using the for-mation constants of the best fit models as shown in Figs. 2 and 3. These diagrams indicate that the percentage of the ML species of Pb(II) increases with increasing PG content. With increasing percentage of solvent, the percentage of protonated species decreases and the unprotonated species increases for Cd(II). For Hg(II), the

1176 VEGI et al.
Fig. 1. Variation of the stability constant values of metal–glutamic acid complexes with the reciprocal of the dielectric constant in 1,2-propanediol–water mixtures. Pb(II) (A), Cd(II) (B), Hg(II) (C), Co(II) (D), Ni(II) (E), Cu(II) (F) and Zn(II) (G); () log ML, (, , ) log ML2H and () log ML2H2.
species exist at very low and narrow pH region. For Co(II), the percentages of ML, ML2 are not affected by the solvent. For Ni(II), the distribution of all the species is almost the same in all proportions of the solvent. The percentages of MLH, ML2H and ML2 are greater at high solvent concentrations and that of ML2H2 is very low in all compositions of the solvent. The percentage of ML2H2
is lower when compared to ML and ML2. The formation of various binary complex species is shown in the following equilibria:
M(II) + 3LH M 2
2LH + H+ (minor process) (1)
M 22LH MLH+ + H+ (2)

SPECIATION STUDY OF L-GLUTAMIC ACID COMPLEXES 1177
M(II) + LH2 MLH+ + H+ (3)
MLH+ ML + H+ (4) MLH+ + LH2 ML2H2 + H+ (5)
M(II) + 2LH2 ML2H2 + 2H+ (6)
ML2H2 ML2H– + H+ (7)
M(II) + LH– ML + H+ (8)
ML2H– M 22L + H+ (9)
M(II) + 2LH– M 22L + 2H+ (10)
Fig. 2. Distribution diagrams of glutamic acid complexes in 30 vol. % 1,2-propanediol–water mixture; Pb(II) (A), Cd(II) (B) and Hg(II) (C).
The species shown in Equilibrium (1) was not detected, may be because the process is minor or the species is unstable. Soluble metal species are more bio-available than insoluble ones.32 Complexation of the metals by natural complex-ing agents, such as amino acids and humic acids, alter their bioavailability.5,33 Bioavailability is also affected by pH value, composition of interfering anions and cations, dissolved organic matter, sequestration and binding in plants, spe-cies-dependent regulation mechanisms for the uptake, amount of metal and the oxidation state of mineral components.34,35 Thus, the distribution of the species over the entire pH range is useful to understand the pH where a particular species

1178 VEGI et al.
is likely to form. By using these data, the bioavailability of a metal can be pre-dicted. For example, in Figs. 2 and 3 the concentration of free metal ion (FM) is very high in acidic pH values, more so with the toxic metals. Hence, in these pH ranges the metals are more bioavailable than in higher pH ranges. Hence, the con-centrations of the complex chemical species have more significance than the total concentrations for the bioavailability and toxicity of trace metals in soils and water.
Fig. 3. Distribution diagrams of glutamic acid complexes in 30 vol. % 1,2-propanediol–water
mixture; Co(II) (A), Ni(II) (B), Co(II) (C) and Zn(II) (D).
CONCLUSIONS
1. The present biomimetic studies of metal ion complexes with L-glutamic acid in PG–water mixtures indicate that all the complexes were protonated in aci-dic pH values.
2. The predominant species detected were ML, ML2, MLH, ML2H and ML2H2.

SPECIATION STUDY OF L-GLUTAMIC ACID COMPLEXES 1179
3. The log values linearly increased with 1/D values of the medium, indi-cating the dominance of electrostatic forces over non-electrostatic forces.
4. The order of the compounds influencing the magnitudes of the stability constants due to the incorporation of errors was alkali > acid > ligand > metal.
5. The higher concentration of free metal in low pH values make the metal more bioavailable, more so in the case of toxic metals. At higher pH values, the higher concentrations of complex chemical species indicate that the metals are more amenable for transportation at higher pH values.
И З В О Д
Pb(II), Cd(II), Hg(II), Co(II), Ni(II), Cu(II) И Zn(II) КОМПЛЕКСИ СА L-ГЛУТАМИНСКОМ КИСЕЛИНОМ У СМЕШИ 1,2-ПРОПАНДИОЛ–ВОДА ПРОУЧАВАНИ
МОДЕЛОВАЊЕМ ПОТПОМОГНУТИМ КОМПЈУТЕРОМ
MAHESWARA RAO VEGI, PADMA LATHA MUDDAPU, SIVA RAO TIRUKKUVALLURI
и NAGESWARA RAO GOLLAPALLI
School of Chemistry, Andhra University, Visakhapatnam-530003, India
Проучавана је хемијска специјација Pb(II), Cd(II), Hg(II), Co(II), Ni(II), Cu(II) и Zn(II) комплекса са L-глутаминском киселином у 0–60 vol. % 1,2-пропанол–вода смешама при јон-ској јачини од 0,16 mol dm-3 на 303 K. Активни облици лиганда су
3LH , LH2, LH-. Предо-минантне детектоване специје су ML, ML2, MLH, ML2H and ML2H2. Тренд варијације конс-танти стабилности са променом диелектричне константе средине објашњен је на основу при-роде ко-растварача који стабилизује катјон, специфичних интеракција растварача и воде, дисперзије наелектрисања, специфичних интеракција ко-растварача са растворком. Утицај систематских грешака у концентрацијама састојака на константе стабилности следи редо-след алкални метал > киселина > лиганд > метал. Транпорт метала и биолошка доступност објашњени су дистрибуционим дијаграмима и константама стабилности.
(Примљено 25. априла 2007, ревидирано 16. јуна 2008)
REFERENCES
1. H. Sigel, R. B. Martin, R. Tribolet, U. K. Haring, R. M. Balakrishnan, Eur. J. Biochem. 152 (1985) 187
2. S. Teigen, R. Andersen, Programme on marine pollution (PMF). Trace metals in the marine environment: State of The Art and Research Needs, Croatian Society of Chemical Engineers, Zagreb, 1992, p. 124
3. D. M. Di Toro, H. E. Allen, H. L. Bergman, J. S. Meyer. P. R. Paquin, R. C. Santore, Environ. Toxicol. Chem. 20 (2001) 2383
4. S. C. Wu, Y. M. Luo, K. C. Cheung, M. H. Wong, Environ. Pollut. 144 (2006) 765 5. H. R. Felix, A. Kayser, R. Schulin, in Proceedings of 5th International Conference on
Biogeochemistry of Trace Elements, Vienna, Austria, (1997), p. 138 6. A. Satako, T. Abe, T. Yoshioka, S. Kyoritsu, Busshitsu to Shite (2003) 107 7. V. Sauvinet, S. Parrot, N. Benturquia, E. Bravo-Moraton, B. Renaud, L. Denoroy, Elec-
trophoresis 24 (2003) 3187 8. M. Kalloniatis, G. Tomisich, Prog. Retin Eye Res. 18 (1999) 811 9. K. Ajito, C. Han, K. Torimitsu, Anal. Chem. 76 (2004) 2506

1180 VEGI et al.
10. M. S. Babu, J. S. Sukumar, G. N. Rao, M. S. P. Rao, Indian J. Chem. 34 (1995) 567 11. V. M. Rao, M. P. Latha, T. S. Rao, G. N. Rao, J. Indian Chem. Soc. 83 (2006) 925 12. F. Gharib, K. Zare, R. Cheraghali, Zh. Neorg. Khim. 49 (2004) 1039 13. V. Lubes, F. Brito, M, L, Araufo, A, Sabatini, A. Vacca, S. Midollini, A. Mederos,
Comision Editora de la Revista Ciencia, 12 (2004) 78 14. R. N. Patel, V. K. Soni, S. Sharma, K. K. Shukla, K. B. Pandeya, Oxidation Commun. 26
(2003) 358 15. R. S. Rao, G. N. Rao, Computer Applications in Chemistry, Himalaya Publishing House,
Mumbai, 2005, p. 302 16. (a) G. Gran, Analyst. 77 (1952) 661; (b) G. Gran, Anal. Chim. Acta 206 (1988) 111 17. G. Gonzalez, D. Rosales, J. L. Gomez Ariza, A. Guiraum Perez, Talanta 33 (1986) 105 18. L. G. Van Uitert, C. G. Haas, J. Am. Chem. Soc. 75 (1953) 451 19. N. Padmaja, M. S. Babu, G. N. Rao, R. S. Rao, K. V. Ramana, Polyhedron 9 (1990) 2497 20. G. N. Rao, PhD Thesis, Andhra University, Visakhapatnam, 1989 21. P. Gans, A. Sabatini, A. Vacca, Inorg. Chim. Acta 18 (1976) 237 22. J. H. Ristma, G. A. Wiegers, F. Jellink, Rec. Trav. Chim. 84 (1965) 1577 23. D. S. Barnes, L. D. Pettit, J. Inorg. Nucl. Chem. 33 (1971) 2177 24. I. Nagypal, A. Gergely, E. Farakas, J. Inorg. Nucl. Chem. 36 (1974) 699 25. J. H. Ristma, Rec. Trav. Chim. 94 (1975) 210 26. G. Brooks, L. D. Pettit, J. Chem. Soc. Dalton Trans. (1977) 1918 27. A. Gergely, E. Farakas, Magy Kem. Foly. 81 (1975) 471 28. R. J. Sengwa, R. Chaudhary, S. C. Mehrotra, Mol. Phys. 99 (2001) 1805 29. M. Born, Z. Phys. 1 (1920) 4 30. M. P. Latha, V. M. Rao, T. S. Rao, G. N. Rao, Proc. Nat. Acad. Sci. India 77A (2007) 109 31. G. N. Rao, R. S. Rao, J. T. R. Chem. 2 (1995) 15 32. W. Lund, Fresenius J. Anal. Chem. 337 (1990) 557 33. C. Vetriani, Y. S. Chew, S. M. Miller, J. Yagi, J. Coombs, R. A. Lutz, T. Barkay, Appl.
Environ. Microbiol. 71 (2005) 220 34. K. Hund-Rinke, W. Kordel, Ecotoxicol. Environ. Safety 56 (2003) 52 35. J. E. Darnell, PhD Thesis, Mississippi State University, Starkville, MS, 2004.

J. Serb. Chem. Soc. 73 (12) 1181–1186 (2008) UDC 544.354–128.4+547.545/.548:66.061:532.74 JSCS–3797 Short communication
doi: 10.2298/JSC0812181M 1181
SHORT COMMUNICATION
Solvent extraction of Ca2+, Ba2+, Cu2+, Zn2+, Cd2+, Pb2+, 22UO ,
Mn2+, Co2+ and Ni2+ into nitrobenzene using strontium dicarbollylcobaltate and tetra-tert-butyl
p-tert-butylcalix[4]arene tetraacetate E. MAKRLÍK1*, J. BUDKA2, P. VAŇURA2 and P. SELUCKÝ3
1Faculty of Applied Sciences, University of West Bohemia, Husova 11, 306 14 Pilsen, 2Institute of Chemical Technology, Technická 5, 166 28 Prague and
3Nuclear Research Institute, 250 68 Řež, Czech Republic
(Received 4 February, revised 26 May 2008)
Abstract: The exchange extraction constants corresponding to the general equi-librium M2+(aq) + SrL2+(nb) ML2+(nb) + Sr2+(aq) occurring in the two- -phase water–nitrobenzene system (M2+ = Ca2+, Ba2+, Cu2+, Zn2+, Cd2+, Pb2+,
22UO , Mn2+, Co2+ or Ni2+; L = tetra-tert-butyl p-tert-butylcalix[4]arene tetra-
acetate; aq = aqueous phase; nb = nitrobenzene phase) were evaluated from ex-traction experiments and -activity measurements. Furthermore, the stability cons-tants of the ML2+ complexes in water saturated nitrobenzene were calculated; they were found to increase in the cation order Ba2+ < Mn2+ < Pb2+, Co2+ < Cu2+, Zn2+ < Cd2+, Ni2+ < 2
2UO < Ca2+.
Keywords: divalent cations; calix[4]arene compound; extraction and stability constants; water–nitrobenzene system.
INTRODUCTION
The dicarbollylcobaltate anion and some of its halogen derivatives are very useful reagents for the extraction of alkali metal cations (especially Cs+), and also, in the presence of polyoxyethylene compounds, for the extraction of Sr2+ and Ba2+ from an aqueous solution into a polar organic phase, both under labo-ratory conditions for purely theoretical or analytical purposes,1 and on the tech-nological scale for the separation of some high-activity isotopes in the reprocess-sing of spent nuclear fuel and acidic radioactive waste.2–4
Calix[n]arenes are a well-known family of macrocyclic molecules with many potential applications in various branches of chemistry. Due to their simple one-pot preparation, easy derivatization and unique complexation abilities, calix[n]arenes
* Corresponding author. E-mail: [email protected]

1182 MAKRLÍK et al.
are widely used as building blocks for the constructions of more sophisticated molecular systems. Their unique three-dimensional pre-organization make them very attractive as the receptors for the complexation of cations, anions, and even neutral molecules. Calix[n]arenes find applications as selective binders and car-riers, as analytical sensors, as catalysts and model structures for biomimetic stu-dies.5,6 In the field of host–guest chemistry, many studies have focused on the binding ability of calixarene derivatives with carbonyl groups at their lower rims toward metal ions, predominantly alkali and alkaline-earth, but also transition and heavy metal cations.7–15
In the present communication, the solvent extraction of Ca2+, Ba2+, Cu2+, Zn2+, Cd2+, Pb2+, 2
2UO , Mn2+, Co2+ and Ni2+ into nitrobenzene by using a syn-ergistic mixture of strontium dicarbollylcobaltate and tetra-tert-butyl p-tert-butyl-calix[4]arene tetraacetate (see Scheme 1), similar to a previous study16, was in-vestigated. Furthermore, the stability constants of the proved divalent cation com-plexes with the mentioned calix[4]arene ligand in the organic phase of the water––nitrobenzene extraction system were determined.
Scheme 1. Structural formula of tetra-tert-butyl p-tert-butylcalix[4]arene tetraacetate (abbrev. L).
EXPERIMENTAL
Tetra-tert-butyl p-tert-butylcalix[4]arene tetraacetate was synthesized using the proce-dure published by Arnaud-Neu et al.9 Cesium 3,3'-commo-bis (undecahydro-1,2-dicarba-3-co-balta-closo-dodecabor)ate, Cs+[π-(3)-1,2-B9C2H11]Co(III)– (also called cesium dicarbollyl-cobaltate, Cs(DCC), was supplied by Katchem, Řež, Czech Republic. A nitrobenzene solution of hydrogen dicarbollylcobaltate (HDCC)1 was prepared from CsDCC by the method des-cribed elsewhere.17 The other employed chemicals were of reagent grade purity (Lachema, Brno, Czech Republic). The equilibration of the nitrobenzene solution of HDCC with stoi-chiometric Sr(OH)2 yielded the corresponding Sr(DCC)2 solution in nitrobenzene. The radio-nuclide 85Sr2+ (DuPont, Belgium) was of standard radiochemical purity.
The extraction experiments were performed in 10 ml glass test-tubes covered with poly-ethylene stoppers: 2.0 ml of an aqueous solution of M(NO3)2 (M2+ = Ca2+, Ba2+, Cu2+, Zn2+, Cd2+, Pb2+, 2
2UO , Mn2+, Co2+ or Ni2+) of concentration in the range from 1.010-3 to 1.010-2

SOLVENT EXTRACTION INTO NITROBENZENE 1183
mol/l and micro amounts of 85Sr2+ were added to 2.0 ml of a nitrobenzene solution of tetra- -tert-butyl p-tert-butylcalix[4]arene tetraacetate and Sr(DCC)2, the initial concentrations of which also varied from 1.010-3 to 1.010-2 mol/l (in all experiments, the initial concentration of tetra-tert-butyl p-tert-butylcalix[4]arene tetraacetate in nitrobenzene, nbin,
Lc , was always equal to the initial concentration of Sr(DCC)2 in this medium, nbin,
Sr(DCC)2c ). The test-tubes filled
with the solutions were shaken for 12 h at 25±1 °C, using a laboratory shaker. Then the phases were separated by centrifugation. Afterwards, 1.0 ml samples were taken from each phase and their -activities were measured using a well-type NaI(T1) scintillation detector connected to a -analyzer NK/350 (Gamma, Budapest, Hungary).
The equilibrium distribution ratio of strontium, DSr, was determined as the ratio of the measured radioactivities of 85Sr2+ in the nitrobenzene and aqueous samples.
RESULTS AND DISCUSSION
According to the results of previous papers,1,18–21 the two-phase water– –M(NO3)2 (M2+ = Ca2+, Ba2+, Cu2+, Zn2+, Cd2+, Pb2+, 2
2UO Mn2+, Co2+, Ni2+)–nitrobenzene–Sr(DCC)2 extraction system can be described by the follow-ing general equilibrium:
M2+(aq) + Sr2+(nb) M2+(nb) + Sr2+(aq) (1)
with the corresponding exchange extraction constant Kex(M2+,Sr2+); aq and nb denote the presence of the species in the aqueous and nitrobenzene phases, res-pectively. For the constant Kex(M2+,Sr2+), one can write:
iSr
iM
22ex 22 loglog)Sr ,(Mlog KKK (2)
where iM2K and i
Sr2K are the individual extraction constants for M2+ and Sr2+, respectively, in the water–nitrobenzene system.18 Knowing log i
Ca2K = –11.2,18,19 log i
Ba2K = –10.5,21 log iCu2K = log i
Cd2K = –11.5,22 log iZn2K = log i
Ni2K = = –11.6,22 log i
Pb2K = –10.6,22 log iUO2
2K = –11.8,22 log i
Mn2K = –11.1,22 log i
Co2K = –11.422 and log iSr2K = –10.7,18,20 the single exchange extraction
constants Kex(M2+, Sr2+) were simply calculated from Eq. (2). The correspond-ing data are given in Table I.
TABLE I. Equilibrium data for the M2+ and ML2+ cations in the two-phase water–nitroben-zene extraction system at 25 °C (M2+ = Ca2+, Sr2+, Ba2+, Cu2+, Zn2+, Cd2+, Pb2+, 2
2UO , Mn2+, Co2+, Ni2+; L = tetra-tert-butyl p-tert-butylcalix[4]arene tetraacetate; for the meaning of the constants, see text)
Quantity Ca2+ Sr2+ Ba2+ Cu2+ Zn2+ Cd2+ Pb2+ 22UO Mn2+ Co2+ Ni2+
iM2log K
–11.2a –10.7b–10.5c–11.5d–11.6d–11.5d–10.6d–11.8d–11.1d –11.4d –11.6d
)Sr,(Mlog 22ex
K e –0.50 – 0.20 –0.80 –0.90 –0.80 0.10 –1.1 –0.40 –0.70 –0.90 )SrL,(Mlog 22
exK f 1.0 – –0.70 –1.1 –1.2 –1.0 –0.30 –1.0 –1.0 –1.1 –1.1
)(MLlog 2nb
g 8.6 7.1h 6.2 6.8 6.8 6.9 6.7 7.2 6.5 6.7 6.9
aInferred from Refs. 18 and 19; binferred from Refs. 18 and 20; cRef. 21; dRef. 22; ecalculated from Eq. (2) using data from Refs. 18–22; fcalculated from Eq. (5); gcalculated from Eq. (6) using data from Refs. 18–22; hdetermined by the method described in detail in Ref. 23

1184 MAKRLÍK et al.
Previous results24–26 showed that the two-phase water–M(NO3)2 (M2+ = Ca2+, Ba2+, Cu2+, Zn2+, Cd2+, Pb2+, 2
2UO , Mn2+, Co2+ or Ni2+)–nitrobenzene–L (L = = tetra-tert-butyl p-tert-butylcalix[4]arene tetraacetate)–Sr(DCC)2 extraction sys-tem (see Experimental), chosen for the determination of stability of the ML2+ complexes in nitrobenzene saturated with water, can be characterized by the main chemical equilibrium (3):
M2+(aq) + SrL2+(nb) ML2+(nb) + Sr2+(aq) (3)
with the general equilibrium extraction constant Kex(M2+, SrL2+) given by:
nb
2aq
2aq
2nb
222
ex][SrL][M
][Sr][ML)SrL,M(
K (4)
It is necessary to emphasize that tetra-tert-butyl p-tert-butylcalix[4]arene tet-raacetate is a very hydrophobic ligand, practically present in the nitrobenzene phase only, where it forms very stable complexes ML2+ with the mentioned di-valent cations. Taking into account the conditions of electroneutrality in the or-ganic and aqueous phases of the system under study, the mass balances of the divalent cations studied at equal volumes of the nitrobenzene and aqueous pha-ses, as well as the measured equilibrium distribution ratio of strontium, DSr = = [SrL2+]nb/[Sr2+]aq, combined with Eq. (4), the final expression for Kex(M2+, SrL2+) is obtained in the form:
nbin,
Sr(DCC)aqin,
)NO(MSr
nbin,Sr(DCC)
Sr
22ex
223
2
)(1
1)SrL,M(
ccD
c
DK
(5)
where aqin,)NO(M 23
c is the initial concentration of M(NO3)2 (M2+ = Ca2+, Ba2+, Cu2+, Zn2+, Cd2+, Pb2+, 2
2UO , Mn2+, Co2+ or Ni2+) in the aqueous phase of the system under consideration.
In this study, from the extraction experiments and -activity measurements by means of Eq. (5), the logarithms of the constants Kex(M2+, SrL2+) were deter-mined and are given in Table I.
Moreover, according to previous studies,24–26 for the extraction constants Kex(M2+, Sr2+) and Kex(M2+, SrL2+) defined above, as well as for the stability constants of the complexes ML2+ and SrL2+ in nitrobenzene saturated with water, denoted by nb(ML2+) and nb(SrL2+), respectively, one obtains:
)Sr,(Mlog
)SrL,(Mlog)(SrLlog)(MLlog22ex
22ex2nb2nb
K
K (6)
Finally, using the values of log Kex(M2+,Sr2+) and log Kex(M2+,SrL2+) given in Table I, log nb (SrL2+) = 7.1, determined from the distribution of strontium picrate in the water–nitrobenzene system containing the considered calix[4]arene
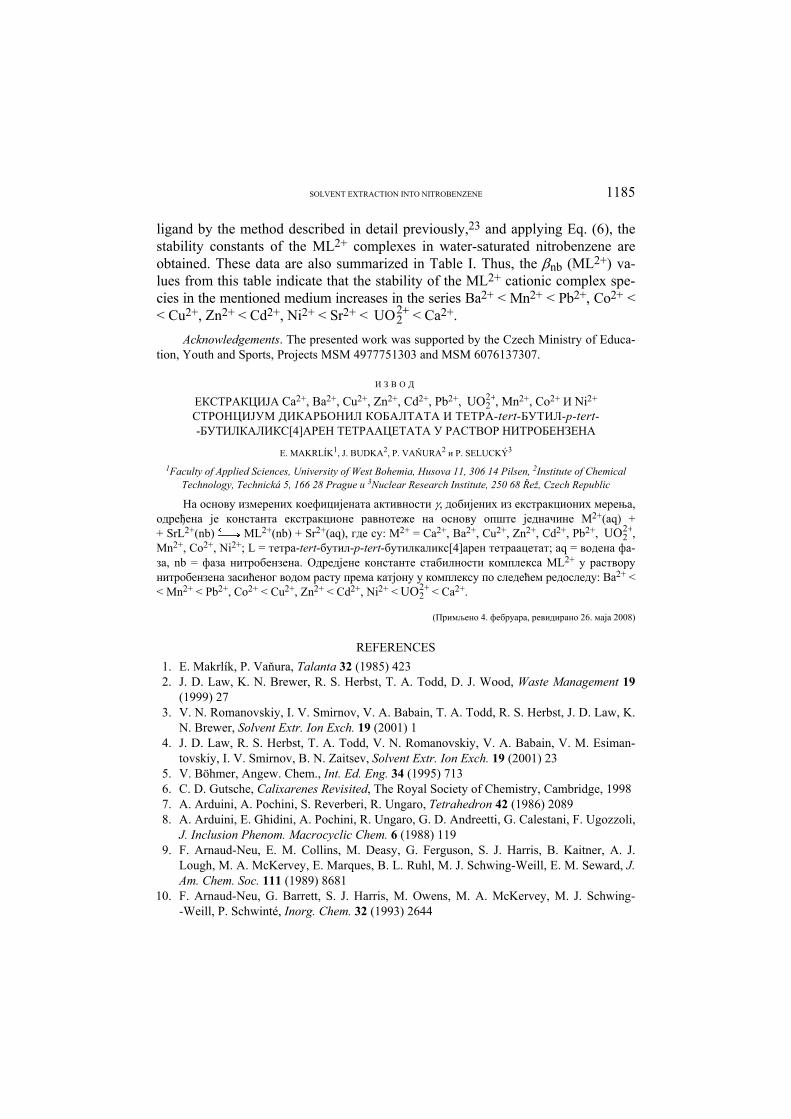
SOLVENT EXTRACTION INTO NITROBENZENE 1185
ligand by the method described in detail previously,23 and applying Eq. (6), the stability constants of the ML2+ complexes in water-saturated nitrobenzene are obtained. These data are also summarized in Table I. Thus, the nb (ML2+) va-lues from this table indicate that the stability of the ML2+ cationic complex spe-cies in the mentioned medium increases in the series Ba2+ < Mn2+ < Pb2+, Co2+ < < Cu2+, Zn2+ < Cd2+, Ni2+ < Sr2+ < 2
2UO < Ca2+.
Acknowledgements. The presented work was supported by the Czech Ministry of Educa-tion, Youth and Sports, Projects MSM 4977751303 and MSM 6076137307.
И З В О Д
ЕКСТРАКЦИЈА Ca2+, Ba2+, Cu2+, Zn2+, Cd2+, Pb2+, 22UO , Mn2+, Cо2+ И Ni2+
СТРОНЦИЈУМ ДИКАРБОНИЛ КОБАЛТАТА И ТЕТРА-tert-БУТИЛ-p-tert- -БУТИЛКАЛИКС[4]АРЕН ТЕТРААЦЕТАТA У РАСТВОР НИТРОБЕНЗЕНА
E. MAKRLÍK1, J. BUDKA2, P. VAŇURA2 и P. SELUCKÝ3
1Faculty of Applied Sciences, University of West Bohemia, Husova 11, 306 14 Pilsen, 2Institute of Chemical Technology, Technická 5, 166 28 Prague i 3Nuclear Research Institute, 250 68 Řež, Czech Republic
На основу измерених коефицијената активности , добијених из екстракционих мерења, одређена је константа екстракционе равнотеже на основу опште једначине M2+(aq) + + SrL2+(nb) ML2+(nb) + Sr2+(aq), где су: М2+ = Ca2+, Ba2+, Cu2+, Zn2+, Cd2+, Pb2+, 2
2UO , Mn2+, Co2+, Ni2+; L = тетра-tert-бутил-p-tert-бутилкаликс[4]арен тетраацетат; аq = водена фа-за, nb = фаза нитробензена. Одредјене константе стабилности комплекса ML2+ у раствору нитробензена засићеног водом расту према катјону у комплексу по следећем редоследу: Ba2+ < < Mn2+ < Pb2+, Co2+ < Cu2+, Zn2+ < Cd2+, Ni2+ < 2
2UO < Ca2+.
(Примљено 4. фебруара, ревидирано 26. маја 2008)
REFERENCES
1. E. Makrlík, P. Vaňura, Talanta 32 (1985) 423 2. J. D. Law, K. N. Brewer, R. S. Herbst, T. A. Todd, D. J. Wood, Waste Management 19
(1999) 27 3. V. N. Romanovskiy, I. V. Smirnov, V. A. Babain, T. A. Todd, R. S. Herbst, J. D. Law, K.
N. Brewer, Solvent Extr. Ion Exch. 19 (2001) 1 4. J. D. Law, R. S. Herbst, T. A. Todd, V. N. Romanovskiy, V. A. Babain, V. M. Esiman-
tovskiy, I. V. Smirnov, B. N. Zaitsev, Solvent Extr. Ion Exch. 19 (2001) 23 5. V. Böhmer, Angew. Chem., Int. Ed. Eng. 34 (1995) 713 6. C. D. Gutsche, Calixarenes Revisited, The Royal Society of Chemistry, Cambridge, 1998 7. A. Arduini, A. Pochini, S. Reverberi, R. Ungaro, Tetrahedron 42 (1986) 2089 8. A. Arduini, E. Ghidini, A. Pochini, R. Ungaro, G. D. Andreetti, G. Calestani, F. Ugozzoli,
J. Inclusion Phenom. Macrocyclic Chem. 6 (1988) 119 9. F. Arnaud-Neu, E. M. Collins, M. Deasy, G. Ferguson, S. J. Harris, B. Kaitner, A. J.
Lough, M. A. McKervey, E. Marques, B. L. Ruhl, M. J. Schwing-Weill, E. M. Seward, J. Am. Chem. Soc. 111 (1989) 8681
10. F. Arnaud-Neu, G. Barrett, S. J. Harris, M. Owens, M. A. McKervey, M. J. Schwing- -Weill, P. Schwinté, Inorg. Chem. 32 (1993) 2644

1186 MAKRLÍK et al.
11. K. Ohto, E. Murakami, T. Shinohara, K. Shiratsuchi, K. Inoue, M. Iwasaki, Anal. Chim. Acta 341 (1997) 275
12. Z. Ye, W. He, X. Shi, L. Zhu, J. Coord. Chem. 54 (2001) 105 13. A. F. Danil de Namor, S. Chahine, D. Kowalska, E. E. Castellano, O. E. Piro, J. Am.
Chem. Soc. 124 (2002) 12824 14. P. M. Marcos, J. R. Ascenso, M. A. P. Segurado, J. L. C. Pereira, J. Inclusion Phenom.
Macrocyclic Chem. 42 (2002) 281 15. P. M. Marcos, S. Félix, J. R. Ascenso, M. A. P. Segurado, J. L. C. Pereira, P. Khazaeli-
-Parsa, V. Hubscher-Bruder, F. Arnaud-Neu, New J. Chem. 28 (2004) 748 16. E. Makrlík, J. Budka, P. Vaňura, P. Selucký, J. Radioanal. Nucl. Chem. 277 (2008) 487 17. E. Makrlík, Collect. Czech. Chem. Commun. 57 (1992) 289 18. J. Rais, Collect. Czech. Chem. Commun. 36 (1971) 3253 19. P. Vaňura, Czech. J. Phys. 49 Suppl. S1 (1999) 761 20. P. Vaňura, E. Makrlík, J. Rais, M. Kyrš, Collect. Czech. Chem. Commun. 47 (1982) 1444 21. I. Podzimek, M. Kyrš, J. Rais, J. Inorg. Nucl. Chem. 42 (1980) 1481 22. E. Makrlík, P. Vaňura, Z. Phys. Chem., in press 23. E. Makrlík, P. Vaňura, J. Radioanal. Nucl. Chem. 267 (2006) 699 24. M. Daňková, E. Makrlík, P. Vaňura, J. Radioanal. Nucl. Chem. 221 (1996) 251 25. E. Makrlík, P. Vaňura, J. Radioanal. Nucl. Chem. 214 (1996) 339 26. E. Makrlík, P. Vaňura, Monatsh. Chem. 137 (2006) 157.

J. Serb. Chem. Soc. 73 (12) 1187–1196 (2008) UDC 547.672:54.02:54–74:537.872 JSCS–3798 Original scientific paper
doi: 10.2298/JSC0812187W 1187
Electronic structures and spectra of conducting anthracene derivatives
ZHONGFA WANG and SHI WU*
Department of Chemistry, Zhejiang University, Hangzhou 310027, PRC
(Received 20 June, revised 26 November 2007)
Abstract: Theoretical studies on anthracene and a series of its derivatives were performed using the AM1 method and DFT. Based on B3LYP/6-31G(d) opti-mized geometries, the electronic, IR and NMR spectra of anthracene oligomers were calculated using the Indo/Cis, AM1 and B3LYP/6-31G(d) methods, res-pectively. The energy gaps of the oligomers decreased and the main absorp-tions in the electronic spectra of the oligomers were red-shifted, whereas the IR frequencies for some of the C=C and C–H bonds were blue-shifted with in-creasing chain length and in the presence of substituents. The 13C-NMR chemi-cal shifts of the bridged carbon atoms were upfield shifted in the presence of an electron-donating group, while the chemical shifts of the carbon atoms on the two side rings of the anthracene moiety shifted downfield in the presence of an electron-withdrawing group.
Keywords: anthracene; conducting polymer; energy gap; chemical shift; B3LYP/6-31G(d).
INTRODUCTION
Many polymers possess conductive properties, which has stimulated inten-sive interest of scientists. These conducting polymers are often classified into polythiophene,1–3 polypyrrole,4 polyheterocycles,5,6 polyaniline7 and polyaryl rings.8–12 Henze et al. reported that the stabilities of polythiophene assemblies are enhanced with increasing chain length.1 Methoxyl substitution in conducting polymers containing conjugated bithiazole moieties led to an improvement of the solubility.5 For conducting copolymers of pyridine with thiophene, n-doped states are more stable than p-doped states.6 Conducting and insulating phases are pos-sibly located in the same polymer.7 Polymers containing dimethyldihydropyene can be designed for optoelectronic redox switching by the introduction of a pho-tochromic unit.8 New phenanthroline dicarboxamide-based helical foldamers can promote the polymerization of aromatics and oligoamides for potential applica-
* Corresponding author. E-mail: [email protected]

1188 WANG and WU
tions in biology and material science.11 Weibin et al. achieved the synthesis and characterization of soluble oligo(9,10-bisalkynylanthrylene)s.12
There are some reports on important properties of anthracene polymers, which are of interest for possible applications. Many anthracene moieties are photolu-minescent, and polymers containing such units as a part of the extended -elec-tron system are also likely to be electroluminescent. A film of poly(anthracene- -2,6-diyl) was found to be electroconducting after being doped with potassium naphthalenide polymers and ferric chloride, with conductivities of 4.0×10⁻² and 0.12 S cm–1, respectively. These film showed yellow-green luminescence.13 Po-lyanthracene is partly soluble in organic solvents and its soluble part is a strong blue light emitter.14 On the other hand, poly(9,10-anthracene diylidene) exhibits thermochromism and high thermal stability.15–17
However, there are only a few theoretical reports on the electronic structure and spectroscopy of anthracene derivatives. Herein, a series of such oligomers were designed to explore the effects of chain length and substituents on the energy gaps and spectra. These properties are useful to explain the conductivities and stabilities of conducting polymers.
METHODOLOGY
A linear polymer can be considered as a one-dimensional box. Electrons are delocalized and move over the whole system. Then, a minimum on the potential curve can be found. Based on the monomer anthrylene (compound 1), compounds 2–4 and 5–11 were designed by increasing the chain length and changing the substituents, respectively (Fig. 1). The chain was elongated via 2,6-linkage and the substituents were inserted at the 9,10-positions on the an-thrylene unit.
Fig. 1. The structures of compounds 1–11. Compound 1: n = 1, R = H; Compound 2: n = 2, R = H; Compound 3: n = 3, R = H; Compound 4: n = 4, R = H; Compound 5: n = 1, R = NH2; Compound 6: n = 1, R = NO2; Com-pound 7: n = 2, R = NH2; Compound 8: n = 2, R = NO2; Compound 9: n = 3, R = NH2; Compound 10: n = 3, R = NO2; Compound 11: n = 4, R = NH2.
Full geometry optimization of these compounds without any symmetry restriction was performed step by step using the AM1 method and DFT at the B3LYP/STO-3G, B3LYP/3- -21G and B3LYP/6-31G(d) levels (the optimized geometry of compound 11 at B3LYP/6- -31G(d) level is shown in Fig. S1 in the Supplement, available only in electronic form at http://www.shd.org.rs/jscs).
The AM1 method and DFT in the Gaussian 03 program18 were successfully employed to study the electronic structures and spectroscopic characteristics of supramolecular com-plexes,19–22 intramolecular hydrogen bonding species,23 conducting polymers24,25 and carbon clusters.26–29 Based on the B3LYP/6-31G(d) optimized geometries of the compounds, the configuration interaction was investigated using the Indo/Cis method.30 By exciting electrons from the 14 highest occupied molecular orbits into the 14 lowest unoccupied orbits, this led to

STRUCTURES OF CONDUCTING ANTHRACENE DERIVATIVES 1189
the generation of 196 configurations. Subsequently, the IR frequencies were computed using the AM1 method. Finally, 13C-NMR chemical shifts were calculated using the Giao method at the B3LYP/6-31G(d) level.
RESULTS AND DISCUSSION
LUMO–HOMO energy gaps
The LUMO–HOMO energy gaps of the unsubstituted compounds 1–4 gra-dually decreased with increasing value of n (Table I); those of compounds 5, 7, 9 and 11 with R = NH2 and of compounds 6, 8 and 10 with R = NO2 showed the same regularity. With decreasing energy gap, electrons can be easily excited from the ground state and, hence, the conductivities of the oligomers increased over those of the monomers. It was experimentally shown that the energy gap of oligo(9,10--bialkynylanthrylene)s decreased from 2.60 (n = 1) to 2.31 eV (n = 5),12 support-ing the above calculation results. The energy gaps of polyanthrylene, and its de-rivatives substituted by amino and nitrate groups were predicted via the extra-polation method to be 2.95, 2.38 and 2.73 eV.25 On the other hand, the energy gaps of compounds 5 and 6 are less than that of compound 1, owing to the pre-sence of the substituents. The electron-donating group affects the energy gap more than the electron-withdrawing group. Comparing the energy gaps of compounds 7–10 with that of compound 1, the same conclusion as above can be drawn. The HOMO energy of the oligomer increased, and the energy gap decreased in the presence of the electron-donating group,31 which supports the present calcula-tions. Therefore, the presence of substituents decreases the energy gaps, improves the conductivities and also enhances the solubilities of the oligomers.
TABLE I. Several variables of compounds 1–11 optimized at the B3LYP/6-31G(d) level
Compounds Variable
1 2 3 4 5 6 7 8 9 10 11
Energy gap / eV 3.599 3.230 3.045 2.995 2.902 3.182 2.615 2.913 2.463 2.760 2.393 / eV 1.800 1.615 1.523 1.478 1.451 1.591 1.308 1.457 1.232 1.380 1.197 / eV 3.429 3.480 3.506 3.520 2.803 4.652 2.871 4.780 2.910 4.849 2.926 IP / eV 5.228 5.095 5.028 4.997 4.254 6.243 4.178 6.236 4.141 6.229 4.122 EA / eV 1.629 1.865 1.983 2.042 1.352 3.061 1.563 3.323 1.678 3.469 1.729
In addition to C2–C6 coupling of the anthracene units in Fig. 1, coupling at the 9,10-positions was also considered. The energy gaps of the analogous oligo-mers (n = 1, 2, 3) formed via 9,10-linkages were calculated to be 3.599, 2.144 and 1.158 eV at the B3LYP/6-31G(d) level, respectively. The energy gaps de-creased with increasing chain length. Compared with those obtained for 2,6-lin-kages in Table 1, the energy gaps of the oligomers with 9,10-linkage become small. Since C9 and C10 are located at the middle positions of the anthracene unit, the 9,10-lingkage is favorable for the overlapping of the electron cloud be-

1190 WANG and WU
tween neighboring anthracene units. Hence, polyanthracenes formed via 9,10-lin-kages will exhibit better conductivities than those formed via 2,6-lingkages.
Some important variables
Conducting polymers generally display poor thermodynamic stabilities due to their expanded conjugated structures. The improvement of their stability is a main problem. The influence of substituents on stability was investigated in this study. The ionization potential (IP), electron affinity (EA), absolute hardness () and absolute electron negativity () (Table I) changed linearly as the chain length increased. The IP and values of compounds 1–4 decreased with increasing n. Thus, polyanthrylene easily looses electrons and its thermal stability becomes worse. Simultaneously the EA and of compounds 1–4 grew more, leading to the easy reduction of polyanthrylene. Then the polymer is reactive. The experimental IP values of the substituted anthrylene decreased from 5.45 (n = 1) to 5.29 eV (n = 5), whereas the EA values increased from 2.85 (n = 1) to 2.98 eV (n = 5),12 supporting the above calculation results. Observing the values of the four vari-ables of compounds 5, 7, 9 and 11 and 6, 8 and 10, it can be concluded that the polyanthrylenes substituted by electron-withdrawing and donating groups also possess sensitive redox characteristics.
The IP and EA values of compound 5 are lower than those of compound 1, thus it is easy inject holes into compound 5. The IP and EA values of compound 6 are higher than those of compound 1, thus compound 6 easily catch electrons. Hence, the presence of the electron-donating group leads to easy oxidation, whereas the electron-withdrawing group stimulates reduction of the substituted polyan-thrylenes. The values of compounds 5 and 6 are lower than that of compound 1, thus the presence of the substituents does not improve the thermal stability of the polymer.
Intrinsic conducting materials with large EA and values, such as com-pounds 6, 8 and 10, are likely to undergo n-doping. Compounds 5, 7, 9 and 11 of lower IP have a low oxidation potential, resulting in a low resistance and good conductivity. For example, the anthrylene pentamer with the electron-donating group displays a large charge carrier mobility of 2.95×10⁻³ cm2 V–1·s–1.12
Electronic absorption spectra
The main absorption peaks in the electronic spectrum of compound 1 were calculated to be at 215.8, 230.6, 276.6 and 317.4 nm. The first absorption at 317.4 nm was scaled by the multiplier 1.18, although its oscillator strength, 0.0109, was small compared with the experimental result 375 nm.14 There was a large red-shift in the absorptions at 228.1, 267.4, 296.1, 354.4 and 364.6 nm of compound 2 compared with those of compound 1 (Fig. 2; the electronic spectra of other compounds are given in Fig. S2 of the Supplement). Simultaneously, the bands of compound 2 are split and broadened due to its low symmetry because

STRUCTURES OF CONDUCTING ANTHRACENE DERIVATIVES 1191
the two anthrylene planes are not coplanar in the presence of the large steric ef-fect. The absorptions at 235.2 and 362.4 nm of compound 3 were red-shifted re-lative to 228.1 and 354.4 nm of compound 2. Those at 306.5 and 366.0 nm of compound 4 were also red-shifted in comparison with 304.3 and 362.4 nm of com-pound 3. Thus, the main absorption bands were red-shifted as the chain length in-creased, which is in agreement with the experimental conclusion that the first UV absorptions of substituted anthrylene are red-shifted as n increases from 1 to 5.12
200 250 300
0.0
0.4
0.8
1.2
1.6
317.4
Osc
illat
or s
tren
gth
/ nm
Compound 1230.6
215.8
276.6
200 250 300 350
0.0
0.5
1.0
1.5
2.0
2.5
3.0
367.6
Osc
illat
or
stre
ngt
h
/ nm
Compound 2 296.1
267.4228.1
354.4
Fig. 2. The electronic spectra of compounds 1 and 2 calculated by the Indo/Cis method.
The first peak of compound 5 appeared at 395.2 nm, arising from the -* transition of the HOMO (39) to the LUMO (40), in view of the valence electrons of the Indo method. This absorption was red-shifted compared with that of com-pound 1, which was caused by substitution with NH2 groups. The contribution coefficients of the Pz atomic orbitals of the two nitrogen atoms to the HOMO (39) are 0.2256 and –0.2256, and those to the LUMO (40) are both –0.1104. Obviously, the atomic orbitals of the nitrogen atoms participate in the formation of the molecular orbitals and play an important role in the frontier orbitals. This effect results in a decrease of the energy gap and red-shifts of the main electronic transitions. Similarly, the main peaks of compounds 5, 7, and 9 are sequentially red-shifted.
The main peaks of compound 6, appearing at 257.0 and 296.4 nm, were red- -shifted compared with 230.6 and 276.6 nm of compound 1. This is caused by the substitution of the NO2 group. These two absorptions of compound 6 are blue- -shifted in contrast to 262.5 and 395.2 nm of compound 5. The presence of the electron-donating group in compound 5 leads to a smaller energy gap. The strong-est peaks at 257.0, 287.2 and 292.0 nm of compounds 6, 8 and 10 were gradually red-shifted, which is ascribed to the lower energy gap and decrease in symmetry with elongation of the chain length.

1192 WANG and WU
IR spectra
The stabilities of polymers are related to the delocalization of electrons and strength of the main chain bonds, which can be reflected in the IR spectra. The main absorption peaks in the IR spectrum of compound 1 were calculated to be at 723.4, 880.7 and 3289.0 cm–1. The first two bands are assigned to the C–H out- -of-plane deformation vibrations, which are consistent with the experimental re-sults of 725 and 883 cm–1.14 The last one is attributed to the C–H stretching vibration. There were large blue-shifts in the absorptions at 736.0, 903.2 and 3289.9 cm–1 of compound 2 relative to those of compound 1 (Fig. 3; the IR spec-tra of the other compounds are given in Fig. S3 of the Supplement). Simultane-ously, the number of the absorptions increased with increasing chain length. These absorptions of compound 2 were further blue-shifted to 737.5, 908.0 and 3290.0 cm–1 in compound 3. This indicates that the C–H bonds were strengthened with enlargement of the conjugation system and delocalization of the electrons.
1000 2000 3000
0
20
40
60
80
100
120
140
160
1428.7
Inte
nsi
ty
/ cm-1
Compound 1
723.4
880.7
3289.0
1000 2000 3000
0
20
40
60
80
100
120
140
160
Inte
nsity
/ cm-1
Compound 2
736.0
1277.5903.2
3289.9
Fig. 3. The IR spectra of compounds 1 and 2 calculated by the AM1 method.
The main IR absorptions of compound 5 were at 846.4, 1660.8 and 3292.7 cm–1, i.e., blue-shifted relative to the corresponding bands of compound 1 at 880.7, 1428.7 and 3289.0 cm–1. The absorption at 1660.8 cm–1 of compound 5 is generated by the stretching vibration of the C=C bonds, which is basically con-sistent with the experimental frequency at 1597 cm–1 of the C=C bonds in poly-naphthylene.10 The IR band at 1660.8 cm–1 of compound 5 could be due to de-formation vibration of the N–H bond of the primary aromatic amine. The pre-sence of the electron-donating groups in compound 5 elevates the electron den-sity on the anthrylene ring and strengthens the C=C and C–H bonds. The main absorptions at 850.0, 3292.9 and 3363.8 cm-1 arising from the C–H and N–H bonds in compound 7 were blue-shifted compared with those of compound 5. The N–H stretching vibration at 3363.8 cm–1 in compound 7 is less strong than

STRUCTURES OF CONDUCTING ANTHRACENE DERIVATIVES 1193
the O–H stretching vibration at 3383 cm–1 in polynaphthylene.10 The absorption at 1658.8 cm–1 resulting from the C=C bonds in compound 7 was red-shifted relative to that of compound 5. The main absorptions at 853.4, 3293.3 and 3364.7 cm–1 in compound 9 were blue-shifted, whereas the absorption at 1658.1 cm–1 was red-shifted in comparison with the corresponding bands in compound 7. The electron density on the anthrylene ring decreased as the chain length increased, leading to a weakening of the C=C bonds and a strengthening of the C–H and N–H bonds.
The main IR absorptions caused by the C–H bonds of compounds 6, 8 and 10 compared with those of compounds 5, 7 and 9 were blue-shifted, whereas those arising from the C=C bonds were red-shifted. The absorptions near 1867 cm–1 of compounds 6, 8 and 10 resulted from N=O bonds, which were stronger than the C=O bonds with an experimental stretching frequency at 1743 cm–1.32 The -electron density on the anthrylene ring was delocalized in the presence of the –NO2, which reduced the strength of the C=C bonds.
NMR spectra
The change in electron density of the carbon atoms and symmetry of the oli-gomers can be observed in the NMR spectra, which are helpful in understanding the stabilities of polymers. The chemical shifts of the hydrogen atoms in the 1H-NMR spectra of compounds 1–3 were calculated to be in the ranges 5.4–9.2, 5.3–11.9 and 5.3–12.1 ppm, respectively. Thus, the range of the values of the hydrogen atoms was enlarged and the data were shifted downfield with in-creasing n. The electrons on the hydrogen atoms were delocalized and the shield-ing effect was reduced with the increasing chain length. The data of the hydro-gen atoms on the naphthylene ring were determined to be at 7.1–7.6 ppm,10 which supports the above calculation.
The values of the carbon atoms in the 13C-NMR spectrum of compound 1 appeared in the range 126.2–195.9 ppm. The absorption at 126.2 ppm arose from C(9) and C(10), whereas the absorption at 195.9 ppm is ascribed to C(11)–C(14). The data of C(2) and C(6) for the linkage of the two anthrylene rings in com-pound 2 were shifted downfield to 167.1 ppm (Fig. 4; the NMR spectra of the other compounds are given in Fig. S4 of the Supplement), and the C–C bond was weakened because of the formation of the dimer. In the naphthylene oligomer, the values of the two linkage carbon atoms were also downfield shifted from 118.7 to 120.6 ppm.10 The 13C-NMR absorptions of compound 3 were split be-cause of the decreased symmetry. The data of C(9) and C(10) in compound 5 were shifted downfield to 130.1 ppm, while those of C(11)–C(14) were shifted upfield till 170.3 ppm. The situation was similar for compound 7. The presence of the electron-donating group decreased the electron density on the neighboring carbon atoms but increases that on the bridged carbon atoms. The data of C(9)

1194 WANG and WU
and C(10), and C(11)–C(14) in compound 6 were shifted upfield to 87.2 and 184.4 ppm, respectively, while those of C(1), C(4), C(5) and C(8), and C(2), C(3), C(6) and C(7) were shifted downfield to 159.6 and 169.2 ppm, respecti-vely. A similar regularity was observed in the bands of compound 8. The pre-sence of the electron-withdrawing group reduces the electron density on the two side rings, but elevates that on the middle ring in the anthrylene unit.
120 140 160 180 2000
1
2
3
4
Inte
nsity
/ ppm
Compound 1
126.2
143.0 159.5 195.9
120 140 160 180 2000
1
2
Inte
nsity
/ ppm
Compound 2
125.5 167.1 195.3
Fig. 4. 13C-NMR spectra of compounds 1 and 2 calculated on the B3LYP/6-31G(d) level.
CONCLUSIONS
The electronic structures and spectroscopic characteristics of the anthrylene oligomers were affected by the chain length and substituents. The energy gaps of the oligomers decreased with increasing number of repeating units, thus polyan-thrylene becomes a conducting polymer. The presence of the substituents decreases the energy gaps of the oligomers. Substitution by NO2 or NH2 groups and elon-gation of the chain length lead to red-shifts of the main absorptions in the elec-tronic spectra of the oligomers. The electron density on the bridged carbon atoms in the anthrylene ring was elevated on substitution by amino groups; thus the C=C and C–H bonds are strengthened. The anthrylene polymer with the amino groups was predicted to be a better conducting material because of its lower oxi-dation potential and energy gap.
SUPPLEMENT
Available in electronic form only (http://www.shd.org.rs/JSCS/).

STRUCTURES OF CONDUCTING ANTHRACENE DERIVATIVES 1195
И З В О Д
ЕЛЕКТРОНСКА СТРУКТУРА И СПЕКТРИ ПРОВОДНИХ ДЕРИВАТА АНТРАЦЕНА
ZHONGFA WANG и SHI WU
Department of Chemistry, Zhejiang University, Hangzhou 310027, PRC
Теоријске студије антрацена и серије његових деривата изведене су помоћу AM1 ме-тоде и DFT. На основу B3LYP/6-31G(d) оптимизованих геометрија израчунати су електрон-ски, IR и NMR спектри антраценових олигомера помоћу Indo/Cis, AM1 and B3LYP/6-31G(d) метода, респективно. Разлике у енергетским нивоима олигомера се смањују, а главни ап-сорпциони максимуми им се померају ка црвеном делу спектра, док су IR фреквенције неких C=C and C–H веза померене ка плавом делу спектра са повећањем дужине ланца и у при-суству супституента. 13C-NMR хемијска померања чворних атома угљеника померају се ка мањим вредностима у присуству електрон-донорских група, док се вредности угљени-кових атома спољашњих прстенова антраценских делова молекула повећавају у присуству електрон-акцепторских група.
(Примљено 20. јуна, ревидирано 26. новембра 2007)
REFERENCES
1. O. Henze, W. J. Feast, F. Gardebien, P. Jonkheijm, R. Lazzaroni, P. Leclère, E. W. Meijer, A. P. H. J. Schenning, J. Am. Chem. Soc. 128 (2006) 5923
2. P. Lu, G. M. Xia, J. Serb. Chem. Soc. 70 (2005) 201 3. G. M. Xia, P. Lu, G. B. Xu, J. Serb. Chem. Soc. 69 (2004) 335 4. C. Visy, E. Pinter, T. Fülei, R. Patakfalvi, Synth. Met. 152 (2005) 13 5. I. H. Jenkins, P. G. Pickup, Macromolecules 26 (1993) 4450 6. I. H. Jenkins, U. Salzner, P. G. Pickup, Chem. Mater. 8 (1996) 2444 7. J. Y. Bergeron, L. H. Dao, Macromolecules 25 (1992) 3332 8. M. J. Marsella, Z. Q. Wang, R. H. Mitchell, Org. Lett. 2 (2000) 2979 9. I. Cianga, Y. Yagci, Prog. Polymer Sci. 29 (2004) 387
10. Y. Sasada, Y. Shibasaki, M. Suzuki, M. Ueda, Polymer 44 (2003) 355 11. Z. Q. Hu, H. Y. Hu, C. F. Chen, J. Org. Chem. 71 (2006) 1131 12. W. Cui, X. Zhang, X. Jiang, H. Tian, D. Yan, Y. Geng, X. Jing, F. Wang, Org. Lett. 8
(2006) 785 13. Hodge, G. A. Power, M. A. Rabjohns, Chem. Commun. (1997) 73 14. B. Fan, L. Qu, G. Shi, J. Electroanal. Chem. 575 (2005) 287 15. M. Baumgarten, U. Müller, A. Bohnen, K. Müllen, Angew. Chem. Int. Edn. Engl. 31
(1992) 448 16. I. Schopov, C. Jossifov, Polymer 19 (1978) 1449 17. M. Satoh, F. Uesugi, M. Tabata, K. Kaneto, K. Yoshino, J. Chem. Soc. Chem. Commun.
12 (1986) 979 18. M. J. Frisch, G. W. Trucks, H. B. Schlegel, G. E. Scuseria, M. A. Robb, J. R. Cheeseman,
J. A. Montgomery Jr., T. Vreven, K. N. Kudin, J. C. Burant, J. M. Millam, S. S. Iyengar, J. Tomasi, V. Barone, B. Mennucci, M. Cossi, G. Scalmani, N. Rega, G. A. Petersson, H. Nakatsuji, M. Hada, M. Ehara, K. Toyota, R. Fukuda, J. Hasegawa, M. Ishida, T. Nakajima, Y. Honda, O. Kitao, H. Nakai, M. Klene, X. Li, J. E. Knox, H. P. Hratchian, J. B. Cross, C. Adamo, J. Jaramillo, R. Gomperts, R. E. Stratmann, O. Yazyev, A. J. Austin, R. Cammi, C. Pomelli, J. W. Ochterski, P. Y. Ayala, K. Morokuma, G. A. Voth, P.

1196 WANG and WU
Salvador, J. J. Dannenberg, V. G. Zakrzewski, S. Dapprich, A. D. Daniels, M. C. Strain, O. Farkas, D. K. Malick, A. D. Rabuck, K. Raghavachari, J. B. Foresman, J. V. Ortiz, Q. Cui, A. G. Baboul, S. Clifford, J. Cioslowski, B. B. Stefanov, G. Liu, A. Liashenko, P. Piskorz, I. Komaromi, R. L. Martin, D. J. Fox, T. Keith, M. A. Al-Laham, C. Y. Peng, A. Nanayakkara, M. Challacombe, P. M. W. Gill, B. Johnson, W. Chen, M. W. Wong, C. Gonzalez, J. A. Pople, Gaussian 03, Revision B. 01, Gaussian Inc., Pittsburgh, PA 2003
19. S. Wu, Q. Teng, X. Chen, R. Zhou, Chem. J. Chin. Univ. 24 (2003) 1271 20. L. Zhu, Q. Teng, S. Wu, J. Serb. Chem. Soc. 72 (2007) 375 21. L. Qi, Q. Teng, S. Wu, Z. Liu, Chem. J. Chin. Univ. 26 (2005) 1909 22. Z. Wang, S. Wu, Chem. Pap. 61 (2007) 313 23. A. N. Pankratov, A. V. Shalabay, J. Serb. Chem. Soc. 72 (2007) 151 24. L. Ding, Y. Ding, Q. Teng, K. Wang, J. Chin. Chem. Soc. 54 (2007) 853 25. L. Yang, A. M. Ren, J. K. Feng, J. F. Wang, J. Org. Chem. 70 (2005) 3009 26. S. Wu, Q. Teng, Int. J. Quantum Chem. 106 (2006) 526 27. Q. Teng, S. Wu, J. Mol. Struct. (TheoChem) 756 (2005) 103 28. Q. Teng, S. Wu, J. Mol. Struct. (Theochem) 719 (2005) 47 29. Q. Teng, S. Wu, Int. J. Quantum Chem. 104 (2005) 279 30. M. A. Thompson, M. C. Zerner, J. Am. Chem. Soc. 113 (1991) 8210 31. M. A. Hsu, T. J. Chou, J. Chin. Chem. Soc. 52 (2005) 811 32. Z. Kačarević-Popović, D. Kostoski, L. Novaković, N. Miljević, B. Šećerov, J. Serb.
Chem. Soc. 69 (2004) 1029.

J. Serb. Chem. Soc. 73 (12) 1197–1209 (2008) UDC 546.78–261+546.92:544.6.004.2 JSCS–3799 Original scientific paper
doi: 10.2298/JSC0812197O 1197
Electrochemical properties of mixed WC and Pt-black powders MAJA D. OBRADOVIĆ1*#, BILJANA M. BABIĆ2, ANDRZEJ KOWAL3,
VLADIMIR V. PANIĆ1# and SNEŽANA LJ. GOJKOVIĆ4#
1Institute of Chemistry, Technology and Metallurgy, University of Belgrade, Njegoševa 12, 11001 Belgrade, Serbia, 2Vinča Institute of Nuclear Sciences, P. O. Box 522, 11001 Belgrade,
Serbia, 3Institute of Catalysis and Surface Chemistry, Polish Academy of Sciences, Niezapominajek 8, 30-239 Krakow, Poland and 4Faculty of Technology and Metallurgy, University of Belgrade, Karnegijeva 4, 11120 Belgrade, Serbia
(Received 7 July, revised 28 August 2008)
Abstract: The electrochemical characteristics of a mixture of Pt-black and WC powders and its catalytic activity for methanol and formic acid oxidation were investigated in acid solution. XRD and AFM measurements revealed that the WC powder employed for the investigation was a single-phase material con-sisting of crystallites/spherical particles of average size of about 50 nm, which were agglomerated into much larger particles. Cyclic voltammetry showed that the WC underwent electrochemical oxidation, producing tungstate species. In the case of the mixed Pt + WC powders, the tungstate species were deposited on the Pt as a thin film of hydrous tungsten oxide. Enhanced hydrogen inter-calation in the hydrous tungsten oxide was observed and it was proposed to be promoted in mixed powders by the presence of hydrogen adatoms on bare Pt sites. The determination of Pt surface area in the Pt + WC layer by stripping of underpotentially deposited Cu revealed that the entire Pt surface was accessible for underpotential deposition of Cu. Investigation of the electrochemical oxi-dation of methanol and formic acid on Pt + WC and pure Pt layers did not in-dicate electrocatalytic promotion due to the presence of WC.
Keywords: tungsten carbide; platinum; hydrogen intercalation; methanol oxi-dation; formic acid oxidation.
INTRODUCTION
It is expected that fuel cell research and development will provide an en-vironmental friendly power source for vehicles and portable electronic devices. Proton exchange membrane fuel cells (PEMFC) are advantageous since they ope-rate at low temperatures and hence do not require expensive or large containment structures. Oxygen reduction is the cathodic reaction in PEMFCs, while the oxi-
* Corresponding author. E-mail: [email protected] # Serbian Chemical Society member.

1198 OBRADOVIĆ et al.
dation of hydrogen or some small organic molecule occurs on the anode. Me-thanol distinguishes itself from other fuels because it is an inexpensive liquid and easy for handling, storage and transport.1 Formic acid is another example since its oxidation commences at a less positive potential than methanol oxidation, while the crossover of formic acid through the polymer membrane is lower than that of methanol.2
Platinum is the most active single metal catalyst for the methanol oxidation reaction (MOR), although the onset potential is rather far from the thermodyna-mic value. Modification of Pt by various metals has been widely investigated, but there is general agreement that only Pt–Ru surfaces are much more active than single Pt. Recently, several researchers reported the use of tungsten carbide as a support for Pt particles3,4 because of the influence of tungsten species on the activity of Pt for the MOR. Some earlier investigations of the MOR showed enhancement of the reaction rate on rare earth tungsten bronze doped with Pt,5 platinum–tungsten oxide,6,7 carbon-supported platinum modified with WOy8 and high surface area tungsten oxide containing Pt centers.9 However, it was also reported that the presence of polyoxotungstates on Pt can suppress the interfacial formation of PtOH/PtO,10 which participates in the oxidation process of organic molecules. On the other hand, Pt/WC exhibited a lower onset potential for CO oxidation than Pt nanoparticles supported on high surface area carbons, but the activities of Pt/WC and Pt/C for the MOR were similar.4
The results of an investigation of the electrochemical properties of a mixture of Pt-black and WC powders are reported in this work. The aim of the investi-gation was to give basic insight into the activity of the mixture in the oxidation of small organic molecules with respect to Pt alone. This study should supply addi-tional information whether the synthesis of Pt nanoparticles supported on tungs-ten-based materials would be beneficial.
EXPERIMENTAL
Platinum black powder (Alfa Aesar, BET specific surface area: 24–29 m2 g-1) and tungs-ten carbide powder, provided by Woksal, Užice, Serbia, were used as the electrocatalysts. The powders were applied onto a glassy carbon substrate (Tacussel rotating disk electrode, 5 mm in diameter) from the ink to form a thin layer.11 The Pt black powder was suspended in high purity water, while WC and the mixture of WC and Pt black were suspended in 2-propanol (Merck). In all cases, 50 l of a Nafion® solution (5 wt. %, 1100 E.W., Aldrich) was added per 1.0 cm3 of the suspension, in order to insure adhesion of the layer. The concentrations of Pt and WC in the suspensions were 10 and 40 mg cm-3, respectively. After 1 h agitation in an ultrasonic bath (70 kHz), 5.0 l of the suspension was placed onto a glassy carbon electrode by micro-pipette and left to dry overnight.
It should be noted that in preliminary experiments, WC and WC + Pt suspensions were prepared in water, but a certain change of the suspension and data non-reproducibility were observed. The voltammetric responses of thin layers made day by day from the same water suspension differed, indicating a decrease in the Pt surface area.

ELECTROCHEMICAL PROPERTIES OF MIXED WC AND Pt POWDERS 1199
A three-compartment electrochemical glass cell with a large surface area Pt wire (99.998 % purity, Aesar) as the counter electrode and a saturated calomel electrode (SCE) as the refe-rence electrode was used. All the potentials reported in this paper are expressed on the scale of the reversible hydrogen electrode (RHE). The supporting electrolyte of 0.10 M H2SO4 (Merck) was prepared with high purity water (Millipore, 18 M cm resistivity). The electrolyte was deaerated by bubbling with N2 previously purified by flowing through an ammonium meta-vanadate solution. Electrochemical oxidation of methanol and formic acid were investigated in deaerated supporting electrolyte which contained 0.10 M CH3OH or 0.10 M HCOOH (Merck). The experiments were conducted at 298±0.5 K. A Pine RDE4 potentiostat and Philips PM 8143 X–Y recorder were employed.
WC powder was characterized by X-ray diffraction (XRD) analysis using a Siemens D500 diffractometer with CuK radiation over the 2 range from 10 to 90° at a scan rate of 0.04° s-1. To determine the WC surface area, adsorption/desorption isotherms of N2 were registered at –196 °C by the gravimetric McBain method. The appearance of WC powder was examined by atomic force microscopy (AFM) using a NanoScope 3D (Veeco, USA). A drop of WC suspension in 2-propanol was placed on a mica surface and left to dry. Then the ima-ging was performed in the contact mode using NanoProbes silicon nitride cantilevers with a force constant of 0.060 N m-1.
RESULTS AND DISCUSSION
Characterization of the WC
The XRD pattern of the WC powder (Fig. 1) indicates pure single-phase WC of hcp symmetry with the lattice parameters a0 b0 0.29053 nm and c0 = 0.28385 nm. The crystallite size, calculated from the width of the (101) peak using the Scherrer equation, was found to be about 40 nm. The BET real surface area of the WC was calculated to be 0.7 m2 g–1. Assuming spherical powder particles and taking 15.6 g cm–3 for the density of WC, a particle diameter corresponding to the BET surface area of 0.5 m was calculated. Comparison of the XRD and BET results indicates that the particles of WC powder are compact agglomerates of smaller crystallites. This was proved by the AFM technique. The typical appearance of a WC agglomerate consisting of densely-packed, nearly spherical particles of 50 to 150 nm in size is presented in Fig. 2.
Fig. 1. XRD Pattern of the WC powder sample.

1200 OBRADOVIĆ et al.
Fig. 2. The results of AFM analysis of WC powder: height image and cross section analysis.
Cyclic voltammograms of WC powder registered in 0.10 M H2SO4 are given in Fig. 3. When the potential was cycled between 0.050 and 0.75 V, the voltam-mogram was stable over time, featuring a broad anodic peak and an increase in the cathodic current at E < 0.40 V. In the first cycle toward more positive poten-tials (up to 1.25 V), an anodic peak at ≈ 1.06 V, followed by a subsequent in-crease in the anodic current was observed. In the second cycle, the peak and sub-sequent current decreased and finally reached steady-state values after the 20th cycle, as shown by the steady-state curve in Fig. 3. Upon resetting the positive potential limit back to 0.75 V, a voltammetric response like the very first one was regained.
In the presence of water and/or oxygen, WC oxidizes to surface oxide and/or soluble W(VI) species:12,13
WC + 5H2O → WO3 + CO2 + 10H+ + 10e– (1)
WC + 6H2O → WO42– + CO2 + 12H+ + 10e– (2)
The cyclic voltammogram of WC recorded in the narrow potential range (Fig. 3, 1st curve) resembles the voltammetric behavior of WO3,14 which indicates that the WC surface was in the oxidized state. The WO3 layer formed spontaneously on the WC surface was partially reduced in the cathodic scan by the intercalated hydrogen:15

ELECTROCHEMICAL PROPERTIES OF MIXED WC AND Pt POWDERS 1201
WO3 + xH+ + xe– → HxWO3 0.1 < x < 0.5 (3)
The HxWO3 species are known as hydrogen–tungsten bronzes. The cathodic current at E < 0.40 V should correspond to the hydrogen intercalation process, while the broad anodic peak is very likely due to deintercalation. The anodic peak at ~1.06 V can be assigned to further oxidation of WC.16 The products of this reaction are probably insoluble and their deposition on the electrode surface causes a decrease in the anodic current, as shown in Fig. 3.
Fig. 3. The first, second and steady state cyclic voltammograms of the WC thin layer (1.27 mg
WC cm-2) recorded in deaerated 0.10 M H2SO4 at 50 mV s-1. Inset: reciprocal of specific capacitance of the WC thin layer, calculated between 0.56 and 0.75 V from the
steady-state voltammograms, as a function of the square root of sweep rate.
Assuming that the intercalation/deintercalation processes are accomplished at potentials above 0.55 V, the double layer capacitance of the passive film on WC was estimated from the voltammetric charge between 0.56 and 0.75 V from the steady-state voltammograms. As the inset in Fig. 3 shows, the capacitance was slightly dependent on the sweep rate, due to the porous structure. Extra-polation of the reciprocal capacitance to zero sweep rate17 gives a total double layer capacitance of the film, Ctot, of 0.14 F g–1. Assuming the most typical value for double layer capacitance of 20 F cm–2, a specific surface area of 0.70 m2 g–1 is calculated, which coincides with the obtained BET surface area. This result indicates that native WC spherical particles within micro-sized agglomerates, as seen by AFM (Fig. 2) and calculated from XRD, are not accessible to the elec-trolyte, but only the surface defined by the agglomerates through the micro-pores of the layer.

1202 OBRADOVIĆ et al.
Voltammetry of the Pt + WC mixture
The voltammetric behavior of mixed WC and Pt black powders is illustrated in Fig. 4. The first cycle with a positive potential limit of 0.75 V resembles the hydrogen adsorption/desorption features of Pt sites. After extension of the posi-tive potential limit to 1.25 V, the cyclic voltammogram features the formation of Pt oxide and its reduction, as well as the development of a pair of peaks at 0.14 and 0.30 V, due to an intensive oxidation of WC. On cycling of the potential, the height of the peaks increased, while the anodic current due to the oxidation of WC decreased and eventually disappeared, similar to the behavior of pure WC powder (Fig. 3).
Fig. 4. Successive and steady state cyclic voltammograms of the WC + Pt thin layer (1.02 mg WC cm-2 + 0.25 mg Pt cm-2) recorded in de-aerated 0.10 M H2SO4 at 50 mV s-1.
The steady-state cyclic voltammograms of the single Pt black and WC pow-ders and the mixture of Pt and WC are presented in Fig. 5. Bearing in mind that in the mixed layer and in the single layers, the amounts of Pt are identical and the amounts of WC are similar, the voltammetric charges can be directly analyzed. It is obvious from Fig. 5 that the voltammetric features of the mixture are not the simple superposition of the voltammograms of its components. The charge under the peaks at 0.14/0.30 V is significantly higher than the charge for the monolayer adsorption/desorption of hydrogen on Pt particles present in the mixture and con-siderably higher in comparison to the hydrogen intercalation/deintercalation charge on WC. In addition, the formation of Pt-oxide is hindered in the presence of WC. Jeon et al.4 recently proposed that spillover of hydrogen from Pt to WC supplies a fresh Pt surface, resulting in the increased charge of H adsorption/desorption on the Pt sites. However, the peaks related to H adsorption/desorption on the Pt sites on the voltammogram of the Pt + WC mixture are displaced with respect to those of pure Pt or highly overlapped with the peaks at 0.14/0.30 V, related to the ca-talyzed oxidation of WC (Fig. 4). This observation leads to the assumption that soluble tungstate species, produced during the oxidation of WC, can be deposited onto Pt sites. The deposited layer is subjected to intercalation/deintercalation of

ELECTROCHEMICAL PROPERTIES OF MIXED WC AND Pt POWDERS 1203
hydrogen, which results in the appearance of pronounced peaks at 0.14/0.30 V. When WC alone was attached to the electrode surface, anodic oxidation of WC did not produce any additional voltammetric features (Fig. 3) related to the en-hanced intercalation/deintercalation process. This indicates that the deposition of intercalation-active tungstates occurs preferentially on Pt.
Fig. 5. Steady-state cyclic voltam-mograms of thin layers of WC (1.27 mg WC cm-2), Pt (0.25 mg cm-2) and Pt + WC (0.25 mg Pt cm-2 + 1.02 mg WC cm-2) record-ed in deaerated 0.10 M H2SO4 at 20 mV s-1.
To calculate the pseudocapacitance of the hydrogen intercalation in the WC and WC + Pt layers, the anodic parts of the voltammograms recorded at sweep rates from 5 to 400 mV s–1 were integrated in the potential range from 0.050 to 0.56 V. A dependence of the pseudocapacitance on the sweep rate was registered for both the WC and WC + Pt layers. Such a behavior is due to diffusion-limited pseudocapacitive process within the porous layer of hydrous tungsten oxide for-med atop the WC and Pt sites. According to the model proposed by Ardizzone et al.,18 the mobility of the protons involved in Reaction (3) is hindered by the po-rous structure of the layer, resulting in the following pseudocapacitance vs. sweep rate relationships:
vkCC
tot
11 (4)
v
kCC
'out (5)
where Ctot is the total capacitance of the porous structure, Cout is the capacitance of the outer layer surface (facing the bulk of the electrolyte), while the capaci-tance of the inner surface relates to the loose grain boundaries, Cin, can be calculated as Cin = Ctot – Cout.19
The C vs. v–1/2 and C–1 vs. v1/2 plots for WC and the mixture WC + Pt are presented in Fig. 6. Reasonably straight lines were obtained and the total pseudo-capacitances were calculated. From the C vs. v–1/2 plots (Fig. 6a), the pseudoca-pacitances related to the outer layer of hydrous tungsten oxide in both the WC

1204 OBRADOVIĆ et al.
and WC + Pt layer were determined. Since the pseudocapacitances calculated in this way include the double layer capacitance, its value of 0.14 F g–1 (inset in Fig. 3) was subtracted. In the case of the WC + Pt mixture, the pseudocapa-citance of hydrogen adsorption/desorption on Pt sites (which was found to be in-dependent of the sweep rate) was also subtracted from the total pseudocapaci-tance charge. This was done assuming that hydrogen adsorption is undisturbed by the presence of WC and the products of its oxidation. The corrected pseudoca-pacitances of hydrogen intercalation expressed per mass of WC are given in Tab-le I, from which it can be observed that the total pseudocapacitance is more than doubled in the presence of Pt and that the structure of the hydrous oxide layer is significantly changed. The Cout/Ctot ratio shows that for the hydrous oxide for-med on WC with no Pt in the film, only about 8 % of the electroactive sites were on the surface, indicating a highly porous structure. However, when Pt was pre-sent in the film, about 80 % of the electroactive sites were easily accessible sur-face sites. This can be rationalized if the Pt was partially covered by thin hydrous tungsten oxide layer with the majority of its active sites being surface sites facing the electrolyte. Such a film can exhibit a higher pseudocapacitance than that on WC without Pt in the layer only if the hydrogen atoms adsorbed on Pt sites spill-over to the hydrous tungsten oxide and intercalate in it.15,20
Fig. 6. a) C vs. v-1/2 and b) C-1 vs. v1/2 plots for WC and WC + Pt layer.

ELECTROCHEMICAL PROPERTIES OF MIXED WC AND Pt POWDERS 1205
TABLE I. Corrected values of the pseudocapacitance for hydrogen intercalation into hydrous tungsten oxide for WC and WC + Pt thin layers, calculated per mass of WC
Electrode Ctot / F g-1 Cout / F g-1 Cout/Ctot WC 2.17 0.165 0.076 Pt + WC 4.90 3.79 0.77
Determination of the Pt surface area in the WC + Pt electrode layer
The determination of the real surface area of a catalyst is a crucial point in the assessment of its activity. The surface area of Pt can be determined from the charge of hydrogen adsorption/desorption. In the calculation, it is assumed that a complete monolayer is formed, which requires 210 C cm–2. However, the hy-drogen adsorption/desorption features of Pt in the cyclic voltammogram of the WC + Pt mixture (Fig. 4) are partly discernible only when the anodic limit is set to before the onset of the oxidation of WC. After a substantial amount of WC had been oxidized, large peaks of hydrogen intercalation/deintercalation mask the Pt peaks. Therefore, some alternative method should be applied to determine Pt sur-face area. Recently, Green and Kucernak21 reported that the surface area of Pt alloyed with Ru can be successfully determined from the stripping of underpo-tentially deposited (UPD) copper. This method is also applicable to the WC + Pt system since the anodic peak of Cu stripping is more positive than the peak for hydrogen deintercalation from the hydrous tungsten oxide. In addition, WC alone was found to be inactive for UPD Cu.
Copper was underpotentially deposited from a solution of 0.10 M H2SO4 and 2.010–3 M CuSO4 at a potential of 0.330 V vs. RHE, which is about 15 mV more positive than the equilibrium potential of Cu electrodeposition in the ap-plied electrolyte. After 2 min of deposition, which is sufficient for a complete monolayer to be formed,21 the electrode potential was swept anodically and the stripping voltammogram was recorded. The result obtained for a polycrystalline Pt electrode and for a layer of Pt-black powder are shown in Fig. 7a and 7b, respectively. For sake of comparison, the cyclic voltammograms in the support-ing electrolyte are also given. The Cu stripping curves reveal at least three differ-rent energetic states of Cu, which are similar for polycrystalline Pt and Pt-black powder. The stripping curves, corrected for the background current of Pt, were integrated and the charges were compared to the hydrogen desorption charge. The Cu(UPD)/H(UPD) ratio was calculated to be 1.8 for polycrystalline Pt and 2.3 for Pt-black, which is close to the theoretical value of 2. These results con-firm that the Pt surface area can be estimated using the procedure of Cu UPD and stripping as described above. The experiment with the Pt + WC mixture show that the Cu stripping peak is shifted anodically but the charge beneath the peak corresponds to the surface area of Pt in the layer.

1206 OBRADOVIĆ et al.
Fig. 7. Cyclic voltammograms of: a) Pt polycrystalline electrode, b) thin layer of Pt (0.25 mg cm-2) and c) thin layer of Pt + WC (0.25 mg Pt cm-2 + 1.02 mg WC cm-2) recorded in 0.10 M H2SO4 (dashed lines) and Cu stripping voltam-mograms recorded in the presence of 2.010-3 M CuSO4 (solid lines) at 20 mV s-1.
Voltammetric experiments for the Pt + WC mixture revealed that a thin layer of hydrous tungsten oxide was deposited on Pt (Figs. 4 and 5, Table I). However, Cu stripping showed that the entire surface area of Pt in the film was accessible to Cu UPD. It should also be noted that formation of Pt-oxide was hindered by the presence of WC (Fig. 4) and that the Cu stripping peak was shifted anodically with respect to the peak on pure Pt (Fig. 7). Thus, it can be anticipated that small organic molecules, such as CH3OH and HCOOH, would be able to approach the Pt surface through the tungsten oxide film, but the electrocatalytic properties of the Pt might be changed due to the presence of the film, as indicated in the li-terature.5–9
Oxidation of methanol and formic acid
The oxidation of methanol and formic acid were investigated on a layer of the WC + Pt mixture after the steady-state voltammogram (Fig. 5) had been esta-blished. Methanol or formic acid was added into the cell while holding the poten-tial at 0.10 V. After 2 min, a potential sweep was applied at a rate of 1.0 mV s–1 and the polarization curve was recorded. Concerning the results of Cu stripping on the WC + Pt mixture, the current densities were calculated with respect to the entire surface area of Pt in the catalyst layer, assuming that the Pt sites were equally available for UPD of Cu and the oxidation of the organics. The same

ELECTROCHEMICAL PROPERTIES OF MIXED WC AND Pt POWDERS 1207
experiments were performed on pure Pt-black layers and the results were com-pared. The diagrams in Fig. 8 show overlapping of the results for pure Pt and the WC + Pt mixture, meaning that hydrous tungsten oxide formed by the oxidation of WC does not influence the activity of Pt for the oxidation of methanol and formic acid.
Fig. 8. Tafel plots for the oxidation of a) 0.10 M CH3OH and b) 0.10 M HCOOH on the thin layers of Pt and WC + Pt in deaerated 0.10 M H2SO4. Sweep rate: 1.0 mV s-1.
CONCLUSIONS
Cyclic voltammetry revealed that WC undergoes electrochemical oxidation, which produces tungstate species. In the case of the mixed WC + Pt powders, these species appeared to be deposited onto Pt in a form of a hydrous tungsten oxide. Enhanced hydrogen intercalation in the hydrous tungsten oxide was ob-served and it is proposed that this process was promoted by the spillover of the hydrogen adatoms on the bare Pt sites. The presence of WC in the Pt catalyst layer had no effect on the kinetics of methanol and formic acid oxidation, assu-ming that the part of Pt surface covered by hydrous tungsten oxide did not hinder the approach of the organics to the Pt beneath.
Acknowledgements. This work was financially supported by the Ministry of Science of the Republic of Serbia, contract Nos. 142048 and 142056.

1208 OBRADOVIĆ et al.
И З В О Д
ЕЛЕКТРОХЕМИЈСКA СВОЈСТВА СМЕШЕ ПРАХОВА WC И Pt
MAJA Д. ОБРАДОВИЋ1, БИЉАНА M. БАБИЋ2, ANDRZEJ KOWAL3,
ВЛАДИМИР В. ПАНИЋ1 и СНЕЖАНА Љ. ГОЈКОВИЋ4
1Institut za hemiju, tehnologiju i metalurgiju, Univerzitet u Beogradu, Wegoeva 12, 11001 Beograd, 2Institut za nuklearne nauke “Vin~a”, p. pr. 522, 11001 Beograd, 3Institute of Catalysis
and Surface Chemistry, Polish Academy of Sciences, Niezapominajek 8, 30-239 Krakow, Poland i 4Tehnoloko–metalurki fakultet,
Univerzitet u Beogradu, Karnegijeva 4, 11120 Beograd
У раду су испитиване електрохемијске карактеристике смеше прахова Pt и WC и њенa каталитичка активност за реакције оксидације метанола и мравље киселине у киселом рас-твору. Анализа резултата дифракције X-зрака (XRD) и микроскопије атомских сила (AFM) по-казују да је прах WC једнофазни материјал са просечном величином кристалита од око 50 nm, који су агломерисани у много веће честице. Циклична волтаметрија указује на то да WC под-леже оксидацији којом настају волфраматне врсте. У случају смеше прахова Pt и WC, вол-фраматне врсте највероватније се таложе на Pt у облику танког слоја хидратисаних оксида волфрама. Примећено је повећање интеркалације водоника у слоју хидратисаних волфрамата и претпоставља се да присуство адатома водоника на површини Pt потпомаже процес водо-ничне интеркалације. Одређивање површине Pt у слоју Pt + WC десорпцијом монослоја Cu таложеног на потпотенцијалима указује да је читава површина Pt доступна за таложење ато-ма Cu. Испитивање електрохемијских реакција оксидације метанола и мравље киселине на слоју смеше Pt + WC и слоју чисте Pt указује да присуство праха WC не утиче на електро-каталитичка својства Pt.
(Примљено 7. јула, ревидирано 28. августа 2008)
REFERENCES
1. S. Wasmus, A. Küver, J. Electroanal. Chem. 461 (1999) 14 2. X. Yu, P. Pickup, J. Power Sources 182 (2008) 24 3. R. Ganesan, J. S. Lee, Angew. Chem. Int. Ed. 44 (2005) 6557 4. M. K. Jeon, H. Daimon, K. R. Lee, A. Nakahara, S. I. Woo, Electrochem. Commun. 9
(2007) 2692 5. K. Machida, M. Enyo, G. Adachi, J. Shiokawa, J. Electrochem. Soc. 135 (1988) 1955 6. M. B. Oliveira, L. P. R. Profeti, P. Olivi, Electrochem. Commun. 7 (2005) 703 7. P. K. Shen, A. C. C. Tseung, J. Electrochem. Soc. 141 (1994) 3082 8. A. K. Shukla, M. K. Ravikumar, A. S. Aricò, G. Candiano, V. Antonucci, N. Giordano,
A. Hamnett, J. Appl. Electrochem. 25 (1995) 528 9. C. Bock, B. MacDougall, Electrochim. Acta 47 (2002) 3361
10. M. Chojak, A. Kolary-Zurowska, R. Wlodarczyk, K. Miecznikowski, K. Karnicka, B. Palys, R. Marassi, P. Kulesza, Electrochim. Acta 52 (2007) 5574
11. S. Lj. Gojković, A. V. Tripković, R. M. Stevanović, J. Serb. Chem. Soc. 72 (2007) 1419 12. J. D. Voorhies, J. Electrochem. Soc. 119 (1972) 219 13. M. H. Ghandehari, J. Electrochem. Soc. 127 (1980) 2144 14. E. J. McLeod, V. I. Birss, Electrochim. Acta 51 (2005) 684 15. P. J. Kulesza, L. R. Faulkner, J. Electrochem. Soc. 136 (1989) 707 16. H. Chhina, S. Campbell, O. Kesler, J. Power Sources 164 (2007) 431

ELECTROCHEMICAL PROPERTIES OF MIXED WC AND Pt POWDERS 1209
17. R. De Levie, in Advances in electrochemistry and electrochemical engineering, Vol. 6, P. Delahay Ed., Interscience, New York, 1967, p. 329
18. S. Ardizzone, G. Fregonara, S. Trasatti, Electrochim. Acta 35 (1990) 263 19. V. Panić, A. Dekanski, S. Milonjić, V. B. Mišković-Stanković, B. Nikolić, J. Serb. Chem.
Soc. 71 (2006) 1173 20. J. Shim, C.-R. Lee, H.-K. Lee, J.-S. Lee, E. J. Cairns, J. Power Sources 102 (2001) 172 21. C. L. Green, A. Kucernak, J. Phys. Chem. B 106 (2002) 1036.


J. Serb. Chem. Soc. 73 (12) 1211–1221 (2008) UDC 546.82–31:544.773.42:544.5/.6.004.2 JSCS–3800 Original scientific paper
doi: 10.2298/JSC0812211P 1211
Photoelectrochemical properties of sol–gel obtained titanium oxide
VLADIMIR V. PANIĆ1*#, SANJA I. STEVANOVIĆ1#, VESNA B. MIŠKOVIĆ-STANKOVIĆ2#, BRATISLAV Ž. JOVANOVIĆ2#
and BRANISLAV Ž. NIKOLIĆ2# 1Institute of Chemistry, Technology and Metallurgy, University of Belgrade, Njegoševa 12,
11001 Belgrade and 2Faculty of Technology and Metallurgy, University of Belgrade, Karnegijeva 4, 11120 Belgrade, Serbia
(Received 2 July, revised 12 October 2008)
Abstract: The photoelectrochemical properties of a sol–gel prepared titanium oxide coating applied onto a Ti substrate were investigated. The oxide coating was formed from an inorganic sol thermally treated in air at 350 °C. The coat-ing consisted of agglomerates of narrow size distribution around 100 nm. The photoelectrochemical characteristics were evaluated by investigating the changes in the open circuit potential, current transients and impedance characteristics of a Ti/TiO2 electrode upon illumination by UV light in H2SO4 solution and in the oxidation of benzyl alcohol. The electrode was found to be active for photo-electrochemical reactions in the investigated solutions.
Keywords: photoelectrochemical activity; titanium oxide; oxide sol; sol–gel procedure; electrochemical impedance spectroscopy.
INTRODUCTION
Owing to its good chemical stability, physico–chemical characteristics, elec-trical and optical properties, titanium oxide is a widespread material investigated in many fields of fundamental and applied science. The anatase crystalline form is known for its photocatalytic properties upon UV illumination, while the rutile form is most famous as a white pigment in dye technology.1 In organic reactions, TiO2 is widely used as a photocatalyst in an aqueous (waste water treatment)2 as well as in a non-aqueous environment (organic synthesis).3–5 Additionally, it can be used as a carrier for highly dispersed heteropolyacids,6 electrochemical com-posite catalysts7 and as a stabilizing component of electrochemically active oxide coatings on titanium.8–10 The application of titanium oxide thus envelopes dif-ferent branches, from the white pigment industry, through sunscreen lotions, so-
* Corresponding author. E-mail: [email protected] # Serbian Chemical Society member.

1212 PANIĆ et al.
lar cells and toothpastes, to electrochemistry, random access memory, outdoor air purification and waste water treatments.11
The photoreactivity of titanium oxide for oxidation reactions is usually ex-plained by the excitation of valence band (vb) electrons.1 When TiO2 is illumi-nated by light of energy greater than that required by the band gap, electrons are transferred to the conduction band (cb), and positive holes (h+) remain in the vb. The charge carriers very quickly migrate to surface traps lying within the forbid-den gap. From there, the holes are populated by electrons from, e.g., organics (R) adsorbed at the surface of the illuminated TiO2:12,13
TiO2 + hν TiO2| −cbe + TiO2| +
vbh (1)
TiO2| +vbh + R → TiO2 + R• (2)
In aqueous solutions, the generated holes can also react with adsorbed water molecules or OH– to produce •OH radicals, which are able to react with the or-ganics in parallel to reaction (2).12
Reversibility by the electron–hole recombination step (Eq. (1)) decreases the reactivity of illuminated TiO2. This disadvantage can be suppressed if some sink of excited electrons would be available in the system. For example, in oxygen-con-taining solutions, the excited electrons can reduce O2 and generate an avalanche of free radicals:13
−cbe + O2 → −
2O (3)
O2 + 2 −cbe + 2H+ → H2O2 (4)
−2O + H2O2 → HO– + •OH + O2 (5)
−2O + 2H+ → 2•OH (6)
H2O2 + −cbe → •OH + OH– (7)
H2O2 + hν → 2•OH (8) However, if titanium oxide would be assembled to conducting materials
within a closed electrical circuit, the reactivity can be improved by a bias po-tential, which will drive away exited electrons to the external circuit of the photo-electrochemical (PEC) cell.14–16
The PEC activity of TiO2 towards numerous organics, from methanol17 to herbicides,18 has been investigated intensively.1,13,16,19,20 It was found that PEC reactivity depends strongly on the conditions of formation of TiO2, such as pre-paration procedure,21,22 precursor type,18 annealing temperature,19,23 but also on the possible implantation of electrochemically active metals, such as Pt.24 Tita-nium oxides prepared by different procedures can show different PEC activity, although their crystalline structures are quite similar.22 Generally, a mixture of

PHOTOELECTROCHEMICAL PROPERTIES OF SOL–GEL TiO2 1213
anatase and rutile crystalline forms is more active than these forms alone,19,22 although in the case of commercial Degussa P25 TiO2, increasing the rutile con-tent (higher annealing temperature) can lead to a considerable decrease in, e.g., the total organic carbon removal efficiency in phenol oxidation.19
The aim of this work was to investigate the PEC activity of TiO2 prepared via the sol–gel route employing forced hydrolysis of titanium chloride.25 Tita-nium oxide prepared by this procedure already showed some advantages for chlorine and oxygen evolution and phenol oxidation26 on activated titanium ano-des.10,27 The PEC activity was investigated in H2SO4 solution and for the oxi-dation of benzyl alcohol, which is known for its simple oxidation kinetics.
EXPERIMENTAL The synthesis of the oxide sol
Titanium oxide sol was prepared by the forced hydrolysis of titanium chloride (15 % TiCl3 in 10 % HCl, Merck) in acid solution.25 An appropriate amount of titanium chloride was slowly added into boiling 5.0 mol dm-3 HCl and aged for 24 h under reflux in an experimental setup equipped with a magnetic stirrer. Vigorous agitation at the boiling temperature results in slow hydrolysis, which results in a solid oxide phase of narrow particle size distribution.27,28
The size of oxide particles increases with ageing time, while the TiO2 sols aged more than 20 h were found to be beneficial for good electrochemical properties of binary RuO2–TiO2 coatings of activated titanium anodes.10,27
The concentration of the solid phase in the prepared oxide colloidal monodispersion, evaluated by evaporation to dryness at 120 °C for 24 h, was 17 mg cm-3. Preparation of the photoelectrode
The photoelectrochemical properties of the prepared titanium oxide were examined using an electrode assembly consisting of a titanium substrate coated with the prepared oxide sol. A Ti plate, 1 cm×1 cm×0.7 cm in size, etched in 1:1 v/v hot 35 % HCl:H2O mixture, was used as the substrate. The coating was prepared by painting the oxide sol over the substrate, which was followed by slow evaporation at 70–90 °C. The painting and evaporation steps were re-peated until a coating mass of 3 mg per cm2 of the geometric surface area was attained. The electrode was then subjected to the thermal treatment at 350 °C for 2 h.
The coating was characterized by atomic force microscopy (AFM) technique in air at room temperature. The structural characterization was performed with a NanoScope 3D (Veeco, USA) microscope. The AFM observations were performed in tapping mode using etched silicon probes with a spring constant 20–80 N m-1. Photoelectrochemical (PEC) characterization
The PEC properties of the prepared Ti/TiO2 electrode and its photovoltaic activity in the oxidation of benzyl alcohol (BA), 0.010 mol dm-3, were investigated in 1.0 mol dm-3 H2SO4. Chronopotentiometric, chronoamperometric and electrochemical impedance spectroscopy (EIS) measurements were performed in a standard electrochemical cell equipped with a Pt wire as the counter electrode and a saturated calomel electrode (SCE) as the reference electrode. All experiments were performed at room temperature.
The photoelectrode working area of 0.79 cm2 faced the electrolyte/air interface at a dis-tance of 5 mm and was illuminated directly in the PEC experiments from above using a UV lamp (λ = 356 nm, 2×8 W, DESAGA UVIS, Germany) placed about 5 cm away from the electrode surface.

1214 PANIĆ et al.
RESULTS AND DISCUSSION
The typical appearance of the TiO2 coating surface is illustrated in Fig. 1 by AFM images taken at two different magnifications. The spherical grains of a uni-form size of around 100 nm are continuously distributed all over the coating sur-face. Earlier X-ray diffraction investigations of the solid phase of prepared sol25 indicated the oxide amorphous structure, while anatase crystalline structure was formed by thermal treatments up to 450 °C, with only a negligible presence of the rutile phase at higher temperatures. The crystallite size, according to the Scherrer Equation, was about 8 nm. The examination by transmission electron
Fig. 1. Typical AFM images of the Ti/TiO2 electrode surface.

PHOTOELECTROCHEMICAL PROPERTIES OF SOL–GEL TiO2 1215
microscopy showed the presence of the 5–25 nm particles, depending on the age-ing time.27 According to these earlier results, it can be emphasized that the grains seen by AFM (Fig. 1) must be agglomerates of small crystallites. The structural AFM investigations indicate that the ageing of the oxide sol under the applied conditions of sol synthesis rather results in the sticking of the formed nanopar-ticles into large agglomerates than in their primary growth, as is to be expected in the forced hydrolysis process.27,28
Photoelectrochemical properties The influence of UV light on the value of the open circuit potential (OCP) of
Ti/TiO2 electrode in H2SO4 solution is illustrated in Fig. 2. Illumination with UV light caused the OCP to take the negative values with respect to those registered under "UV off" condition. The OCP always shifted cathodically since the number of electrons occupying the conduction band was increased by those excited by photons. The photon–electron interaction process appears to be not completely reversible since the preceding "UV off" OCP value can be hardly recovered after illumination. This also holds for the "UV on" OCP value, which shifts anodically with every subsequent UV on/off period. Consequently, the difference between the "UV off" and "UV on" OCP value decreases with the number of UV on/off pe-riods, which indicates a decreasing ability of the photons to excite the electrons.
0 10 20 30 40
-120
-80
-40
0
UV off
UV on
∆E O
CP /
mV
t / min
Fig. 2. The time dependence of the open circuit potential of Ti/TiO2 elec-trode in presence and the absence of UV light. Electrolyte: 1.0 mol dm-3 H2SO4.
The Nyquist and Bode plots of EIS data registered at the "UV off" and "UV on" OCP of the Ti/TiO2 electrode in H2SO4 solution are shown in Fig. 3. In the absence and the presence of UV light, loops ascribable to capacitor and resistor in parallel were registered (Fig. 3a). However, the impedance under UV illumi-nation was considerably lower, as the consequence of increased conductivity due to the presence of photon-exited electrons in the conduction band.

1216 PANIĆ et al.
0 2 4 6 8 10 120
2
4
6
8
OCP, UV off OCP, UV on 150 mVSCE, UV on
-Zi /
104 Ω
Zr / 104 Ω -2 -1 0 1 2 3 4 5
0
20
40
60
1
2
3
4
5
-φ /
olog (f / Hz)
-φ vs. log f
log |Z| vs. log f log
(|Z| /
Ω)
(a) (b) Fig. 3. Nyquist (a) and Bode plots (b) of EIS data of Ti/TiO2 electrode registered at the "UV
off" and "UV on" OCP and at 150 mVSCE (UV on) in 1.0 mol dm-3 H2SO4.
Although the impedance data generally form a loop in the complex plane plot (Fig. 3a), its fine structure, which depends on whether the UV light was on or off, is clearly resolved in the Bode phase angle plot (Fig. 3b). In the absence of UV light, two well-resolved phase angle maxima are registered at 1 kHz and 200 mHz, both related to the equivalence of a capacitor and resistor in parallel, which indicates that the loop in Fig. 3a is actually comprised of overlapping loops. On the other hand, in the presence of UV light, these maxima were suppressed, while a new, more intense, maximum appeared at around 3 Hz.
In order to resolve which part of the registered impedance characteristics are intrinsic to the presence of UV light, EIS data were registered at a potential of 150 mVSCE, which is close to "UV off" OCP value, but in the presence of the UV light. These data are also shown in Fig. 3. As can be seen in Fig. 3b, the EIS characteristics at 150 mVSCE are insensitive to UV down to a frequency of 100 Hz. A new maximum is seen at 3 Hz as in the case of the EIS data at the "UV on" OCP value, while the phase angle peak at 200 mHz is less suppressed. This com-parison indicates that the phase angle peak at 3 Hz was completely UV light-in-duced. On the other hand, the peaks at 1 kHz and 200 mHz, being dependent on electrode potential, are electrochemical in nature.
The photovoltaic contribution to the current transients of the Ti/TiO2 elec-trode in H2SO4 solution can be seen in Fig. 4. The photoelectrochemical activity was controlled at potentials close to the "UV on" (55 mVSCE) and "UV off" OCP (150mVSCE). The illumination by UV light caused an increase in the currents due to a positive photocurrent contribution. The photocurrent was stable during several UV on/off periods and depended neither on the bias potential nor on the sign of the UV light-absent current. Since oxidation of water is the only possible anodic process in the given electrolyte, the relatively small photocurrents visible

PHOTOELECTROCHEMICAL PROPERTIES OF SOL–GEL TiO2 1217
in Fig. 4 can be ascribed to photocatalytic oxygen evolution. The absolute photo-voltaic effect is rather small, which can be the consequence of the stringent ki-netic demands for the oxygen evolution reaction.
0.0 2.0 4.0 6.0-0.50
0.00
0.50
1.00
1.50
UV off
UV on
150 mVSCE55 mVSCE
I / µ
A
t / min
Fig. 4. The current transients of the Ti/TiO2 electrode at the poten-tials of 55 and 150 mVSCE in the presence and the absence of UV light. Electrolyte: 1.0 mol dm-3 H2SO4.
Photoelectrochemical activity for benzyl alcohol oxidation The change of the OCP of the Ti/TiO2 electrode, induced by UV light in the
presence of BA in the electrolyte, is shown in Fig. 5. The OCP values shifted cathodically, as in the case of the BA-free electrolyte (Fig. 2), but in the presence of BA the shift was considerably more pronounced. The OCP can become even
0 20 40 60
-250
-200
-150
-100
-50
0
1.0 M H2SO4 + 0.010 M BA
1.0 M H2SO4UV off
UV on
UV off
UV on
∆EO
CP /
mV
t / min
Fig. 5. The time dependence of the open circuit potential of the Ti/TiO2 electrode in presence and the absen-ce of UV light. Electrolyte: 1.0 mol dm-3 H2SO4 + 0.010 mol dm-3 BA.

1218 PANIĆ et al.
250 mV more negative with respect to the "UV off" value. It should be stressed that the "UV off" OCP value did not change upon addition of BA.
Although the "UV off" OCP value can be hardly recovered after the very first UV light switch, as in the case of the BA-free electrolyte, the "UV on" value in the BA-containing electrolyte appeared to be stable and independent of the number of UV on/off periods.
The photoelectrochemical activity of the Ti/TiO2 electrode considerably in-creased in the presence of BA; the photocurrent was double that of the BA-free electrolyte, as is shown in Fig. 6 by current transient at a potential close to the "UV off" OCP value.
0.0 2.0 4.0 6.0
0.0
0.5
1.0
1.5
2.0
UV off
UV on
I / µ
A
t / min
Fig. 6. Current transients of the Ti/TiO2 electrode in the presence and the absence of UV light. Elec-trolyte: 1.0 mol dm-3 H2SO4 + + 0.010 mol dm-3 BA.
The considerably larger cathodic shift of the OCP (Fig. 5) and the increased photocurrent (Fig. 6) in the presence of BA indicate that BA is more easily oxi-dized at TiO2 than water molecules (BA-free electrolyte) because the holes in the TiO2 generated by the excitation of electrons are easily populated by electrons from the BA molecules. BA oxidation to benzenecarbaldehyde proceeds through the benzyl radical as an intermediate and a tentative mechanism of PEC oxidation could be as follows:
(9)

PHOTOELECTROCHEMICAL PROPERTIES OF SOL–GEL TiO2 1219
(10)
(11)
The protons released from the benzyl radical-cation (Eqs. (10) and (11)) are easily adopted by −
2O (Eq. (6)) generated in the reaction between the exited elec-trons and oxygen (Eq. (3)).
The Nyquist and Bode plots for the Ti/TiO2 electrode registered at the OCP in the BA-containing electrolyte, in the presence and the absence of UV light, are shown in Fig. 7.
As in the BA-free electrolyte (Fig. 3a), loops were registered in the presence and the absence of UV light, although the impedance is considerably lower than in the BA-free electrolyte (Fig. 7a). The influence of UV light is not so pronoun-ced; only a decrease in the imaginary value can be seen in the low-frequency do-main. Two phase angle maxima are registered (Fig. 7b) with no appearance of a UV light-induced third one, as was registered in the BA-free electrolyte (Fig. 3b). However, the low-frequency phase angle peak is considerably more pronounced in the presence of BA.
0 2 4 60
2
4
6
8
OCP, UV off OCP, UV on
-Zi /
kΩ
Zr / kΩ-2 -1 0 1 2 3 4 5
0
20
40
60
1
2
3
4
-φ /
o
log (f / Hz)
-φ vs. log f
log |Z| vs. log f log
(|Z| /
Ω)
(a) (b)
Fig. 7. Nyquist (a) and Bode plots (b) of the EIS data for the Ti/TiO2 electrode registered at the "UV off" and "UV on" OCP in 1.0 mol dm-3 H2SO4 + 0.010 mol dm-3 BA.

1220 PANIĆ et al.
CONCLUSIONS
A titanium oxide coating on a titanium substrate, prepared by the inorganic sol–gel procedure, showed photoelectrochemical activity in H2SO4 solution and for the oxidation of benzyl alcohol.
Microscopic investigations of the coating showed the presence of agglome-rates of narrow size distribution, around 100 nm. The agglomerates are consisted of 8 nm-sized crystallites.
Illumination with UV light influenced the open circuit potential, current tran-sient and impedance characteristics of the prepared Ti/TiO2 photoelectrode, in a H2SO4 solution and in a H2SO4 + benzyl alcohol solution. The cathodic shift of the open circuit potential was more pronounced in the presence of benzyl alcohol than in its absence, while the photocurrent was doubled due to the oxidation of benzyl alcohol. Due to UV illumination, a new phase angle peak appeared in the Bode plot of the EIS data of the photoelectrode in H2SO4 solution. However, this peak was not registered in the H2SO4 + benzyl alcohol solution.
Acknowledgements. This work was financially supported by the Ministry of Science and Technological Development of the Republic of Serbia, contract No. 142061. Useful discussion with Dr Lynne Katsikas of the Faculty of Technology and Metallurgy, Belgrade, is also ac-knowledged.
И З В О Д
ФОТОЕЛЕКТРОХЕМИЈСКА СВОЈСТВА ТИТАН-ОКСИДА ДОБИЈЕНОГ СОЛ–ГЕЛ ПОСТУПКОМ
ВЛАДИМИР В. ПАНИЋ1, САЊА М. СТЕВАНОВИЋ1, ВЕСНА Б. МИШКОВИЋ-СТАНКОВИЋ2, БРАТИСЛАВ Ж. ЈОВАНОВИЋ2 и БРАНИСЛАВ Ж. НИКОЛИЋ2
1Institut za hemiju, tehnologiju i metalurgiju, Univerzitet u Beogradu, Wegoeva 12, 11001 Beograd i 2Tehnoloko–metalurki fakultet, Уniverzitet u Beogradu, Karnegijeva 4, 11120 Beograd
Фотоелектрохемијска својства титан-оксида добијеног сол–гел портупком испитивана су на оксидној превлаци нанетој на титанску подлогу. Превлака је термички третирана у ваздуху на температури од 350 °С. Превлака се састоји од зрна уједначене расподеле по величини од око 100 nm. Фотоелектрохемијске карактеристике установљене су испитивањем промена по-тенцијала отвореног кола, временске зависности струје и импедансних карактеристика Ti/TiO2 електроде при осветљености UV светлошћу у раствору H2SO4 и при оксидацији бензил-ал-кохола. Установљена је фотоактивност електроде у испитиваним системима.
(Примљено 2. јула, ревидирано 12. октобра 2008)
REFERENCES 1. G. Li Puma, A. Bono, D. Krishnaiah, J. G. Collin, J. Hazardous Mater. 157 (2008) 209 2. B. F. Abramović, V. B. Anderluh, D. V. Sojić, F. F. Gaál, J. Serb. Chem. Soc. 72 (2007) 1477 3. C. E. Taylor, Catal. Today 84 (2003) 9 4. K. I. Shimizu, H. Akahane, T. Kodama, Y. Kitayama, Appl. Catal. A269 (2004) 75 5. D. Ž. Mijin, D. Z. Zlatić, G. S. Ušćumlić, P. M. Jovančić, Hem. Ind. 62 (2008) 275 (in
Serbian)

PHOTOELECTROCHEMICAL PROPERTIES OF SOL–GEL TiO2 1221
6. A. Popa, V. Sasca, M. Stefanescu, E. E. Kiš, R. Marinković-Neducin, J. Serb. Chem. Soc. 71 (2006) 235
7. S. V. Mentus, I. Bošković, J. M. Pješčić, V. Grudić, Z. Bogdanov, J. Serb. Chem. Soc. 72 (2007) 1403
8. S. Trasatti, Electrochim. Acta 36 (1991) 225 9. V. V. Panić, B. Ž. Nikolić, J. Serb. Chem. Soc. 72 (2007) 1393
10. V. Panić, A. Dekanski, S. Milonjić, R. Atanasoski, B. Nikolić, Electrochim. Acta 46 (2000) 415
11. D. Ollis, E. Pellizzetti, N. Serpone, Environ. Sci. Technol. 25 (1991) 1522 12. W. H. Wang, Z. Zhang, J. Q. Zhang, C. N. Cao, J. Phys. Chem. B 109 (2005) 15008 13. H. Selcuk, J. J. Sene, M. A. Anderson, J. Chem. Technol. Biotechnol. 78 (2003) 979 14. H. Hidaka, Y. Asai, J. Zhao, K. Nohara, E. Pelizzetti, N. Serpone, J. Phys. Chem. 99
(1995) 8244 15. M. E. Calvo, R. J. Candal, S. A. Bilmes, Environ. Sci. Technol. 35 (2001) 4132 16. W. H. Leng, Z. Zhang, J. Q. Zhang, J. Mol. Catal. A 206 (2003) 239 17. M. C. Li, J. N. Shen, J. Solid State Electrochem. 10 (2006) 980 18. T. Docters, J. M. Chovelon, J. M. Herrmann, J. P. Deloume, Appl. Catal. B. 50 (2004) 219 19. J. F. Porter, Y.-G. Li, C. K. Chan, J. Mater. Sci. 34 (1999) 1523 20. W. H. Leng, Z. Zhang, S. A. Cheng, J. Q. Zhang, C. N. Cao, Chin. Chem. Lett. 12 (2001) 1019 21. J. Marsh, D. Gorse, Electrochim. Acta 43 (1998) 659 22. G. Li, L. Chen, M. E. Graham, K. A. Gray, J. Mol. Catal. A 275 (2007) 30 23. M. Rashidzadeh, Int. J. Photoenergy, 2008, Article ID 245981 24. C. He, Y. Xiong, D. Shu, X. Zhu, X. Li, Thin Solid Films 503 (2006) 1 25. V. Panić, A. Dekanski, S. Milonjić, R. Atanasoski, B. Nikolić, Colloids Surfaces: A 157
(1999) 269V. V. Panić, A. B. Dekanski, T. R. Vidaković, V. B. Mišković-Stanković, B. Jovanović, B. Ž. Nikolić, J. Solid State Electrochem. 9 (2005) 43
27. V. Panić, A. Dekanski, G. Wang, M. Fedoroff, S. Milonjić, B. Nikolić, J. Colloid Inter-face Sci. 263 (2003) 68
28. E. Matijević, M. Budnik, L. Meites, J. Colloid Interface Sci. 61 (1977) 302.


J. Serb. Chem. Soc. 73 (12) 1223–1233 (2008) UDC 547.675+546.11.027:543.544.3: JSCS–3801 :543.51:612.461 Original scientific paper
doi: 10.2298/JSC0812223X 1223
Determination of dimethoxyphenethylamine derivatives in urine by deuterium labeled internal standards
YA-ZHU XU1, HUEI-RU LIN2, AHAI-CHANG LUA2,3 and CHINPIAO CHEN1* 1Department of Chemistry, National Dong Hwa University, Hualien 974, 2Institute of Medical
Sciences, Tzu Chi University, Hualien 970 and 3Department of Laboratory Medicine and Biotechnology, Tzu Chi University, Hualien 970, Taiwan, R. O. C.
(Received 4 February, revised 21 June 2008)
Abstract: The use of gas chromatography–mass spectrometry (GC–MS) in fo-rensic analysis is increasing. To exploit fully the capabilities of MS, labeled standards, that can be used to improve the performance of the quantitative ana-lysis, and to increase accuracy and precision, are required. A series of deute-rated internal standards, corresponding to the 2C-series of phenethylamine derivatives, including 4-bromo-2,5-dimethoxyphenethylamine-d6 (2C-B), 4-chlo-ro-2,5-dimethoxyphenethylamine-d6 (2C-C), 4-iodo-2,5-dimethoxy-phenethyl-amine-d6 (2C-I), 4-ethylthio-2,5-dimethoxy-phenethylamine-d6 (2C-T-2) and 2,5-dimethoxy-4-n-propylthiophenethylamine-d6 (2C-T-7), were synthesized. These deuterated compounds were used to analyze for the corresponding un-labeled compounds in urine. The analysis was performed using GC–MS, with the selected ion monitoring (SIM) technique, whereby good results were achieved.
Keywords: phenethylamine; designer drugs; 2C-C; 2C-B; 2C-I; 2C-T-2; 2C-T-7.
INTRODUCTION The increased availability of the 2C-series of phenethylamine derivatives on
the illicit market has become a serious social problem.1 Shulgin et al., in their publication, Phenethylamines I have Known and Loved (PiHKAL), documented 179 phenethylamine derivatives, including 3,4-methylenedioxymethamphetamine (MDMA), mescaline, 2C-B, 2C-C, 2C-I, 2C-T-2 and 2C-T-7. They also descryb-ed relevant synthetic procedures.2 Phenethylamine derivatives are increasingly abused psychoactive drugs, the abuse of which is well documented.3–8 The series of homologous designer drugs continues to be explored and their widespread consumption has led to increasing number of reports of abuse and intoxication. The abuse of psychoactive drugs from the phenylethylamine and phenylisopro-pylamine groups has become a very serious social problem in Taiwan over the last decade.9–22
* Corresponding author. E-mail: [email protected]

1224 XU et al.
Unknown drugs are typically detected and identified by gas chromatogra-phy–mass spectrometry (GC–MS) because this approach is highly sensitive and can separate organic compounds in complex mixtures.23–26 The compounds are often derivatized on the amine to yield more specific fragmentation information. This process seriously influences the ability to detect novel amphetamine con-trolled substance analogs.27,28 Many studies have addressed the preparation of deuterium-labeled control drugs as internal standards for GC–MS analysis.29–39 The synthetic routes to 2C-C-d6, 2C-B-d6, 2C-I-d6, 2C-T-2-d6 and 2C-T-7-d6 have been described elsewhere.31 The present investigation explores the appli-cations of 2C-C-d6, 2C-B-d6, 2C-I-d6, 2C-T-2-d6 and 2C-T-7-d6 as internal standards.
EXPERIMENTAL Reagents
Methanol and ethyl acetate (EA) were purchased from Mallinckrodt (Paris, KY, USA). Trifluoroacetic anhydride was purchased from Fluka (Buchs, Switzerland). Stock solutions of the analytes (100 µg mL-1) were prepared in methanol. Subsequent working solutions of cali-bration samples were prepared by diluting the stock solutions with blank urine. An internal stan-dard (IS) solution of 2C-C-d6, 2C-B-d6, 2C-I-d6, 2C-T-2-d6 and 2C-T-7-d6, each at 20 µg mL-1, was prepared in methanol. The preparation of 2C-B-d6, 2C-C-d6, 2C-I-d6, 2C-T-2-d6 and 2C- -T-7-d6 has been described elsewhere.31 The structures of 2C-B-d6, 2C-C-d6, 2C-I-d6, 2C-T- -2-d6 and 2C-T-7-d6.are presented in Fig. 1.
Fig. 1. The structures of 2C-B-d6, 2C-C-d6, 2C-I-d6, 2C-T-2-d6 and 2C-T-7-d6.
Procedure Blank urine samples, which had been collected from volunteer laboratory personnel,
were used for the development of the method. Blank urine samples were spiked with appro-priate amounts of analytes at concentrations of 0, 50, 100, 500, 1000 and 2000 ng mL-1 to prepare calibration curves. Samples were maintained in the refrigerator at 4 °C until analysis. Instrumentation
A Hewlett Packard 6890 gas chromatograph was coupled to a Hewlett Packard 5973 qua-drupole mass spectrometer under EI conditions. Injection was performed in the splitless mode. The flow rate of the carrier gas (He) was 0.60 mL min-1. An HP-5MS column (12.5 m×0.20 mm ID, 0.33 µm film thickness; Agilent Technologies, Palo Alto, CA, USA) was used. The in-jection port temperature was maintained at 250 °C. The GC oven temperature program started at 70 °C, which was maintained for 0.5 min, and then increased at 30 °C min-1 to 255 °C,

DIMETHOXYPHENETHYLAMINE DERIVATIVES IN URINE 1225
which was maintained for 0.5 min. One µL was injected for GC–MS analysis in the full scan mo-nitoring mode. The total analysis time was 12 min per sample with a solvent delay of 3.0 min. The transfer line temperature and MS source temperature were 280 and 230 °C, respectively. The electron energy of the MS was set to 70 eV. Full scan mass spectra of analytes and their deuterium analogs were collected in the m/z range 50–450 at a scan rate of 3.62 scan/s. The data were collected using Hewlett-Packard ChemStation software. Sample preparation
To a clean 12–mL screw-cap glass tube was added 2.0 mL of urine sample and 50 µL of IS solution. The mixture was alkalinized with 2.0 mL of 1.0 M NaOH, and extracted with 3.0 mL of EA after vortexing and subsequent centrifugation at 3000 rpm for 5 min. The organic layer was carefully transferred to a clean tube. The mixture was evaporated to dryness under a stream of nitrogen gas at 50–60 °C. The dried extract was dissolved in 50 µL of EA and derivatized with 50 µL of trifluoroacetic anhydride for 30 min at 60 °C. The samples were then cooled to room temperature, evaporated to dryness, and reconstituted with 50 µL of EA. One µL was injected for GC–MS analysis.
RESULTS AND DISCUSSION The total ion current chromatogram (monitored in the full scan mode) of five
phenethylamine designer drugs and four structurally related sympathomimetic ami-nes [amphetamine (A, AMP), methamphetamine (MA), 3,4-methylenedioxyam-phetamine (MDA), and MDMA] are presented in Fig. 2. All compounds were chromatographically well separated. The retention times of the drugs and their deuterated analogues are given in Table I. Although the retention times according to the GCs of five sets of labeled and unlabeled compounds vary very little (0.01 min), the selected ion monitoring (SIM) technique discriminates the labeled and unlabeled compounds. Therefore, these deuterium-labeled compounds have the potential to be used as internal standards in GC–MS analysis. The [M]+ of the labeled and unlabeled compounds did not overlap each other and no interference from the urine samples was observed. Accordingly, the 14 [M]+ were monitored using GC–MS with a SIM. The SIM chromatogram was obtained from 2.0 mL of urine sample with 1.0 µg of A, MA, MDA, MDMA and IS. Although A, MA, MDA and MDMA were not the standard samples in this study, generally these compounds were analogous to the IS samples, and could be distinguished in the GC–MS chromatogram.
The electron impact mass spectra of 2C-B-TFA, 2C-B-d6-TFA, 2C-C-TFA, 2C-C-d6-TFA, 2C-I-TFA, 2C-I-d6-TFA, 2C-T-2-TFA, 2C-T-2-d6-TFA, 2C-T-7- -TFA and 2C-T-7-d6 are presented in Figs. 3–7. Very high [M]+ peaks were observed for 2C-B-TFA, 2C-C-TFA, 2C-I-TFA, 2C-T-2-TFA and 2C-T-7-TFA at m/z 355, 311, 403, 337 and 351, respectively. For 2C-B-d6-TFA, 2C-C-d6-TFA, 2C-I-d6-TFA, 2C-T-2-d6-TFA and 2C-T-7-d6-TFA, very strong [M]+ peaks ap-peared at m/z 361, 317, 409, 343 and 357, respectively.

1226 XU et al.
Fig. 2. Total ion chromatography (time in min). The concentrations of
the analytes were 0.50 µg mL-1. TABLE I. Retention times and ions monitored for GC/MS analysis Compound Retention time, min Ions monitoreda (relative intensity, %) 2C-C-d6 5.98 204, 191 (69.4), 317 (67.8) 2C-C 5.99 198, 185 (78.7), 311 (74.2) 2C-B-d6 6.26 248, 361 (76.3), 235 (61.2) 2C-B 6.27 242, 355 (75.6), 229 (77.7) 2C-I-d6 6.61 409, 296 (80.9), 283 (50.8) 2C-I 6.62 403, 290 (85.6), 277 (53.1) 2C-T-2-d6 6.66 217, 343 (82.6), 230 (26.5) 2C-T-2 6.67 211, 337 (74.1), 224 (23.8) 2C-T-7-d6 6.93 231, 357 (78.1), 244 (23.5) 2C-T-7 6.94 225, 351 (89.6), 238 (23.9) AMP 3.64 140, 118 (91.9), 91 (40.6) MA 4.14 154, 118 (29.9), 110 (22.7) MDA 5.05 162, 275 (49.0), 135 (234.4) MDMA 5.51 154, 162 (78.4), 135 (56.1) aQuantification ions underlined
The EI mass spectrum of 2C-B-d6-TFA (Fig. 3) has a base peak ion at m/z 248. This odd electron ion was formed by a McLafferty rearrangement to elimi-nate trifluoroacetamide (Scheme 1). The ion m/z 235 was also generated by eli-minating an N-ethylidene-2,2,2-trifluoroacetamide from the molecular ion m/z 361. The ion m/z 203 was formed from the ion m/z 235 by the well-known specific six-center H-rearrangement of a γ-D-atom of the methoxy-d3 (OCD3) side chain to the benzylic part, eliminating neutral formaldehyde-d2 (CD2O). This rearran-gement was proven by comparing the mass spectrum of 2C-B-TFA and 2C-B-d6--TFA (Fig. 3), i.e., the ion m/z 199 corresponds to ion m/z 203 in 2C-B-d6-TFA and the ion m/z 203 has four deuterium atoms. 2C-B-d6-TFA contains a bromine and thus the ions m/z 361, 248, 235 and 203 always have corresponding isotopic ions m/z 363, 251, 237 and 205. The ion m/z 151 was generated by eliminating a

DIMETHOXYPHENETHYLAMINE DERIVATIVES IN URINE 1227
bromomethane (BrCD3) from the molecular ion m/z 248. Compounds 2C-B, 2C-C, 2C-I, 2C-C-d6 and 2C-I-d6 have the same fragmentation pathway, and their cor-responding mass spectra are shown in Fig. 3–5.
a)
b)
Fig. 3. The mass spectra of TFA derivatives of 2C-B (a) and 2C-B-d6 (b).
Scheme 1. Spectral interpretation of N-[2-(4-bromo-2,5-dimethoxyphenyl)ethyl]-
-2,2,2-trifluoroacetamide-d6 (2C-B-d6-TFA).

1228 XU et al.
a)
b)
Fig. 4. The mass spectra of TFA derivatives of 2C-C (a) and 2C-C-d6 (b).
a)
b)
Fig. 5. The mass spectra of TFA derivatives of 2C-I (a) and 2C-I-d6 (b).

DIMETHOXYPHENETHYLAMINE DERIVATIVES IN URINE 1229
The EI mass spectrum of 2C-T-2-d6-TFA (Fig. 6) has a base peak ion at m/z 217. The ion m/z 217 was generated by eliminating N-ethylidene-2,2,2-trifluoro-acetamide from the molecular ion m/z 343. This odd electron ion m/z 230 was formed by a McLafferty rearrangement to eliminate a trifluoroacetamide (Scheme 2). The ion m/z 185 was formed from the ion m/z 217 by the well-known specific six-center H-rearrangement of a γ-D-atom of the methoxy-d3 (OCD3) side chain to the benzylic part, eliminating neutral formaldehyde-d2 (CD2O). This rearran-gement was proven by comparing the mass spectrum of 2C-T-2-TFA and 2C-T- -2-d6-TFA (Fig. 6), i.e., the ion m/z 181 corresponds to ion m/z 185 in 2C-T-2-d6--TFA, and ion m/z 185 has four deuterium atoms. The ion m/z 157 was generated by eliminating an ethylene (CH2=CH2) from the molecular ion m/z 185. Com-pounds 2C-T-2, 2C-T-7 and 2C-T-7-d6 have the same fragmentation pathway and their corresponding mass spectra are shown in Figs. 6 and 7.
a)
b)
Fig. 6. The mass spectra of TFA derivatives of 2C-T-2 (a) and 2C-T-2-d6 (b).
The extraction and derivatization were performed using ethyl acetate as sol-vent. Due to the need to heat for derivatization, a solvent with boiling point above 60 °C was selected. The boiling point of ethyl acetate is 77 °C. The deriva-tization time (30 min) and temperature (60 °C) were selected, because these deri-vatization conditions are well established.16
The linearity of the quantification method was determined using calibration standards at 0, 50, 100, 500, 1000, 2000 ng of analyte. The selected ion moni-toring (SIM) mode was employed throughout the study. Linear regression of the

1230 XU et al.
Scheme 2. Spectral interprettation of N-[2-(4-ethylsulfanyl-2,5-dimethoxyphenyl)
ethyl]-2,2,2-trifluoroacetamide-d6 (2C-2-T-d6-TFA).
a)
b)
Fig. 7. The mass spectra of TFA derivatives of 2C-T-7 (a) and 2C-T-7-d6 (b).

DIMETHOXYPHENETHYLAMINE DERIVATIVES IN URINE 1231
calibration curves gave r2 values between 0.9946 and 0.9999, with most values > 0.9990. The limit of detection (LOD) was defined as the signal noise ratio, equal to 3. The LOD values of the target compounds are given in Table II, from which it can be seen that the calibration curves for the studied compounds gave excellent straight lines over the range of 0–2000 ng mL–1. Thus, excellent ac-curacy and precision could be obtained by this method. Table II. Linear regression of the calibration curves
Compound Coefficient of correlation (r2) Regression line LOD (S/N = 3)
ng mL-1 2C-C 0.9998 y = 0.0026x – 0.0084 5.1 2C-B 0.9946 y = 0.0023x + 0.0259 8.0 2C-I 0.9999 y = 0.0015x – 0.0061 6.7 2C-T-2 0.9991 y = 0.0018x – 0.0128 1.6 2C-T-7 0.9999 y = 0.0015x – 0.0061 2.9
CONCLUSIONS
This study demonstrates the applications of 2C-B-d6, 2C-C-d6, 2C-I-d6, 2C-T-2-d6 and 2C-T-7-d6 as internal standards in GC–MS. Although the GC re-tention times of the five sets of labeled and unlabeled compounds vary very little (0.01 min), quantification by MS with the selected ion monitoring (SIM) tech-nique enhances the performance of the quantitative analysis. Therefore, five de-uterium-labeled compounds possess the potential to be used as the internal standard for GC–MS analysis.
Acknowledgment. The authors thank Ms. Hsu, L. M., at the Instruments Center, National Chung Hsing University and Ms. Lin, S. C., at the Instrument Center, National Tsing Hwa University for their help in obtaining the HRMS spectra, and the National Bureau of Control-led Drugs, Department of Health, Taiwan, Republic of China, for financially supporting this research under contract DOH94-NNB-1007.
И З В О Д
ОДРЕЂИВАЊЕ ДЕРИВАТА ДИМЕТОКСИФЕНЕТИЛАМИНА У УРИНУ ПРИМЕНОМ ДЕУТЕРИСАНИХ ИНТЕРНИХ СТАНДАРДА
YA-ZHU XU1, HUEI-RU LIN2, AHAI-CHANG LUA2,3 и CHINPIAO CHEN1
1Department of Chemistry, National Dong Hwa University, Hualien 974, 2Institute of Medical Sciences, Tzu Chi University, Hualien 970 и 3Department of Laboratory Medicine and Biotechnology, Tzu Chi University, Hualien 970, Taiwan, R. O. C.
У форензичкој анализи примена гасне хроматографије са масеном спектрометријом (GC–MS) је све већа. Употреба обележених стандарда може побољшати перформансе кван-титативне хемијске анализе, повећањем тачности и прецизности одређивања методом GC–MS. Синтетисана је серија деутерисаних интерних стандарда, која одговара 2С серији деривата фенетиламина, укључујући 4-бром-2,5-диметоксифенетиламин-d6 (2C-B), 4-хлор-2,5-димето-ксифенетиламин-d6 (2C-C), 4-јод-2,5-диметокси-фенетиламин-d6 (2C-I), 4-етилтио-2,5-димет-окси-фенетиламин-d6 (2C-T-2) и 2,5-диметокси-4-n-пропилтиофенетиламин-d6 (2C-T-7). Деу-терисана једињења су коришћена у анализи одговарајућих необележених једињења у узор-

1232 XU et al.
цима урина. Анализа је изведена применом GC–MS у SIM (техника мониторинга одабраних јона) моду, при чему су добијани аналитички поуздани резултати.
(Примљено 4. фебруара, ревидирано 21. јуна 2008)
REFERENCES 1. D. de Boer, I. Bosman, Pharm. World Sci. 26 (2004) 110 2. Erowid, http://www.erowid.org/library/books_online/pihkal/pihkal.shtml#index (November,
2008) 3. C. Giroud, M. Augsburger, L. Rivier, P. Mangin, F. Sadeghipour, E. Varesio, J. L.
Veuthey, P. Kamalaprija, J. Anal. Toxicol. 22 (1998) 345 4. C. Furnari, V. Ottaviano, F. Rosati, Ann. Ist. Super. Sanita 37 (2001) 297 5. C. Lora-Tamayo, T. Tena, A. Rodriguez, D. Moreno, J. R. Sancho, P. Ensenat, F. Muela,
Forensic Sci. Int. 140 (2004) 195 6. F. Schifano, A. Oyefeso, J. Corkery, K. Cobain, R. Jambert-Gray, G. Martinotti, A. H.
Ghodse, Hum. Psychopharmacol. 18 (2003) 519 7. D. G. Caldicott, N. A. Edwards, A. Kruys, K. P. Kirkbride, D. N. Sims, R. W. Byard, M.
Prior, J. Toxicol. Clin. Toxicol. 41 (2003) 143 8. K. W. Simonsen, E. Kaa, E. Nielsen, D. Rollmann, Forensic Sci. Int. 131 (2003) 162 9. J. S. Chen, K. J. Chang, R. C. Charng, S. J. Lai, S. R. Binder, H. Essien, J. Toxicol. Clin.
Toxicol. 33 (1995) 581 10. C. C. Yang, J. F. Wu, H. C. Ong, S. C. Hung, Y. P. Kuo, C. H. Sa, S. S. Chen, J. F. Deng,
J. Toxicol. Clin. Toxicol. 34 (1996) 651 11. K. P. Shaw, J. Forensic Sci. 44 (1999) 27 12. P. Chou, M. Y. Liou, M. Y. Lai, M. L. Hsiao, H. J. Chang, Formos Med. Assoc. 98 (1999) 827 13. C. C. Yang, J. F. Wu, H. C. Ong, Y. P. Kuo, J. F. Deng, J. Ger, Indian J. Pediatr. 64
(1997) 469 14. C. F. Yen, M. Y. Chong, Y. H. Liu, Subst. Use Misuse 38 (2003) 141 15. S. K. Lin, C. H. Lee, C. H. Pan, W. H. Hu, Psychiatry Clin. Neurosci. 57 (2003) 425 16. A. C. Lua, H. R. Lin, Y. T. Tseng, A. R. Hu, P. C. Yeh, Forensic Sci. Int. 136 (2003) 47 17. C. K. Chen, S. K. Lin, P. C. Sham, D. Ball, E. W. Loh, C. C. Hsiao, Y. L. Chiang, S. C.
Ree, C. H. Lee, R. M. Murray, Psychol. Med. 33 (2003) 1407 18. S. K. Lin, D. Ball, C. C. Hsiao, Y. L. Chiang, S. C. Ree, C. K. Chen, Psychiatry Clin.
Neurosci. 58 (2004) 206 19. H. C. Liu, S. K. Lin, S. K. Liu, S. L. Chen, C. J. Hu, J. G. Chang, S. J. Leu, Psychiatr.
Genet. 14 (2004) 33 20. C. F. Yen, C. H. Ko, J. Y. Yen, S. J. Liu, Public Health 119 (2005) 50 21. C. F. Yen, Y. P. Chang, Psychiatry Clin. Neurosci. 59 (2005) 77 22. C. F. Yen, B. L. Shieh, J. Nerv. Ment. Dis. 193 (2005) 444 23. C. R. Clark, J. DeRuiter, A. Valaer, F. T. Noggle, J. Chromatogr. Sci. 33 (1995) 328 24. F. T. Noggle, C. R. Clark, K. H. Bondir, J. DeRuiter, J. Chromatogr. Sci. 29 (1991) 103 25. T. A. Dal Cason, Forensic Sci. Int. 35 (1990) 675 26. W. H. Soine, R. E. Shark, D. T. Agee, J. Forensic Sci. 28 (1983) 386 27. P. Roеsner, T. Junge, Microgram 27 (1994) 411 28. S. Borth, W. Haеnsel, P. Roеsner, T. Junge, Forensic Sci. Int. 114 (2000) 139 29. Y. Z. Xu, C. Chen, J. Chin. Chem. Soc. 54 (2007) 493 30. Y. Z. Xu, C. Chen, J. Labelled Comp. Radiopharm. 49 (2006) 897 31. Y. Z. Xu, C. Chen, J. Labelled Comp. Radiopharm. 49 (2006) 1187

DIMETHOXYPHENETHYLAMINE DERIVATIVES IN URINE 1233
32. A. C. Shaikh, Y. Y. Wang, C. Chen, J. Labelled Comp. Radiopharm. 50 (2007) 660 33. F. Balssa, Y. Bonnaire, J. Labelled Comp. Radiopharm. 50 (2007) 207 34. J. Y. Sancéau, D. Larouche, B. Caron, P. Bélanger, A. Coquet, A. Bélanger, F. Labrie, S.
Gauthier, J. Labelled Comp. Radiopharm. 50 (2007) 197 35. J. Hooper, P. Watts, J. Labelled Comp. Radiopharm. 50 (2007) 189 36. J. B. Springer, O. M. Colvin, S. M. Ludeman, J. Labelled Comp. Radiopharm. 50 (2007) 115 37. M. A. Ismail, W. David, D. W. Boyki, J. Labelled Comp. Radiopharm. 49 (2006) 985 38. M. Pająk, M. Kańska, J. Labelled Comp. Radiopharm. 49 (2006) 1061 39. A. A. B. Robertson, N. P. Botting, J. Labelled Comp. Radiopharm. 49 (2006) 1201.


J. Serb. Chem. Soc. 73 (12) 1235–1246 (2008) UDC 547.581.2+547.831–32:532.13:541.25 JSCS–3802 Original scientific paper
doi: 10.2298/JSC0812235R 1235
Study of solute–solvent interactions of nicotinic acid and benzoic acid in methanol and its binary solvent systems
MAHENDRA NATH ROY*, LOVELY SARKAR and BIPUL KUMAR SARKAR
Department of Chemistry, University of North Bengal, Darjeeling-734013, India
(Received 22 November 2007, revised 23 April 2008)
Abstract: The apparent molar volumes, φV, and viscosity B-coefficients, B, for nicotinic acid (NA) and benzoic acid (BA) in mixed solvents containing 10, 20, 30 mass % of n-amyl alcohol (n-AmOH) or isoamyl alcohol (i-AmOH) in me-thanol and in pure methanol (MeOH) were determined from the solution den-sity and viscosity measurements at 298.15 K as function of concentrations of NA and BA. These results were, in conjunction with the results obtained in pure methanol, used to deduce the partial molar volumes of transfer, 0
Vφ∆ , and vis-cosity B-coefficients of transfer, ∆B, for NA and BA from methanol to diffe-rent mixed methanol solvents, in order to rationalize various interactions in the ternary solutions. An increase in the transfer properties of NA and BA with in-creasing mass % of n-AmOH and i-AmOH in methanol was observed and ex-plained by the effect of structural changes and preferential solvation. Also, the free energies of viscous flow, ≠∆ 0
1µ and ≠∆ 02µ , per mole of solvent and solute,
respectively, were calculated and analyzed on the basis of the transition state theory of relative viscosity.
Keywords: apparent molar volumes; viscosity B-coefficients; nicotinic acid; benzoic acid; solute–solvent interactions.
INTRODUCTION
Many enzymes require a non-protein co-factor for their catalytic activities. Vitamins are essential precursors for various co-enzymes. These co-enzymes are therefore required in almost all metabolic pathways.1 Nicotinic acid (pyridine-3- -carboxylic acid) is an essential micro-nutrient, a reactive moiety of the co-en-zyme nicotinamide adenine dinucleotide (NAD) and nicotinamide adenine dinuc-leotide phosphate (NADP).2 NAD is involved in the catabolism of carbohydrates, fats, and proteins with simultaneous energy production. The NADP functions con-sist especially of anabolic processes of fatty acids and cholesterol synthesis.3–5 Sometimes nicotinic acid is referred to as nothing more than vitamin PP (Pellagra Preventive),2,6,7 since its deficiency in human diet causes pellagra.
* Corresponding author. E-mail: [email protected]

1236 ROY, SARKAR and SARKAR
Benzoic acid is a good adsorbing reagent for insulin8,9 and is used in medicine as a urinary antiseptic and in the vapor form for disinfecting bronchial tubes.10 This acid also finds many important applications in the manufacture of alkyl resins, plasticizers and pharmaceuticals.11
Volumetric properties of the binary or ternary mixtures have recently been studied extensively. In particular, much effort has gone into the determination of partial molar volumes at infinite dilution, as they are the key to solvation pheno-mena. Although there are studies on various properties of nicotinic acid (NA) 7,12–17,20 and benzoic acid (BA) 9,18–22 in the literature, studies on partial molar volumes and viscosities of these compounds in mixed solvent systems are still scarce. Hence in this study an attempt was made to study these properties for NA and BA in binary mixtures of methanol with n-amyl (n-AmOH) and isoamyl al-cohol (i-AmOH) at 298.15 K to unravel the various interactions prevailing in the ternary systems under investigation.
EXPERIMENTAL Nicotinic acid and benzoic acid were purchased from the Sigma Chemical Company,
USA and used as received. Their purity as supplied by the vendor was 99 %. A. R. Grade methanol, n-amyl alcohol and isoamyl alcohol were purchased from Merck, India. The purity of the alcohols as given by the vendor was also 99 %. The purification of methanol was cited in an earlier paper.23 Both n-AmOH and i-AmOH were dried with anhydrous K2CO3 and frac-tionally distilled. The middle fraction was collected and kept free from humidity with 3 Å mo-lecular sieves.24 The physical properties of the different pure liquids and mixed methanol sol-vents are listed in Table I. TABLE I. Physical properties of different pure and mixed methanol solvents at 298.15 K
ρ / g cm-3 η / mPa s Solvent Experimental Literature Experimental Literature
Methanol 0.7869 0.786926 0.547 0.54726 n-Amyl alcohol 0.8115 0.811024 3.350 3.35024 Isoamyl alcohol 0.8071 0.807124 3.475 3.48024 10 mass % of n-amyl alcohol 0.7883 – 0.569 – 20 mass % of n-amyl alcohol 0.7898 – 0.645 – 30 mass % of n-amyl alcohol 0.7923 – 0.732 – 10 mass % of isoamyl alcohol 0.7882 – 0.574 – 20 mass % of isoamyl alcohol 0.7900 – 0.648 – 30 mass % of isoamyl alcohol 0.7911 – 0.720 –
Stock solutions of NA and BA in different mixed methanol solvents and in pure metha-nol were prepared by mass and the working solutions were prepared by mass dilution. The conversion of molality into molarity was accomplished using the experimental density values. Great care was taken in minimizing evaporation losses and preventing moisture pick-up. The uncertainty in the molarity of the nicotinamide solutions was evaluated to ±0.0001 mol dm-3.
The densities were measured with an Ostwald–Sprengel type pycnometer having a bulb volume of 25 cm3 and an internal diameter of the capillary of about 0.1 cm. The pycnometer was calibrated at 298.15 K with doubly distilled water and purified benzene. The pycnometer

NICOTINIC AND BENZOIC ACID IN METHANOL 1237
with the test solution was equilibrated in a water bath maintained at ±0.01 K of the desired temperature. The pycnometer was then removed from the thermostatic bath, properly dried, and weighed. The mass measurements accurate to ±0.01 mg were made on a digital electronic analytical balance (Mettler Toledo, AG 285, Switzerland). The total uncertainty in density was estimated to be ±0.0001 g cm-3 and that of the temperature ±0.01 K.
The viscosity was measured by means of a suspended Ubbelohde type viscometer, which had been thoroughly cleaned, dried and calibrated at 298.15 K with triply distilled water and purified methanol. It was filled with experimental liquid and placed vertically in a glass sided thermostat bath maintained constant to ±0.01 K. The efflux times of flow of the liquids were recorded with a stopwatch correct to ±0.1 s. The viscosity of a solution, η, is given by the following equation:
ρη )(tLkt −= (1)
where k and L are viscometer constants and t and ρ are the efflux time of flow and the density of the experimental liquid, respectively. The uncertainty in the viscosity measurements was within ±0.003 mPa s. Details of the methods and techniques of density and viscosity measure-ments were described elsewhere.25,26 The experimental values of concentrations c, densities vis-cosities, and derived parameters of the studied ternary solutions at 298.15 K are reported in Table II. TABLE II. Concetration, density, viscosity, apparent molar volume, φV, and c/)1( r −η for nicotinic acid and benzoic acid in methanol and mixed methanol solvents at 298.15 K
c / mol dm-3 ρ / g cm-3 η / mPa s φV / cm3 mol-1 c/)1( r −η Nicotinic acid In methanol
0.0197 0.7880 0.551 88.32 0.0521 0.0320 0.7886 0.553 87.09 0.0613 0.0517 0.7898 0.559 85.57 0.0965 0.0690 0.7908 0.563 84.28 0.1113 0.0779 0.7913 0.565 83.91 0.1179 0.0821 0.7916 0.566 83.70 0.1212
In 10 mass % of n-AmOH + MeOH 0.0200 0.7893 0.575 93.55 0.0746 0.0325 0.7900 0.579 92.20 0.0975 0.0524 0.7910 0.584 90.45 0.1152 0.0699 0.7920 0.590 89.08 0.1396 0.0874 0.7930 0.596 87.95 0.1605 0.0901 0.7932 0.597 87.80 0.1639
In 20 mass % of n-AmOH + MeOH 0.0200 0.7908 0.647 92.90 0.0219 0.0325 0.7915 0.651 90.04 0.0516 0.0524 0.7927 0.656 86.29 0.0745 0.0699 0.7938 0.662 83.76 0.0996 0.0874 0.7949 0.668 81.67 0.1206 0.0900 0.7951 0.669 81.31 0.1240

1238 ROY, SARKAR and SARKAR
TABLE II. Continued
c / mol dm-3 ρ / g cm-3 η / mPa s φV / cm3 mol-1 c/)1( r −η Nicotinic acid
In 30 mass % of n-AmOH + MeOH 0.0199 0.7931 0.737 104.64 0.0484 0.0325 0.7937 0.742 101.01 0.0758 0.0524 0.7948 0.752 95.17 0.1194 0.0698 0.7957 0.760 93.90 0.1448 0.0812 0.7964 0.765 91.65 0.1582 0.0815 0.7964 0.765 91.89 0.1579
In 10 mass % of i-AmOH + MeOH 0.0198 0.7893 0.579 83.32 0.0619 0.0321 0.7900 0.582 83.12 0.0778 0.0519 0.7912 0.589 82.85 0.1147 0.0692 0.7922 0.595 82.68 0.1391 0.0865 0.7932 0.601 82.50 0.1599 0.0878 0.7933 0.601 82.49 0.1587
In 20 mass % of i-AmOH + MeOH 0.0197 0.7909 0.651 98.01 0.0330 0.0321 0.7916 0.655 92.74 0.0603 0.0518 0.7927 0.662 89.86 0.0949 0.0690 0.7938 0.668 86.12 0.1175 0.0780 0.7943 0.671 86.05 0.1271 0.0822 0.7946 0.673 85.00 0.1346
In 30 mass % of i-AmOH + MeOH 0.0197 0.7920 0.729 97.87 0.0891 0.0321 0.7927 0.738 92.61 0.1395 0.0518 0.7941 0.754 82.41 0.2075 0.0691 0.7954 0.765 76.96 0.2378 0.0839 0.7967 0.777 72.00 0.2733 0.0849 0.7967 0.778 71.70 0.2765
Benzoic acid In methanol
0.0200 0.7885 0.553 88.60 0.0776 0.0320 0.7890 0.556 88.45 0.0920 0.0519 0.7898 0.560 88.25 0.1043 0.0719 0.7907 0.564 88.11 0.1159 0.0878 0.7915 0.567 88.01 0.1234 0.0999 0.7919 0.569 87.96 0.1272
In 10 mass % of n-AmOH + MeOH 0.0204 0.7894 0.573 86.51 0.0492 0.0325 0.7901 0.576 84.66 0.0682 0.0528 0.7913 0.580 82.84 0.0841 0.0732 0.7926 0.585 80.40 0.1039 0.0894 0.7936 0.588 79.71 0.1117 0.0996 0.7943 0.591 78.50 0.1225

NICOTINIC AND BENZOIC ACID IN METHANOL 1239
TABLE II. Continued
c / mol dm-3 ρ / g cm-3 η / mPa s φV / cm3 mol-1 c/)1( r −η Benzoic acid
In 20 mass % of n-AmOH + MeOH 0.0200 0.7906 0.648 101.50 0.0329 0.0320 0.7912 0.650 99.46 0.0433 0.0521 0.7922 0.656 97.10 0.0747 0.0722 0.7932 0.661 95.06 0.0923 0.0883 0.7941 0.665 93.60 0.1043 0.0983 0.7946 0.668 92.79 0.1137
In 30 mass % of n-AmOH + MeOH 0.0200 0.7931 0.734 103.65 0.0193 0.0320 0.7938 0.738 100.59 0.0458 0.0520 0.7947 0.743 97.13 0.0659 0.0719 0.7957 0.749 94.19 0.0866 0.0879 0.7968 0.755 91.73 0.1060 0.0999 0.7971 0.759 90.57 0.1167
In 10 mass % of i-AmOH + MeOH 0.0199 0.7891 0.577 95.84 0.0370 0.0318 0.7897 0.579 94.86 0.0488 0.0518 0.7907 0.583 93.57 0.0689 0.0716 0.7917 0.587 92.55 0.0846 0.0876 0.7926 0.590 91.67 0.0942 0.0995 0.7932 0.593 91.14 0.1049
In 20 mass % of i-AmOH + MeOH 0.0199 0.7910 0.650 104.64 0.0219 0.0318 0.7914 0.652 102.54 0.0346 0.0516 0.7924 0.657 99.67 0.0611 0.0716 0.7933 0.662 97.32 0.0807 0.0874 0.7941 0.666 95.69 0.0940 0.0994 0.7945 0.670 94.75 0.1077
In 30 mass % of i-AmOH + MeOH 0.0199 0.7918 0.725 109.90 0.0492 0.0319 0.7923 0.729 106.82 0.0700 0.0517 0.7932 0.736 103.02 0.0977 0.0716 0.7944 0.743 96.11 0.1194 0.0875 0.7950 0.749 98.03 0.1362 0.0994 0.7956 0.755 97.14 0.1542
RESULT AND DISCUSSION
For the analysis of the solvation state of NA and BA in mixed methanol sol-vents and the interactions existing between different components in the studied solutions, the apparent molar volumes (φV) were determined from the solution densities using the following equation:25,27
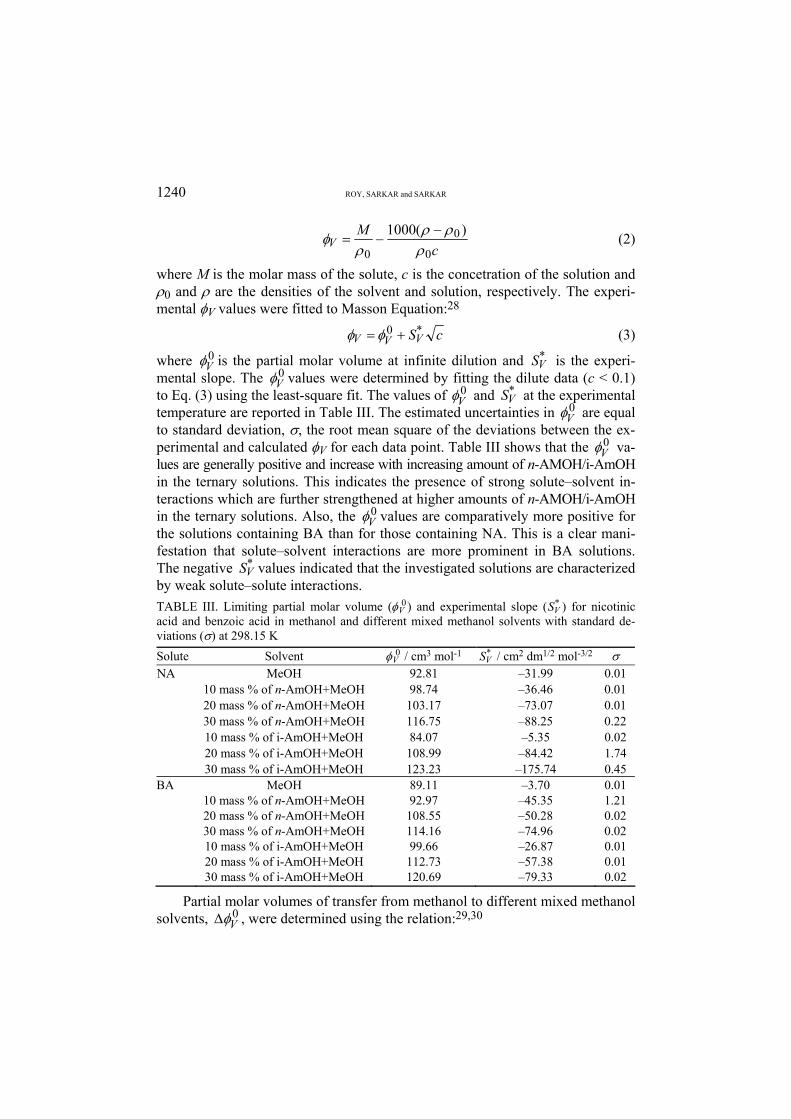
1240 ROY, SARKAR and SARKAR
c
MV
0
0
0
)(1000ρ
ρρρ
φ −−= (2)
where M is the molar mass of the solute, c is the concetration of the solution and ρ0 and ρ are the densities of the solvent and solution, respectively. The experi-mental φV values were fitted to Masson Equation:28
cS*VVV += 0φφ (3)
where 0Vφ is the partial molar volume at infinite dilution and *
VS is the experi-mental slope. The 0
Vφ values were determined by fitting the dilute data (c < 0.1) to Eq. (3) using the least-square fit. The values of 0
Vφ and *VS at the experimental
temperature are reported in Table III. The estimated uncertainties in 0Vφ are equal
to standard deviation, σ, the root mean square of the deviations between the ex-perimental and calculated φV for each data point. Table III shows that the 0
Vφ va-lues are generally positive and increase with increasing amount of n-AMOH/i-AmOH in the ternary solutions. This indicates the presence of strong solute–solvent in-teractions which are further strengthened at higher amounts of n-AMOH/i-AmOH in the ternary solutions. Also, the 0
Vφ values are comparatively more positive for the solutions containing BA than for those containing NA. This is a clear mani-festation that solute–solvent interactions are more prominent in BA solutions. The negative *
VS values indicated that the investigated solutions are characterized by weak solute–solute interactions. TABLE III. Limiting partial molar volume ( 0
Vφ ) and experimental slope ( *VS ) for nicotinic
acid and benzoic acid in methanol and different mixed methanol solvents with standard de-viations (σ) at 298.15 K Solute Solvent 0
Vφ / cm3 mol-1 *VS / cm2 dm1/2 mol-3/2 σ
MeOH 92.81 –31.99 0.01 10 mass % of n-AmOH+MeOH 98.74 –36.46 0.01 20 mass % of n-AmOH+MeOH 103.17 –73.07 0.01 30 mass % of n-AmOH+MeOH 116.75 –88.25 0.22 10 mass % of i-AmOH+MeOH 84.07 –5.35 0.02 20 mass % of i-AmOH+MeOH 108.99 –84.42 1.74
NA
30 mass % of i-AmOH+MeOH 123.23 –175.74 0.45 BA MeOH 89.11 –3.70 0.01
10 mass % of n-AmOH+MeOH 92.97 –45.35 1.21 20 mass % of n-AmOH+MeOH 108.55 –50.28 0.02 30 mass % of n-AmOH+MeOH 114.16 –74.96 0.02 10 mass % of i-AmOH+MeOH 99.66 –26.87 0.01 20 mass % of i-AmOH+MeOH 112.73 –57.38 0.01 30 mass % of i-AmOH+MeOH 120.69 –79.33 0.02
Partial molar volumes of transfer from methanol to different mixed methanol solvents, 0
Vφ∆ , were determined using the relation:29,30

NICOTINIC AND BENZOIC ACID IN METHANOL 1241
0Vφ∆ = 0
Vφ (mixed methanol solvent) – 0Vφ (methanol) (4)
The 0Vφ∆ value is, by definition, free from solute–solute interactions and
therefore provides information regarding solute–co-solute interactions.29 Alco-hols are characterized by the presence of extensive intermolecular hydrogen bond-ing in the pure state,31 as well as in their mixtures. However, the strength of hy-drogen bonding depends on the position of the –OH group and molecular shape. Due to the branched structure of i-AmOH, intermolecular hydrogen bonding is less32,33 in i-AmOH + MeOH mixtures than in the n-AmOH + MeOH system. This fact may also be due to the order of the +I-effect: MeOH < n-AmOH < < i-AmOH and thereby decreasing the polarity of the alcoholic O–H bonds. This decreased polarity of the alcoholic O–H bonds decreases the degree of intermole-cular hydrogen bonding in the mixtures but increases the solvation of the studied solutes, predominantly by hydrophobic–hydrophobic group interactions.34 As can be seen from Table IV, the value of 0
Vφ∆ is positive and increases monotonically with the amount of n-AmOH/i-AmOH in the ternary mixtures, indicating increas-ed solute–solvents interactions in the mixed methanol solvents. Also, it is evident that this increasing trend is, on average, greater for the i-AmOH + methanol sys-tem than for the n-AmOH + methanol system. This suggests that NA and BA are preferentially more solvated by n-AmOH/i-AmOH than by methanol and the branched structure of i-AmOH renders it a more efficient solvent for the studied solutes. Also, the 0
Vφ∆ values are generally more positive for mixtures contain-ing BA, i.e., the solute–solvent interactions are comparatively more prominent for the BA mixtures than for the NA mixtures. This may be attributed to their structural difference and, inasmuch as the local structure in solutions depends on the forces between molecules and on the form and volume of the molecules, it will change with the composition. The 0
Vφ∆ values are depicted graphically in Figs. 1 and 2 as a function of mass % of n-AmOH/i-AmOH in the solutions for the studied solutes at 298.15 K.
A perusal of Table V shows that the values of the A coefficient are generally negative for all the investigated solutions at the experimental temperature. These results indicate the presence of weak solute–solute interactions and that these in-teractions further decrease with increasing mass % of n-AmOH/i-AmOH in the solutions. The viscosity B-coefficient36 reflects the effects of solute–solvent in-teractions on the solution viscosity. Table V illustrates that the values of the vis-cosity B-coefficient for selected solutes in the studied solvent systems are posi-tive, thereby suggesting the presence of strong solute–solvent interactions and these interactions are further strengthened with increasing mass % of n-AmOH/i--AmOH in the ternary solutions.
The viscosity B-coefficients of transfer (∆B) from methanol to different mixed methanol solvents were determined using the relation:29,30

1242 ROY, SARKAR and SARKAR
∆B = B(mixed methanol solvent) – B(methanol) (6) The B∆ values, shown in Table IV, and depicted graphically in Figs. 1 and 2
as a function of mass % of n-AmOH/i-AmOH in solutions at 298.15 K, support the results obtained from the 0
Vφ∆ values discussed above. TABLE IV. Values of 0
Vφ∆ and ∆B of transfer from methanol to different mixed methanol solvents for NA and BA at 298.15 K. The viscosity data of the studied non-aqueous solutions of NA and BA were analyzed using the Jones–Dole Equation:35
1/21/2-r
1/2- )()( BcAcc +=−=− 110
ηηη (5)
where ηr = η/η0; η0 and η are the viscosities of the solvent and solution, respectively. A and B are constants estimated by the least-squares method and reported in Table V Solute Solvent 0
Vφ∆ / cm3 mol-1 ∆B / cm3 mol-1 10 mass % of n-AmOH 5.93 0.052 20 mass % of n-AmOH 10.36 0.127 30 mass % of n-AmOH 23.94 0.270 10 mass % of i-AmOH –8.74 0.152 20 mass % of i-AmOH 16.18 0.183
NA
30 mass % of i-AmOH 30.42 0.721 BA 10 mass % of n-AmOH 3.86 0.127
20 mass % of n-AmOH 19.44 0.202 30 mass % of n-AmOH 25.05 0.259 10 mass % of i-AmOH 10.55 0.106 20 mass % of i-AmOH 23.62 0.213 30 mass % of i-AmOH 31.58 0.304
TABLE V. Values of viscosity A and B coefficients with standard errors in parenthesis for NA and BA in methanol and different mixed methanol solvents at 298.15 K Solute Solvent A / cm3/2 mol-1/2 B / cm3 mol-1
MeOH –0.022 (±0.007) 0.502 (±0.031) 10 mass % of n-AmOH –0.005 (±0.011) 0.554 (±0.030) 20 mass % of n-AmOH –0.066 (±0.006) 0.629 (±0.022) 30 mass % of n-AmOH –0.061 (±0.002) 0.772 (±0.007) 10 mass % of i-AmOH –0.034 (±0.006) 0.654 (±0.010) 20 mass % of i-AmOH –0.063 (±0.004) 0.685 (±0.015)
NA
30 mass % of i-AmOH –0.080 (±0.007) 1.223 (±0.018) BA MeOH 0.040(±0.000) 0.281 (±0.001)
10 mass % of n-AmOH –0.008(±0.007) 0.408 (±0.015) 20 mass % of n-AmOH –0.038(±0.001) 0.483 (±0.013) 30 mass % of n-AmOH –0.055(±0.002) 0.540 (±0.007) 10 mass % of i-AmOH –0.019(±0.001) 0.387 (±0.002) 20 mass % of i-AmOH –0.051(±0.006) 0.494 (±0.017) 30 mass % of i-AmOH –0.035(±0.012) 0.585 (±0.040)

NICOTINIC AND BENZOIC ACID IN METHANOL 1243
Fig. 1. Plots of partial molar volume of transfer, 0
Vφ∆ , and viscosity B-coefficient of transfer, ∆B, from methanol to methanol + n-AmOH ()/i-AmOH () solvents for nicotinic acid and
benzoic acid at 298.15 K; Solid and dotted lines are for 0Vφ∆ and ∆B, respectively.
Fig. 2. Plots of partial molar volume of transfer, 0
Vφ∆ , and viscosity B-coefficient of transfer, ∆B, from methanol to different mixed methanol solvents for nicotinic acid () and benzoic
acid () at 298.15 K; Solid and dotted lines are for 0Vφ∆ for ∆B, respectively.
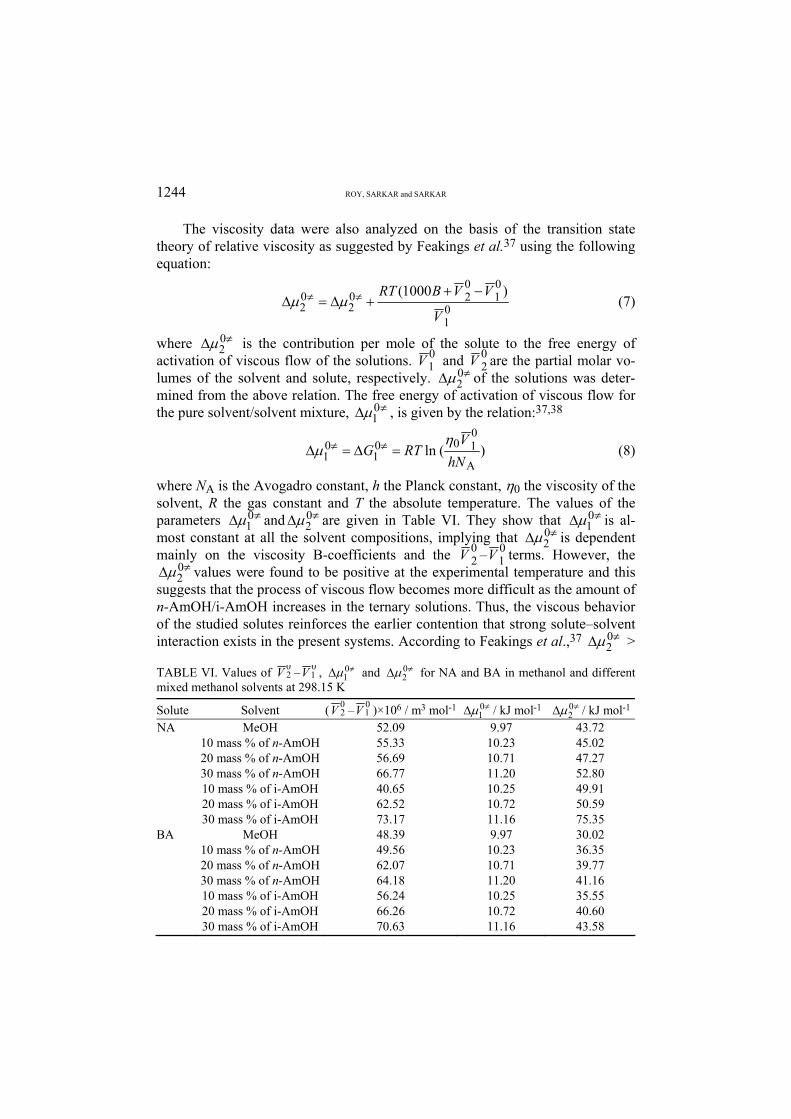
1244 ROY, SARKAR and SARKAR
The viscosity data were also analyzed on the basis of the transition state theory of relative viscosity as suggested by Feakings et al.37 using the following equation:
01
01
020
202
)1000(
V
VVBRT −++∆=∆ ≠≠ µµ (7)
where ≠∆ 02µ is the contribution per mole of the solute to the free energy of
activation of viscous flow of the solutions. 01V and 0
2V are the partial molar vo-lumes of the solvent and solute, respectively. ≠∆ 0
2µ of the solutions was deter-mined from the above relation. The free energy of activation of viscous flow for the pure solvent/solvent mixture, ≠∆ 0
1µ , is given by the relation:37,38
)(lnA
0100
101 hN
VRTG
ηµ =∆=∆ ≠≠ (8)
where NA is the Avogadro constant, h the Planck constant, η0 the viscosity of the solvent, R the gas constant and T the absolute temperature. The values of the parameters ≠∆ 0
1µ and ≠∆ 02µ are given in Table VI. They show that ≠∆ 0
1µ is al-most constant at all the solvent compositions, implying that ≠∆ 0
2µ is dependent mainly on the viscosity B-coefficients and the 0
2V – 01V terms. However, the
≠∆ 02µ values were found to be positive at the experimental temperature and this
suggests that the process of viscous flow becomes more difficult as the amount of n-AmOH/i-AmOH increases in the ternary solutions. Thus, the viscous behavior of the studied solutes reinforces the earlier contention that strong solute–solvent interaction exists in the present systems. According to Feakings et al.,37 ≠∆ 0
2µ >
TABLE VI. Values of 02V – 0
1V , ≠∆ 01µ and ≠∆ 0
2µ for NA and BA in methanol and different mixed methanol solvents at 298.15 K
Solute Solvent ( 02V – 0
1V )×106 / m3 mol-1 ≠∆ 01µ / kJ mol-1 ≠∆ 0
2µ / kJ mol-1 MeOH 52.09 9.97 43.72
10 mass % of n-AmOH 55.33 10.23 45.02 20 mass % of n-AmOH 56.69 10.71 47.27 30 mass % of n-AmOH 66.77 11.20 52.80 10 mass % of i-AmOH 40.65 10.25 49.91 20 mass % of i-AmOH 62.52 10.72 50.59
NA
30 mass % of i-AmOH 73.17 11.16 75.35 BA MeOH 48.39 9.97 30.02
10 mass % of n-AmOH 49.56 10.23 36.35 20 mass % of n-AmOH 62.07 10.71 39.77 30 mass % of n-AmOH 64.18 11.20 41.16 10 mass % of i-AmOH 56.24 10.25 35.55 20 mass % of i-AmOH 66.26 10.72 40.60 30 mass % of i-AmOH 70.63 11.16 43.58

NICOTINIC AND BENZOIC ACID IN METHANOL 1245
> ≠∆ 01µ for solutes with positive viscosity B-coefficients indicates stronger solu-
te–solvent interactions, thereby suggesting that the formation of the transition state is accompanied by the rupture and distortion of the intermolecular forces in the solvent structure.37 In the present study, the found relation ≠∆ 0
2µ > ≠∆ 01µ sug-
gests an increase in the bulk structure of methanol in the presence of NA and BA due to the preferential solvation of the said solutes by n-AmOH/i-AmOH, releasing some methanol molecules to the bulk structure. In fact, Feakings et al37
showed ≠∆ 02µ > ≠∆ 0
1µ for solutes that are structure promoters. CONCLUSION
In summary, the 0Vφ∆ and viscosity B-coefficient values for nicotinic acid
and benzoic acid indicate the presence of strong solute–solvent interactions and these interactions are further strengthened at higher amount of n-AmOH/i-AmOH in the ternary solutions. Also, they were found to act as methanol-structure pro-moters and their solvation behavior towards the mixed alcoholic solvents were more or less similar to in nature.
Acknowledgements. The authors are grateful to the Departmental Special Assistance Scheme under the University Grants Commission, New Delhi (No. 540/6/DRS/2002, SAP-1) for fi-nancial support.
И З В О Д
ИЗУЧАВАЊЕ ИНТЕРАКЦИЈА РАСТВОРЕНА СУСПСТАНЦА–РАСТВАРАЧ У РАСТВОРИМА НИКОТИНСКЕ И БЕНЗОЕВЕ КИСЕЛИНЕ У МЕТАНОЛУ И
БИНАРНОЈ СМЕШИ РАСТВАРАЧА
MAHENDRA NATH ROY, LOVELY SARKAR и BIPUL KUMAR SARKAR
Department of Chemistry, University of North Bengal, Darjeeling-734013, India
На основу зависности густине и вискозности од концентрације никотинске (NA) и бен-зоеве (BA) киселине у бинарном растварачу, који садржи 10, 20 и 30 mass % n-амил алкохола (n-AmOH) или изоамил алкохола у метанолу (i-AmOH), и чистом метанолу, на температури 298,15 K, одређене су вредности привидних моларних запремина, φV, и B коефицијента вискозности. Ови резултати су искоришћени за одређивање парцијалне моларне запремине,
0Vφ∆ , и B коефицијента вискозности, ∆B, преноса за NA и BA од метанола ка различитим
бинарним метанолским растварачима, да би се рационализовале различите интеракције у терцијарним растворима. Уочен је пораст величина преноса NA и BA са порастом садржаја n-AmOH или i-AmOH у метанолу, који је објашњен ефектима структурних промена и преференцијалне солватације. Такође, израчунате су и моларне промене хемијског потенцијала за растварач и растворену сустанцу, ≠∆ 0
1µ и ≠∆ 02µ , респективно, и анализиране
у складу са теоријом прелазног стања и релативном вискозношћу.
(Примљено 22. новембра 2007, ревидирано 23. априла 2008)
REFERENCES 1. F. A. Robinson, The Vitamin B-Complexes, Chapman & Hall, London, 1951, Ch. 4

1246 ROY, SARKAR and SARKAR
2. A. S. Fauci, E. Braunwald, K. J. Isselbacher, J. D. Wilson, J. B. Martin, D. L. Kasper, S. L. Hauser, D. L. Long, Harrison’s Principles of Internal Medicine, Vol. 1, 14th Ed., McGraw- Hill, New York, 1998
3. T. Brody, Nutritional Biochemistry, 2nd Ed., Academic Press, San Diego, CA, 1999 4. M. Shils, J. A. Olson, M. Shike, A. C. Ross, Nutrition in Health and Diseases, 9th Ed.,
Williams & Wilkins, Baltimore, MD, 1999 5. E. E. Snell, D. E. Metzler, Annu. Rev. Biochem. 25 (1956) 435 6. A. N. Nesmeyanov, N. A. Nesmeyanov, Fundamentals of Organic Chemistry, Vol. 3, Mir
Publishers, Moscow, 1981, p. 393 7. D. Cacaval, A. C. Blaga, M. Camarup, A. I. Galaction, Separation Sci. Technol. 42
(2007) 389 8. I. L. Finar, Organic Chemistry, Vol 1: The Fundamental Principles, 6th Ed., Longman
Singapore Publishers (Pte) Ltd, Singapore, 1990 9. P. J. Moloney, D. M. Findlay, J. Biol. Chem. 67 (1923) 359
10. B. S. Bhal, A. Bhal, Advanced Organic Chemistry, S. Chand and Company Ltd., New Delhi, 1981, p. 1097
11. W. A. Sharp, Dictionary of Chemistry, 2nd Ed., Penguin Books Ltd., London, 1990, p. 56 12. H. H. Loh, C. P. Berg, J. Nutrition 101 (1971) 1601 13. S. Schuette, R. C. Rose, Am. J. Physiol. Cell. Physiol. 250 (1986) C694 14. I. Cho, C. L. Chang, X. Quing, J. Agri. Food. Chem. 53 (2005) 7307 15. W. I. M. Holman, Biochemistry 56 (1954) 513 16. Z. Orekhova, M. Ben-Hamo, E. Manzurola, A. Apelblat, J. Soln. Chem. 34 (2005) 687 17. C. Yiyun, X. Tongwen, Eur. J. Med. Chem. 40 (2005) 1384 18. K. Sagarik, S. Chaiwongwattana, P. Sisot, J. Chem. Phys. 306 (2004) 1 19. P. K. Mandal, D. K. Chatterjee, B. K. Seal, A. K. Basu, J. Soln. Chem. 7 (1978) 1572 20. A. G. Kharitonova, O. K. Krasilnikova, R. Sh.Vastapetyan, A. V. Bulanova, Colloid J. 67
(2005) 375 21. J. W. Mauger, A. N. Paralta, J. Pharm. Sci. 63 (1974) 576 22. E. Ayranci, N. Hoda, E. Bayram, J. Colloid Interface Sci. 284 (2005) 83 23. M. N. Roy, B. Sinha, J. Soln. Chem. 34 (2005) 1311 24. R. Riggio, H. E. Martinez, H. N. Sollomo, J. Chem. Eng. Data 31 (1986) 235 25. M. N. Roy, B. Sinha, V. K. Dakua, J. Chem. Eng. Data 51 (2006) 590 26. M. N. Roy, B. Sinha, J. Mol. Liq. 133 (2007) 89 27. B. Sinha, V. K. Dakua, M. N. Roy, J. Chem. Eng. Data 52 (2007) 1768 28. A. Kundu, N. Kishore, J. Soln. Chem. 32 (2003) 703 29. K. Belibagli, E. Agranci, J. Soln. Chem. 19 (1990) 867 30. A. Ali, S. Khan, F. Nabi, J. Serb. Chem. Soc. 72 (2007) 495 31. Y. Marcus, Introduction to Liquid State Chemistry, Wiley, New York, 1977 32. V. K. Dakua, B. Sinha, M. N. Roy, J. Indian. Chem. Soc. 84 (2007) 37 33. A. Aucejo, M. C. Burguet, R. Munoz, M. Sanchotello, J. Chem. Eng. Data 41(1996) 508 34. A. Ben-Naim, Solvation Thermodynamics, Plenum Press, New York, 1987 35. G. Jones, M. Dole, J. Am. Chem. Soc. 51 (1929) 2950 36. F. J. Millero, A. Losurdo, C. Shin, J. Phys. Chem. 82 (1978) 784 37. D. Feakings, D. J. Freemantle, K. G. Lawrence, J. Chem. Soc., Faraday Trans. I 70
(1974) 795 38. S. Glasston, K. Laidler, H. Eyring, The Theory of Rate Processes, McGraw-Hill, New
York, 1941.

J. Serb. Chem. Soc. 73 (12) 1247 (2008)
1247
Errata (printed version only)
Issue No. 11 (2008), Vol. 73, page 1110: – Line 24 from the top should read: “…Development of the Republic of Ser-
bia under Grant No. 14061 is acknowledged. Thanks are…” – Line 32 from the top should read: “…ДОБИЈЕНОМ НЕОРГАНСКИМ СОЛ–
–ГЕЛ ПОСТУПКОМ…”


J. Serb. Chem. Soc. 73 (12) 1249–1257 (2008)
1249
Contents of Volume 73
NUMBER 1 Organic Chemistry and Biochemistry L. Wang, Y. Feng, J. Xue and Y. Li: Synthesis and characterization of novel porphyrin
Schiff bases ................................................................................................................. 1 S. S. Konstantinović, B. C. Radovanović, S. P. Sovilj and S. Stanojević: Antimicrobial
activity of some isatin-3-thiosemicarbazone complexes ............................................. 7 D. Cvetković and D. Marković: Stability of carotenoids toward UV-irradiation in hexane
solution .............................................................................................................................. 15 Inorganic Chemistry M. Atanassova: Crown ethers as synergistic agents in the solvent extraction of trivalent
lanthanides with 8-hydroxyquinoline.......................................................................... 29 Theoretical Chemistry A. Rakić and P. M. Mitrašinović: On the dynamics of some small structural motifs in
rRNA upon ligand binding.......................................................................................... 41 Physical Chemistry G. Mitran, I.–C. Marcu, T. Yuzhakova and I. Sandulescu: Selective oxidation of isobutane
on V–Mo–O mixed oxide catalysts ...................................................................................... 55 P. S. Ramachandran, V. Raja and N. Rajamanickam: Molecular parameters for the gas
phase molecules SbO and SbP .................................................................................... 65 Thermodynamics O. Ciocirlan and O. Iulian: Vapor pressure, density, viscosity and refractive index of di-
methyl sulfoxide + 1,4-dimethylbenzene system ........................................................ 73 Analytical Chemistry A. H. Aktaş and G. P. Ertokuş: Potentiometric determination of ibuprofen, indomethacin
and naproxen using an artificial neural network calibration ....................................... 87 Polymers D. Stoiljković, B. Pilić, M. Bulajić, N. Đurasović and N. Ostrovskii: The charge percola-
tion mechanism and simulation of Ziegler–Natta polymerizations. Part VII. Effects of the distribution of chromium active centers on silica on the polymerization of ethylene....................................................................................................................... 97
Materials V. Goryany, E. Hofmann and P. J. Mauk: Influence of cooling conditions and amount of
retained austenite on the fracture of austempered ductile iron .................................... 113 I. Radović, Y. Serruys, Y. Limoge and N. Bibić: Reactive sputtering deposition of SiO2
thin films ..................................................................................................................... 121

1250 JOURNAL OF THE SERBIAN CHEMICAL SOCIETY
Book Review V. Popsavin: BILE ACIDS: Chemistry, biosynthesis, analysis, chemical and metabolic
transformations and pharmacology, M. Mikov and J. P. Fawcett, Eds., Mediset Publisher, Geneva, Switzerland, 2007 ........................................................................ 127
NUMBER 2 Organic Chemistry and Biochemistry R. R. Kamble, B. S. Sudha and D. G. Bhadregowda: Expeditious synthesis of 1,3,4-oxa-
diazole derivatives via sydnones................................................................................. 131 M. Simonović, S. Zlatanović–Milošević, M. M. Vrvić and B. Simonović: Recombinant ex-
pression of monovalent and bivalent anti-TNT-antibodies – evaluation of different expression systems...................................................................................................... 139
N. Ognjanović, D. Bezbradica and Z. Knežević: Optimization of the production of bio-diesel by a commercial immobilized lipase in a solvent-free system using a response surface methodology ........................................................................................................ 147
M. V. Nikolić and Lj. Mojović: Characterization and degradation of pectin derived from Budimka apple ............................................................................................................ 157
Inorganic Chemistry N. Geetha and S. Thirumaran: Characterization studies and cyclic voltammetry on nickel(II)
amino acid dithiocarbamates with triphenylphosphine in the coordination sphere ..... 169 M. Hussain, M. Zaman, M. Hanif, S. Ali and M. Danish: Synthesis and structural characte-
rization of organotin(IV) complexes formed with [O,O] donor atoms of carboxylic acids .... 179 Theoretical Chemistry A. Moghani: Q-Conjugacy character and Markaracter tables of tetraammineplatinum(II) . 189 Physical Chemistry D. Bajuk-Bogdanović, I. Holclajtner-Antunović, M. Todorović, U. B. Mioč and J. Zakr-
zewska: A study of 12-tungstosilicic and 12-molybdophosphoric acids in solution .... 197 N. Štrbac, D. Živković, I. Mihajlović, B. Boyanov and Ž. Živković: Mechanism and kine-
tics of the oxidation of synthetic α-NiS ...................................................................... 211 Electrochemistry F. Crisan and E. Salló: Periodic current oscillations of zinc in nitric acid solutions .......... 221 P. M. Živković, B. N. Grgur and K. I. Popov: The validity of the general polarization
curve equation approximation for the process of metal deposition (Note).................. 227 Analytical Chemistry M. A. Karimi, M. M. Ardakani, R. Behjatmanesh-Ardakani, M. R. H. Nezhad and H. Amiryan:
Individual and simultaneous determinations of phenothiazine drugs using PCR, PLS and (OSC)–PLS multivariate calibration methods ...................................................... 233
R. Gong, D. Zhang, K. Zhong, M. Feng and X. Liu: Determination of trace copper in water samples by flame atomic absorption spectrometry after preconcentration on a phosphoric acid functionalized cotton chelator........................................................... 249
NUMBER 3 Editor's note
In memoriam: Academician Dragutin M. Dražić ................................................................ 259

VOLUME 73: CONTENTS 1251
Organic Chemistry and Biochemistry B. S. Sudha, R. R. Kamble and S. Shashikanth: A convenient preparation of novel benzo-
phenone derivatives .................................................................................................... 261 J. Zvezdanović and D. Marković: Bleaching of chlorophylls by UV-irradiation in vitro:
the effects on chlorophyll organization in acetone and n-hexane................................ 271 I. S. Marković, Z. A. Đarmati and B. F. Abramović: Chemical composition of leaf ex-
tracts of Stevia rebaudiana Bertoni grown experimentally in Vojvodina .................... 283 N. Vuković, T. Milošević, S. Sukdolak and S. Solujić: The chemical composition of the
essential oil and the antibacterial activities of the essential oil and methanol extract of Teucrium montanum ............................................................................................... 299
A. Porte and R. L. O. Godoy: Chemical composition of Thymus vulgaris L. (thyme) essential oil from the Rio de Janeiro State (Brazil) (Note).......................................... 307
Theoretical Chemistry M. Eliasi and B. Taeri: Hosoya polynomial of zigzag polyhex nanotorus .......................... 311 Physical Chemistry R. Anbarasan, W. Lee and S. S. Im: Modification of nano-sized layered double hydrox-
ides by long-chain organic aliphatic surfactants............................................................... 321 D. M. Lukić, J. L. Vučina and S. K. Milonjić: Concentration of rhenium from dilute
sodium chloride solutions ........................................................................................... 333 L. Bulgariu and D. Bulgariu: Cd(II) extraction in PEG (1550)–(NH4)2SO4 aqueous two-
-phase systems using halide extractants ...................................................................... 341 Electrochemistry V. D. Jović and B. M. Jović: Semiconducting properties of oxide films formed onto an
Nb electrode in NaOH solutions ................................................................................. 351 Materials J. Trajić, N. Romčević, M. Romčević and V. N. Nikiforov: Plasmon – two phonon inter-
action in PbMnTe and PbTeS alloys ........................................................................... 369 Metallurgy D. Minić, D. Manasijević, D. Živković, N. Štrbac and Z. Stanković: Prediction of phase
equilibria in the In–Sb–Pb system............................................................................... 377
NUMBER 4 Organic Chemistry and Biochemistry G. D. Mahale, A. Kumar, D. Singh, A. V. Ramaswamy and S. B. Waghmode: A green
process for the preparation of 11-4-[2-(2-hydroxyethoxy)ethyl]-1-piperazinyldi-benzo[b,f][1,4]thiazepine ............................................................................................ 385
V. Leskovac, S. Trivić, D. Peričin, M. Popović and J. Kandrač: Short hydrogen bonds in the catalytic mechanism of serine proteases................................................................ 393
A. A. Čučulović, M. S. Pavlović, D. S. Veselinović and Š. S. Miljanić: Metal extraction from Cetraria islandica (L.) Ach. lichen using low pH solutions ................................ 405
Inorganic Chemistry C. Spînu, M. Pleniceanu and C. Tigae: Biologically active new Fe(II), Co(II), Ni(II), Cu(II),
Zn(II) and Cd(II) complexes of N-(2-thienylmethylene)methanamine ....................... 415 K. Krishnakutty, P. Sayudevi and M. B. Ummathur: Metal complexes of Schiff bases
derived from dicinnamoylmethane and aliphatic diamines......................................... 423

1252 JOURNAL OF THE SERBIAN CHEMICAL SOCIETY
Theoretical Chemistry B. Furtula, S. Radenković and I. Gutman: Bicyclic molecular graphs with the greatest
energy (Note) .............................................................................................................. 431 Physical Chemistry S. V. Mahamuni, P. P. Wadgaonkar and M. A. Anuse: Rapid liquid–liquid extraction of thal-
lium(III) from succinate media with 2-octylaminopyridine in chloroform as the extractant .. 435 Geochemistry P. I. Premović, M. N. Stanković, M. S. Pavlović and M. G. Djordjević: Cretaceous – Paleo-
gene boundary Fish Clay at Højerup (Stevns Klint, Denmark): Zn, Pb and REE in kerogen ....................................................................................................................... 453
S. Bajc, O. Cvetković, A. Amblès and D. Vitorović: Characterization of type III kerogen from Tyrolean shale (Hahntennjoch, Austria) based on its oxidation products .......... 463
Materials A. Zalga, R. Juskenas, A. Selskis, D. Jasaitis and A. Kareiva: Synthesis and characteri-
zation of Ln-123 superconductors............................................................................... 479 Lj. Rožić, T. Novaković and S. Petrović: Process improvement approach to the acid acti-
vation of smectite using factorial and orthogonal central composite design methods........... 487 Metallurgy A. I. Kostov and D. T. Živković: Thermodynamic calculations in ternary titanium–alumi-
nium–manganese system............................................................................................. 499 EuCheMS News B. Karlberg, H. Emons and J. E. T. Andersen: European analytical column No. 36 from
the Division of Analytical Chemistry (DAC) of the European Association for Che-mical and Molecular Sciences (EuCheMS)................................................................. 507
NUMBER 5 Organic Chemistry and Biochemistry A. D. Marinković, N. V. Valentić, D. Ž. Mijin, G. G. Ušćumlić and B. Ž. Jovanović: 13C- and
1H-NMR substituent-induced chemical shifts in N(1)-(4-substituted phenyl)-3-cya-no-4,6-dimethyl-2-pyridones ...................................................................................... 513
D. Gođevac, B. Pejin, G. Zdunić, K. Šavikin, D. Stešević, V. Vajs and S. Milosavljević: Flavonoids from the aerial parts of Onobrychis montana subsp. scardica ................... 525
Lj. P. Stanojević, M. Ž. Stanković, V. D. Nikolić and Lj. B. Nikolić: Anti-oxidative and antimicrobial activities of Hieracium pilosella L. extracts ......................................... 531
Inorganic Chemistry V. V. Glodjović and S. R. Trifunović: Stereospecific ligands and their complexes. II. Syn-
thesis and characterization of the s-cis-K[Ru(S,S-eddp)Cl2]·3H2O (Short communi-cation) ......................................................................................................................... 541
Theoretical Chemistry S. Stanković, J. Đurđević, I. Gutman and R. Milentijević: Partitioning of π-electrons in
rings of diaza-derivatives of acenes ............................................................................ 547 Physical Chemistry S. Kanagaprabha, R. R. Palanichamy and V. Sathiyabama: Franck–Condon factors and
r-centroids for the diatomic fluorides of germanium and silicon ................................ 555

VOLUME 73: CONTENTS 1253
Electrochemistry L. Li, C. Wang, S. Chen, X. Hou and X. Yang: Investigation of the pitting of aluminum
induced by chloride ions by holographic microphotography ...................................... 561 Analytical Chemistry M. M. Issa, R. M. Nejem, M. Al-Kholy, N. S. El-Abadla, R. S. Helles and A. A. Saleh: An
indirect atomic absorption spectrometric determination of ciprofloxacin, amoxycil-lin and diclofenac sodium in pharmaceutical formulations......................................... 569
Environmental Chemistry B. Jovančićević, M. Antić, M. Vrvić, M. Ilić, M. Novaković, R. M. Saheed and J.
Schwarzbauer: Transformation of a petroleum pollutant during soil bioremediation experiments................................................................................................................. 577
Metallurgy D. D. Stanojević, M. B. Rajković, D. V. Tošković and M. A. Tomić: Lead and silver ex-
traction from waste cake from hydrometallurgical zinc production............................ 585 Errata................................................................................................................................... 595
NUMBER 6 Biochemistry S. S. Stojičević, I. T. Stanisavljević, D. T. Veličković, V. B. Veljković and M. L. Lazić: Com-
parative screening of the anti-oxidant and antimicrobial activities of Sempervivum marmoreum L. extracts obtained by various extraction techniques ............................ 597
Ö. Alptekin, S. S. Tükel and D. Yildirim: Immobilization and characterization of bovine liver catalase on eggshell ............................................................................................ 609
Inorganic Chemstry S. Grgurić-Šipka, M. A. A. M. Alshtewi, D. Jeremić, G. N. Kaludjerović, S. Gómez-Ruiz,
Ž. Žižak, Z. Juranić and T. J. Sabo: Synthesis, structural characterization and cyto-toxic activity of two new organoruthenium(II) complexes ......................................... 619
Physical Chemistry S. Lodha, D. Vaya, R. Ameta and P. B. Punjabi: Photocatalytic degradation of Phenol Red
using complexes of some transition metals and hydrogen peroxide ........................... 631 Electrochemistry N. R. Elezović, B. M. Babić, N. V. Krstajić, S. Lj. Gojković and Lj. M. Vračar: Tempera-
ture dependence of the kinetics of oxygen reduction on carbon-supported Pt nano-particles....................................................................................................................... 641
Lj. N. Jakšić and R. M. Džudović: Coulometric–potentiometric determination of pKA of several organic bases in propylene carbonate (Short communication) ....................... 655
V. V. Panić: Supercapacitive characteristics of electrochemically active porous materials (Extended abstract) ..................................................................................................... 661
Analytical Chemistry S. S. Mitić, G. Ž. Miletić, D. A. Kostić, D. Č. Nasković-Ðokić, B. B. Arsić and I. D. Rašić:
A rapid and reliable determination of doxycycline hyclate by HPLC with UV detec-tion in pharmaceutical samples ................................................................................... 665

1254 JOURNAL OF THE SERBIAN CHEMICAL SOCIETY
Environmental Chemistry V. Mrvić, M. Jakovljević, D. Stevanović, D. Čakmak and M. Zdravković: Methods for the
determination of the form of aluminium: Pseudogley soils ........................................ 673 Errata................................................................................................................................... 681
NUMBER 7 Organic Chemistry and Biochemistry D. K. Dodiya, A. R. Trivedi, S. J. Vaghasia and V. H. Shah: Characterization and biologi-
cal evaluation of some novel pyrazolo[3’,4’:4,5]thieno[2,3-d]pyrimidin-8-ones syn-thesized via the Gewald reaction................................................................................. 683
M. Nevešćanin, S. Banović Stević, S. Petrović and V. Vajs: Analysis of amphetamines illegally produced in Serbia ........................................................................................ 691
B. Lakušić, M. Ristić, V. Slavkovska, J. Antić Stanković and M. Milenković: Chemical composition and antimicrobial activity of the essential oil from Satureja horvatii Šilić (Lamiaceae) ........................................................................................................ 703
Inorganic Chemstry R. Boscencu, R. Socoteanu, A. S. Oliveira and L. F. V. Ferreira: Studies on Zn(II) mono-
hydroxyphenyl mesoporphyrinic complexes. Synthesis and characterization ............ 713 S. Chandra and M. Tyagi: Ni(II), Pd(II) and Pt(II) complexes with ligand containing
thiosemicarbazone and semicarbazone moiety: synthesis, characterization and bio-logical investigation .................................................................................................... 727
Physical Chemistry D. S. Bhuvaneshwari and K. P. Elango: Effect of excess free energy of solvents on the
oxidation of methionine by quinolinium fluorochromate. A kinetic study..................... 735 A. Egelja, J. Gulicovski, A. Devečerski, B. Babić, M. Miljković, S. Bošković and B. Matović:
Synthesis of biomorphic SiC and SiO2 ceramics ........................................................ 745 Electrochemistry N. D. Nikolić, Lj. J. Pavlović, G. Branković, M. G. Pavlović and K. I. Popov: The ionic
equilibrium in the CuSO4–H2SO4–H2O system and the formation of the honey-comb-like structure during copper electrodeposition .................................................. 753
K. Babić-Samardžija, V. M. Jovanović and S. P. Sovilj: Molecular structure in correlation with electrochemical properties of mixed-ligand cobalt(III) complexes..................... 761
NUMBER 8–9 Organic Chemistry O. Farsa, M. Dočkal, J. Kováčiková and M. Benešová: Synthesis of 2-[2-(2-oxo-1-aza-
cycloalkyl)acetamido]phenoxyacetic acids and their activity as aminopeptidase M inhibitors ..................................................................................................................... 771
A. Husain, F. J. Ahmad, M. Ajmal and P. Ahuja: Synthesis of 1-(4-phenoxyphenyl)-3-[5-(sub-stituted aryl)-1,3,4-oxadiazol-2-yl]propan-1-ones as safer anti-inflammatory and anal-gesic agents................................................................................................................. 781
Biochemistry R. Masnikosa, A. J. Nikolić and O. Nedić: Lectin-induced alterations of the interaction of
insulin and insulin-like growth factor 1 receptors with their ligands .......................... 793 L. Pitulice, A. Isvoran and A. Chiriac: Structural features of proteins as reflected by sta-
tistical scaling laws ..................................................................................................... 805

VOLUME 73: CONTENTS 1255
Inorganic Chemstry D. M. Mitić, Đ. U. Miodragović, D. M. Sladić, Ž. J. Vitnik, Z. M. Miodragović, K. K.
Anđelković, M. Đ. Radulović and N. O. Juranić: Synthesis, NMR, DFT and anti-microbial studies of Zn(II) complexes with N-benzyloxycarbonyl-S-alanine............. 815
Physical Chemistry J. J. Gulicovski, LJ. S. Čerović, S. K. Milonjić and I. G. Popović: Adsorption of itaconic
acid from aqueous solutions onto alumina.................................................................. 825 R. Pode, E. Popovici, L. Cocheci, E. Reisz, E. M. Seftel and V. Pode: Sorption of phosphates
and thiocyanates on isomorphic substituted Mg/Zn–Al-type hydrotalcites ................ 835 Electrochemistry S. Stevanović, D. Tripković, A. Kowal, D. Minić, V. M. Jovanović and A. Tripković: In-
fluence of surface morphology on methanol oxidation at a glassy carbon-supported Pt catalyst.................................................................................................................... 845
V. M. Maksimović, LJ. J. Pavlović, B. M. Jović and M. G. Pavlović: Electrodeposition of Fe powder from acid electrolytes................................................................................ 861
Analytical Chemistry R. M. Džudović and LJ. N. Jakšić: Determination of relative acidity scales for some dipo-
lar aprotic solvents by coulometry using a hydrogen–palladium electrode ................ 871 S. S. Mitić, G. Ž. Miletić, A. N. Pavlović, B. B. Arsić and V. V. Živanović: Quantitative
analysis of ibuprofen in pharmaceuticals and human control serum using kinetic spectrophotometry ...................................................................................................... 879
Materials S. N. Marinković: Carbon nanotubes (Review) ................................................................... 891 Polymers L. Katsikas, M. Avramović, R. D. B. Cortés, M. Milovanović, M. T. Kalagasidis-Krušić
and I. G. Popović: The thermal stability of poly(methyl methacrylate) prepared by RAFT polymerisation (Short communication) ........................................................... 915
Environmental I. Gržetić and R. H. A. Ghariani: Potential health risk assessment for soil heavy metal
contamination in the central zone of Belgrade (Serbia) .............................................. 923 Errata (printed version only) ............................................................................................... 935
NUMBER 10 Organic Chemistry R. Kumar and Y. C. Joshi: Synthesis and antimicrobial, antifungal and anthelmintic acti-
vities of 3H-1,5-benzodiazepine derivatives............................................................... 937 D. Ž. Mijin, M. Praščević and S. D. Petrović: Benzylation of N-phenyl-2-phenylacetamide
under microwave irradiation (Short communication) ................................................. 945
Biochemistry Lj. Radivojević, S. Gašić, Lj. Šantrić and R. Stanković-Kalezić: The impact of atrazine on
several biochemical properties of chernozem soil (Short communication)................. 951 M. Ljaljević Grbić, M. Stupar, J. Vukojević, M. Soković, D. Mišić, D. Grubišić and M. Ristić:
Antifungal activity of Nepeta rtanjensis essential oil ................................................. 961 S. O. Podunavac-Kuzmanović, D. D. Cvetković and D. J. Barna: The effect of lipophili-
city on the antibacterial activity ofsome 1-benzylbenzimidazole derivatives ............. 967

1256 JOURNAL OF THE SERBIAN CHEMICAL SOCIETY
Inorganic Chemstry D. Gingasu, I. Mindru, L. Patron and S. Stoleriu: Synthesis of lithium ferrites from poly-
metallic carboxylates .................................................................................................. 979
Theoretical Chemistry J. Đurđević, S. Radenković and I. Gutman: The Hall rule in fluoranthene-type benzenoid
hydrocarbons............................................................................................................... 989
Physical Chemistry L. Saad and M. Riad: Characterization of various zinc oxide catalysts and their activity in
the dehydration–dehydrogenation of isobutanol ......................................................... 997 J. B. Ghasemi, F. Shiri, T. G. Deligeorgiev and M. Kubista: Thermodynamic characterization
of the dimerization equilibrium of newly synthesized polymethine cyanine dyes ............ 1011
NUMBER 11 Organic Chemistry and Biochemistry I. M. Opsenica, K. K. Smith, L. Gerena, S. Gaica and B. A. Šolaja: Ribofuranose as a car-
rier of tetraoxane and 4-aminoquinoline antimalarial pharmacophores ...................... 1021 S. Đekić, S. Milosavljević, V. Vajs, S. Jović, A. Petrović, N. Nikićević, V. Manojlović, V.
Nedović and V. Tešević: Trans- and cis-resveratrol concentration in wines produced in Serbia ...................................................................................................................... 1027
S. Solujić, S. Sukdolak, N. Vuković, N. Nićiforović and S. Stanić: Chemical composition and biological activity of the acetone extract of Ambrosia artemisiifolia L. pollen .......... 1039
D. Cvetković and D. Marković: UV-effects on antioxidant activity of selected carotenoids in the presence of lecithin estimated by DPPH test .................................................... 1051
Inorganic Chemstry N. Raman, S. Syed Ali Fathima and J. Dhaveethu Raja: Designing, synthesis and spectral
characterization of Schiff base transition metal complexes: DNA cleavage and antimicrobial activity studies ...................................................................................... 1063
V. N. Patange, R. K. Pardeshi and B. R. Arbad: Transition metal complexes with oxygen donor ligands: a synthesis, spectral, thermal and antimicrobial study ........................ 1073
Electrochemistry V. V. Panić and B. Ž. Nikolić: Electrocatalytic properties and stability of titanium anodes
activated by the inorganic sol–gel procedure (Authors’ review) ................................ 1083
Analytical Chemistry M. V. Obradović, S. M. Sunarić, S. S. Mitić and D. S. Veselinović: Conductometric and
pH metric investigations of the oxalic acid and NaAsO2 reaction .............................. 1113 Polymers D. Lošić: Microstructured surfaces engineered using biological templates: a facile approach
for the fabrication of superhydrophobic surfaces........................................................ 1123 Book Review I. Juranić: The Periodic Table – Its story and its significance (author: Eric R. Scerri)....... 1137

VOLUME 73: CONTENTS 1257
NUMBER 12 Organic Chemistry and Biochemistry Z. Knežević-Jugović, D. Bezbradica, Ž. Jakovljević, S. Branković-Dimirijević and D. Mijin:
Lipase catalyzed synthesis of flavor esters in non-aqueous media: Optimization of the yield of pentyl 2-methylpropanoate by statistical analysis.................................... 1139
S. O. Podunavac-Kuzmanović, V. M. Leovac and D. D. Cvetković: Antibacterial activity of cobalt(II) complexes with some benzimidazole derivatives ................................... 1153
N. Jocković, P. B. Andrade, P. Valentão and M. Sabovljević: HPLC–DAD of phenolics in bryophytes Lunularia cruciata, Brachytheciastrum velutinum and Kindbergia praelonga .................................................................................................................... 1161
Inorganic Chemstry M. R. Vegi, P. L. Muddapu, S. R. Tirukkuvalluri and N. R. Gollapalli: Computer augu-
mented modelling studies of Pb(II), Cd(II), Hg(II), Co(II), Ni(II), Cu(II) and Zn(II) complexes of L-glutamic acid in 1,2-propanediol–water mixtures ............................. 1169
Physical Chemstry E. Makrlík, J. Budka, P. Vaňura and P. Selucký: Solvent extraction of Ca2+, Ba2+, Cu2+,
Zn2+, Cd2+, Pb2+, +22UO , Mn2+, Co2+ and Ni2+ into nitrobenzene using strontium di-
carbollylcobaltate and tetra-tert-butyl p-tert-butylcalix[4]arene tetraacetate (Short communication) .......................................................................................................... 1181
Z. Wang and S. Wu: Electronic structures and spectra of conducting anthracene deri-vatives ......................................................................................................................... 1187
Electrochemistry M. D. Obradović, B. M. Babić, A. Kowal, V. V. Panić and S. Lj. Gojković: Electrochemi-
cal properties of mixed WC and Pt-black powders ..................................................... 1197 V. V. Panić, S. I. Stevanović, V. B. Mišković-Stanković, B. Ž. Jovanović and B. Ž. Nikolić:
Photoelectrochemical properties of sol–gel obtained titanium oxide.......................... 1211
Analytical Chemistry Y.-Z. Xu, H.-R. Lin, A.-C. Lua and C. Chen: Determination of dimethoxyphenethylamine
derivatives in urine by deuterium labeled internal standards ...................................... 1223
Chemical Engineering M. N. Roy, L. Sarkar and B. K. Sarkar: Study of solute–solvent interactions of nicotinic
acid and benzoic acid in methanol and its binary solvent systems.............................. 1235 Errata (printed version only) ............................................................................................... 1247 Contents of Volume 73 ....................................................................................................... 1249 Subject index....................................................................................................................... 1259 Author index ....................................................................................................................... 1265


J. Serb. Chem. Soc. 73 (12) 1259–1263 (2008)
Subject index
1,2-Propanediol, 1169 1,3,4-Oxadizoles, 131, 781 1,5-Benzodiazepines, 937 2-(2-chloroethoxy)ethanol, 385 2,2'-Bipyridine, as ligand, 233 2-Octylaminopyridine, as extractant, 435 2-Thiophenecarboxaldehyde, 415 4-Aminoantipyrine, 1063 4-Aminoquinolines, 1021 8-Hydroxyquinoline, 29 12-Molybdophosphoric acid, 199 12-Tungstosilicic acid, 199
α-NiS, oxidation of, 213
Acid rain, 405 Activated titanium anodes, 1083 Agave attenuate, 1123 Alkaline permanganate degradation, 463 Alkylation, 945 Alumina, adsorption onto, 825 Aluminum, pitting corrosion of, 561 Ambrosia artemisiifolia L., 1039 Amides, 945 Aminopeptidase M, 771 Amoxycillin, spectromentric determination
of, 569 Amphetamine, illegally produced, 691 Analgesics, 781 Anode stability, 1083 Anthracene, 1187 Antibacterial activity, 415, 967, 1153 Antifungal activity, 961 Antihaemostatic activity, 261 Anti-inflammatory agents, 87, 781
determination of, 87 Antioxidants, 1051, 531 Anti-TNT-antibodies, 139
Antimicrobial activity, 597, 683, 703, 815, 1039, 1063, 1073, 531
Anti-oxidant activity, 597 Arsenic(III), 1113 Artesovin, 1039 Artificial neural network, 87 Aspartate residues, 393 Aspergillus niger, 157 Attractor, 221 Atrazine, 951 Austempered ductile iron, fracture of, 113
influence of cooling conditions, 113 Aza-derivatives of acenes, 547
B3LYP/6-31G(d) method, 1187 Benzaldehyde, 1063 Benzenoid hydrocarbons, 989 Benzimidazole derivatives, 967, 1153 Benzoic acid, 1235 Benzophenone, derivatives of, 261 N-Benzyloxycarbonyl-S-alanine, 815 Bicyclic molecular graphs, 431 Bile acids, 127 Bioavailability, 1169 Biodiesel, production of, 147
optimization, 147 Biological screening, 727 Biomass carbon, 951 Biomimetic synthesis, 745 Bioremediation, 577 Brachytheciastrum velutinum, 1161 Bryophytes, 1161 Budimka apple, pectin derived from, 157
Calix[4]arene compound, 1181 Candida rugosa lipase, 1139 Carbon nanotubes, 891 Carbon support, 641

1260 VOLUME 73: SUBJECT INDEX
Carbonitrile, 683 Carotenes, 15 Carotenoids, 15, 1051
bleaching rates of, 15 stability of, toward UV-irradiation, 15
Catalase, 609 Cell membrane incubation, lectin induced, 793 Cellular SiC, 745 r-Centroid, 555 Cetraria islandica (L.) Ach., 405 Cd(II) extraction, 341 Chalcones,
cycliyation of, 131 as ligands, 1073
Charge percolation mechanism, 97 Chemical shift, 1187 Chemometrics, 1011 Chlorophylls, bleaching of, 271 Chlorpromazine, 233 Chromium active centers, distribution of, 97 Ciprofloxacin, spectrometric determination
of, 569 13C-NMR chemical shifts, 513 Coating morphology, 1083 Cobalt(II), 1153 Conducting polymer, 1187 Conductometry, 1113 Copper,
determination of trace of, in water, 249 electrodeposition of, 753 honeycomb-like structure of, 753
Corrosion, 221 Cotton chelator, 249 Coulometry, 655 Cretaceous – Paleogene boundary, 453 Crown ethers, synergistic agents in the solvent extraction, 29 Current oscillations, 221 Cyanine dyes, 1011 Cyclam, 761 p-Cymene, 307, 619 Cytotoxic activity, 619
Dehydroacetic acid, 1073 Dehydrogenase, 951 Designer drugs, 1223 Desulfurization, 213
Determination of Al, 673 Deuterium labeling, 1223 Dicinnamoylmethane, 423 Diclofenac sodium, spectrometric
determination of, 569 β-Diketonato ligands, 761 β-Diketones/β-ketoesters, 937 Dimensionally stable electrodes, 661 N,N-Dimethylformamide, 385 Dimethyl sulfoxide + 1,4-dimethylbenzene system, 73
excess properties of, 73 physical properties of, 73 vapor–liquid equilibrium data, 73
Dithiocarbamato ligands, 761 Dodecanedioic acid, 321 Doxycycline hyclate, 665 DPPH test, 1051 Dynamic behavior, 221
Eggshell, 609 Electrocatalytic properties, 1083, 1197 Electrochemical impedance spectroscopy, 1211 π-Electron content of ring, 547 Elution efficiency, 333 Elution profile, 333 Entamoeba histolytica, 7 Essential oil, 283, 299, 307, 703
antibacterial activity of, 299 Esterification, 1139 Ethyl acetate extract, 283 Ethylene polymerization, 97 S,S-Ethylenediamine-N,N’-di-S,S-propionate,
as ligand, 541 Extraction of metals, 1181
from lichen, 405
Fabaceae, 525 Factorial design, 1139 Factorial and orthogonal central composite design methods, 487 FactSage software and database, 499 Far-infrared spectroscopy, 369 Fish Clay, 453 Flame atomic absorption spectrometry, 249 Flavonoids, 525 Flavor esters, 1139

VOLUME 73: SUBJECT INDEX 1261
Flocculation, 825 Fluoranthene, 989 Fluorides of Ge and Si, 555 Formic acid, oxidation of, 1197 Fractal dimension, 805 Franck–Condon factors, 65, 555
Gas phase molecules SbO and SbP, molecular parameters of, 65
General polarization curve equation, 227 Genotoxicity, 1039 Gewald reaction, 683 Glassy carbon, 845 L-Glutamic acid, 1169 Glutaraldehyde, 609 Graph energy, 431 Graphene, 891 Gyration, radius of, 805
Halide extractants, 341 Hall rule, 989 Health risk assessment, 923 Heavy metals, 923 Hieracium pilosella L., extracts of, 531 High performance liquid chromatography, 665,
531 HIV reverse transcriptase, 259 Holography, 561 Hosoya polynomial, 311 Houseleek, 597 Human control serum, 879 Human placenta, 793 Hydrogen intercalation, 1197 Hydrogen–palladium electrode, 871 Hydrotalcites, 321, 835
Ibuprofen, 879 Induced coupled plasma, 609 In–Sb–Pb system, phase eqilibria of, 377 Insulin, growth factor receptors of, 793 In vitro studies, 1153 Iron powder, deposition of, 861 Isatin-3-thiosemicarbazone complexes, 7
anti-amoebic activity, 7 antifungal activity, 7 antimicrobial activity, 7
iso-Butane, oxidation of, 55 iso-Butene, 55
Isobutanol conversion, 997 Itaconic acid, 825
Kinetics, solvent effect on, 735 Keggin structure, 199 Kekulé structures, 989 Kerogen, 453
type III, 463 Kindbergia praelonga, 1161
ω-Lactams, 771 Lanthanides, 479
extraction of, 15 Layered double hydroxides, modification of, 321 Leaching, 585 Lead, 453
extraction of, 585 Lead–silver cake, in metallurgy, 585 Lecithin, 1051 Leuckart synthesis, 691 Lipids, 1051 Lipophilicity, 967 Liquid chromatography, 1027 Liquid–liquid extraction, 435 Lipids, peroxidation of, 781 Lithium ferrite, magnetic properties of, 979 Lotus-effect, 1123 Low-barrier hydrogen bond, 393 Ln-123 superconductors, 479 Lunularia cruciata, 1161
Malaria, 1021 Markaracter tables, 189 Metal complexes, 415, 423, 727, 761, 1063,
1073, 1169 Metal deposition, 227 Methanol, extract, 299
oxidation of, 845, 1197 Methionine, 735 N-Methylpiperazine, 619 MgO, leaching of, 487 Microwave irradiation, 945 Molar volumes, apparent, 1235 Molecular dynamics simulations, 41 Molecular absorption coefficients, 713 Mott–Schottky plot, 351 Microwave irradiation, 131 Mueller-Hinton broth dilution, 1039

1262 VOLUME 73: SUBJECT INDEX
N(1)-(4-substituted phenyl)-3-cyano-4,6-dimethyl-2-pyridones, 513 N-(2-Thienylmethylene)methanamine, 415 Nano-imprinting, 1123 Nb2O5, 351 Nepeta rtanjensis, essential oil of, 961 Neutral saccharides, 157 Nickel(II) amino acid dithiocarbamates, characterization of, 169 Nicotinic acid, 1235 Non-aqueous solvents, 871
O-Donor ligands, 179 Oil refinery, 577 Oil type pollutants, 577 Olefinic linkages, 423 Onobrychis scardica, 525 Organotin(IV) carboxylates, 179 Organotin(IV) complexes, 179 Oxalic acid, 1113 Oxide sols, 661, 1083, 1211 Oxygen reduction reaction, temperature dependence of, 641
Partitioning of π-electrons in rings, 547 Passive film, 351 PbMnTe and PbTeS alloys, vibration properties of, 369 Pectin, degradation of, 157
oligogalacturonic fractions of, 157 enzymatic hydrolysis of, 157
Pentyl 2-methylpropanoate, 1139 Phase stability diagrams, 213 Phenethylamine, 1223 Phenol red, 631 Phenolics, 1161 Phenothiazine drugs, 233 Phenoxyacetic acids, 771 Phenylacetamides, 945 o-Phenylenediamine, 1063 Phillips CrOx/SiO2 catalyst, 97 Photocatalytic degradation, 631 Photodynamic therapy, sensitizers for, 713 Photoelectrochemical activity, 1211 Phosphate, sorption of, 835 Pichia pastoris, 139 pKA, 655
Plasmodium falciparum, 1021 Plasmon – two phonon interaction, 369 Platinum catalyst, 641, 1197
electrochemical deposition of, 845 Pollen, 1039 Polygalacturonase, 157 Polymethine, 1011 Poly(methyl methacrylate), 915 Porous electrodes, 661 Porous ceramics, 745 Porphyrins, asymmetric, 713
Zn(II) complexes of, 713 Porphyrin–Schiff bases, spectral data, 5
synthesis and characterization of, 1 Potential energy function, 555 Potentiometric titration, 87 Preconcentration, 249
of copper, 249 Promethazine, 233 Propylene carbonate, 655 Protein, backbone of, 805 Pseudogley soils, 673 Pyrazole, substituted, 937 Pyrazolines, 131 Pyrazolo[3’,4’:4,5]thieno[2,3-d]pyrimidin-8- -ones, 683
Q-Conjugacy character, 189 Quetiapine, 385 Quinolinium fluorochromate, 735
RAFT plolymerisation, 915 Rare earth elements, 453 Reactive sputtering, 121 Recombinant expression, 139 Redlich–Kister equation, 73 Relative acidity scale, 871 Replica moulding, 1123 Resonance theory, 547 Response surface methodology, 147 Retained austenite, 113 trans/cis-Resveratrol, 1027 r-Centroids, 65 Rhenium, concentration of, 333 Rhizomucor miehei, 147 Ribofuranose, 1021 rRNA, 41

VOLUME 73: SUBJECT INDEX 1263
ligand binding to, 41 small structural motifs in, 41
Ruthenium(II) complexes, 619 Ruthenium(III) complexes, 541 Rutherford backscattering spectrometry, 121 Rydberg–Klein–Rees potential, 555
Satureja horvatii, 703 Schiff bases, 415, 423, 1063
condensation of, 1 Self-assembled monolayers, 1123 Semicarbazone, 727 Semimagnetic semiconductors, 369 Sempervivum marmoreum L., 597 Serine proteases, 393 Shinsaku Fujita, 189 Silica (SiO2), 97, 121
thin films, deposition of, 121 Silver, extraction of, 585 Smectite, acid activation of, 487 Soil,
pollution by oil, 577 pollution, in Belgrade, 923 chernozem, 951
Sol–gel synthesis, 479, 661, 1211 Solute–solvent interactions, 1235 Speciation, chemical, 1169 Stability constants, 1181 Statistical analysis, 1139 Statistical scaling laws, 805 Stevia rebaudiana Bertoni, leaf extracts of, 283 Succinate media, 435 Supercapacitors, 661 Superhydrophobic surfaces, 1123 Surface morphology, 845, 861 Surfactants, 321 Suspension, 825 Sydnones, 131 Synergistic extraction, 29
Tetra-amine platinum(II), 189 Tetrabutylammonium bromide, 385
Tetraoxanes, 1021 Teucrium montanum, 299 Thallium(III), 435 Thermodynamic calculations, 499 Thermogravimetry, 915, 979 Thiazepine, preparation of, 385 Thiocyanate, sorption of, 835 Thiosemicarbazone, 727
K3-, 619 Thioureide, 169 Thymol, 307 Thymus vulgaris, 307 Ti–Al–Mn ternary system, 499 Titanium oxide, 1211 p-Toluenesulfonic acid, 937 Total π-electron energy, 431, 989 Trimipramine, 233 Triphenylphosphine, as ligand, 169 Trypsin, 393 Tungsten carbide, 1197 Tyrolean shale, 463
Ulcerogenics, 781 Urine, 1223 UV-light, 1051, 1211
Vibrational transition probabilities, 65 Viscosity, B-coefficients, 1235 V–Mo–O mixed oxide catalysts, 55
catalytic activity of, 55 characterisation of, 55
Xanthophylls, 15
Ziegler–Natta polymerizations, 97 Zigzag polyhex nanotorus, 311 Zinc, 221, 453, 585 Zinc oxide, 997
Water–nitrobenzene system, 1181 Wentzel–Kramer–Brillouin method, 555 Wiener index, 311 Wine, 1027


J. Serb. Chem. Soc. 73 (12) 1265–1269 (2008)
1265
Author index
Abramović, B. F., 283 Ahmad, F. J., 781 Ahuja, P., 781 Ajmal, M., 781 Aktaş, A. H., 87 Ali, S., 179 Al-Kholy, M., 569 Alptekin, Ö., 609 Alshtewi, M. A. M., 619 Amblès, A., 463 Ameta, R., 631 Amiryan, H., 233 Anbarasan, R., 321 Andersen, J. E. T., 507 Andrade, P. B., 1161 Anđelković, K. K., 815 Antić, M., 577 Antić Stanković, J., 703 Anuse, M. A., 435 Arbad, B. R., 1073 Ardakani, M. M., 233 Arsić, B. B., 665, 879 Atanassova, M., 29 Avramović, M., 915 Babić, B. M., 641, 745, 1197 Babić-Samardžija, K., 761 Bajc, S., 463 Bajuk–Bogdanović, D., 197 Banović Stević, S., 691 Barna, D. J., 967 Behjatmanesh–Ardakani, R., 233 Benešová, M., 771 Bezbradica, D., 147, 1139 Bhadregowda, D. G., 131 Bhuvaneshwari, D. S., 735 Bibić, N., 121
Boscencu, R., 713 Bošković, S., 745 Boyanov, B., 213 Branković, G., 753 Branković-Dimirijević, S., 1139 Budka, J., 1181 Bulajić, M., 97 Bulgariu, D., 341 Bulgariu, L., 341 Chandra, S., 727 Chen, C., 1223 Chen, S., 561 Chiriac, A., 805 Ciocirlan, O., 73 Cocheci, L., 835 Cortés, R. D. B., 915 Crisan, F., 221 Cvetković, D., 15, 1051 Cvetković, D. D., 967, 1153 Cvetković, O., 463 Čakmak, D., 673 Čerović, Lj. S., 825 Čučulović, A.A., 405 Danish, M., 179 Deligeorgiev, T. G., 1011 Devečerski, A., 745 Dočkal, M., 771 Dodiya, D. K., 683 Djordjević, M. G., 453 Đarmati, Z. A., 283 Đekić, S., 1027 Đurasović, N., 97

VOLUME 72: AUTHOR INDEX 1266
Đurđević, J., 547, 989 Džudović, R. M., 655, 871 Egelja, A., 745 El-Abadla, N. S., 569 Elango, K. P., 735 Elezović, N. R., 641 Eliasi, M., 311 Emons, H., 507 Ertokuş, G. P., 87 Farsa, O., 771 Fathima, S. S. A., 1063 Feng, M., 249 Feng, Y., 1 Ferreira, L. F. V., 713 Furtula, B., 431 Gaica, S., 1021 Gašić, S., 951 Geetha, N., 169 Gerena, L., 1021 Ghariani, R. H. A., 923 Ghasemi, J. B., 1011 Gingasu, D., 979 Glodjović, V. V., 541 Godoy, R. L. O., 307 Gođevac, D., 525 Gojković, S. Lj., 641, 1197 Gollapalli, N. R., 1169 Gómez-Ruiz, S., 619 Gong, R., 249 Goryany, V., 113 Grgur, B. N., 227 Grgurić-Šipka, S., 619 Grubišić, D., 961 Gržetić, I., 923 Gulicovski, J., 745, 825 Gutman, I., 431, 547, 989 Hanif, M., 179 Helles, R. S., 569 Hofmann, E., 113 Holclajtner–Antunović, I., 197 Hou, X., 561
Husain, A., 781 Hussain, M., 179 Ilić, M., 577 Im, S. S., 321 Issa, M. M., 569 Isvoran A., 805 Iulian, O., 73 Jakovljević, M., 673 Jakovljević, Ž., 1139 Jakšić, LJ. N., 655, 871 Jarsania, S. H., 683 Jasaitis, D., 479 Jeremić, D., 619 Jocković, N., 1161 Joshi, Y. C., 937 Jovančićević, B., 577 Jovanović, B. Ž., 513, 1211 Jovanović, V. M., 761, 845 Jović, B. M., 351, 861 Jović, S., 1027 Jović, V. D., 351 Juranić, I., 1137 Juranić, N. O., 815 Juranić, Z., 619 Juskenas, R., 479 Kalagasidis-Krušić, M. T., 915 Kanagaprabha, S., 555 Kaluđerović, G. N., 619 Kamble, R. R., 131, 261 Kandrač, J., 393 Kareiva, A., 479 Karimi, M. A., 233 Karlberg, B., 507 Katsikas, L., 915 Knežević(-Jugović), Z., 147, 1139 Konstantinović, S. S., 7 Kostić, D. A., 665 Kostov, A. I., 499 Kováčiková, J., 771 Kowal, A., 845, 1197 Krishnankutty, K., 423 Krstajić, N. V., 641 Kubista, M., 1011

VOLUME 73: AUTHOR INDEX 1267
Kumar, A., 385 Kumar, R., 937 Lakušić, B., 703 Lazić, M. L., 597 Lee, W., 321 Leovac, V. M., 1153 Leskovac, V., 393 Li, L., 561 Li, Y., 1 Limoge, Y., 121 Lin, H.-R., 1223 Liu, X., 249 Lodha, S., 631 Lošić, D., 1123 Lua, A.-C., 1223 Lukić, D. M., 333 Ljajević Grbić, M., 961 Mahale, G. D., 385 Mahamuni, S. V., 435 Makrlík, E., 1181 Maksimović, V. M., 861 Manasijević, D., 377 Manojlović, V., 1027 Marcu, I.–C., 55 Marinković, A. D., 513 Marinković, S. N., 891 Marković, D., 15, 271, 1051 Marković, I. S., 283 Masnikosa, R., 793 Matović, B., 745 Mauk, P. J., 113 Mihajlović, I., 213 Mijin, D. Ž., 513, 945, 1139 Milenković, M., 703 Milentijević, R., 547 Miletić, G. Ž., 665, 879 Miljanić, Š. S., 405 Miljković, M., 745 Milonjić, S. K., 333, 825 Milosavljević, S., 525, 1027 Milošević, T., 299 Milovanović, M., 915 Mindru, I., 979
Minić, D., 377, 845 Mioč, U. B., 197 Miodragović, Đ. U., 815 Miodragović, Z. M., 815 Mišić, D., 961 Mišković-Stanković, V. B., 1211 Mitić, D. M., 815 Mitić, S. S., 665, 879, 1113 Mitran, G., 55 Mitrašinović, P. M., 41 Moghani, A., 189 Mojović, LJ., 157 Mrvić, V., 673 Muddapu, P. L., 1169 Nasković-Ðokić, D. Č., 665 Nedić, O., 793 Nedović, V., 1027 Nejem, R. M., 569 Nevešćanin, M., 691 Nezhad, M. R. H., 233 Nićiforović, N., 1039 Nikićević, N., 1027 Nikiforov, V. N., 369 Nikolić, A. J., 793 Nikolić, B. Ž., 1083, 1211 Nikolić, Lj. B., 531 Nikolić, M. V., 157 Nikolić, N. D., 753 Nikolić, V. D., 531 Novaković, M., 577 Novaković, T., 487 Obradović, M. D., 1197 Obradović, M. V., 1113 Ognjanović, N., 147 Oliveira, A. S., 713 Opsenica, I. M., 1021 Ostrovskii, N., 97 Palanichamy, R. R., 555 Panić, V. V., 661, 1083, 1197, 1211 Pardeshi, R. K., 1073 Patange, V. N., 1073 Patron, L., 979

VOLUME 72: AUTHOR INDEX 1268
Pavlović, A. N., 879 Pavlović, M. S., 405, 453 Pavlović, Lj. J., 753, 861 Pavlović, M. G., 753, 861 Pejin, B., 525 Peričin, D., 393 Petrović, A., 1027 Petrović, S., 487, 691 Petrović, S. D., 945 Pilić, B., 97 Pitulice L., 805 Pleniceanu, M., 415 Pode, R., 835 Pode, V., 835 Podunavac-Kuzmanović, S. O., 967, 1153 Popov, K. I., 227, 753 Popovici, E., 835 Popović, I. G., 825, 915 Popović, M., 393 Popsavin, V., 127 Porte, A., 307 Praščević, M., 945 Premović, P. I., 453 Punjabi, P. B., 631 Radenković, S., 431, 989 Radivojević, Lj., 951 Radovanović, B. C., 7 Radović, I., 121 Radulović, M. Đ., 815 Raja, J. D., 1063 Raja, V., 65 Rajamanickam, N., 65 Rajković, M. B., 585 Rakić, A., 41 Ramachandran, P. S., 65 Raman, N., 1063 Ramaswamy, A. V., 385 Rašić, I. D., 665 Reisz, E., 835 Riad, M., 997 Ristić, M., 703, 961 Romčević, M., 369 Romčević, N., 369 Roy, M. N., 1235 Rožić, Lj., 487
Saad, L., 997 Sabo, T. J., 619 Sabovljević, M., 1161 Saheed, R. M., 577 Saleh, A. A., 569 Salló, E., 221 Sandulescu, I., 55 Sarkar, B. K., 1235 Sarkar, L., 1235 Sathiyabama, V., 555 Sayudevi, P., 423 Schwarzbauer, J., 577 Seftel, E. M., 835 Selskis, A., 479 Selucký, P., 1181 Serruys, Y., 121 Shah, V. H., 683 Shashikanth, S., 261 Shiri, F., 1011 Simonović, B., 139 Simonović, M., 139 Singh, D., 385 Sladić, D. M., 815 Slavkovska, V., 703 Smith, K. K., 1021 Socoteanu, R., 713 Soković, M., 961 Solujić, S., 299, 1039 Sovilj, S. P., 7, 761 Spînu, C., 415 Stanić, S., 1039 Stanisavljević, I. T., 597 Stanković, M. N., 453 Stanković, M. Ž., 531 Stanković, S., 547 Stanković, Z., 377 Stanković-Kalezić, R., 951 Stanojević, D. D., 585 Stanojević, Lj. P., 531 Stanojević, S., 7 Stešević, D., 525 Stevanović, D., 673 Stevanović, S., 845, 1211 Stoiljković, D., 97 Stojičević, S. S., 597 Stoleriu, S., 979

VOLUME 73: AUTHOR INDEX 1269
Stupar, M., 961 Sudha, B. S., 131, 261 Sukdolak, S., 299, 1039 Sunarić, S. M., 1113 Šantrić, Lj., 951 Šavikin, K., 525 Šolaja, B. A., 1021 Štrbac, N., 211, 377 Taeri, B., 311 Tešević, V., 1027 Thirumaran, S., 169 Tigae, C., 415 Tirukkuvalluri, S. R., 1169 Todorović, M., 197 Tomić, M. A., 585 Tošković, D. V., 585 Trajić, J., 369 Trifunović, S. R., 541 Tripković, A., 845 Tripković, D., 845 Trivedi, A. R., 683 Trivić, S., 393 Tükel, S. S., 609 Tyagi, M., 727 Ummathur, M. B., 423 Ušćumlić, G. G., 513 Vaghasia, S. J., 683 Vajs, V., 525, 691, 1027 Valentão, P., 1161 Valentić, N. V., 513 Vaňura, P., 1181 Vaya, D., 631 Vegi, M. R., 1169 Veličković, D. T., 597 Veljković, V. B., 597
Veselinović, D. S., 405, 1113 Vitorović, D., 463 Vitnik, Ž. J., 815 Vračar, LJ. M., 641 Vrvić, M. M., 139, 577 Vučina, J. L., 333 Vukojević, J., 961 Vuković, N., 299, 1039 Wadgaonkar, P. P., 435 Waghmode, S. B., 385 Wang, C., 561 Wang, L., 1 Wang, Z., 1187 Wu, S., 1187 Xu, Y.-Z., 1223 Xue, J., 1 Yang, X., 561 Yildirim, D., 609 Yuzhakova, T., 55 Zakrzewska, J., 197 Zalga, A., 479 Zaman, M., 179 Zdravković, M., 673 Zdunić, G., 525 Zhang, D., 249 Zhong, K., 249 Zlatanović–Milošević, S., 139 Zvezdanović, J., 271 Živanović, V. V., 879 Živković, D., 211, 377 Živković, D. T., 499 Živković, P. M., 227 Živković, Ž., 213 Žižak, Ž., 619
End of Volume 73.