
jr_ok_detailed_analysis_10_17_11
40
Council of State Governments Justice Center | 1 Justice Reinvestment in Oklahoma Detailed Analysis October 17, 2011 Council of State Governments Justice Center Marshall Clement, Project Director Anne Bettesworth, Policy Analyst Jessy Tyler, Senior Research Associate Robert Coombs, Senior Policy Analyst
-
Upload
csg-justice-center -
Category
Documents
-
view
217 -
download
2
description
Â
Transcript of jr_ok_detailed_analysis_10_17_11

Council of State Governments Justice Center | 1
Justice Reinvestment
in Oklahoma
Detailed Analysis
October 17, 2011
Council of State Governments Justice Center
Marshall Clement, Project Director
Anne Bettesworth, Policy Analyst
Jessy Tyler, Senior Research Associate
Robert Coombs, Senior Policy Analyst

Funders and Partners
Council of State Governments Justice Center | 2

October-January
Oklahoma Justice Reinvestment Process
3
Collect & examine
quantitative data
Reported crime &
arrests
Court dispositions &
sentencing
DA supervision
Probation and parole
supervision
Prison admissions,
population & releases
Develop & present a
comprehensive analysis
of the state’s criminal
justice system
Develop a framework of
policy options that
together would increase
public safety and
reduce/avert taxpayer
spending
June-October
July-October
Engage stakeholders
Law enforcement
Judges
Prosecutors
Defense bar
Victim
advocates/survivors
County officials
Supervision agencies
Behavioral health &
treatment providers
Analyze Data & Develop Policy Options

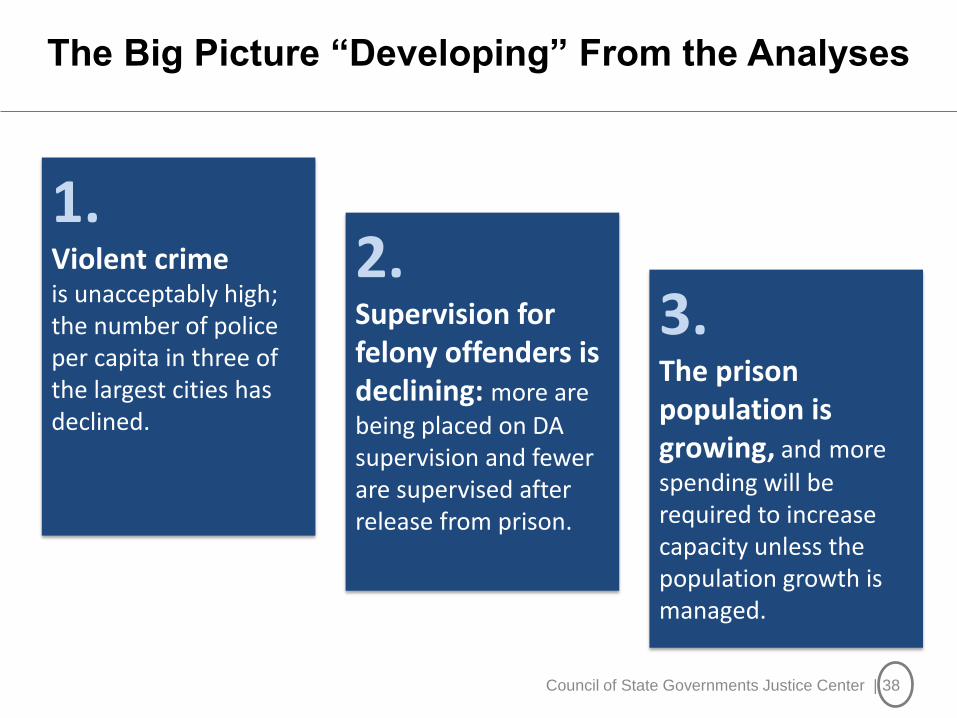
The Big Picture “Developing” From the Analyses
Council of State Governments Justice Center | 4
1. Violent crime is unacceptably high; the number of police per capita in three of the largest cities has declined.
2. Supervision for felony offenders is declining: more are
being placed on DA supervision and fewer are supervised after release from prison.
3. The prison population is growing, and more
spending will be required to increase capacity unless the population growth is managed.

Violent Index Crimes Reported to Police in OK
Remained High; Arrests Dropped
Council of State Governments Justice Center | 5
-
5,000
10,000
15,000
20,000
25,000
2000 2001 2002 2003 2004 2005 2006 2007 2008 2009 2010
5% increase in violent crimes from 2000 to
2010
Violent crime arrests dropped 5% from 2000-
2010
Violent Crime Rate Change, 2000-2010
Oklahoma: -4% (498 to 480) Nationally: -20% (507 to 404)
Source: United States Department of Justice, Federal Bureau of Investigation. (September
2011). Crime in the United States, 2000-2010. From http://www.fbi.gov/about-
us/cjis/ucr/crime-in-the-u.s/2010/crime-in-the-u.s.-2010.

Robbery Rate Increased Significantly Since 2000;
Drop in Murder Rate is Far Outpaced by US
Council of State Governments Justice Center | 6 Source: United States Department of Justice, Federal Bureau of Investigation. (September
2011). Crime in the United States, 2000-2010. From http://www.fbi.gov/about-
us/cjis/ucr/crime-in-the-u.s/2010/crime-in-the-u.s.-2010.
0
2,000
4,000
6,000
8,000
10,000
12,000
14,000
16,000
18,000
20,000
2000 2001 2002 2003 2004 2005 2006 2007 2008 2009 2010
Robbery rate:
OK: +15% US: -18%
Murder rate:
OK: -2% US: -13%
Aggravated Assault
Robbery
Forcible Rape
Murder

Violent Crime Trends in Select Cities, by Type
Council of State Governments Justice Center | 7
Oklahoma City and Tulsa account for 56% of murders in
the state of Oklahoma.
Robberies increased significantly in Tulsa.
Violent Crime increased in Enid, Lawton, and OKC despite
a slight statewide drop.
Enid Lawton Norman Oklahoma
City Tulsa
2000 2010 +/- 2000 2010 +/- 2000 2010 +/- 2000 2010 +/- 2000 2010 +/-
Murder 0 2 -- 3 3 0% 0 2 --- 38 54 42% 33 54 64%
Forcible Rape
24 28 17% 55 60 9% 66 47 -29% 388 340 -12% 242 252 4%
Robbery 27 25 -7% 119 113 -5% 38 36 -5% 990 1,112 12% 737 1,381 87%
Aggravated Assault
165 171 4% 365 665 79% 105 53 -50% 2,535 3,798 50% 3,399 2,617 -23%
Violent Crime Total
216 226 5% 542 831 53% 209 138 -34% 3,951 5,304 34% 4,411 4,304 -2%
Source: United States Department of Justice, Federal Bureau of Investigation. (September
2011). Crime in the United States, 2000-2010. From http://www.fbi.gov/about-
us/cjis/ucr/crime-in-the-u.s/2010/crime-in-the-u.s.-2010.
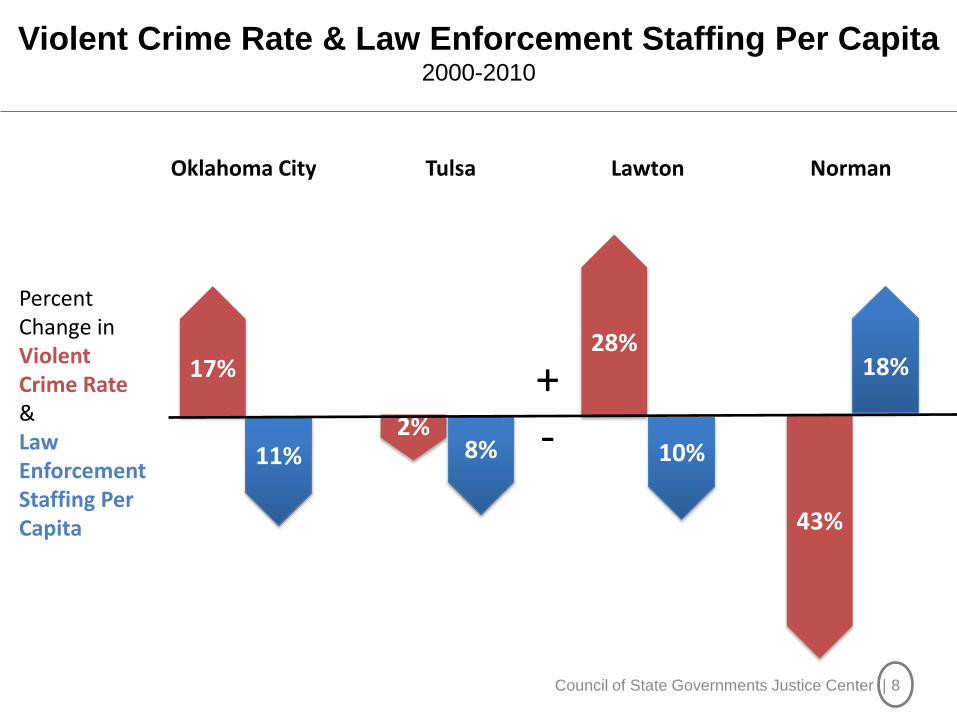
Violent Crime Rate & Law Enforcement Staffing Per Capita 2000-2010
Council of State Governments Justice Center | 8
17%
11%
Oklahoma City Tulsa Lawton Norman
Percent Change in Violent Crime Rate & Law Enforcement Staffing Per Capita
2% 8%
28%
10%
43%
18% + -

Summary: Violent Crime
• Violent index crime remains unacceptably high statewide.
• The number of robberies per capita has increased 15 percent statewide.
• The number of violent index crimes increased while the number of arrests decreased.
• The number of law enforcement officers per capita has declined in Oklahoma City, Tulsa, and Lawton.
Council of State Governments Justice Center | 9

The Big Picture “Developing” From the Analyses
Council of State Governments Justice Center | 10
1. Violent crime is unacceptably high; the number of police per capita in three of the largest cities has declined.
2. Supervision for felony offenders is declining: more are
being placed on DA supervision and fewer are supervised after release from prison.
3. The prison population is growing, and more
spending will be required to increase capacity unless the population growth is managed.

DA Supervision is Replacing Regular Probation as
the Most Common Form of Supervision for Felons
Council of State Governments Justice Center | 11 Administrative Office of the Courts, Oklahoma County Court Records, FY2008-FY2011.
229
2,063 1,947
566
0
500
1,000
1,500
2,000
2,500
3,000
2008 2009 2010 2011
DA Supervision Probation (DOC & Private)
Oklahoma County Court Felony Deferrals and Convictions
-70%
+800%

229
+801% 1,947
-71% 206 +9% 533 -5%
1,602
+8%
0
1000
2000
3000
4000
5000
6000
2008 2009 2010 2011
Prison
Jail
Com. Sent.
Probation (DOC& Private)
DA Supervision
DA Supervision Even Appears to be Reducing Some
of the Population Going to Prison or Jail
AOC, Oklahoma County Court Records, FY2008-FY2011.
Oklahoma County Court Felony Deferrals and Convictions +16% overall
Council of State Governments Justice Center | 12

Prison 33%
Jail 10%
Supervision (Private, DOC, Community
Sentencing) 18%
DA Supervision 39%
In Oklahoma County, More Felons Are Now Sentenced to
DA Supervision than to Prison (FY2011)
AOC, Oklahoma County Court Records, FY2008-FY2011.
Council of State Governments Justice Center | 13

Felony 1,042
Misdemeanor 1,755
0
200
400
600
800
1,000
1,200
1,400
1,600
1,800
2,000
CY2007 CY2008 CY2009 CY2010
Top Four Felony Offenses Sentenced to DA Supervision 254 Drug Possession 79 Larceny (from retailer) 52 Uttering Forged Instrument 41 Burglary (second degree)
DA Supervision Placements in Tulsa County Have Increased
Dramatically for Both Misdemeanor and Felony Offenders
Tulsa County DA Probation Intakes 2007-2010 Council of State Governments Justice Center | 14

DA Supervision Termination Outcomes in
Tulsa County
Council of State Governments Justice Center | 15 Tulsa County DA Probation Intakes and Exits 2007-2010
Terminations by Calendar Year
2008 2009 2010
Completed 21 780 999
Failed 17 280 549
N/A 1 10 48
Total 39 1,070 1,586
% Failed 44% 26% 35%
34% Average Failure Rate

After Prison, More and More People
Are Being Released Unsupervised
Council of State Governments Justice Center | 16 Source: Oklahoma Department of Corrections, Evaluation and Analysis. (2011). The State
of Corrections in Oklahoma: Fiscal Year, 2010
http://www.doc.state.ok.us/newsroom/annuals/2010/annualreport2010.pdf.
3,396
3,060
1,655
4,352
3,440
761
-
500
1,000
1,500
2,000
2,500
3,000
3,500
4,000
4,500
5,000
No Supervision Probation Parole
2005 2010
The number of
offenders released
to parole
dropped in half
51% released
unsupervised in
2010

Current Law Hinders Supervision After Prison
For Higher Risk Offenders
Council of State Governments Justice Center | 17
1st Felony Conviction 3rd or Subsequent Felony Conviction
Post-Prison Suspended Sentence Allowed
Post-Prison Suspended Sentence Prohibited Unless Permitted By
District Attorney
Unintended Consequence: Offenders with criminal histories that suggest a higher likelihood of reoffending are much less likely to be on supervision after prison

What is Re-Arrest Recidivism?
Council of State Governments Justice Center | 18
100 Offenders Released from
Oklahoma DOC Facilities in FY2007
53 Offenders Rearrested
53% Rate of re-arrest recidivism if 53 of
100 are re-arrested within 36 months of discharge
FY2008 Arrest
FY2008 Without Arrest
FY2009 Arrest
FY2009 Without Arrest
FY2010 Arrest
Track arrests in year 2
Track arrests in year 1
Track arrests in year 3
A person cannot be counted multiple times: 1. First arrest for a non-traffic offense within 36
months removes an offender from the pool of “releases” to “re-arrest recidivists”.
2. The number of arrests do not matter; it is the first arrest that bifurcates the population.

Re-Arrests Within 36 Months of Release
Council of State Governments Justice Center | 19 OKDOC and OSBI raw data files of 2007 Prison Releases
7,693 Unique Releases from DOC Facilities during FY2007
3,606 Offenders Not Re-Arrested in 36 Months
4,087 Offenders Re-Arrested
1,999
Year 1
1,298
Year 2
790
Year 3
53% Arrested within 3 years of release
47% Not arrested within 3 years of release
Re-Arrest Rate of Unsupervised Releases
Council of State Governments Justice Center | 20 OSBI Arrest Data for OKDOC 2007 Release Cohort.
3,677
Released
Unsupervised in 2007
53% Re-Arrested
within 3 years
47%
Not Re-Arrested
within 3 years
1,953 Re-arrested within
36 months of discharge

Individuals Released from Prison with High Risk
Assessment Scores Were More Likely to be Re-Arrested
Council of State Governments Justice Center | 21 OKDOC and OSBI raw data files of 2007 Prison Releases
43%
Low Risk Re-Arrest
Rate
52%
Moderate Risk Re-Arrest Rate
62%
High Risk Re-Arrest Rate
Three Year Re-Arrest Rate by Risk Categories as Defined by the LSI-R

Summary: People Under Supervision
Council of State Governments Justice Center | 22
• In Oklahoma County, DA supervision is becoming the dominant felony disposition.
• DA supervision may be insufficient for offenders assessed as high or medium risk on the LSI-R or other risk assessment.
• More and more offenders are being released from prison unsupervised; current law encourages that trend.
• 53 percent of offenders released are re-arrested for a non-traffic/ticket offense within three years.
• The LSI-R is predictive of the likelihood of re-arrest.

The Big Picture “Developing” From the Analyses
Council of State Governments Justice Center | 23
1. Violent crime is unacceptably high; the number of police per capita in three of the largest cities has declined.
2. Supervision for felony offenders is declining: more are
being placed on DA supervision and fewer are supervised after release from prison.
3. The prison population is growing, and more
spending will be required to increase capacity unless the population growth is managed.

26,692
0
5,000
10,000
15,000
20,000
25,000
30,000
Prison Population Prison & Jail Backlog
Oklahoma’s Prison Population is Growing
Council of State Governments Justice Center | 24 OK: OKDOC Annual Reports 2009 and 2010
National: Sourcebook of criminal justice statistics
1996 - 2010: +34% 2000 - 2010: +15%
1,323 offenders were backlogged in jail
?

Two Key Questions from the Last Meeting
• Is the prison population projected to increase?
• Do Oklahoma’s “non-violent” offenders have
arrests for violent crimes or lengthy criminal
histories?
Council of State Governments Justice Center | 25

FY Total
Admissions New
Receptions Probation (new charge)
Probation Revocation Parole
Violators Not
Specified (w/o new charge)
2005 8,730 6,057 1,066 1,106 494 0
2006 8,423 5,708 1,016 1,182 473 41
2007 8,903 6,141 1,171 1,061 367 156
2008 8,763 6,054 1,066 1,103 273 260
2009 8,707 6,076 1,116 1,137 182 184
2010 9,373 6,614 1,148 1,204 198 206
2011 8,354 5,866 1,040 1,071 127 246
% -4% -3% -2% -3% -74%
Analysis of Change in Admissions: Fairly Stable
OKDOC, FY05-FY11 Admissions
*85% New Sentences include new receptions, probation revocations, Interstate, and not
specified.
FY 85% New
Sentences*
Non-85% New Sentences
2005 826 7,403 2006 727 7,179
2007 872 7,501 2008 871 7,352
2009 894 7,435 2010 979 7,987
2011 846 7,131 % 2% -4%
Council of State Governments Justice Center | 26

Analysis of Length of Stay in Years:
85% Offenders LOS Increasing as Expected
OKDOC, FY05-FY11 Releases
FY All Releases New Receptions
Probation (new charge)
Probation Revocations
(w/o new charge)
Parole Violators
2005 2.8 2.4 2.1 1.7 3.7
2006 2.9 2.3 2.2 1.9 3.3
2007 2.9 2.6 2.4 1.9 3.2 2008 3.0 2.7 2.5 1.9 3.6
2009 3.1 2.7 2.6 1.9 4.3 2010 3.2 2.8 2.8 1.9 3.8
% 14% 17% 33% 12% 3%
85% New Sentences
Non-85% New Sentences
2005 2.6 2.4
2006 3.1 2.3 2007 3.7 2.6 2008 3.7 2.7
2009 3.9 2.7 2010 4.4 2.8
% +69% 19%
Council of State Governments Justice Center | 27

What did we plug into the math equation?
1%
Average Annual Increase
2012-2021 2005-2011
1%
Average Annual Increase
Admissions Of 85% Offenders
Length of Stay of 85% Offenders
Used actual length of stay by cohort calculated with 2005-2010 exits
It is what it is
Despite a 7% decrease in admissions of non-85% offenders and a 14% percent increase in average length of stay, we assumed the population of
non-85% offenders remains constant at the 2011 level.
Non-85% Population
Council of State Governments Justice Center | 28

The Math Worksheet Using These Numbers
Council of State Governments Justice Center | 29
85% Population at Start of Fiscal
Year
85% Admissions
During Fiscal Year
Modeled Exits During Fiscal
Year
Left During Year from
12/31/2010 On Hand
Population
85% Population
Incarcerated
Non-85% Population
County Jail
Backup
Total Population
85% as Percent of
Total Population
FY2005 2,560 + 21,285 + 1,166 = 25,011 10%
FY2006 3,094 + 21,223 + 1,536 = 25,853 12%
FY2007 3,669 + 21,313 + 1,181 = 26,163 14%
FY2008 4,205 + 21,139 + 1,323 = 26,667 16%
FY2009 4,643 + 20,570 + 1,542 = 26,755 17%
FY2010 5,226 + 20,675 + 1,477 = 27,378 19%
FY2011 5,670 + 19,699 + 1,323 = 26,692 21%
FY2012 5,670 + 857 - 2 - 382 = 6,143 + 19,699 + 1,323 = 27,165 23%
FY2013 6,143 + 865 - 51 - 395 = 6,562 + 19,699 + 1,323 = 27,584 24%
FY2014 6,562 + 873 - 184 - 391 = 6,860 + 19,699 + 1,323 = 27,882 25%
FY2015 6,860 + 883 - 229 - 312 = 7,202 + 19,699 + 1,323 = 28,224 26%
FY2016 7,202 + 892 - 290 - 297 = 7,507 + 19,699 + 1,323 = 28,529 26%
FY2017 7,507 + 900 - 367 - 283 = 7,757 + 19,699 + 1,323 = 28,779 27%
FY2018 7,757 + 910 - 406 - 242 = 8,019 + 19,699 + 1,323 = 29,041 28%
FY2019 8,019 + 915 - 445 - 222 = 8,267 + 19,699 + 1,323 = 29,289 28%
FY2020 8,267 + 927 - 466 - 177 = 8,551 + 19,699 + 1,323 = 29,573 29%
FY2021 8,551 + 937 - 555 - 167 = 8,766 + 19,699 + 1,323 = 29,788 29%

Estimate of Growth in Prison Population (Driven by Stacking of the 85% Offenders)
Council of State Governments Justice Center | 30 Oklahoma Department of Corrections, Entry and Exits, FY2005 to FY2011.
FY05 FY06 FY07 FY08 FY09 FY10 FY11 FY12 FY13 FY14 FY15 FY16 FY17 FY18 FY19 FY20 FY21
85% Population 2,560 3,094 3,669 4,205 4,643 5,226 5,670 6,143 6,562 6,860 7,202 7,507 7,757 8,019 8,267 8,551 8,766
Non-85% Population 21,285 21,223 21,313 21,139 20,570 20,675 19,699 19,699 19,699 19,699 19,699 19,699 19,699 19,699 19,699 19,699 19,699
Jail Back-Up 1,166 1,536 1,181 1,323 1,542 1,477 1,323 1,323 1,323 1,323 1,323 1,323 1,323 1,323 1,323 1,323 1,323
0
5,000
10,000
15,000
20,000
25,000
30,000
+3,110 Propagation Model
85% Population
Assumes 1% increase in annual admissions for 85% crimes, but population growth is driven by stacking as offenders serve much longer than they
have historically.
Non-85% Population Assumes the annual population of offenders
incarcerated for non-85% offenses remains constant at 2011 levels.
This is not a projection of the non-85% population, but rather a static estimate. This share of the population may increase or decrease
depending on any change in admissions or length of stay.

Will this really happen?
What could cause the population from increasing less than we estimated?
– A reduction in crime and offenders convicted for 85% offenses
– An increase in plea bargains for 85% offenses down to non-85% offenses
– The non-85% population declines due to decreased admissions or
reduced length of stay
What could cause the population from increasing more than we estimated?
– An increase in offenders convicted for 85% offenses
• More arrests and convictions for current 85% offenses
• Additional types of crimes added to the 85% statute
– An increase in admissions or length of stay for non-85% offenses
Council of State Governments Justice Center | 31

Two Key Questions from Last Meeting
• Is the population projected to increase?
• Do Oklahoma’s “non-violent” offenders have
arrests for violent crimes or lengthy criminal
histories?
Council of State Governments Justice Center | 32
YES

Most People Admitted to Prison in 2010 Had Many Prior
Arrests, But Some Had Relatively Few
Council of State Governments Justice Center | 33 OSBI Arrest Data and Oklahoma Department of Corrections 2010 Reception Data
Oklahoma Statute Defined Violent Crimes
506 1,151 60
Property and Other Public Order Crimes
369 3,149 335
Drug Crimes 423 2,779 306
1-3 4-16 17 or more
Lifetime Arrest Events (including current arrest)
2010 Oklahoma DOC Admissions

Top “Nonviolent” Prison Admissions
(Cumulative FY05-FY10)
Council of State Governments Justice Center | 34 DOC Admissions, FY05-FY10.

Possession Cases Are Around 30% of Court
Dispositions in Oklahoma and Tulsa Counties
Council of State Governments Justice Center | 35 Administrative Office of the Courts: Oklahoma and Tulsa County Court Data
34%
66%
32%
68%
31%
69%
31%
69%
32%
68%
28%
72%
28%
72%
27%
73%
Oklahoma County
Tulsa County
FY 2008 FY 2009 FY 2010 FY 2011

Average Sentences for
Top “Nonviolent” Admissions
Council of State Governments Justice Center | 36
Oklahoma, Department of Corrections, Receptions FY05-FY2010.
5.2 Years Possession
7.3 Years Distribution
4.9 Years Burglary II
3.9 Years DUI
4.7 Years Stolen Property
10 Years Manufacture
10.3 Years Trafficking
4.5 Years Unauthorized Vehicle
4.8 Years Forged Instrument
5.6 Years Convicted Felon Charged with Possession of Firearms
Property Crimes are clustered together with an average sentence length of
4.8 years.

Parole Release Process
Earned Credit System
85% Law
Behavior/Offense Offense
33% 92% 45%
Governing Release System
Determining Factor
Minimum % of Sentence Served
Yes No No Supervision Likely Upon Release
Behavior
Oklahoma’s Sentencing Policy is Evolving
Council of State Governments Justice Center | 37
The Big Picture “Developing” From the Analyses
Council of State Governments Justice Center | 38
1. Violent crime is unacceptably high; the number of police per capita in three of the largest cities has declined.
2. Supervision for felony offenders is declining: more are
being placed on DA supervision and fewer are supervised after release from prison.
3. The prison population is growing, and more
spending will be required to increase capacity unless the population growth is managed.

Upcoming Site Visits
Dates Activity
October 17-19 • Working Group Meeting
• Town Hall Meetings: Enid, Lawton & Muskogee
• Stakeholder Engagement
November 2-3 • Stakeholder Engagement
November 16-17 • Stakeholder Engagement
December 7-8 • Stakeholder Engagement
December 12 • Working Group Meeting
January ? • Working Group Meeting
Council of State Governments Justice Center | 39

Council of State Governments Justice Center | 40
Thank You
Anne Bettesworth Policy Analyst, Justice Reinvestment
This material was prepared for the State of Oklahoma. The presentation was
developed by members of the Council of State Governments Justice Center
staff. Because presentations are not subject to the same rigorous review
process as other printed materials, the statements made reflect the views of
the authors, and should not be considered the official position of the Justice
Center, the members of the Council of State Governments, or the funding
agency supporting the work.


