jpr report trends in the British Jewish community...jpr / report The Institute for Jewish Policy...
49
Key trends in the British Jewish community: A review of data on poverty, the elderly and children Institute for Jewish Policy Research April 2011 jpr / report
Transcript of jpr report trends in the British Jewish community...jpr / report The Institute for Jewish Policy...

Key trends in the British Jewish community:A review of data on poverty, the elderly and children
Institute for Jewish Policy Research April 2011
jpr / report

The Institute for Jewish Policy Research (JPR) is a London-based independent research organization, consultancy and think-tank. It aims to advance the prospects of Jewish communities in Britain and across Europe by conducting research and developing policy in partnership with those best placed to influence Jewish life.
Authors
Dr Sarah Abramson is Research Fellow at JPR. She holds an undergraduate degree in religious studies from Wesleyan University in the United States, a Masters in Gender and Social Policy and a PhD in Sociology, both from the London School of Economics. Alongside her work at JPR, she also serves as Senior Policy Researcher for the Board of Deputies of British Jews.
Dr David Graham is Director of Social and Demographic Research at JPR. He completed his DPhil at the University of Oxford and is the foremost expert in the demography of Jews in Britain. He was previously Senior Research Officer at the Board of Deputies of British Jews. His publications include: Jews in Britain: a snapshot from the 2001 Census (JPR, 2007, with Marlena Schmool and Stanley Waterman), Synagogue membership in the United Kingdom in 2010, JPR/Board of Deputies, 2010, with Daniel Vulkan), and Committed, Concerned and Conciliatory: The attitudes of Jews in Britain towards Israel (JPR, 2010, with Jonathan Boyd).
Jonathan Boyd is Executive Director of JPR. A specialist in the study of contemporary Jewry, he is a former Jerusalem Fellow at the Mandel Institute in Israel, and has held professional positions in research and policy at the JDC International Centre for Community Development, the Jewish Agency for Israel, the United Jewish Israel Appeal and the Holocaust Educational Trust. The editor of The Sovereign and the Situated Self: Jewish Identity and Community in the 21st Century (Profile Books, 2003), his most recent report is Committed, Concerned and Conciliatory: The attitudes of Jews in Britain towards Israel (JPR, 2010, co-authored with David Graham).
JPR is indebted to the Maurice Wohl Charitable Foundation for commissioning and sponsoring this report.

JPR Report April 2011 Key trends in the British Jewish community 1
Contents
Introduction 3
Glossary 4
Summary of existing data 5
Demography and Jewish identity 5
Poverty 5
Jewish education 6
Physical, sensory and learning disabilities 6
The elderly 7
Major conclusions 9
Appendix 1 – Demographic overview: British Jews in the UK 11
Estimating the size of the British Jewish population over time 11
Age profile of British Jews 11
Age profile of the strictly Orthodox 12
Jewish births 12
Jewish deaths 14
Jewish marriages (i.e. marriages between two Jews) 14
Cohabitation and intermarriage 15
Household composition 16
Geography of the Jewish population 16
Jewish identity and practice 16
Synagogue affiliation 17
The Jewish voluntary sector (JVS) 19
Appendix 2 – Caring for Jewish people: poverty 21
Child poverty: an overview 21
Poverty in the strictly Orthodox community 22
Impact of poverty on Jewish children 24
Appendix 3 – Education in the Jewish community 27
A new UK government 27
Jewish education and Jewish day schools 27

2 JPR Report April 2011 Key trends in the British Jewish community
Appendix 4 – Caring for Jewish people: physical, sensory and learning disabilities 31
Physical and sensory disabilities 31
Learning disabilities 32
Appendix 5 – Caring for Jewish people: the elderly 35
The general growth trend among the elderly 35
Health and ageing in the Jewish community 35
Care homes 36
Other forms of care provision 37
The role of volunteers 37
Appendix 6 – Demography and Jewish identity 39
Sociological and societal context 39
Individualism and identity 39
Religion in a (not quite) secular era 39
Opportunities for women and changing family structures 39
Multiculturalism and cohesion 40
Technology 40
Other contemporary issues 40
Bibliography and suggested reading 43
Selection of websites consulted 45

JPR Report April 2011 Key trends in the British Jewish community 3
Introduction
This report, commissioned at the request of, and sponsored by the Maurice Wohl Charitable Foundation, provides an overview of existing reliable demographic data related to three issues within the British Jewish community: poverty (including indigence and distress), the elderly (including care, welfare and support) and children (including care, welfare and support and education). It does not contain any new data; rather, it provides a summary of the most important findings in the research on Jews in Britain related to these three areas. Due to the fact that the themes are broad and often overlapping, this report is structured in such a way as to ensure that each issue is examined individually, although not necessarily independently of other related topics. The report also endeavours to provide a broader British societal context to the central findings presented.
It is structured flexibly to allow the reader access to both an overview of all the data and a more detailed breakdown. The opening section provides a summary of the key data that exist in five major areas: (i) British Jewish demography and Jewish identity (including the current makeup of the British Jewish population and its geography); (ii) poverty and caring in the Jewish community; (iii) education and schooling (with specific reference to the current supply and
demand issues concerning Jewish day school places); (iv) disabilities and related needs; and (v) caring for the elderly. Each of these issues is then explored in greater detail in the appendices at the end for those who wish to examine the data further. We also include an additional appendix (vi) outlining several issues in the wider sociological and societal context which we regard as pertinent to any policy-related discussion on these issues.
It is important to stress that the report is based almost exclusively on existing reliable research already in the public domain. Data collected by organizations where methodology is questionable or unclear are not included. The report should not be regarded as a comprehensive attempt to fully understand the Jewish communal situation in each area, as the development of such an understanding would require investment in the creation and/or analysis of new data. The report does, however, point to areas worthy of further examination and consideration. As the Jewish community considers its research priorities for the future – particularly in reference to the 2011 UK Census data and JPR’s proposed 2011 National Jewish Community Survey – the community’s leadership should be aware that there is scope to learn more about several of its areas of interest via these research channels.

4 JPR Report April 2011 Key trends in the British Jewish community
Glossary
CRU Community Research Unit (Board of Deputies of British Jews)
DCSF Department of Children, Schools and Families
E&W England and Wales
FSM Free School Meals
JCoSS Jewish Community Secondary School
JDS Jewish day school
JPR Institute for Jewish Policy Research
JVS Jewish Voluntary Sector
LAD Local Authority District
ONS Office for National Statistics
Gemach (pl. gemachim): a Jewish free-loan fund
Halacha: Jewish law
Haredi: strictly Orthodox
Kashrut: Jewish dietary laws
Simcha: Jewish celebratory event

JPR Report April 2011 Key trends in the British Jewish community 5
Summary of existing data
Demography, Jewish identity and the Jewish Voluntary Sector (JVS)
• ThesizeofBritain’sJewishpopulationisbetween 290,000 and 300,000 people.
• Jewsaccountforabout0.5%ofthenationalUK population.
• Betweenthemid-1950sand2001Britain’sJewishpopulationcontractedbyabout28%.
• Jewsareolderthanthegeneralpopulation–12.4%ofJewsinBritainareovertheageof75,comparedwith7.5%generally.
• Incontrast,thestrictlyOrthodox(haredi)communityhasaveryyoungprofile;34%of Jews in Hackney are aged 14 and under, comparedwith16%forJewsgenerally.
• TheaveragenumberofJewishbirthseachyear is rising but this is due to the very high birth rates among the strictly Orthodox community–itispossible40%ofallJewishbirths annually are to strictly Orthodox couples, and the growth rate in the haredi communityisestimatedtobe4%perannum.
• ThenumberofJewishdeathsperyearhasbeendeclining since the early 1980s, most likely due to the overall contraction of the community.
• Afterasteepdeclineinthe1970sand1980s,thenumber of Jewish marriages is flattening out.
• 18%ofmarriedJewishmenand14%ofmarried Jewish women have non-Jewish spouses.
• Nearlyaquarter(23%)ofallJewslivesinjusttwo out of the 408 districts in Britain – Barnet (17.5%)andRedbridge(5.5%).
• Welloverhalf(57%)ofJewsinLondon(notincluding the strictly Orthodox) consider themselves to be ‘Secular’ or ‘Somewhat Secular.’Just9%considerthemselvestobe‘Religious’.
• However,overafifth(22%)of‘Secular’Jewsandovertwo-fifths(43%)of‘SomewhatSecular’ Jews in London eat only kosher meat in their homes.
• Between1990and2005synagogueaffiliationoverallfellby18%.Thesharpestdeclinecanbeseen in the Traditional/mainstream Orthodox bodies. By contrast strictly Orthodox (essentially haredi) congregations increased by51%.1
• Howeverthree-quartersofJewishhouseholdsbelong to a synagogue. Of those, a majority (57%)belongstoaTraditional/mainstreamOrthodox synagogue.
• In1997therewereapproximately1,910financially independent organizations in the JVS.
• IncomeoftheJVSwasskewed:thetop4%oforganizationsgenerated70%ofthetotalincome.
• 51%oftotalincomeraisedintheJVScamefromindividuals,comparedwith35%intheUK sector as a whole.
• 44%ofallJVSorganizationsoperatedwithinthe field of education.
• Jewishcharitablegivingisgreateramongthemore Orthodox. If this group contracts – or becomes poorer – the amount of Jewish charitable donations for Jewish causes from individuals may decrease in the long term.
For further details on the issues listed, turn to Appendix 1 on page 11.
Poverty
• LittleinformationisavailableaboutJewishpoverty – data on deprivation from the 2001 Census have only recently been published as part of JPR’s investigation into the topic (Child poverty and deprivation in the British Jewish community, March 2011). The report
1 In the past, it was easier to differentiate clearly between ‘Central Orthodoxy’ and ‘Strict Orthodoxy,’ both of which are terms used widely in reports about Jews in Britain. Whilst the categories remain useful, the distinctions between them have become increasingly blurred in recent times. Nevertheless, one may assume that the term ‘Strictly Orthodox” in this report refers in large measure to haredim.

6 JPR Report April 2011 Key trends in the British Jewish community
does include some quantitative data, but is predominantly based on qualitative input.
• StrictlyOrthodoxJewsaremorelikelytoexperience poverty and deprivation than other ‘mainstream’ Jewish families.
• In2001,JewishhouseholdsinHackney(whichare comprised mainly of haredi Jews) were much more likely to be in socially rented accommodation(35%)thanthegeneralJewishpopulation(9%).
• InHackneyin2001,25%ofJewishfamilieslived in overcrowded conditions compared with 8%ofthegeneralJewishpopulation.
• 62%ofJewishfamiliesinStamfordHillreceivechildbenefitsand18%receiveincomesupport.
• Anestimated31%ofgemachim serving the haredi population in Hackney are specifically dedicated to the provision of baby equipment or services for children. This is second only in priority to gemachim that help offset the costs of weddings and other celebrations (approximately37%ofthetotal).
• Oneofthekeysourcesofdataaboutchildpoverty comes from local authority’s Free School Meals (FSM) figures. These are only available for state schools, thus provide us with little insight about the haredi community. In general terms, however, the official percentage of Jewish pupils eligible for FSM tends to fluctuatewithinthe0-3%range.Nevertheless,there are some notable exceptions: Pardes HouseinFinchleyreported16%eligibilityin2009and15%in2010;JFShoversaroundthe9%mark,andseveralheadteachersofJewishday schools maintain that the figures recorded often underestimate the reality due to concerns about social stigma.
For further detail on the issues listed, turn to Appendix 2 on page 21.
Jewish education
• In2002,87%ofparentsofschool-agedchildren in London believed that their children should receive some sort of formal Jewish education.
• In1950,4,000pupilsattendedfull-timeJewishdayschools;by1975thenumberwas12,800
andby2005-2006thenumberofenrolledJDSpupilswas26,470.Muchofthisgrowthhascome from within the strictly Orthodox sector whichnowaccountsfor48%ofthoseenrolled.
• Over50%ofJewishchildrenaged4to18yearsold now attend a Jewish day school.
• TheCommissiononJewishSchoolsreport(2007)showedthatJewishschoolswerestruggling to fill all of their places, especially those located outside of North-west London.
• Itispossiblethatinthe‘mainstream’primaryschoolJewishsectortherewillbe30%sparecapacity in London by 2016, depending on take-up levels.
• ProjectionsofthenumberofJewishsecondaryschool age pupils in London show that they aresettocontractfrom10,616childrenin2005to8,963by2016–i.e.by16%.However,thenumber of Jewish secondary school places availableiscontinuingtorise(from4,472in2005to6,852in2016).Itisthereforepossiblethat in the mainstream Jewish secondary school sector there could be an oversupply of places by asmuchas50%by2016.
• ParticipationininformalJewisheducationalactivities (youth movements, summer camps, Israel Experience programmes, etc.) is a strong predictor of future adult Jewish belonging.
For further detail on the issues listed, turn to Appendix3onpage27.
Physical, sensory and learning disabilities
• BasedonthedefinitionsusedintheDisabilityDiscriminationAct(1995),anestimated9.8million adults and 800,000 children in the UK have some kind of physical, sensory or learning disability.
• TheDepartmentofHealthestimatesthat1.2 million people in the UK have a mild or moderate learning disability.
• TheDepartmentofHealthestimatesthat145,000adultsand65,000childrenhaveasevere or profound learning disability.
• AnecdotalevidencefromtheJewishcommunitysuggeststhat5,000Jewshavesomekind of learning disability.

JPR Report April 2011 Key trends in the British Jewish community 7
For further details on the issues listed, turn to Appendix 4 on page 31.
The elderly
• Ingeneral,theJewishpopulationisanageingone, and older people are more likely to report ill health.
• Nearly29,240Jewishpeopleaged65andoverreported suffering from a limiting long-term illness (LLTI) in the 2001 Census.
• Olderpeoplearealsomorelikelytobeproviding care for their close relatives: nearlyhalfthe4,185peopleaged75andoverproviding care do so for over twenty hours each week.
• TheaverageageofclientsinJewishVoluntary
Service care homes is 88 years, and almost 90 in London.
• Thereare36Jewishcarehomesintotal,22of which are in the Greater London area. The largest, Nightingale House in Wandsworth, is situated ten miles from Barnet.
• MostJewswouldprefertostayintheirownhomes, if at all possible, rather than move into a care home.
• In2002,therewere21formalJewishday-carecentres for older people catering for over 3,000 Jewish elderly people every week.
• Between1,700and3,000‘meals-on-wheels’aredistributed each week.
For further detail on the issues listed, turn to Appendix5onpage35.


JPR Report April 2011 Key trends in the British Jewish community 9
Major conclusions
1 The data clearly indicate that the haredi population has been growing and the mainstream (non-haredi) Jewish population declining, albeit at different rates. Assuming these trends continue, a case can be made for increased investment in either or both sectors: in the haredi sector due to the likely increased demand for support; in the mainstream sector in order to bolster its vibrancy.
2 Within the haredi sector, it is becoming acutely apparent that poverty and deprivation levels – particularly among children – are disturbingly high and are expected to increase. The issue of how best to address this is becoming an imperative. Whilst the haredi community is remarkably strong in its attempts to ameliorate the effects of poverty, it appears that there is insufficient investment in mechanisms designed to prevent it from occurring in the first place. Vocational training, conducted in the appropriate ways, locations and life stages, is likely to be essential.
3 It is clear that the Jewish population in Britain, like the general population in Britain, is getting older and living longer. The likelihood of a growth in the cases of long-term limiting illnesses, including Alzheimer’s and dementia, is high. The need for a range of types of care provision is likely to increase. Most people want to remain in their own homes, so looking to extend capacity to provide domiciliary care appears to be important. Equally, Jewish care homes are likely to require greater investment in order to maintain the quality of service desired and expected. Given the geographical shift and the location of Nightingale House, emphasis may need to focus on those areas with the densest Jewish populations.
4 Within the mainstream sector, indicators suggest that we will see a continuing decline in levels of affiliation to the Jewish
community, a likely growth in levels of intermarriage, and a contraction of the capacity for charitable giving. However, we also expect to see a continuation of Jewish religious engagement (albeit based in many instances on cultural and familial norms rather than a sense of religious obligation), continuing participation in both Jewish day school education and informal Jewish education, and a growing desire to create innovative initiatives designed to engage Jews in community activities. Identifying and investing in the centres of communal excellence may be wise.
5 Ifdemographictrendscontinueatthepresentrate, which is always an unknown, the haredi community will grow in size and the mainstream community will contract. This prediction points in two different directions in terms of educational policy: investment in the haredi community to support its expected growth, and/or investment in the mainstream community to counter its expected decline. Within each of these broad areas a wide range of policy options exists, including investment in the recruitment, training and retention of teachers, individual and group programmes for students, development of educational curricula and resources, and capital investment in schools and other educational institutions.
6 There is insufficient up-to-date research data in all of the areas covered in this report, particularly poverty and deprivation (especially outside of the haredi community), and physical, sensory and learning disabilities. Most of what does exist is qualitative. Investment in further research – particularly, but not exclusively, quantitative – may help the community’s leadership to clarify where it might best concentrate its efforts, and measure the efficacy of its investments.


JPR Report April 2011 Key trends in the British Jewish community 11
Appendix 1 Demographic overview: British Jews in the UK
The UK 2001 Census was the first to ask a questiononreligionanditrecorded270,499Jews.2 The Census data represent the most comprehensive and valuable data source on Jews ever gathered in this country. The religion data provide information not only on the size of the Jewish population but also its demographic and socio-economic makeup, as well as its geographic distribution and data relating to standards of living, health and care. However, it must be noted that the question on religion in the 2001 Census was voluntary and therefore the data available are likely to be a slight undercount (in the region of 7%accordingtoONS)oftheactualnumberofJewish people in Britain. Assuming Jews were as likely/unlikely to respond as other groups, the adjustedCensusfigureis290,859.3 In addition, the data cannot be compared to any previous census datasets.4
Jewsaccountfor0.5%ofthenationalUKpopulation and constitute the sixth largest ‘religious’groupintheUK.Incomparison,72%ofthepopulationidentifiedasChristian,2.8%asMuslimand1.0%asHindu.
Estimating the size of the British Jewish population over timeAlthough the Census only began to collect data on religion in 2001, the Jewish community has been collecting demographic data for over a hundred years. An analysis of these data shows that Britain’s Jewish population peaked in size in the mid-1950s(atabout410,000people)andhassincecontractedbyabout28%.
2 Strictly speaking, three separate but coordinated censuses were carried out by three organizations, ONS (England & Wales), GRO (Scotland) and NISRA (Northern Ireland).
3 There is also evidence that the haredim were especially undercounted in the Census – perhaps by asmanyas10,000to15,000people.See:GrahamandWaterman,2005.
4 The next UK Census will take place in March 2011 and will also collect data on religion and therefore provide, for the first time, sequential census data on Jews in Britain.
Figure 1. The number of Jews over time, British Jews and London Jews in comparison
Source: Waterman and Kosmin, 1986:6
Figure 1 also shows the total Jewish population in the UK compared with the number of Jews in London. It is clear that approximately two-thirds of Jews in Britain have historically lived in London and continue to do so. The decline since themid-1950sissomewhatdeceptive;whilstthemainstream community appears to be declining at arateofapproximately1.8%perannum,thereisevidence to suggest that the haredi population in Britainisactuallyincreasingatarateofabout4%per annum.5
Age profile of British JewsAccordingtothe2001Census,12.4%ofJewsinBritainareovertheageof75;incontrast,only7.5%ofthegeneralBritishpopulationareover75.In 2001, the median age of British Jewish females was 44 years; for the general British population, the median age of females was 38 years. The median age of British Jewish males was 41, compared with 36 years for males in the general British population. By one estimate there will be 38,000Jewishpeopleagedover75by2011,and7,900ofthesepeoplewillbeover90.Aprecisefigure will be available with the publication of the data from the 2011 Census.6
5 VulkanandGraham2008:166 Valins2002:73
500
450
400
350
300
250
200
150
100
50
0
Po
pu
lati
on
(000
s)
British Jewry London Jewry
1850
1880
1895
1910
1925
1940
1955
1970
1985
2000
1865

12 JPR Report April 2011 Key trends in the British Jewish community
Figure 2 shows the age profile of Britain’s Jews in 2001. The baby boom generation was then in its 50s;thisgenerationwillnowbeinthe60to64cohort. It shows a ‘top heavy’ shape with more elderly people than young people.7 The graph also shows that Jewish women live longer than Jewish men; many more Jewish females live to be 90 or over, as compared with Jewish men.
By contrast, Figure 3 shows the general population (including Jews) and although it is also ‘top heavy’ as is the norm in Western Europe, it is less exaggerated than the Jewish situation.
Both of these graphs will be updated with the publication of the 2011 Census data and it will be possible to see how the overall shape of the Jewish population is changing over time.
7 Thediagramshowsthetypicalshapeofanageing population with relatively large numbers of older people, and relatively small numbers of younger people.
Strictly Orthodox age profileIt should be noted that the older age structure of the Jewish population is not the case among the strictly Orthodox community. Figure 4 shows the graph for Hackney (Stamford Hill), and the shape is completely different, with a very large number of young people and relatively few older people. Hackney is an area of London that is heavily populated with strictly Orthodox Jews. The strictly Orthodox community has a very young profile;34%ofJewsinHackneyareaged14andunder,comparedwith16%forJewsgenerally.
Jewish birthsUsing data on circumcisions, the Community Research Unit (CRU) at the Board of Deputies ofBritishJewsestimatedthatin1997therewere2,742JewishbirthsintheUK.Tenyearslater,in2007,theCRUestimatedtherehadbeen3,314births, a substantial increase.
At first glance, this increase in Jewish births seems to contradict the trend of decline shown in Figure 1. However, many of these births occurred in the strictly Orthodox groups where birth rates are considerably higher than in the rest of the Jewish
5 3 1 1 3 5
0-45-9
10-1415-1920-2425-2930-3435-3940-4445-4950-5455-5960-6465-6970-7475-7980-8485-89
90+
Ag
e
Per Cent
Males
Source: 2001 Census Table S149
Females
Jewish Population, England and Wales (N=259,927)
Figure 2. Age and sex, Jewish population, England & Wales, 2001
Source: Graham et al., 2007:41

JPR Report April 2011 Key trends in the British Jewish community 13
5 3 1 1 3 5
0-45-9
10-1415-1920-2425-2930-3435-3940-4445-4950-5455-5960-6465-6970-7475-7980-8485-89
90+
Per Cent
Males
Source: 2001 Census Table S149
Females
Total Population, England & Wales (N=52,041,916)
Ag
e
Figure 3. Age and sex, general population, England & Wales, 2001
Source: Graham et al., 2007:40
8 6 4 2 0 2 4 6 8
0-4
5-9
10-14
15-19
20-24
25-29
30-34
35-39
40-44
45-49
50-54
55-59
60-64
65-69
70-74
75-79
80-84
85-89
90+
Ag
e
Per Cent
Males
Source: 2001 Census Table S149
Females
Jewish Population, Hackney (N=10,732)
Figure 4. Age and sex, Jewish population, Hackney
Source: Graham et al., 2007:44

14 JPR Report April 2011 Key trends in the British Jewish community
Figure 5. Total number of Jewish births, 1997-2006.8
population. Although establishing the precise proportion of births that are to strictly Orthodox families is not possible with the available data, it is reasonabletoassumethatabout40%ofallJewishbirths each year are haredi. Indeed, although the total number of births is rising overall, there are actually fewer babies being born to the rest of the British Jewish community once the strictly Orthodox are accounted for. This is in line with the UK’s general long-term fertility trends which, even though birth rates have been steadily increasing over the last decade, are still belowFigure 6. Jewish ‘deaths’ 1980-2007.9
8 Number of births are inferred using data on male circumcisions.
9 ‘Deaths’ are inferred from the number of Jewish burials and cremations that take place each year.
‘replacement level’ (around 2.1 children per female).10 This means that the level of fertility in the UK is still having a downward effect on population size in the long-term – recent increases in fertility have simply reduced the size of this downward effect.11
Jewish deathsThe number of Jewish deaths has been steadily decliningsincethelate1970s(seeFigure6),andthis is in line with the contraction of the Jewish population overall. The average annual number ofdeathsthroughoutthe1970swas5,000,butby2007thenumberwasrecordedatunder3,000.This decline is despite the generally older age profile of the Jewish population, and because of the fact that Jewish life expectancy is longer than the national average. The decline is also an indication of Jewish people and their descendants choosing not to have Jewish funerals; these people do not feature in the Board of Deputies’ data.
Jewish marriages (i.e. marriages between two Jews)The number of Jewish marriages per year has remained relatively stable during the period 1998-2007.ThetotalnumberofJewishmarriagesthat
10 For a population to replace itself (in the absence of migration), each woman needs to have around two children.
11 http://www.statistics.gov.uk/cci/nugget.asp?id=369
Source: Graham and Vulkan, 2008:8
Figure 5. Total number of Jewish births, 1997-2006.8
Source: CRU, Board of Deputies
Figure 6. Jewish ‘deaths’ 1980-2007.9
0
500
1,000
1,500
2,000
2,500
3,000
3,500
4,000
1997 1998 1999 2000 2001 2002 2003 2004 2005 2006
Tota
l Jew
ish
'bir
ths'
0
1,000
2,000
3,000
4,000
5,000
6,000
19601974
19721970
19681966
19641962
1990 1988
19861984
19821980
19781976
19981996
19941992
20022004
20062000

JPR Report April 2011 Key trends in the British Jewish community 15
tookplacein2007was911–afigureinlinewithrecent years. However, this disguises a longer-term trend in which the number of Jewish individuals choosing Jewish marriage plummeted from nearly4,000peryearinthelate1960s/early1970sto under 2,000 per year since the early 1990s.12 Among the UK’s general population the number of (first) marriages taking place has nearly halved sincethe1970s,asithasamongJews;furthermore,it decreased from roughly 220,000 marriages a year in 1991 to slightly fewer than 200,000 in 2001, although it has risen again since then.Orthodox.13
12 Statistically, it is important to differentiate between the number of marriages taking place, and the number of individuals getting married, as, for example, ten marriages involve twenty people.
13 The statistic that one quarter of all Jewish marriages are strictly Orthodox should be understood in its
However, different denominations are experiencing different trends in marriage rates. The number of mainstream Orthodox marriages occurring each year has remained constant, as has the number of Sephardi and Masorti marriages, and the number of Reform and Liberal marriages has generally decreased. But it is again the strictly Orthodox demography that is driving the change. As with births, the number of strictly Orthodox marriages is increasing rapidly. For example, in1998therewere195marriages,butin2007there were 243 marriages. A quarter of all Jewish marriages are strictly Orthodox.13
Cohabitation and intermarriageIt should be noted that cohabitation is increasingly common among Jews, as it is in the general population.14 The 2001 Census showed that 11,236 Jews were cohabiting (compared with 112,000 in-marriages).
Intermarriage (the marriage of Jews to non-Jews) is increasing, although it is difficult to show by how much. In Table 1, it is clear that, overall, the majority of Jews are married to other Jews (78%ofmarriedJewishwomenhaveaJewish
wider context. The strictly Orthodox population currentlyrepresentsapproximately12%ofthetotalUKJewishpopulation,andanestimated40%of all Jewish births in the UK occur in the strictly Orthodox sector.
14 Dorling and Thomas, 2004:140
0
200
400
600
800
1,000
1,200
1998 1999 2000 2001 2002 2003 2004 2005 2006 2007
Tota
l rec
ord
ed J
ewis
h m
arri
ages
Source: Graham and Vulkan 2007:10
Figure 7. The number of Jewish couples marrying per year, 1998-2007.
0
500
1,000
1,500
2,000
2,500
3,000
3,500
4,000
1970
1971
1972
1973
1974
1975
1976
1977
1978
1979
1980
1981
1982
1983
1984
1985
1986
1987
1988
1989
1990
1991
1992
1993
1994
1995
1996
1997
1998
1999
2000
2001
2002
2003
2004
2005
2006
2007
Figure 8. Long-term trend in Jewish individuals marrying.

16 JPR Report April 2011 Key trends in the British Jewish community
husband). But it is also clear that many Jews are married to people who did not report being Jewish inthe2001UKCensus.Forexample,18%ofJewish married men have a non-Jewish wife and 6%ofmarriedJewishwomenhaveahusbandof‘No Religion’.
Table 1. Religion of spouse of Jewish individuals in married couples (2001 Census)
Source: Graham, Schmool and Waterman, 2007:60
Household compositionThe structure of the ‘typical’ Jewish household is changing, in line with the changes in wider British society. The nuclear family – including a married heterosexual couple with children – is increasingly less common than in the past. In particular, a growing number of people in Britain (including Jews) are living alone or cohabiting, as noted above. The 2001 Census showed that there were 145,500householdsinBritaininwhichatleastone person was Jewish. Of these households, fully 29%werepeoplelivingalone.Oftheremainder(98,800households)lessthanhalf(47%)containedonlyJewishpeople.Oftheremaining53%(56,100households), some contained Jews living with people who did not report a religion, some with people who reported ‘No Religion’ and the rest with non-Jews (mostly Christians).
Inthesehouseholdstherewere50,646dependentJewish children recorded in the 2001 Census.15 Jewish children are far more likely to live in a married couple household than are children in thewiderBritishcommunity(85%ofdependentJewishchildren,ascomparedwith65%ofdependent children generally). However, a number
15 2001 UK Census. ‘Dependent’ means a child aged 16 or under, or 18 or under in full-time education.
of Jewish children live in single parent households or, increasingly, cohabiting couple households. 10%(6,450)ofJewishhouseholdswere‘singleparent’households(comparedwith15%generally).Inaddition,30%ofJewishcohabitingcouple households had dependent children.16
Geography of the Jewish populationThe 2001 Census showed that Jews live in every one of the 408 Local Authority Districts (LAD) in the UK except for one – the Isles of Scilly. Yet the distribution of Jews across the UK is not evenly spread, with two-thirds of the total Jewish population living in or near London. Even within London, the distribution is spatially skewed withnearlyaquarter(23%)ofthewholeJewishpopulation living in just two places: Barnet and Redbridge.17
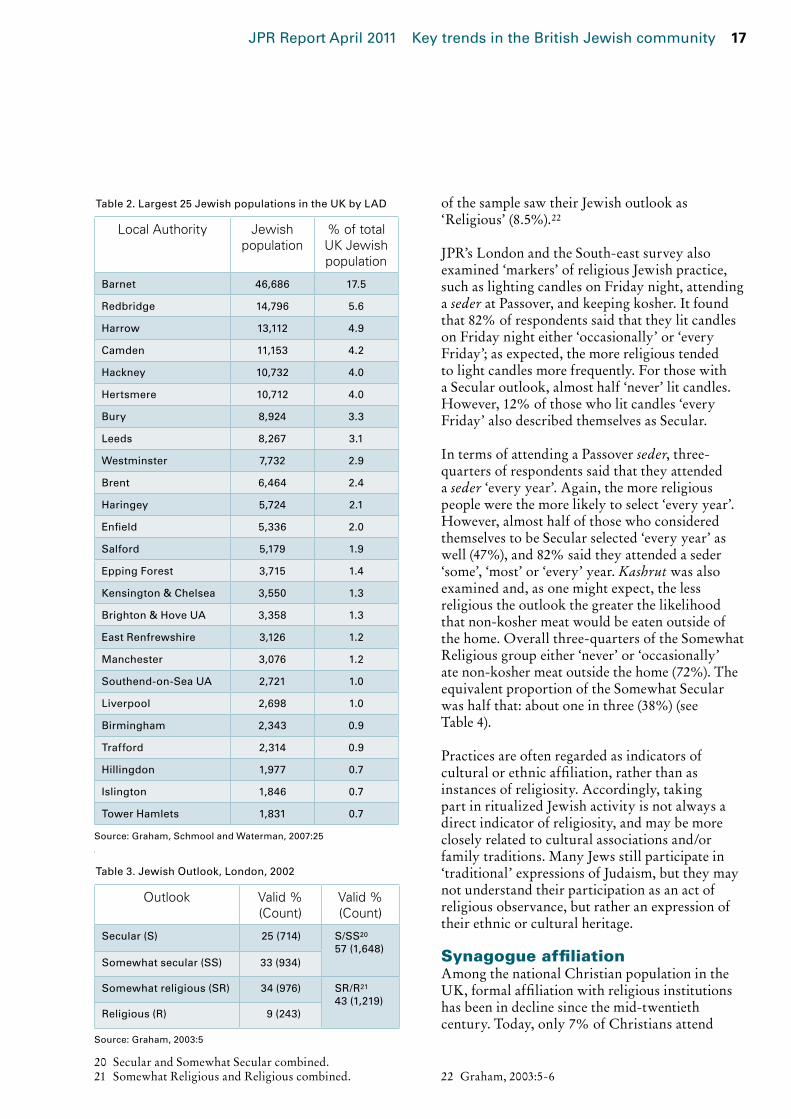
Table 2 shows the largest twenty-five Jewish populations in the UK. As is evident, the top six most populated LADs are all within London or just on its outskirts. While two-thirds of the populationlivesinLondon,afurther8%(21,733)lives in Manchester.
Outside London and Manchester, Leeds has the third highest concentration of Jews nationally (although it is contracting in size due to an ageing population and migration patterns towards London and Manchester). Just over 8,000 Jews live in Leeds, although many of these are students. As in other areas, Jews in Leeds are clustered together,with75%oftheJewishpopulationliving either in North Ward or Moortown and Roundhay.18
Jewish identity and practiceIn Table 3 it can be seen that JPR’s London and South-east survey (2002) found that on the issue of Jewish outlook most respondents were midway on the secular-religious spectrum, with a marginal bias towards the secular end.19 One quarter of thesampledefinedthemselvesas‘Secular’(25%)andwelloverhalf(58%)fellintotheSecular/Somewhat secular category. Less than a tenth
16 Ibid:14117 Ibid:2418 Waterman,2003:519 Note that the sample did not include strictly Orthodox
respondents.
Religion responseJewish women: response
of husband
Jewish men:
response of wife
N= 55,050 56,647
Jewish to Jewish 77.5 75.4
Jewish to No Religion 6.3 3.6
Jewish to Non-response 2.2 2.6
Jewish to Not Jewish 13.9 18.4
Total 100.0 100.0
JPR Report April 2011 Key trends in the British Jewish community 17
Table 3 footnotes20 21
20 Secular and Somewhat Secular combined.21 Somewhat Religious and Religious combined.
of the sample saw their Jewish outlook as ‘Religious’(8.5%).22
JPR’s London and the South-east survey also examined ‘markers’ of religious Jewish practice, such as lighting candles on Friday night, attending a seder at Passover, and keeping kosher. It found that82%ofrespondentssaidthattheylitcandleson Friday night either ‘occasionally’ or ‘every Friday’; as expected, the more religious tended to light candles more frequently. For those with a Secular outlook, almost half ‘never’ lit candles. However,12%ofthosewholitcandles‘everyFriday’ also described themselves as Secular.
In terms of attending a Passover seder, three-quarters of respondents said that they attended a seder ‘every year’. Again, the more religious people were the more likely to select ‘every year’. However, almost half of those who considered themselves to be Secular selected ‘every year’ as well(47%),and82%saidtheyattendedaseder‘some’, ‘most’ or ‘every’ year. Kashrut was also examined and, as one might expect, the less religious the outlook the greater the likelihood that non-kosher meat would be eaten outside of the home. Overall three-quarters of the Somewhat Religious group either ‘never’ or ‘occasionally’ atenon-koshermeatoutsidethehome(72%).Theequivalent proportion of the Somewhat Secular washalfthat:aboutoneinthree(38%)(seeTable 4).
Practices are often regarded as indicators of cultural or ethnic affiliation, rather than as instances of religiosity. Accordingly, taking part in ritualized Jewish activity is not always a direct indicator of religiosity, and may be more closely related to cultural associations and/or family traditions. Many Jews still participate in ‘traditional’ expressions of Judaism, but they may not understand their participation as an act of religious observance, but rather an expression of their ethnic or cultural heritage.
Synagogue affiliationAmong the national Christian population in the UK, formal affiliation with religious institutions has been in decline since the mid-twentieth century.Today,only7%ofChristiansattend
22 Graham,2003:5-6
Source: Graham, Schmool and Waterman, 2007:25
Table 2. Largest 25 Jewish populations in the UK by LAD
Source: Graham, 2003:5
Table 3. Jewish Outlook, London, 2002
Outlook Valid % (Count)
Valid % (Count)
Secular (S) 25 (714) S/SS20
57 (1,648)Somewhat secular (SS) 33 (934)
Somewhat religious (SR) 34 (976) SR/R21
43 (1,219)Religious (R) 9 (243)
Local Authority Jewish population
% of total UK Jewish population
Barnet 46,686 17.5
Redbridge 14,796 5.6
Harrow 13,112 4.9
Camden 11,153 4.2
Hackney 10,732 4.0
Hertsmere 10,712 4.0
Bury 8,924 3.3
Leeds 8,267 3.1
Westminster 7,732 2.9
Brent 6,464 2.4
Haringey 5,724 2.1
Enfield 5,336 2.0
Salford 5,179 1.9
Epping Forest 3,715 1.4
Kensington & Chelsea 3,550 1.3
Brighton & Hove UA 3,358 1.3
East Renfrewshire 3,126 1.2
Manchester 3,076 1.2
Southend-on-Sea UA 2,721 1.0
Liverpool 2,698 1.0
Birmingham 2,343 0.9
Trafford 2,314 0.9
Hillingdon 1,977 0.7
Islington 1,846 0.7
Tower Hamlets 1,831 0.7

18 JPR Report April 2011 Key trends in the British Jewish community
church at least once a month.23 Belief or affinity for religion no longer necessarily equates with formalized affiliation with an institutional body. That said, and in contrast to Christians (many of whom profess affinity for a religion but not a formal institution), just under three-quarters(73%)ofJewishhouseholdsbelongto a synagogue.24Ofthese,amajority(54.7%)
23 http://news.bbc.co.uk/1/hi/uk/3725801.stm24 Graham and Vulkan, 2010. As they note, however,
it does depend somewhat upon how this figure is calculated. To do so, one requires an accurate calculation of how many Jewish households there are in the UK, and that, in turn, requires a definition of ‘a Jewish household.’ A narrow definition of this term includes all households in which the ‘household head’ is Jewish (as recorded in the 2001 UK Census). A broad definition includes all households in which at
currently belong to a ‘Central Orthodox’ synagogue (e.g. United Synagogue/Federation of Synagogues). Data gathered between 1990 and 2010ispresentedinTable5.
Formal affiliation with synagogues is declining overall.In1990therewere354synagoguecongregations nationally and this had fallen to341in2005.25In 1990 there were 102,030 households who held synagogue membership; in 2005thefigurewas83,860households,adecreaseof18%.26 Similarly,in1977totalsynagoguemembershipinLondonwas75,782;by2001this
leastonepersonisJewish.The73%figureisbasedonthe narrow definition; using the broad definition, the figurefallstobelow60%.
25 Hart and Kafka, 2006:1126 Ibid:15
Source: Graham, Schmool and Waterman, 2007:28
Figure 9. Distribution of the Jewish population in and around London, 2001 Census. © David Graham
Source: Graham, 2003:14
Table 4. Likelihood of eating kosher meat inside and outside the home based on outlook, London, 2002
Jewish Outlook Secular Somewhat secular
Somewhat religious
Religious
Only Kosher meat outside home % (Count) 8.4 (59) 14.5 (135) 44.7 (431) 84.4 (205)
Only Kosher at home % (count) 21.8 (152) 42.5 (392) 73.5 (709) 89.3 (217)

JPR Report April 2011 Key trends in the British Jewish community 19
hadfallenby18%to61,941households.27 Whilst the most recent data indicate that the long-term decline in synagogue membership recorded over the past twenty years is flattening out, for the main part this is due to the rapid growth of the haredi sector which masks some of the decline occurring elsewhere.28
Affiliation with a synagogue is highly dependent on age and/or period of life. Research has found that many young adults move away from formal structures of affiliation during their ‘single years’; they were members of (or ‘covered by’) their parents’ synagogue membership when they were children and will often join in their own right when they marry or have children themselves, but tend not to belong to a synagogue in the years in-between. The ‘single years’ often correspond totheagesbetween18and35;peopleinthisagerangeoftenremainunaffiliatedforbetween5and10 years. Affiliation trends also differ according to denomination. For the mainstream Orthodox groups (including the United Synagogue)
27 Schmool&Cohen,2002:728 Graham and Vulkan, 2010
membershipdecreasedby31.4%between1990and 2010. For the Reform and Liberal movements declines were also experienced but on a far smaller scale(-4.2%and-7.6%respectively)overthe1990-2010 period, with the result that both the Reform and Liberal movements comprise a larger percentage of the total number of synagogue members by household in Britain in 2010 than they did in 1990. By contrast, the Masorti movement experienced an increase in household membershipof85.1%between1990and2010(although the actual numbers are quite small) and theStrictlyOrthodoxstrandincreasedby101.6%over the same period.29
The Jewish Voluntary Sector (JVS)According to the National Council for Voluntary Organisations,thereare170,905voluntaryorganizations in the UK. In the Jewish Voluntary Sector,onestudyestimatedthatin1997therewere approximately 1,910 financially independent organizations, over twice the number expected given the relative size of the Jewish population.30 In1997itwasalsoestimatedthatincomeintheJVSwas£500million,withthetop4%
29 Ibid.30 Halfpenny & Reid, 2000:1, 6.
Source: JPR/Board of Deputies, 2010
Table 5. Synagogue membership in UK by denomination, % and figures by household, 1990-2010
1990 1995 2001 2005 2010
Central Orthodox 66.4% 61.5% 57.7% 56.7% 54.7%
66,201 57,040 50,538 47,442 45,393
Reform 16.9% 18.5% 20.3% 20.0% 19.4%
16,824 17,123 17,783 16,719 16,125
Strictly Orthodox 4.5% 6.2% 7.7% 9.2% 10.9%
4,489 5,609 6,631 7,664 9,049
Liberal 7.8% 8.9% 9.2% 8.1% 8.7%
7,785 8,269 8,055 6,743 7,197
Sephardi 3.2% 3.4% 3.5% 3.6% 3.5%
3,238 3,199 3,056 3,022 2,930
Masorti 1.2% 1.5% 1.7% 2.4% 2.7%
1,226 1,413 1,456 1,977 2,269
Total 100% 100% 100% 100% 100%
99,763 92,653 87,519 83,567 82,963

20 JPR Report April 2011 Key trends in the British Jewish community
oforganizationsgenerating70%ofthetotalincome. However, the annual median income was only £10,000. Expenditure was £400 million and assets were valued at £900 million. The income, expenditure and funds of the UK Jewish VoluntarySectorwereeachapproximately3%ofthe income, expenditure and funds of the entire UK voluntary sector. This is around six times more than might be expected given the size of the UK Jewish community compared with the population as a whole.3151%ofthetotalincomewas raised from individuals (compared with 35%intheUKsectorasawhole).Duetohigherstaff costs, the Jewish sector disburses less on grantsanddonations(19%)thantheUKsectorasawhole(27%).MostJVSorganizationsarerelativelynew;60%wereestablishedsince1980.
As is well-known, organizations in the JVS do notlimittheirworktotheUK.Indeed,43%ofthe organizations include Israel in their scope of operations (either solely or in parallel with other operations),and26%operateinternationally(outside the UK and Israel).
JVS organizations operate across eleven different ‘industries’ or areas of interest (although many organizationsoperateinmorethanonefield).44%of all JVS organizations operated within thefield of education (a sector discussed later in this report);14%operatedin‘socialcare,’8%operatedinhealthcare,andafurther8%operatedintheprovision of accommodation.32
31 Ibid:2. This, of course, requires that several thousand members of the Jewish community fill unpaid leadership posts on boards of trustees, take on the burden of financial office, and accept legal and moral responsibility for the running of each organization (see: Valins et al, 2001:xix)
32 Halfpenny & Reid, 2000:8
Almost half of all JVS organizations included fundraising or finance as a primary function (48%),and43%includedtheprovisionofservices(such as training or health care) as a function of their operations.33 Other functions of these organizations include building (schools, hospitals, care homes, houses), representation (such as the Board of Deputies of British Jews), and research (academic and policy, e.g. JPR).
It should be noted that charitable giving amongst Jews in Britain is related to Jewish outlook. In 1995itwasfoundthat‘Religious’Jewsweremorelikely to give than ‘Secular’ Jews. However, the ‘Religious’ tended to restrict their giving to Jewish causes, whereas the ‘Secular’ were more open in their giving patterns.34 The report concluded that: “taking into account the relationship that has been established between religious outlook and giving patterns, it is likely that any further secularization of the community will have a negative effect on donations to both Jewish and general charities in the long term.”35 Additionally, younger people have markedly different interests when it comes to giving. They are much more likely than older Jewish people to support both Jewish and general causes than only Jewish causes; they also give much more readily to UK Jewish causes than to (specifically) Israeli causes. Although these young peoples’ patterns of giving may change as they get older, the difference in charity preferences appears to indicate a generational shift away from Israel-related causes and towards home-based charities.36
33 Ibid:7-834 GoldbergandKosmin1998:1735 Ibid:2536 Goldberg and Kosmin 1998:13

JPR Report April 2011 Key trends in the British Jewish community 21
Appendix 2 Caring for Jewish people: poverty
Child poverty: an overviewThere are various measures of poverty and one of the main distinctions drawn is between ‘absolute’ poverty (a set fixed standard applied across the board – e.g. if one is living on less than a determined amount per day), and ‘relative’ poverty (a standard defined in relation to income growth in the economy as a whole – e.g. if one is living on less than a determined percentage of average UK income). In UK government figures a relative measure is usually used: those classified as being in poverty belong to a household in which disposableincomeis60%orlessofthemedianBritish household disposable income, which is adjusted for the composition of the household, in any given year.
In 1999, the UK Labour government made a pledge to eradicate child poverty in the UK within a generation. It set interim targets of reducing it byone-quarterby2004-5andhalvingitby2010.Whilst it failed to reach these targets, 600,000 children were lifted out of poverty between 1998 and 2008. Its success was largely attributed to improved benefits and tax credits for families with children, and a reduction in the number of out-of-work families, to which government policy made an important contribution. The Conservative Party has largely supported Labour Party ambitions in this area, as clearly indicated, for example, by its then policy director Oliver Letwin in 2006. However, at the time of writing, it is questionable whether the new government will continue to invest in this agenda to the same extent as the former government; whilst the Labour government’s goal of eradicating child poverty by 2020 was legally enshrined in the 2010 Child Poverty Act, it is difficult to see how the fiscal retrenchment currently being pursued by the coalition government will achieve this.
Furthermore, according to one of the many non-governmental bodies working in this area in Britain, the current situation remains rather stark:
• 4millionchildrenintheUKarelivinginpoverty;
• TheproportionofchildrenlivinginpovertyintheUKgrewfrom1in10in1970to1in3in1998;
• Today,30%ofchildrenintheUKarelivinginpoverty;
• Themajority(59%)ofthesechildrenliveinahousehold where at least one adult is in paid employment;
• 40%ofpoorchildrenliveinahouseholdheaded by a lone parent. However, the majority (57%)liveinahouseholdheadedbyacouple;
• 38%ofchildrenlivinginpovertyarefromfamilies with 3 or more children.37
The most recent governmental measure (Labour government) designed to tackle the problem was the extension of the Free School Meals (FSM) scheme.38 Before the last general election, former Chancellor of the Exchequer Alistair Darling announced that the FSM scheme in England wouldbeextendedtoafurther500,000childrenwho were previously ineligible. He estimated that this measure would cost £140 million in 2010, and claimed that the extension of the programmewouldlift50,000childrenoutofrelative poverty and support the government’s target of fully abolishing child poverty by 2020. Nevertheless, the measure, whilst welcomed, was also widely criticized for lacking the necessary boldness required to really eradicate child poverty. Samantha Hyde, Director of the End Child Poverty campaign commented:
37 http://www.endchildpoverty.org.uk/why-end-child-poverty/key-facts
38 Free School Meals are available to children whose parents/guardians are in receipt of one or more of the following benefits: Income Support, Income-Based Jobseeker’s Allowance, Employment and Support Allowance (Income Related), and support under Part VI of the Immigration and Asylum Act 1999. Families in receipt of Child Tax Credit may also qualify as long as they are not entitled to Working Tax Credit, and their annual income does not exceed £16,190 (2010 figure).

22 JPR Report April 2011 Key trends in the British Jewish community
“The extension of Free School Meals will take50,000childrenoutofpovertybutfallswoefully short of what is needed to make the Government’s 2010 target to halve child poverty. The goal to end child poverty by 2020 can be met but we need to see government taking bolder action. The recession must not be used as an excuse for missing the 2010 target; ending child poverty is not only a moral obligation but would also save the exchequer an estimated£25billonayearandgoalongwaytocutting the government deficit.”39
Fergus Drake, Save the Children’s director of UK programmes, agreed:
“This still leaves 1.4 million children living in severe poverty, whose parents struggle on a daily basis to put food on the table. Free School Meals are welcome – but so much more needs to be done to ensure the very poorest children are not left behind.”40
The picture regarding Jewish children is far less clear. Despite extensive research on poverty among children in general in Britain, as well as poverty among Jewish children in Israel, there is very little data on British Jewish poverty in general, and even less on British Jewish child poverty. Furthermore, whilst the work of numerous Jewish organizations touches the field of child poverty, there is no single Jewish community organization with an exclusive focus on it. The UK 2001 Census includes many pieces of valuable data related to poverty, and those elements that relate to Jews have recently been published by JPR.41 Data from the Census on overcrowding, housing tenure and employment status do exist, and can all be used to measure
39 http://www.endchildpoverty.org.uk/news/press-releases/government-has-missed-an-opportunity-to-meet-the-2010-target-of-halving-child-poverty/24/176
40 http://www.telegraph.co.uk/finance/personalfinance/how-budget-affect-me/6771124/Pre-Budget-Report-Free-school-meals-extended-to-500000-primary-school-children.html
41 The forthcoming 2011 UK Census could similarly be utilized to generate a robust picture. In due course it will be possible to compare and contrast data from 2001 and 2011 to assess how child poverty in the Jewish community has changed over time, and locate that in the context of the Government’s investment during that period.
relative economic well-being.42 Arguably, the most valuable data is that relating to Free School Meals (FSM): children whose parents are in receipt of certain benefits are entitled to receive free meals during the school day. FSM figures for Jewish schools that are published by local authorities provide an important indicator of the extent to which child poverty is an issue within the Jewish community, although it is important to note that Free School Meals are not available to children attending private schools.43
Poverty amongst the Strictly OrthodoxPoverty within British Jewry is often regarded as being exclusively contained within the Strictly Orthodox community, and for this reason, the data that have been analysed relate almost exclusively to haredim. It is clear that Strictly Orthodox Jews are more likely to experience poverty than other ‘mainstream’ Jewish families. This is partly because they have far more children per household than the general Jewish population, as Table 6 demonstrates.
Haredi families are also more likely to struggle financially than ‘mainstream’ Jews and the general population. Many families have more children than their income can comfortably support. Furthermore, qualitative evidence gathered during the course of JPR’s recently-published investigation into child poverty clearly indicates that the majority of young haredi Jewish boys are not completing their formal education with sufficient skills or qualifications to gain the types of professional positions that would enable them to support a large family. The 2001 UK Censusquantifiedthis:inHackney,43.5%ofJews under the age of twenty-five have no formal UK qualifications. In contrast, haredi girls do gain qualifications, and typically, they become important breadwinners within the household, but the lack of qualifications among males inevitably takes its toll on family income over time. Accordingly, haredi children are considerably more at risk of experiencing poverty than mainstream Jewish children.
42 SeeGraham,SchmoolandWaterman2007foranindication of what data have been explored.
43 Free School Meals are available to children whose parents/guardians are in receipt of a variety of benefits including Income Support and the Income-Based Jobseeker’s Allowance.

JPR Report April 2011 Key trends in the British Jewish community 23
FootnoteTable744
Household tenure is also considered one indicator of economic well-being. According to the 2001 Census, UK Jews were more likely to own their own homes than the general British population (77%ofJewishrespondentsownedtheirownhomes, as compared with a national figure of 69%).45 Jews were also less likely to live in social
44 E&W = England and Wales45 Own outright or with a mortgage.
rentedaccommodation(9%comparedwith19%).When renting, Jews were more likely to rent from the private sector than the public sector.46 However,again,asTable7illustrates,forareaswith a high percentage of strictly Orthodox Jews, such as Stamford Hill in Hackney, and Haringey, dramatically different housing tenure patterns existed. Jews in these areas are much less likely to own their own homes than both the general Jewish and the general British populations. Jews in Hackney were much more likely to be in socially rented accommodation than both the general Jewishpopulation(35%,comparedwith9%)andthegeneralBritishpopulation(19%ofwhichisin social-rented accommodation). This figure clearly points to considerable income and wealth disparities within the British Jewish population.
Overcrowding is also prevalent in Hackney with25%ofJewishfamilieshavinginsufficientspace(ascomparedwith8%ofthegeneralJewishpopulationand12%ofthegeneralUK population).47
Data on financial benefit receipts is also an indicator of economic distress. Although there has been no research conducted on the number
of Jewish families generally receiving all types of benefits,48 it is known that a large number of haredi families in Stamford Hill do receive benefits. As shown in Table 8, a high percentage of the Strictly Orthodox families surveyed received some form of financial benefit, the most
46 Graham,SchmoolandWaterman2007:547 Graham,SchmoolandWaterman2007:7348 These data do exist but have yet to be analysed.
No. of children Households
Number %
0 10 3
1 25 9
2 20 7
3 39 13
4 39 13
5 38 13
6 16 6
7 26 9
8 21 7
9 23 8
10 12 4
11 11 4
12 6 3
13 5 3
14 1 <1
18 1 <1
Table 6: Number of children in haredi households in Hackney
Source: Holman and Holman 2002:24, based on 293 responses
Table 7. Household tenure, percentages by location, 2001 (households)
Source: Graham, Schmool and Waterman 2007:71
E&W44 (All) E&W (Jewish)
Jewish (LAD)
Bury Camden Hackney Hertsmere Salford
Total 21,660,475 116,330 3,500 5,776 3,666 3,982 1,653
Owned 68.9 76.7 87.5 68.5 37.9 93.2 68.4
Social rented 19.2 9.0 5.1 7.5 34.5 1.4 9.8
Private rented 9.9 12.7 6.5 21.9 26.5 4.5 19.3
Living rent free 2.1 1.6 0.9 2.0 1.2 0.9 2.5
100.0 100.0 100.0 100.0 100.0 100.0 100.0

24 JPR Report April 2011 Key trends in the British Jewish community
common Table 8 footnotes49 50commonbeingchildbenefit(62%)andworkingfamiliestaxcredit(35%).18%offamiliesreceivedincomesupport,andonly14%didnotreceiveanyfinancial benefits at all.
Data from the same source clearly indicate that many haredi families have problems paying bills. Indeed, approximately two-thirds of haredi families in Stamford Hill were struggling with at least one bill if not several.
Impact of poverty on Jewish childrenAlthough there is no substantive research which examines the impact of poverty on Jewish children (even within Stamford Hill), we can surmise from other data that Jewish children are adversely affected by poverty, at least in Stamford Hill. For example, research has found that many families in this area have difficulties providing
49 Basedon267responses.Respondentsmaybeinreceiptof more than one benefit.
50 ONS Neighbourhood Statistics data using mid-1998 estimates of households in LB Hackney and selected data on benefit recipients (August 1999) figures.
both necessities (clothes, shoes and food) and life-enhancing activities (attending/organizing a simcha,holidayorpocketmoney).Almost50%of families, according to one report, could not affordaholidayfortheirchildren,and30%couldnotgivetheirchildrenanypocketmoney.15%ofchildren go without new clothes (see Table 10).
It is important to note that the haredi community has set up – both formally and informally – an intricate network of support frameworks designed
Table 9. Percentage of haredi respondents with problematic bills, 2001
Source: Holman and Holman, 2002:61, based on 251 responses
No. of problematic bills %
1 13
2 13
3 11
4 10
5 2
6 3
7 4
8 5
9 2
10 2
11 <1
15 <1
Table 10. Percentage of children going without certain items in Stamford Hill, 2001
Source: Holman and Holman, 2002:65
Benefit received Stamford Hill %49
LB Hackney50
Job seeker’s allowance 3 12
Income support 18 24
Incapacity benefit 2 14
Single parent benefit <1 -
Child benefit 62 -
Invalid carer’s benefit 5 -
Disability Living Allowance – care element
9 -
Disability Living Allowance – mobility element
6 -
Disabled Person’s Tax Credit
- -
Working Families Tax Credit 35 43
State retirement pension 4 -
Widow’s benefit <1 -
Other benefits 2 -
No benefits 14 -
Table 8. Benefits received amongst the strictly Orthodox in Stamford Hill, contrasted with general figures for the London Borough of Hackney, 2001
Source: Holman and Holman 2002:59
Item %
Clothes 15
Shoes 8
Food 3
Attending a simcha 13
Organising a simcha 1
School trip 4
Pocket money 30
Hobby or sport 17
Holiday 49
Never go without 29
Money never tight 1

JPR Report April 2011 Key trends in the British Jewish community 25
to help families afflicted by poverty. Data analyzed for JPR’s recently published report on child poverty from the North London Shomer ShabbosDirectory(2007)lists130gemachim serving the haredi community in Hackney, and includes sections on baby equipment and children’s libraries, in addition to a range of more general services. Almost one-third of those gemachim listed(31%)arespecificallydedicatedtobabiesandchildren, and this does not include many offering general support for loans, household items, family celebrations and other services that may be taken up by families in difficult financial circumstances. All of these undoubtedly help to ameliorate some of the effects of poverty in the haredi community, although they do little, if anything, to prevent its occurrence in the first place.
The data on child poverty among Jews outside the haredi community are even patchier. There has never been an investigation into it, but JPR’s recent work in this area, whilst principally qualitative rather than quantitative, did seek out some quantitative indicators. Free School Meals data from Jewish schools in the London Borough of Barnet clearly illustrate that, whilst there is some eligibility among mainstream Jewish families, the percentages involved are, in general, rather low. This is in spite of the fact that, according to several
informants involved in JPR’s study, there are clear pockets of child poverty and deprivation in parts of London beyond the Boroughs of Hackney and Haringay. Furthermore, again according to some informants in JPR’s current study, there is a clear tendency among some Jewish families not to apply for Free School Meals due to the stigma associated with being categorized in this way. As a result, the actual figures eligible may be slightly higher than listed.
Without seeking to minimize the difficulties facing those families whose children do receive Free School Meals (or those who are entitled to, but elect not to), the figures should be located in their proper context. Table 12 gives a broader view of the general situation in Barnet.
JPR’s recently-published investigation is designed to identify gaps in communal provision for children afflicted by poverty or deprivation, and to make policy recommendations for how these could be filled. At the time of writing this report, these data were still being gathered and analyzed, but it was overwhelmingly clear that whilst much is being done internally to ameliorate the immediate effects of poverty, much more can and should be done to try to prevent it from occurring in the first place.
School 2002 2003 2004 2005 2006 2007 2008 2009
Akiva 0% 1%
Beis Yaakov 1% 1% 1% 1% 2% 2% 2% 3%
Hasmonean Primary 3% 5% 4% 3% 3% 4% 6% 3%
Independent Jewish Day 0% 0% 0% 0% 0% 0% 1% 1%
Mathilda Marks-Kennedy 0% 0% 0% 0% 0% 0% 0% 0%
Menorah Foundation 0% 0% 0% 0% 0% 1% 2% 2%
Menorah Primary 1% 1% 2% 2% 2% 2% 1% 2%
Pardes House 0% 0% 0% 0% 0% 0% 0% 16%
Rosh Pinah 3% 3% 2% 2% 3% 3% 3% 2%
Table 11. Average Free School Meals eligibility in LB Barnet Jewish primary schools
Source: London Borough of Barnet
Table 12. Average Free School Meals eligibility in LB Barnet primary schools
Source: London Borough of Barnet
2002 2003 2004 2005 2006 2007 2008 2009
LEA average 18% 19% 20% 21% 21% 20% 21% 21%


JPR Report April 2011 Key trends in the British Jewish community 27
Appendix 3 Education in the Jewish community
A new UK governmentThe broad educational context within which British Jewish day schools operate is in the very early stages of undergoing some major changes as a result of the change in government.
In general, new government policy, under the new Secretary of State for Education, Michael Gove, will be designed to free schools from the perceived prescriptive and bureaucratic measures of the former government’s policy. The National Curriculum is likely to see some significant alterations: a heavy emphasis on the basics (particularly literacy and numeracy at primary level), and, very importantly from the perspective of a Jewish day school, greater levels of freedom and flexibility to determine curriculum content than in the past. The stated goal is “to return the National Curriculum to its intended purpose – a minimum national entitlement organized around subject disciplines.”
Gove has also announced legislation which will allow him to approve schools to become ‘academies.’ The Government’s intention again is to allow more schools to benefit from “freedoms and flexibilities to help them innovate, raise standards and achieve enhanced outcomes for their students.” Academies will be publicly-funded independent schools, free from local authority control. They will be free to set their own pay and conditions for staff, free from following the National Curriculum, free to change the lengths of their terms and school days, and free to engage in local partnerships. Primary, secondary and special schools rated as ‘outstanding’ by Ofsted will be allowed to apply to become academies, subject to approval by the Secretary of State. Several Jewish day schools fit into this category: JFS, Yesodey Hatorah Senior Girls, Hertsmere Jewish Primary and Mathilda Marks-Kennedy Primary in London, and King David Junior and North Cheshire Jewish Primary in Manchester.
The possible implication of all of this is that outstanding Jewish schools will have much greater flexibility to determine how much emphasis they place on Jewish education. With looser controls on the National Curriculum combined with greater freedom to determine the school calendar, academies should be well-placed to increase levels of Jewish input. Whether or not they opt to do so remains to be seen.
Jewish education and Jewish day schoolsAccording to one estimate (from the year 2000), 44%ofallJVSorganizationsoperatewhollyor partially within the fields of education and training.51 This is based on a broad definition of ‘education’ encompassing formal and informal education, religious and secular education, cultural and ethnic education.
In JPR’s study, A portrait of Jews in London and the South-east: a community study(2002),87%of parents of school-aged children believed that their children should have some sort of formal Jewish education.52Additionally,92%ofparentsthought that it was important for their children to mix in Jewish social groups.53 These attitudes are reflected in the rise in the percentage of Jewish children attending a Jewish day school that has occurred over the past sixty years and especiallythemostrecentperiod.In1950,4,000pupils attended full-time Jewish day schools; by 1975thenumberwas12,800,andby1999itwas22,640.54 The Commission on Jewish Schools recentlyfoundthatby2005-2006thenumberofenrolledJDSpupilswas26,470(notincludingnon-Jewishpupils)nationally;48%ofthesewereenrolled in strictly Orthodox schools.55 Over 50%ofJewishchildrenaged4to18yearsoldnowattend a Jewish day school.56 However, across the sector there are more places available (30,291) than
51 Halfpenny & Reid, 2000:852 Valins & Kosmin, 2003:1853 Ibid54 Valins et al, 2001:355 Commission,2007:5156 Ibid:5

28 JPR Report April 2011 Key trends in the British Jewish community
Jewish children to fill them, and the majority of this surplus capacity is in the ‘mainstream’ (i.e. non-haredi) sector.
Despite the high percentage of Jewish children enrolled in Jewish day schools, there are currently a number of challenges facing the system. Most recently, Jewish day schools are working to reconcile their ethos with the Supreme Court’s December 2009 ruling which made it illegal to discriminate on the basis of matrilineal descent for the purposes of state-funded school admissions. This ruling makes religious observance tests necessary for admissions; students are currently required to attend synagogue and demonstrate a certain level of observance in order to be considered for a school place.
The second issue, and one already alluded to, is the fact that most Jewish schools are now undersubscribed.57 Until recently, almost all discussions about school places in Jewish faith schools assumed an inadequacy of supply. However, as the Commission on Jewish Schools report makes clear, Jewish schools are struggling to fill all of their places, especially those located outside of North-west London.
The issue of supply and demand is contingent on a number of factors: location, stage of schooling and religious grouping in particular. For example, more strictly Orthodox children attend a Jewish day school than Jewish children from more progressiveJewishbackgrounds.Upto60%ofthegrowth in pupil numbers for Jewish schools has come from demand within the strictly Orthodox community, and as noted, this sector comprises almost half the number of pupils in Jewish schools. For the strictly Orthodox community, supply (rather than demand) remains a significant issue:effectively100%ofharedi children attend Jewish schools.
For mainstream Orthodox and Progressive Jewish schools, the picture is less clear. However, an analysis of school enrolment in relation to supply of places reveals that there is an overcapacity of pupil spaces in the majority of these Jewish day schools. Still, it is important to note that an overall excess of spaces does not mean that every Jewish child will be guaranteed a place in the Jewish
57 GrahamandVulkan,2007:71
school of their choice, especially considering school location and popularity issues.
In the mainstream primary school sector, one estimateisthattherecouldbeafallofupto20%in the number of mainstream Jewish primary school age pupils in London over the next decade – from9,905to7,965.58 Although the Jewish birth rate is rising, this is due to the increase in strictly Orthodox children. Therefore, it is possible that in the mainstream primary sector there will be 30%sparecapacityinLondonby2016,unlesstheproportion of Jewish children choosing Jewish schools increases dramatically.
The mainstream secondary school sector is slightlydifferent.In2005/6,itwasestimatedthatsecondary Jewish day schools were operating at near capacity. Nevertheless, there has also been a recent increase of spaces (the new JCoSS opened in autumn 2010). However, projections of the number of secondary school-age pupils in London show thattheyaresettocontractfrom10,616in2005to8,963by2016–i.e.by16%–whilstthenumberofplacesavailableiscontinuingtorise(from4,472in2005to6,852in2016).59 Therefore, it is possible that in the mainstream Jewish secondary school sector there could be an oversupply of places by as muchas50%by2016.
Additionally, there are many Jewish schools that already accept non-Jewish pupils because there is insufficient demand from the local Jewishcommunities.In2005/06,therewereapproximately 1,000 non-Jewish pupils (as defined by Jewish schools) attending Jewish day schools. Around90%ofthesewereinBirminghamandLiverpool, where they exceeded the number of Jewish pupils attending those schools.
Table 13 provides a summary of these figures in the mainstream Jewish day school sector. It shows that only in North-west London is there currently excess demand over supply; in other words, Jewish day schools in all areas other than North-west London are already under-subscribed and projections suggest that even here there will be a surplus of Jewish secondary school places by 2012. However, further research
58 Commission on Jewish Schools, The Future of Jewish Schools. JLC,2007:14,64
59 Ibid.,2007:67

JPR Report April 2011 Key trends in the British Jewish community 29
is needed in order to assess the significance and accuracy of these findings. These data were analysedin2007.Asitisnow2011,itwouldbe appropriate for research to be conducted to assess whether this has already occurred or is still on course to occur within the next few years. Additionally, data from the 2011 Census will significantly help to provide more accurate figures with which to plan ahead.
Some attitudinal research might also be valuable. From recent research about Jewish schooling conducted in the Redbridge area, we know that parents are more concerned about the safety of the school environment, academic standards,
opportunities to pursue special interests (music, IT, sports, etc.), and the quality of the school’s general facilities, than whether or not it is a Jewish school.60 Furthermore, the same data indicate that Jewish schooling is considered to be far more desirable at primary level than secondary level. In addition, they indicate that three-quarters of all Jewish parents in the area would be comfortable sending their child to a school that accepted some non-Jewish pupils. Admittedly, all of these data are restricted to one very particular geographical area so it is impossible to assess the extent to which they might apply on a national scale; further research would be required in order to ascertain this.
60 Unpublished data.
Table 13. Date of expected oversupply of places in mainstream Jewish primary and secondary schools, by area.
Source: Commission on Jewish Schools, 2007:71
Location Number of primary school places in
2005/06
Year oversupply expected if 60% take-up reached
Number of secondary school places in 2005/06
Year oversupply expected if 60% take-up reached
North West London 4,068 2010/11 3,491 2011/12
North East London 846 < 2005/06 981 < 2005/06
Manchester 1,065 < 2005/06 891 < 2005/06
Leeds 315 < 2005/06 - -
Liverpool 476 < 2005/06 620 < 2005/06
Birmingham 204 < 2005/06 - -
Glasgow 300 < 2005/06 - -


JPR Report April 2011 Key trends in the British Jewish community 31
Appendix 4 Caring for Jewish people: physical, sensory and learning disabilities
Physical and sensory disabilitiesObtaining reliable statistics on the prevalence of physical and sensory disability in the UK is complex, not least as a result of the range of definitions employed. The category ‘physical disabilities’ might include visual impairments, hearing impairments, mobility impairments, head injuries, chronic illnesses, and/or other miscellaneous categories, for example, those arising from substance abuse and addictions. TheDisabilityDiscriminationAct(1995)definesa disabled person broadly: namely as someone with “a physical or mental impairment which has a substantial and long-term adverse effect on his ability to carry out normal day-to-day activities.” This, of course, includes a wide range of disabilities – not all of them physical – but based on this definition, there are data to indicate that 9.8 million adults and 800,000 children in the UK weredisabledin2007/8,afigurethathasremainedmore or less stable for several years.61 However, ONS statistics from the UK 2001 Census indicate thatanestimated2.8%oftheUKpopulationsuffers from a physical or sensory disability, and 1.7%fromaphysicaldisability.62
The government offers a range of support measures for people with disabilities, including health and social care, employment support and financial support, as well as help with education and learning, motoring and transport, housing and access.63 The Disability Discrimination Act,originallypassedin1995butextendedsignificantlyin2005,offersdisabledpeoplerights in the areas of employment, education, access to goods, facilities and services (including larger private clubs and land-based transport services), and buying or renting land or property (including making it easier for disabled people to rent property and for tenants to make disability-related adaptations). The Act also requires public bodies to promote equality of opportunity for
61 Office for Disability Issues data. See: www.odi.gov.uk.62 www.statistics.gov.uk63 See: www.direct.gov.uk
disabled people, and allows the government to set minimum standards so that disabled people can use public transport easily.
There is very little research available on the number of Jews living in the UK with physical disabilities.64 However, the 2001 Census did ask a number of questions related to care, including: ‘Do you have any long-term illness, health problem or disability which limits your daily activities or the work you can do’? It also asked whether or not people were caring for others at home, as well as questions about general health. Although some of these data for Jews have been examined, the majority have not.65 However, summary data are shown in Figure 10: not surprisingly, there is a clear relationship between health and age. Nearly 29,240Jewishpeopleaged65andoverreportedsuffering from a limiting long-term illness (LLTI); comparedwith9,810ofthoseaged50to64;8,212of those aged 16 to 49; and 1,330 of those aged 0 to 15.MorewomenthanmenreportedLLTIssincethey have longer life expectancies.
Several Jewish charities are involved in the area of disability support, notably Jewish Care, Norwood, Jewish Child’s Day, Jewish Blind and Disabled, the Jewish Deaf Association, Cosgrove Care, Manchester Jewish Community Care, Rishon Multiple Sclerosis Aid Group and the Jewish Children’s Holiday Fund. Some of these bodies offer direct support for Jews with physical disabilities. Norwood, for example, maintains the Rela Goldhill Lodge in Golders Green, a residential home for adult Jews aged 18to65withphysicaldisabilitiesorsensoryimpairments. The home has a strong Jewish ethos, with kosher catering and Shabbat observance maintained in all public spaces. The Lodge has twenty-one residential rooms and twenty-four members of staff; there is also a day centre that provides assistance to younger Jews with
64 Phone conversation with Jewish Blind and Disabled, 17/11/09
65 Graham,SchmoolandWaterman,2007:75-78

32 JPR Report April 2011 Key trends in the British Jewish community
physical disabilities and to those of any age living independently but in need of some occasional assistance.66 Cosgrove Care also offers residential services and supported independent living for Jews in Scotland.
Learning disabilitiesData on the number of people with learning disabilities in the UK has been gathered by various sources.67 The Department of Health estimates that 1.2 million in the UK have a mild or moderate learning disability.68 The Centre for Disability Research claims that the figure for England aloneis985,000peoplewithalearningdisabilityofsomesort,representingapproximately2%of the population.69Ofthese,796,000areaged20 or over, leaving a balance of approximately
66 http://www.jewishcare.org/what-we-do/physical-and-sensory-disability/rela-goldhill-lodge/
67 The World Health Organisation defines learning disabilities as ‘a state of arrested or incomplete development of mind.’ Somebody with a learning disability may also have ‘significant impairment of intellectual functioning’ and ‘significant impairment of adaptive/social functioning’. http://www.learningdisabilities.org.uk/
68 2007figures.69 People with Learning Disabilities in England, Centre
for Disability Research, Lancaster University, 2008.
189,000 children.70 The NHS Health and Social Care Information Centre reported in 2004 that only20%ofalladultswithlearningdisabilitiesare known to learning disability services. Concerning children, information gathered by theDCSFsuggeststhatinJanuary2006,210,510(2.6%)pupilswereidentifiedashavingaprimaryspecial educational need (SEN). However, this figure has been disputed as an underestimate by some, due to perceived weaknesses in the data gathering process.
The figures for severe or profound learning disabilities are, of course, lower. The Department of Health appears to have produced the most reliable figures, claiming that 145,000adultsfitintothiscategory(120,000ofworkingage,and25,000olderpeople),and65,000children.71
The situation in the Jewish community is unclear. According to one anecdotal estimate from the Judith Trust, there are approximately
70 Estimating Future Need/Demand for Supports for Adults with Learning Disabilities in England, Institute for Health Research, Lancaster University (2004)
71 Valuing People. A New Strategy for Learning Disability for the 21st Century, Department of Health white paper, 2001.
Figure 10. Limiting long-term illness by age in the Jewish and general populations (%)
Source: Graham et al, 2007:77
0
2
4
6
8
10
12
0 to 15 16 to 49 50 to 64 65 and over
Per
cen
t
Jewish population
General population

JPR Report April 2011 Key trends in the British Jewish community 33
5,000JewsintheUKwithsometypeoflearningdisability. Based on the figures quoted above (the Department of Health’s 1.2 million and the CentreforDisabilityResearch’s985,000),thiswould appear to be a reliable estimate, assuming that prevalence amongst Jews is no different from the wider population. However, there are no reliable data on learning disabilities in the Jewish community. JPR plans to analyze UK 2011 Census data on Jews and conduct a parallel Jewish community survey, and both of these studies could provide opportunities to generate reliable figures in the future.
There are Jewish organizations involved in helping Jews with learning disabilities, most of which have dedicated departments working with children and their parents.72 Examples include Norwood (three centres, each with a family support team, which together assist over 600 families); the Langdon Foundation (which runs Langdon College, the only specialist residential Further Education College in the UK that caters specifically for the cultural and observational needs of the Jewish community); and Delamere Forest School in Cheshire (boarding school facilities for children aged6to17withspecialneeds).However,theseorganizations are service providers rather than research institutions focused on studying or quantifying Jewish disabilities.
The Board of Deputies of British Jews has published a guide for parents of children with disabilities. This guide is an index of helpful
72 Conversation with Chief Executive of The Judith Trust, 16/11/09
references and descriptions of organizations (both Jewish and non Jewish). The Board has also published a guide for Jewish adults with learning disabilities, which is also an index of available services. In addition, Netbuddy, based in the Pears Foundation Jewish Innovation and Social Action Hub (JHub), launched a new website in summer 2010 that offers families and professionals working with people with learning disabilities an opportunity to swap advice and practical tips on a range of disability issues.
Despite evidence of its importance, there is no voluntary organization dedicated exclusively to the spiritual and religious needs of Jews with learning disabilities. The Judith Trust published a short piece of research entitled What does being Jewish mean to you? The spiritual needs of Jewish people with learning disabilities and their families. This research was based on qualitative interviews with Jewish adults and younger people with learning disabilities and/or mental illnesses, as well as their parents. ‘Being Jewish’ was identified as very important by most respondents and their parents. However, both parents and people with disabilities said that they often felt isolated from the Jewish community, and extremely uncomfortable (and sometimes unwelcome) in synagogues. A significant number of people also expressed a need for more inclusive opportunities for cultural and religious involvement, i.e. involvement in festival celebrations, Hebrew lessons, and formal ceremonies like bar/bat mitzvah.


JPR Report April 2011 Key trends in the British Jewish community 35
Appendix 5 Caring for Jewish people: the elderly
The general growth trend among the elderlyBritain’s national population is getting bigger and older. According to the ONS, the population oftheUKwasalmost61millionin2007,an8%increasefromjustover56millionin1982.73 In 2007therewerefeweryoungpeople(aged5to15)thanin1982,andmanymoreagedbetween35and60. In 1982 there were many young people who had been born in the post-war and 1960s baby booms.By2007thesebabyboomcohortsweremiddle-aged, and there have been comparatively low fertility rates over the decades since the late 1960s. As these larger cohorts age, they are replaced by comparatively smaller generations. Overallbetween1982and2007,theproportionofpeople in the UK who were children (aged under 16)fellfrom22%to19%ofthetotalpopulation.The proportion of people aged 16 to 64 increased from63%to65%,andtheshareaged65oroveralso increased slightly. Most striking, however, was the growth in the number of very old people: in1982therewere0.6millionpeopleaged85orover(1.1%ofthetotal);by2007thisfigurehadmorethandoubledto1.3million(2.1%).In2007,the number of people of state pensionable age exceeded the number aged under 16 for the first time, and this trend is projected to continue.74 In 2002, there were 10.8 million people in the UK over the age of retirement; there were 3.9 millionmenovertheageof65and6.9millionwomen over the age of 60. A Royal Commission was established to estimate the cost of funding long-term care services for the growing elderly population. In 2002, this cost was estimated at £11billion;thiswasexpectedtoincreaseto£14.7billion in 2010 and £20 billion by 2021.
Health and ageing in the Jewish communityBritish Jews, like British people in general, are living longer than they used to and are getting older. In particular, the number of Jewish people
73 Dunnell, 2008:674 Ibid.
who are ‘old-old’ is growing quickly and will continue to do so.75 However, living longer does not necessarily mean having more years of good health later in life. As more people live longer, more people will be living with life-limiting illnesses. Figure 11 shows that older people are more likely to report ill-health and consequently to require more care. The 2001 Census also showedthatover27,000Jewishpeopleprovidedcare at home and that the provision of care was related to the provider’s age. Care was most likely tobeprovidedbypeopleaged55to64(21%provided at least some care), and least likely to be providedbyyoungpeopleunder35yearsold(3%provided such care). However, the older a person is, the greater the number of hours they are likely toinvestincareprovision.Nearlyhalfthe4,185peopleaged75andoverwhoprovidedcaredidsofor over twenty hours each week.76
A significant number of the old-old are living with Alzheimer’s or dementia. Although it is unknown exactly how many Jewish people suffer from Alzheimer’s or dementia, it can be assumed that this number will rise in the next few decades, as it is forecasted to do for the general population. The Alzheimer’s Society estimates that there are700,000peoplelivingwithdementiaintheUK today, two-thirds of whom are women. The Alzheimer Research Trust puts the figure even higher at 821,884. The number of total sufferers is expectedtoreachonemillionby2025.Already,one-thirdofpeopleovertheageof95hasdementia,and64%ofpeoplelivingincarehomesare suffering with Alzheimer’s.77 The Alzheimer Research Trust recently reported that dementia costs the UK economy £23bn per annum, twice as much as cancer, but investment in cancer research outweighs investment in dementia research by a ratio of 12:1. There are no cures for dementia at
75 As people live longer old age has become a more expansivecategory;‘old-old’referstopeopleaged85andover;‘young-old’referstopeopleaged65-84.
76 Grahametal,2007:7777 http://www.alzheimers.org.uk/site/scripts/documents_
info.php?documentID=341&pageNumber=1

36 JPR Report April 2011 Key trends in the British Jewish community
present, and few ways of delaying it or slowing it down.
From the perspective of service providers, the length of time people are chronically ill (with conditions such as dementia) is more important than how long people live, since healthy people can care for themselves. Men in the general British populationcanexpecttoliveto74,withsixteenyears of life-limiting illnesses; women can expect to live to 80, but with twenty years of life-limiting illnesses.78 Therefore, there is anticipation of an increasing number of people entering long-term care facilities in the future.
Care homes79
There are over 20,000 care homes for the elderly in the UK, ranging from specialist homes for people with dementia to religiously-affiliated providers. There are thirty-six Jewish care homes in total, twenty-two of which are in the Greater London area (with most of these clustered in North-west
78 Valins, 2002:3979 The data on care homes and other forms of organized
care for the elderly are all related to the mainstream (not haredi) population. The Strictly Orthodox community has its own systems of self-help.
London).80 These thirty-six Jewish care homes are run by twenty-one separate organizations, but Jewish Care provides almost two-thirds of JVS bed spaces in London. Despite its distance from the ‘Jewish centre of gravity’, the largest Jewish care home, Nightingale House, is in South London, which is ten miles from Barnet. Although its reputation makes it a sought-after home, its location may become increasingly problematic if current demographic trends persist.
Around one in twenty-five British Jews aged 65andolderareinlong-termJVScarehomes,with others in private facilities. The average age of clients is 88 years old and almost 90 in London. As might be expected (since women live longer than men), there are more women than men in care homes, with an overall average in Jewishhomesof28%malesand72%females(inEnglandasawhole,thesefiguresare24%and76%respectively).81
JPR’s research has found that deciding on a care home can be extremely stressful. ‘Decision
80 Valins, 2002:8181 Ibid:86
Figure 11. Self-assessment of health according to age, Jewish population
Source: Graham et al, 2007:78
LLTI and not good health
0
1
2
3
4
5
6
0 to 15 years 16 to 49 years 50 to 64 years 65 and over
Per
cen
t
Jewish %
All E&W%

JPR Report April 2011 Key trends in the British Jewish community 37
makers’, or those people who decide on the facilityforalovedone,areusuallyaged50to64.They claim that location is the most important factor when deciding on a care home.82 Yet most Jews would prefer to stay in their own homes if at all possible, rather than go to a care home: when asked the question “how would you most like to be cared for in old age?’ overwhelmingly most people wanted to be cared for in their own homes, although a quarter of respondents chose a residential care home as their second choice. Most respondents preferred to go into a specifically Jewish care home.
The financial cost of care homes is clearly important. The majority of clients in JVS homes are state funded. However, many decision makers are fearful of the growing gap between government funding and the ‘actual cost’ of care, which is often much higher. The Jewish ethos of these care homes obligates them to take in anyone, even those people who cannot pay. However, this means that many homes are running at a loss and may therefore appear less desirable.83
Other forms of care provisionCare homes are not the only form of service provision for the elderly.84 In the UK, over 3,000 Jewish elderly people attend a day centre every week. In 2002, there were twenty-one formal Jewish day care centres for older people. The majority of these day centres provide a kosher lunch, and many provide transportation to and from the centre. There are a few day centres that specialize in care for people with Alzheimer’s or dementia; these also provide support for the main carers of these elderly.
Domiciliary care is another form of home care. There are many Jewish social workers who will come to a person’s home. For example, Jewish Care runs Kennedy Leigh Home Care service,
82 Ibid:12183 Ibid:17084 Ibid:75-80
which consists of a team of trained care assistants who visit people in their own homes and help them to remain independent. Jewish Care runs Admiral Nurse Service. These nurses help people with Alzheimer’s, dementia or memory loss problems.
Twenty-four Jewish organizations are members of the National Network for Jewish Social Housing. Together, these organizations have a total stock of approximately 4,000 flats and houses specifically for older Jewish people. The largest single provider is the Industrial Dwellings Society with over 1,200 units, although Jews occupy only one-fifth of these; other significant providers in London are B’nai B’rith, Jewish Blind and Disabled, and the Agudas Israel Housing Association. Three-quarters of the total housing stock is in London, and Jews do not occupy all of theallottedspace(Jewsoccupied2,700oftheseunits in 2002). The rest are offered to non-Jewish elderly. Outside London the key players are the Leeds Jewish Housing Association, Liverpool Jewish Housing Association, Manchester Jewish Housing Association and Glasgow Jewish Housing Association.
The role of volunteersIt is important to be aware of the high levels of volunteering in the Jewish community. JPR has estimated that the total value to the Jewish community of unpaid staff is equivalent to £360 million per annum.85 In terms of elderly care, Jewish volunteers provide a range of essential services, including the delivery of meals-on-wheels, the befriending of individuals in care homes, driving clients to and from facilities or events, assisting in art classes, entertaining clients, or working in shops located in community centres. In this way, they offer a cost-saving service to Jewish organizations, and help to create a Jewish atmosphere in Jewish care homes.
85 Ibid., p.184


JPR Report April 2011 Key trends in the British Jewish community 39
Appendix 6 Demography and Jewish identity
Sociological and societal contextThis brief section identifies five of the major sociological factors that are shaping both contemporary British society and the British Jewish community. They are included as they ought to be considered alongside the data in the course of any policy development process.
Individualism and identity
• Individualismstressesfreechoice,personalwill and self-fulfillment, and maintains that the individual is the most important resource for a successful society.
• Individualidentityusedtobeunderstoodasstatic and inherited based on culture, religion or social standing. Today, identity is believed to be an expression of individual free choice.
• Peoplearegenerallyconsideredtohavemultiple identities, all of which are shifting and contingent on time, place and context.
• Jewishidentityisfarmorefluidandchangeablethan ever before.
• Jewsareincreasinglybecoming‘sovereignselves’ – making decisions about their Jewish practices on the basis of what is personally meaningful, rather than on the authority of an external force (e.g. God, halacha, community).
Religion in a (not quite) secular era
• Manyclassicaltheorists86 assumed that notions of collective religious belonging would be incompatible with modern theories of individualism and identity.87
• Ingeneral,theUKhasexperiencedsecularization: in Jewish terms, synagogue affiliation has clearly declined, an increasing number of British Jews think about their Jewish identity in cultural or ethnic terms, and they do not necessarily regard membership to a synagogue as a prerequisite for belonging.
86 For example, Marx, Durkeim and Weber.87 Berger1969,1974.
• Nevertheless,increasingdiversificationhasledto the revitalization of religious communities, particularly amongst groups new to Britain.88 For some, religious belief is an important way of maintaining an identity that is separate from ‘mainstream’ Britishness, and religious schools and community centres often become the heart of these communities.89 Although British Jewry has had a strong presence in the UK for over three hundred years, some of these same patterns are evident within the community.
• Notably,Jewishdayschoolshavebecomemuchmore popular in recent years, fuelled in part by a growing concern about the continuity and renewal of British Jewry, and numerous new cultural and educational initiatives have been established in the past two decades to meet these challenges.
Opportunities for women and changing family structures
• OpportunitiesforwomenintheUKchangedradically in the mid-twentieth century as a result of the ‘sexual revolution.’
• Today,womenmakeupmorethan60%ofpeople entering universities, and it is not uncommon for married women to earn more money than their husbands (although the genderpaygapwasstill12.2%infavourofmenin 2008).90
• ThestructureoffamiliesintheUKhasalsoshifted as more opportunities have arisen for women. Today, women are having fewer children,withanaverageof1.9childrenin2007(down from nearly 3 in 1960).91
88 Ibid., 1999.89 Chaves 2004.90 http://www.statistics.gov.uk/STATBASE/ssdataset.
asp?vlnk=635691 http://www.statistics.gov.uk/cci/nugget.asp?ID=951

40 JPR Report April 2011 Key trends in the British Jewish community
• Womentendtogetmarriedatalaterage(28,ascomparedwith25in1961).92
• Divorcehasbecomemoresociallyacceptable,allowing women to leave unhappy marriages more easily.
• Jewishwomenarestillmorelikelytomarryand remain married, but compared to a generation ago, more Jewish women are living alone and those that do get married do so later and have fewer children. Divorce has also become far more commonplace in many parts of the community.
Multiculturalism and cohesion
• TheLabourgovernment’scommunitycohesionagenda emphasized integration rather than assimilation: minority communities have been encouraged to maintain their own cultures, religions and traditions as long as these do not conflict with the values of Britishness.
• Criticsofthisagendaoftenexpressconcernsabout the rise of Islamic extremism, and, in this context, it is a relatively short step to tar other religious minorities with a similar brush.
• TheLabourgovernmentoftenreferredtoBritish Jews as ‘the model minority’: integrated fully into British society, while successfully retaining their own character, culture and religious traditions.93
Technology
• Internetandmobilephonetechnologyhascreated an environment in which new forms of community can be developed.
• Wherepreviouslycommunitiestendedtobegeographically-based with clear boundaries limiting access both in and out, new forms of technology remove many geographical limitations and reduce the controlling influence of boundaries.
92 World Bank, World Development Indicators - Last updated February 3, 2010. http://www.google.com/publicdata?ds=wb-wdi&met=sp_dyn_tfrt_in&idim=country:GBR&dl=en&hl=en&q=fertility+rates+UK
93 Worley,2005.
• IntheJewishcommunalcontext,thisoftenserves to strengthen and multiply links between Jews around the world, and create new platforms for cooperation and collaboration.
• ItalsomeansthatJewshaveunfetteredaccessto a far wider range of Jewish and non-Jewish options than ever before.
• Theseshiftsareneitherwhollygoodnorwholly bad; consideration of their presence and impact, however, is becoming more and more of an imperative.
Other contemporary factors
In addition to the issues outlined above, one should also be conscious of the following factors when drawing up policy relating to the UK Jewish community. They are somewhat speculative, but nevertheless based, in part, on the analysis of Professor Jonathan Sarna in work he has done for JPR.
• Theeconomicclimate:governmentplanstoreduce the structural budget deficit are likely to affect income levels across the country as taxation increases.
• Charitablegiving:reducedincomelevelsmaywell reduce the number and size of donations to Jewish charities.
• Affiliation:reducedincomelevelsmayalso have an adverse effect on synagogue membership numbers, and on participation in costly communal institutions and activities.
• Mergers:reducedincomemayresultinmergers between Jewish organizations, or even replacement of Jewish services by statutory or non-Jewish services.
• Aliyah (emigration to Israel): if jobs begin to disappear in the UK, we may see higher levels of emigration to Israel.
• Antisemitism:datareportingincreasedorhighlevels of antisemitism in the UK may result in a greater share of communal funds being invested in defence over and above welfare and education.
• Israel:higherlevelsofcriticismofIsraelmayresult in a greater share of communal funds

JPR Report April 2011 Key trends in the British Jewish community 41
being invested in Israel education and advocacy over and above welfare and education.
• Increasedvolunteering:ifwelfare-relatedissuesbecome more acute, and if the new
government’s plans to devolve responsibility to local communities are actualized, we may require, and indeed, come to rely on, increased levels of volunteering in the Jewish community to help plug gaps in existing services.


JPR Report April 2011 Key trends in the British Jewish community 43
Bibliography and suggested readingBecher H., Waterman S., Kosmin B. and Thomson K. (2002). A portrait of Jews in London and the South-east: a community study. Institute for Jewish Policy Research: London.
Berger, P. (1969). A Rumor of Angels: Modern Society and the Rediscovery of the Supernatural. Anchor Books.
Chaves, M. (2004). Congregations in America. Harvard University Press.
CommissiononJewishSchools(2007).The Future of Jewish Schools. Jewish Leadership Council: London.
Dorling, D., and Thomas, B. (2004). People and places: A 2001 Census atlas of the UK. The Policy Press: Bristol.
Dunnell, K. (2008). Ageing and Mortality in the UK National Statistician’s Annual Article on the Population, Population Trends #134, ONS.
HarrisM.(1997).The Jewish voluntary sector in the United Kingdom: its role and its future. Institute for Jewish Policy Research: London.
Graham D. (2003). Secular or religious? The outlook of London’s Jews. Institute for Jewish Policy Research: London.
Graham D. (2004). European Jewish Identity at the Dawn of the 21st Century: A Working Paper. Institute for Jewish Policy Research: London.
GrahamD.,SchmoolM.,andWatermanS.(2007).Jews in Britain: a snapshot from the 2001 Census. Institute for Jewish Policy Research: London.
Graham,D.andVulkan,D.(2007).Report for the Commission on Jewish Schools. Jewish Leadership Council: London.
Graham, D. and Vulkan, D. (2008). Britain’s Jewish Community Statistics 2007. Board of Deputies of British Jews: London.
Graham, D. and Vulkan, D. (2008). Population Trends among Britain’s Strictly Orthodox Jews. Board of Deputies of British Jews: London.
Graham, D. and Vulkan, D. (2010). Synagogue Membership in the United Kingdom in 2010. JPR/Board of Deputies of British Jews: London. GrahamD.,andWaterman,S.(2005).Under-numeration of the Jewish Population in the 2001 Census. Population, Space and Place 11 (2) 89-102.
GoldbergJ.,andKosminB.(1997).The social attitudes of unmarried young Jews in contemporary Britain. Institute for Jewish Policy Research: London.
Goldberg J., and Kosmin B. (1998). Patterns of charitable giving among British Jews. Institute for Jewish Policy Research, London.
Halfpenny, P., and Reid, M. (2000). The financial resources of the Jewish Voluntary Sector. Centre for Applied Social Research, University of Manchester, Institute for Jewish Policy Research: London.
Harris,M.(1997).The Jewish Voluntary Sector in the United Kingdom: its role and its future. Institute for Jewish Policy Research: London.
Hart, R. and Kafka, E. (2006). Trends in British Synagogue Membership, 1990 – 2005/6. Board of Deputies of British Jews: London.
Hersov,E.(2005).What does being Jewish mean to you? The spiritual needs of Jewish people with learning disabilities and their families. The Judith Trust: London.
Holman, C. & Holman, N. (2002). Torah, Worship and Acts of Loving Kindness: Baseline Indicators for the Charedi Community in Stamford Hill. De Montfort University: Leicester.
Hope, C. Pre-Budge Report: Free School Meals Extended to 500,000 Primary School Children. 9 December 2009. http://www.telegraph.co.uk/finance/personalfinance/how-budget-affect-me/6771124/Pre-Budget-Report-Free-school-

44 JPR Report April 2011 Key trends in the British Jewish community
meals-extended-to-500000-primary-school-children.html. Accessed 10/01/10.
Institute for Jewish Policy Research (2003). Long-term planning for British Jewry: final report and recommendations. Institute for Jewish Policy Research: London.
Kosmin, B., and Goldberg, J. (1998). Patterns of charitable giving among British Jews. Institute for Jewish Policy Research: London.
Miller, S.M., Schmool, M., and Lerman, A. (1996). Social and political attitudes of British Jews: Some key findings of the JPR Survey. Institute for Jewish Policy Research: London.
Sarna, J. (2009). The Economic downturn and the future of Jewish communities. Institute for Jewish Policy Research: London.
Schlesinger, E. (2000). Grant-making trusts in the Jewish sector. Institute for Jewish Policy Research: London.
Schmool, M., and Cohen, F. (2002). British Synagogue membership in 2001. Board of Deputies of British Jews: London.
Valins, O. (2002). Facing the future: the provision of long-term care facilities for older Jewish people
in the United Kingdom. Institute for Jewish Policy Research: London.
Valins, O. (2003). The Jewish Day School Marketplace: The attitudes of Jewish parents in General London and the South-east towards formal education. Institute for Jewish Policy Research: London.
Valins, O., and Kosmin, B. (2003). The Jewish day school marketplace: The attitudes of Jewish parents in Greater London and the South-east towards formal education. Institute for Jewish Policy Research: London.
Valins, O., Kosmin, B., & Goldberg, J. (2001). The future of Jewish schooling in the United Kingdom. Institute for Jewish Policy Research:London.
Waterman, S., and Kosmin, B. (1986). British Jewry in the Eighties. A Statistical and Geographical Study. Board of Deputies of British Jews: London.
Waterman, S. (2003). The Jews of Leeds in 2001: portrait of a community. Institute for Jewish Policy Research: London.
Worley,C.(2005). It’s not about Race, it’s about the Community’: New Labour and Community Cohesion, in: Critical Social Policy,vol.25no.4,pp.483-496.

JPR Report April 2011 Key trends in the British Jewish community 45
Selection of websites consulted
Alzheimer’s Society: www.alzheimers.org.uk
BBC: www.bbc.co.uk
Board of Deputies of British Jews: www.boardofdeputies.org.uk
Centre for Disability Research: www.lancs.ac.uk/cedr/
Department for Education: www.education.gov.uk
Department of Health: www.dh.gov.uk
Department for Work and Pensions: www.dwp.gov.uk
End Child Poverty: www.endchildpoverty.org.uk
Foundation for People with Learning Disabilities: www.learningdisabilities.org.uk
HM Government: www.direct.gov.uk
Institute for Jewish Policy Research: www.jpr.org.uk (note that all JPR publications are available to download on this website)
Jewish Care: www.jewishcare.org
Joseph Rowntree Foundation: www.jrf.org.uk
Norwood: www.norwood.org.uk
Office for Disability Issues: www.odi.gov.uk
Office for National Statistics: www.statistics.gov.uk
Times Educational Supplement: www.tes.co.uk
World Bank: www.worldbank.org


Institute for Jewish Policy Research
© Institute for Jewish Policy Research 2011
All rights reserved. No part of this publication may be reprinted or reproduced or utilized in any form or by any means, now known or hereinafter invented, including photocopying and recording or in any information storage or retrieval system, without the permission in writing of the publisher.
jpr / report
Published by Institute for Jewish Policy Research
4th Floor, 7-8 Market Place London W1W 8AGtel +44 (0)20 7436 1553 fax +44 (0)20 7436 7262 e-mail [email protected] website www.jpr.org.uk
Registered Charity No. 252626