Jpopooopppo - toyo-eng.com · TOYO’s current business environment presents opportunities for...
56
Transcript of Jpopooopppo - toyo-eng.com · TOYO’s current business environment presents opportunities for...
Toyo Engineering Corporation
2-8-1 Akanehama,
Narashino-shi, Chiba 275-0024, Japan
Tel: 81-47-451-1111 Fax: 81-47-454-1800
http://www.toyo-eng.co.jp/
©2012 Toyo Engineering Corp. Printed in Japan

Annual Report 2012
Toyo Engineering Corporation (TOYO) is one of the world’s leading
contractors. Since its foundation in 1961, TOYO has actively deployed
Engineering, Procurement, and Construction (EPC) business, and has
successfully delivered large and complex projects in more than 50
countries. TOYO’s engineering business focuses on the segments
of Energy, Oil Refining, Petrochemicals & Chemicals, Oil & Gas
Development, Infrastructure, Environment, and other manufacturing
facilities.
We have a globally networked organization which makes us
capable of executing work based on common work standards in
close cooperation with our overseas group companies as well as in
an optimal formation. Under the mission entitled “Engineering for
Sustainable Growth of the Global Community,” our overseas group
companies maintain and strengthen TOYO’s reliability and assure
clients that projects will be delivered safely, to a high-quality standard,
and on schedule.
Corporate Profile
01 To Our Shareholders
02 Consolidated Five-Year Financial Summary
04 President’s Message
10 HSSE + Quality
Financial Section
12 Corporate Governance
13 Business Risk and Other Risks
14 Management’s Discussion and Analysis
17 Major Projects
18 Consolidated Balance Sheets
20 Consolidated Statements of Income
21 Consolidated Statements of Comprehensive Income
22 Consolidated Statements of Changes in Net Assets
23 Consolidated Statements of Cash Flows
24 Notes to Consolidated Financial Statements
49 Independent Auditor’s Report
50 Corporate Information
53 Stock Information
DEFINITION OF TERMS
Fiscal 2011 means the fiscal year ended March 31,
2012 (April 1, 2011–March 31, 2012).
The word, mark, logo or any sign with a symbol
“TM” means that it is a registered trademark of
Toyo Engineering Corporation in Japan.
CAUTION CONCERNING FORWARD-LOOKING
STATEMENTS
This annual report includes certain “forward-looking
statements.” These statements are based on
management’ s current expectations and are subject
to uncertainty and changes in circumstances. Actual
results may differ due to changes in economic,
business, competitive, technological, regulatory,
and other factors.
CONTENTS

01TOYO ENGINEERING CORPORATION
Katsumoto IshibashiPresident and Chief Executive Officer
To Our Shareholders
As of June 27, 2012, I was appointed as President and CEO of Toyo Engineering Corporation. Succeeding to this post from former President Yutaka Yamada, I will, under a new organization, continue our course toward TOYO’s goal of becoming a “Global Leading Engineering Partner.” By taking an aggressive management approach to achieving new growth, I will endeavor to reach our management goals and to further enhance TOYO’s corporate value. TOYO’s current business environment presents opportunities for growth. In emerging countries, capital investment is increasing to meet the demand for basic materials due to growing populations and progressive urbanization. I also believe we will see an expansion of investment for social infrastructure and fertilizer plants. In addition, we can expect growth in investment for energy infrastructure due to the increase of unconventional oil and gas from shale and oil sands. Amid these trends, our business scope is expanding from downstream to upstream. On the other hand, we expect competition will further intensify with contractors in Europe and Korea, which are expanding their scale of operations. To survive these changes in our markets and achieve sustained growth, TOYO will further refine its strengths and establish a firm base on them to differentiate itself from others in the market. At the same time, I believe it is essential to develop new products and business models. With these factors in mind, we kicked off our new medium-term business plan, NEXT TOYO 2015, in April 2012. We are committing all of our resources and capabilities to attaining the goals of this plan and to further strengthening the global operation system that we have been building up to now. We will steadily expand new products, business models, and operating regions and take on a challenge to build new growth for TOYO. We have designed a new symbol logo for TOYO commonly applied in the group and introduced it in July 2012. The new logo keeps the motif of the previous logo while inspiring the impression of a leap forward into the future. The logo’s emphasis of the letters of TOYO symbolizes the entire group collaborating to achieve new growth. As we work to fulfill the symbolism of the logo, I look forward to the continued support of our shareholders.
August 2012

Consolidated Five-Year Financial Summary
Consolidated Five-Year Financial SummaryToyo Engineering Corporation and Consolidated Subsidiaries Years ended March 31
*U.S. dollar amounts are stated at ¥ 82.13 to U.S.$1.00, the exchange rate prevailing on March 31, 2012.
Annual Report 2012 02
¥ 326,248
34,751
15,167
13,036
6,515
199,412
58,509
19,916
513
2,366
18,198
119,265
224,415
¥ 33.91
294.71
7.00
6.9%
29.2
14.0
35.1
10.6
4.2
(78)
3,769
2009
¥ 157,881
24,918
5,341
4,941
3,728
222,415
69,265
24,582
1,595
2,524
18,198
269,188
359,120
¥ 19.43
349.42
6.00
10.0%
15.3
11.5
35.2
20.3
7.7
(73)
4,494
2012
¥ 155,696
26,573
6,815
6,917
3,773
198,387
67,096
15,163
542
2,473
18,198
222,540
224,693
¥ 19.65
340.43
5.00
6.9%
22.8
23.8
18.7
20.0
7.8
(64)
3,956
2011
¥ 173,943
32,983
13,070
14,236
7,131
190,127
65,295
21,947
508
2,237
18,198
132,456
168,179
¥ 37.12
329.54
7.00
14.0%
23.9
27.6
14.4
13.1
7.0
(71)
4,024
2010
Net sales
Gross profit
Operating income
Income before income taxes
Net income
Total assets
Total net assets
Long-term loans payable
Purchase of property, plant and equipment
Depreciation and amortization
Capital stock
New orders
Backlog of contracts at end of the year
Net income
Total net assets
Cash dividends
Net sales by sector (%):
Chemical fertilizers
Petrochemicals
Refinery
Energy-related
General manufacturing facilities and information technology
Others
(Overseas sales ratio)
Number of employees
Per share:

New orders
`12`11`10`09`08
269.1
222.5
132.4119.2
268.6
Backlog of contracts at end of the year
`12`11`10`09`08
444.4
224.4168.1
224.6
359.1
Net sales (¥ billion)
(¥ billion)
(¥ billion)
(¥ billion)
(¥ billion)
(¥ billion)
`12`11`10`09`08
157.8155.6173.9
326.2327.4
Operating income
`12`11`10`09`08
5.36.8
13.0
15.113.7
Net income
`12`11`10`09`08
3.73.7
7.16.5
8.0
Total assets
222.4198.3190.1199.4
280.1
`12`11`10`09`08
Thousands of U.S. dollars*
U.S. dollars*
Millions of yen
Yen
03TOYO ENGINEERING CORPORATIONConsolidated Five-Year Financial Summary
¥ 327,413
34,423
13,741
14,908
8,029
280,138
57,331
22,038
830
2,511
18,198
268,692
444,433
¥ 41.76
283.98
6.00
1.9%
28.7
8.8
43.7
11.8
5.1
(78)
3,527
$ 1,922,338
303,402
65,034
60,172
45,399
2,708,092
843,369
299,317
19,427
30,742
221,587
3,277,590
4,372,583
$ 0.23
4.25
0.07
20122008

Annual Report 2012 04President’s Message 04 Annual Report 2012
Focusing on New Growth with TOYO’s Consolidated Efforts
President
Katsumoto Ishibashi
talks about
the new medium-term
business plan,
NEXT TOYO 2015

05TOYO ENGINEERING CORPORATIONPresident’s Message
I would like to begin our annual report by explaining NEXT TOYO 2015. I will explain its background
and targets, basic policies and its major initiatives as well as TOYO’s divided policy. It is my hope that
this will assist shareholders and investors in more thoroughly understanding TOYO’s activities.
Summary of Previous Medium-Term Business Plans
Under its previous medium-term business plans,
TOYO made substantial progress in establishing
an integrated global operation system.
Before going into the details of NEXT TOYO
2015, I would like to review the previous two busi-
ness plans, implemented from fiscal 2006 to fiscal
2011, which provided the base for the new plan.
In 1976, TOYO established Toyo Engineering
India Limited. Since then, TOYO has worked to
build and expand a global network that provides
a comprehensive global business platform and
EPC (Engineering, Procurement, and Construc-
tion) functions. Under the catchphrase of “Global
Toyo” promoted by the medium-term busi-
ness plan from fiscal 2006 to fiscal 2008, TOYO
transformed overseas group companies in India,
Korea, China, Malaysia, and other countries into
independent profit centers. TOYO developed an
integrated global operation system where Toyo-
Japan and overseas group companies collaborate
closely to promote business.
The three-year medium-term business
plan from fiscal 2009 to fiscal 2011 focused on
three basic policies: respond to changes in busi-
ness type and field, advance Global Toyo, and
enhance human resources. To further develop
global management, we formulated TOYO’s
Mission, Vision, and Values (MVV) statement that
defined shared values for all TOYO employees.
TOYO strived for a goal defined as the Group
vision to become a “Global Leading Engineering
Partner.”
During the six-year period of these two
medium-term business plans, TOYO’s business
environment changed at a rapid pace. TOYO
faced sudden changes in its business climate,
including the global financial crisis initiated by
the Lehman Brothers collapse, the rise of emerg-
ing countries, the prolonged sovereign debt crisis
in Europe, the record high exchange rates for the
yen against the US dollar and the euro, and the
Great East Japan Earthquake and nuclear plant
incident thereafter. During this period, TOYO’s
management team tenaciously continued efforts
to achieve the goals of its medium-term busi-
ness plans. As a result, TOYO strengthened its
integrated global operation system, increased
orders for service-type projects, enhanced its ef-
forts in the oil & gas development field, expanded
business in the social infrastructure field, and
developed new products, such as the small- to
medium-scale Gas to Liquids (Micro-GTL) and
mid-scale LNG plants. In terms of a growth
05TOYO ENGINEERING CORPORATION
Challenge for New Growth (Millions of yen)
0
50,000
100,000
150,000
200,000
250,000
300,000
350,000
400,000 8,000
7,000
6,000
5,000
4,000
3,000
2,000
1,000
02006 2007 2008 2009 2010 2011 2012 2013 2014 2015 (FY)
The Medium-Term Corporate Strategic Planfor Fiscal 2006 to 2008
“Creating Global Toyo”
The Medium-Term Management Planfor Fiscal 2009 to 2011“Formulating TOYO’s
MVV Statement”
The Medium-Term Business Planfor Fiscal 2012 to 2015
Global Toyo for Client Value Enhancement
Net Sales (Left Scale)
New Orders (Left Scale)
Net Income (Right Scale)
Challenge forNew Growth!
NEXT TOYO 2015

Annual Report 2012 06President’s Message 06 Annual Report 2012
strategy, TOYO has been able to build the busi-
ness foundation for a future leap forward. During
the same period, TOYO also increased the num-
ber of employees at its existing overseas group
companies, brought new engineering companies
in Canada (Toyo-Canada) and Indonesia (PT.
Inti Karya Persada Tehnik) into TOYO, and also
invested in Atlatec, a water infrastructure project
integration company in Mexico. TOYO’s global
operations have become much more stable, and
international division of work has expanded. This
progress, in turn, has led to an improvement in
TOYO’s cost competitiveness.
Background and Targets of the New Medium-Term Business Plan
TOYO has positioned the next four years as a
stage to strive for new growth.
Currently, the global economy is showing
real signs of recovery, such as the economic
growth in Asia’s emerging countries. Several
concerns still remain however, such as height-
ened anxiety regarding the financial system in
Europe. Nevertheless, the consumer product
markets in emerging countries are growing
sharply against the background of population
growth and urbanization. In line with this growth,
robust investment sentiment continues, par-
ticularly in basic materials, fertilizers, and social
infrastructures. In addition, there is vigorous new
energy resource development of unconventional
oil and gas as well as other forms of energy on a
global scale.
With this business environment in mind, we
formulated NEXT TOYO 2015, a medium-term
business plan that will cover the four-year period
starting in fiscal 2012. TOYO will pursue the fol-
lowing management goals, taking its first step
toward the next growth stage.
Starting with a numerical goal, TOYO is
targeting consolidated net income of ¥12 billion
in fiscal 2015, the fiscal year ending March 31,
2016. As we aim to build a framework that can
earn half of this target through overseas group
companies, we have set the consolidation ratio
of net income at 2.0. The premise to achieve this
target is imaged as consolidated orders of ¥450
billion, consolidated net sales of ¥420 billion,
both on an EPC basis, and consolidated oper-
ating income of ¥20 billion or more. The plan
targets to perform new orders and net sales at
a level more than ¥10 billion more than TOYO’s
record consolidated performances to date.
In order to reach these targets, we must
restructure Toyo-Japan’s operations, expand the
business scope of overseas group companies
and improve their earnings capacity as well as
business productivity. By enhancing the EPC
execution capabilities of its overseas group
companies, TOYO will achieve steady growth
and pursue maximization of its corporate value
at the same time by further pushing forward with
integration of its global operation system.
Leveraging TOYO’s advanced technology
and project execution capability, we will refine
TOYO’s inherent strengths and follow a differen-
tiation strategy in which we aim to become the
company to be selected by clients.
Basic Policies
The following are TOYO’s three basic policies for
achieving the goals of the new business plan.
Management Targets
Targets for the fiscal year ending March 31, 2016
Consolidated net income:
Dividend payout ratio:
¥12 billion(Consolidation ratio of net income: 2.0)
25%

07TOYO ENGINEERING CORPORATIONPresident’s Message
Prioritized Markets
TOYO’s prioritized markets include Japan, East
Asia, Southeast Asia, Latin America, India, and
the Middle East. These are regions where TOYO
has accumulated a strong record of successful
projects. TOYO has overseas group companies
with EPC functions well-rooted there. These
companies not only cooperate with Toyo-Japan,
but also independently strive to win orders. In
February 2012, we further expanded our EPC
network by investing in PT. Inti Karya Persada
Tehnik (IKPT), a leading engineering company in
Indonesia. Moreover, in Brazil, we established a
joint venture company with a leading local engi-
neering company to mutually target onshore and
offshore EPC projects. TOYO is actively trying to
capture orders in prioritized markets with growth
potential, based on the relationship of trust built
with clients and partners over the years through
the many projects.
Frontier Markets
TOYO’s frontier markets are Russia and other
Commonwealth of Independent States (CIS)
countries, North America, Iraq, and Sub-Saharan
Africa. These are regions where TOYO is seeking
to develop or more intensely cultivate markets.
In North America, TOYO expects that there will
be opportunities on unconventional energy-
related projects, such as shale gas and oil sands
projects. Led by our local companies in the
United States and Canada, we intend to aggres-
sively continue to target new projects. With their
abundant natural resources, Russia, Iraq, and
Sub-Saharan Africa are regions that can expect
high growth. Therefore, we are rapidly ramping
up activities to be able to meet their increasing
capital investment needs.
07TOYO ENGINEERING CORPORATION
The first basic policy is “Global Toyo to
TOYO.” Our strategy is to further enhance an
integrated global operation system, which
underpins TOYO’s leadership in the market. We
will turn the whole group organization, including
Toyo-Japan, into a single TOYO. With that
branding, TOYO expands its orders and sales by
providing TOYO’s highly trusted quality to cli-
ents around the world.
TOYO’s second basic policy is “More
toward Upstream.” Targeting growth by Toyo-
Japan, TOYO plans to expand its business to the
upstream sector and concentrate on upstream
work. There are two meanings of “upstream” in
this policy. One meaning is to expand TOYO’s
range of business from the hydrocarbon EPC
downstream sector to the upstream sector,
including oil and gas development. The other
meaning signifies TOYO’s participation in cli-
ents’ project planning right from the first stage
of project formation.
“Worthwhile Working Place” is TOYO’s
third business policy, which aims to develop
and strengthen global human capital. Engineer-
ing companies depend on the capability of
each employee and the collaborative power of
teamwork. We recognize that the value created
by human capital is TOYO’s source of growth.
TOYO will develop a corporate culture that at-
tracts human capital from around the world and
to upgrade its human resource management
system.
Regional Strategy
Prioritized and frontier markets—aiming to de-
velop new regions and expand TOYO’s market
presence.
PT. Inti Karya
Persada Tehnik
(IKPT)
“Global Toyo” to “TOYO”Integration of Global Operation System
More toward UpstreamUpstream Sector & Customer Value Chain
Worthwhile Working PlaceDevelopment of Global Human Capital

Annual Report 2012 08President’s Message 08 Annual Report 2012
Product Strategy
Maintaining the profits of existing businesses,
TOYO is concentrating on expanding the enhanc-
ing and fostering business areas.
Core Business Areas
In TOYO’s core business areas, where TOYO can
fully utilize its overseas group companies to ex-
ercise cost competitiveness, TOYO is working to
keep its volume of orders. These areas cover vari-
ous businesses in the downstream segment, in-
cluding fertilizers, petrochemicals, and oil refining
and gas processing. With converting inexpensive
gas into high-value added products like fertilizers
representing an option in the gas market, fertilizer
plant projects are emerging one after the other.
As one of the three major companies in the world
holding urea manufacturing technology, TOYO
sees this trend is an opportunity to expand orders.
TOYO is targeting an increase in its global share
of urea technology licensing and using that mar-
ket position to win orders for EPC projects. In the
petrochemicals field, TOYO views the recent move
towards new investment in mega petrochemical
complexes in Asia and other regions as a business
opportunity. In the field of oil refining and gas
processing, TOYO has expectations of new capital
investments by countries with oil and gas resourc-
es and consuming countries. Therefore, we are
continuing to target further orders in this field.
Enhancing Business Areas
TOYO’s enhancing business areas focus on
such fields as natural resource and energy
development, social infrastructure, and phar-
maceuticals in Japan. In the natural resources
and energy development field, TOYO is working
to comprehend the intensifying competition
among countries to acquire natural resource
rights and pursuing active involvement in relat-
ed value chains. In April 2012, TOYO concluded
Overseas Group CompaniesFocus on Implementation
Toyo-Japan Focuses on Expanding Business Areas and Markets
Enhancing BusinessAreas
Upstream (Energy Development, LNG), Social Infrastructure,Pharmaceuticals, Others
Core BusinessAreas
Fertilizers,Petrochemicals,Oil Refining and GasProcessing
Fostering BusinessAreas
Business Participation(Social Infrastructure, Energy Development)
Prioritized Markets
East Asia, Southeast Asia, Latin America,India, Middle East
Russia/CIS, North America,Iraq, Sub-Saharan Africa
Frontier Markets
Business Areas & Markets in Focus

09TOYO ENGINEERING CORPORATIONPresident’s Message 09TOYO ENGINEERING CORPORATION
a general engineering service agreement for oil
development with South Oil Company, a state-
owned oil company responsible for the southern
region of Iraq. In other areas, TOYO was awarded
six Floating Production Storage and Offloading
(FPSO) topsides projects jointly with MODEC,
Inc. Also, the Company is currently conducting a
verification test of a Micro-GTL plant which can
be mounted on an FPSO vessel. TOYO’s activities
in the LNG field include executing Front End
Engineering Design (FEED) for a mid-scale elec-
tric-motor-driven LNG plant in Australia. Recent-
ly, TOYO also participated in a bid for a floating
LNG project. In the social infrastructure segment,
TOYO is concentrating on the projects related to
electric power, water treatment, and transporta-
tion. In the power generation field, TOYO is cur-
rently executing gas-fired combined cycle electric
power plant projects in Thailand and Azerbaijan.
Our plans in the water treatment field center on
entering the market for projects that combine
EPC or Operation and Maintenance (O&M) con-
tracts with direct investment in the project. Our
focus for such projects will be mainly on emerg-
ing countries.
Fostering Business Areas
Drawing on TOYO’s knowledge in such con-
ventional business fields as providing FEED and
EPC projects, we are developing a new business
model where TOYO participates in operations to
the extent of investing in the business in some
cases. In other words, we are expanding our busi-
ness domain from providing “output” to clients,
such as design documents and plant facilities, to
involvement in the overall operations, covering
asset management including production facilities,
and production and maintenance. We will share
in the “outcome” of the business, including risks
and rewards.
Basic Policy for Profit Distribution
TOYO aims to achieve a dividend payout ratio of
25% and annual dividends of ¥15 per share for
fiscal 2015.
TOYO considers distributing profits to share-
holders as one of its top management issues.
Taking into consideration the need to replenish
internal reserves, which are our source of capital
for achieving sustained growth, we endeavor to
maintain stable dividends from a medium- to long-
term perspective. Under the NEXT TOYO 2015
plan there will be no change in this policy. Our
basic goal will be to achieve a dividend payout
ratio of 25%, while steadily increasing dividends
in line with the growth in our consolidated net
income. Specifically, in fiscal 2015, the last year
of the NEXT TOYO 2015 plan, we plan to pay an
annual dividend of ¥15 per share if the targeted
consolidated net income of ¥12 billion is achieved.
Since joining TOYO in 1977, I have steadily
gained experience and knowledge of the busi-
ness over the years. I joined the management of
TOYO in 2009 as an executive officer. I intend
to fully devote the leadership and enthusiasm
developed during my career to the execution of
the NEXT TOYO 2015 plan, and aim to achieve
TOYO’s expansion and the sustainable growth of
our corporate value. In meeting this challenge,
I look forward to the continued support of our
shareholders and investors.
Energy Development Facilities

Annual Report 2012 10HSSE + Quality
In 2011, in terms of TOYO’s safety record as defined by ILO, Lost Time Incident Rate (LTIR) was 0.09 and Total Recordable Incident Rate (TRIR) was 0.24. Although our TRIR is much improved from 0.53 in 2010, our LTIR is higher than 0.05 in 2010. We are not satisfied with this result, and shall strive to complete all jobs with no accidents and no harm to people. We are aware that humans make mistakes, therefore it is important to enhance the quality of safety training to facilitate proactive safety actions and to raise sensitivity toward risk and hazards that might lead to accidents. With the recognition that “Safety takes priority over everything else,” we con-tinuously implement safety training programs to foster the safety culture. TOYO’s overseas group companies have applied unified standards for safety management and moreover, through promoting standardization, TOYO is making its best effort to maintain and improve quality as well as safety. Loss of valuable human life must absolutely be prevented by all means in the process of TOYO’s business solutions, such as plant construction. Our efforts, time and expenses spent to respect human life must take precedence over all other things.
Safety & Environmental Report 2012TOYO’s Safety & Environmental Report 2012 is available on our website. It introduces our various activities on safety and the environment during 2011.
Corporate Safety TrainingIn order to spread the culture of “safety is the first priority” among our employees, we carried out safety training for all corporate members in fiscal 2006. The training was aimed at all employees, not only employees at construction sites. Only employees trained by the Corporate Safety Training Program are allowed to enter our construction sites. In fiscal 2011, we also carried out renewal safety training for all corporate members to maintain and foster safety culture and knowledge.
Leadership of Site ManagementOur main goal is to hand over superior facilities to our clients through engineering, procurement, construction and commission-ing work without any accident or injuries. For this purpose, espe-cially strong safety leadership of site management, Project Manag-ers (PM), Field Managers (FM) and Construction Managers (CM) is extremely important.
“Safety First” is not simply a slogan.“Safety” is an integral part of the TOYO brand.
Safety and EnvironmentalReport
2012

11TOYO ENGINEERING CORPORATION
Project SQE (Safety, Quality, and Environment) Management DepartmentThe Project SQE Management Department, established in April 2010 for the improvement of SQE management function in TOYO’s executed projects, has been training personnel for performing PQM (Project Quality Manager) and HSSEM (Health, Safety, Security and Environment Manager) roles. For this purpose, the department also facilitates the accumulation and improvement of SQE related know-how, which can be applied in all following projects and proposals.
Feedback Knowledge Management System (FKMS)As part of the continual improvement of the Quality Management System, TOYO has been accumulat-ing feedback and knowledge for about 30 years from executed projects in the FKMS. Recently, FKMS has been reconfigured to accept and share the feedback and knowledge from TOYO’s overseas group companies, thereby the feedback and knowledge can be extended and utilized among all TOYO’s overseas group companies immediately for suggestions and preventive actions in all following proj-ects and proposals.
TOYO’s StandardsTOYO holds its own standards, which have been established on cumulative knowledge and experi-ence gained from a number of projects TOYO has accomplished around the world. With TOYO’s Standards consisting of TOYO-Group Standards (TGS) and the Local Standards (LS) of each overseas group company, along with due care of clients’ requirements, TOYO guarantees to always provide high-quality products and services.
Environment Micro Gas to Liquids (Micro-GTL) TOYO has been developing a compact, cost efficient Micro-GTL process jointly with Velocys, Inc., and MODEC, Inc. The main feature of Micro-GTL technology is the use of micro-channel reactors, for which Velocys, Inc. holds the master patent. TOYO integrates micro-channel reactors with other facilities such as equipment, piping, electrical and instrument, etc., resulting in a compact plant. A compact plant enables modulation and makes small- and medium-sized GTL facilities more economical. Therefore, Micro-GTL plants can be installed not only onshore, but also offshore, onboard a ship (FPSO). The development of Micro-GTL is reaching the final stage and TOYO is aiming to achieve commercialization by 2013.
Toyo-JapanLocal
Standards
Toyo-ChinaLocal
Standards
Toyo-KoreaLocal
Standards
Toyo-CanadaLocal
Standards
Toyo-MalaysiaLocal
Standards
Toyo-IndiaLocal
Standards
TOYO-GroupStandards
HSSE + Quality
Computer Graphic of GTL Facilities on a Ship

Annual Report 2012 12
Corporate Governance Structure (As of April 2012)
&
&
Sales Committee
Group Operation DivisionAudit/Guidance
Internal Control System The Auditing Department of TOYO, which is under the direct control of the President, performs audits concerning the execution of business activities by all divisions and verifies the appropriateness and effectiveness of the internal management structure, including compliance and risk management. In addition, there are specialized units to perform other internal audits, such as the SQE (Safety, Quality and Environment) Management Division and the Export Control Administration Division. In order to promote the Internal Control System of the Group, TOYO is making efforts to ensure proper operations across TOYO’s overseas group companies by establishing corporate procedures to strengthen the corporate administrative functions of each company.
Risk Management System For risk management concerning project profitability and financial matters within TOYO, all business operations are constantly monitored and supervised, and reports are submitted to the Board of Direc-tors, the Executive Committee, and the Board of Corporate Auditors. In addition, matters of particular importance concerning individual bidding and projects undergo a risk analysis overseen by the Project Risk Management Committee, and reports are submitted to the Executive Committee. TOYO has drawn up the Crisis Management Policy to clearly set forth risk management proce-dures to forestall serious risks (crises) that have the potential to seriously affect the operations of the Company. The Crisis Management Team is constantly prepared for potential crises.
Corporate Governance
13TOYO ENGINEERING CORPORATION
The following is a list of potential risks associated with the information concerning TOYO’s operating results and financial condition in this annual report that may have a significant bearing on investors’ decisions. This is not intended to be a complete list of these potential risks.
Business riskThe nature of our business activities, which mainly involve conducting projects worldwide, is exposed to the risks listed below. Any interruption or suspension in work due to these risks could have an ad-verse effect on our operating results and financial condition. We are aware of the possibility that these risks may occur and are taking actions to reduce exposure to these risks by using export credit insur-ance, maintaining a Risk Management System, Risk Control Structure and taking other steps. ● War, civil commotion, riots, revolutions, coup d’état, terrorism and other unusual events in the
country where the project is carried out or in a neighboring country. ● Regional risks that occur particularly in an area near a project site, such as a surge of political un-
rest and a serious outbreak of an epidemic disease. ● Extraordinary natural phenomenon, such as earthquakes, floods, typhoons and other storms as
well as unusual weather, such as extreme heat or cold. ● Notable changes in a country’s commerce, trade, manufacturing, and financial policies, such as
license approvals, customs clearance, export and export controls, foreign exchange systems, com-munications, and taxes.
● A major and global contraction in capital investment activities in the Company’s business fields or a sharp decrease in opportunities to win orders due to intensified competition.
Foreign exchange fluctuationFor overseas plant construction contracts denominated in foreign currencies, the appreciation of the yen relative to the applicable foreign currency causes a reduction in the yen equivalent amount re-ceived. In addition, the yen’s appreciation makes us less price competitive when competing for new orders in foreign currencies. This could have an adverse effect on our operating results and financial condition. In response, the group uses foreign exchange forward contracts, procures materials and equipment in foreign currencies, utilizes the resources of its overseas companies and takes all otherpossible steps to minimize exposure to foreign exchange risk.
Sudden increases in prices of equipment, materials and constructionIn turnkey lump-sum contracts, the possibility exists of sudden and steep rises in the cost of equip-ment and materials, transportation, construction, labor and other items associated with a project, or of problems caused by tight demand and supplies of these items, due to rapid change in the international situation. The possibility also exists of cost increase caused by a supplier becoming insolvent or failure of quality control or delivery schedule delay by suppliers/sub-contractors. These events may deteriorate the profitability of a project affected by soaring cost, delivery delay and other problems. Such events may therefore have a detrimental effect on our operating results and financial condition. To reduce our exposure to these risks, we, developing our accountability system to clients and project management system in project execution, utilize our experience to enter into contracts that incorporate measures to offset these risks and gather information on market trends. To avoid an undue reliance on a particular supplier, we work on placing orders with a large number of suppliers and stringently monitor the finan-cial condition of suppliers. We also diversify contract conditions such as cost reimbursable basis to reduce our risks.
Business Risk and Other Risks

Annual Report 2012 14
In fiscal 2011, the overall Japanese economy remained sluggish despite signs of an upturn in some ar-eas, such as demand for recovery in the aftermath of the Great East Japan Earthquake. Overall, grow-ing uncertainty about corporate environment put downward pressure on the economy. In the global economy, concerns about the risk of a downturn brought on by the sovereign debt crisis in Europe could not be dispelled. However, robust economic activities and business investments have continued in emerging countries. Under this environment, TOYO actively conducted detailed marketing activities to capture orders in markets with strong potential. Domestically, we aimed to win orders for support services for clients in the O&M market, and projects in the pharmaceutical and industrial systems markets. Overseas, firm capital investments have continued in resource-rich countries supported by the high price of oil. Against the backdrop of economic development and population growth, the expansion of domestic demand drove robust capital investments in emerging countries, such as Brazil, China, and India. However, fierce competition became common during fiscal 2011 because Korean, Chinese, and other contractors stepped up their aggressive sales efforts not only in the Middle East, but also in Asia and other regions. In response, TOYO placed strategic emphasis on emerging markets, aggressively working to win orders in the energy, hydrocarbon, and social infrastructure fields. In addition, we strengthened our efforts to win upstream oil & gas development projects and expanded our service-type businesses in response to business transformations. At the same time, TOYO concentrated on exploiting projects in new regions, such as Iraq and Sub-Saharan Africa. TOYO also has taken steps to expand orders and improve profitability by meeting demand for Engineering, Procurement, and Construction (EPC) ser-vices in emerging markets. We expanded our global operations system, under which our overseas group companies inde-pendently and consistently manage all operations, from marketing to EPC services. Moreover, we have made progress in sharing marketing information among overseas group companies, integrated marketing activities, and sharing project management systems. TOYO also initiated measures to im-prove quality, safety and environmental management.
Performance Outline (Consolidated)
Net sales ¥ 157.8 billion (1% up)
Operating income ¥ 5.3 billion ( 22% down)
Net income ¥ 3.7 billion (1% down)
New orders ¥ 269.1 billion ( 21% up)
Cash dividends (annual) ¥ 6.00
Fiscal 2011 Business ResultsIn fiscal 2011, consolidated net sales increased ¥2.1 billion year on year, to ¥157.8 billion ($1,922 mil-lion). TOYO strove to achieve steady progress in implementing projects during fiscal 2011 such as power plants in Thailand and Azerbaijan, fertilizer plants in Venezuela, topsides of Floating Production Storage and Offloading (FPSO) in Brazil (MV23 Project), a Gas to Liquids (GTL) liquid processing unit in Qatar. However, operating income decreased ¥1.4 billion to ¥5.3 billion ($65 million) because of a decrease in the number of projects on a cost reimbursable basis and soft services. Net income totaled ¥3.7 billion ($45 million), about the same level as in fiscal 2010. New orders in fiscal 2011 increased ¥46.6 billion to ¥269.1 billion ($3,277 million), expanding largely our backlog of contracts at end of the year by ¥134.4 billion to ¥359.1 billion ($4,372 million). TOYO focused on winning EPC orders on a lump-sum turnkey basis, particularly energy-related orders. We strengthened marketing collaborations among our overseas group companies and conducted marketing activities targeting service-type businesses in response to the business transformations of our clients. Major orders acquired overseas during fiscal 2011 are mentioned below. In Japan, TOYO provided support services for clients to enter the overseas market and won projects from various new clients in the pharmaceutical and industrial systems market. Cash from operating activities was ¥5.7 billion ($69 million). The principal source of cash was in-come before income taxes and increase in advances received on uncompleted construction contracts.
Management’s Discussion and Analysis
15TOYO ENGINEERING CORPORATION
Cash used for investing activities was ¥2.4 billion ($29 million). This mainly represented expenditure on purchase of property, plant, equipment and investments in subsidiaries. Cash from financing activities was ¥102 million ($1.2 million), reflecting the redemption of bonds and proceeds from long-term loans payable. The result of the above cash flows was a net increase of ¥3.1 billion ($37 million) in cash and cash equivalents. TOYO’s dividend policy is to endeavor to distribute profits to shareholders in accordance with operating performance. We also strive to maintain stable dividends from a medium- to long-term per-spective while taking into consideration the need for internal reserves which form our business base. Fiscal 2011 dividends were ¥6.00, consisted of ¥5.00 per share as a common dividend and ¥1.00 as a commemorative dividend for our 50th anniversary.
Fiscal 2011 New OrdersAt ¥269.1 billion, consolidated new orders nearly reached TOYO’s original target of ¥280 billion. The following are the major projects won in fiscal 2011. ● Utility Facilities for Brazilian Large-Scale Petrochemical Complex
TOYO is building the utility facilities for the COMPERJ large-scale petrochemical complex in Rio de Janeiro. The facilities consist of water treatment facilities, a 260 MW power plant, and a steam supply facility, and are constructed by a three-company consortium consisting of TOYO, Brazilian UTC, and Odebrecht.
● Ethylene Plant in Egypt Jointly with local engineering company ENPPI, TOYO is constructing a 460,000 t/y ethylene plant and a 20,000 t/y butadiene extraction unit. This is the second and the largest ethylene plant that TOYO has built in Egypt. The Company completed the first 300,000 t/y ethylene plant in 2001.
● Two FPSO Topsides for BrazilTOYO built two FPSO topsides, for OSX and Petrobras, to be used in the pre-salt layer located offshore Brazil. The Singapore joint venture of MODEC and TOYO (MTOPS) received the order from MODEC’s Singapore subsidiary. These orders bring the total number of topsides TOYO was awarded to six.
● Energy Optimization of Ammonia Project in Saudi ArabiaTOYO is replacing and renovating equipment to optimize energy use at an existing ammonia plant and package boilers in Saudi Arabia.
● Large-Scale Synthetic Rubber Plant in IndiaTOYO is building a large-scale 120,000 t/y synthetic rubber plant in India. The plant is being construct-ed for Indian Synthetic Rubber Limited and this project is the largest EPC order ever received by Toyo-India.
● Butadiene Plant in IndonesiaTOYO is building Indonesia’s first 100,000 t/y butadiene plant. The plant is being constructed to meet the expansion of demand for synthetic rubber and its raw material butadiene to meet the growing demand for automotive tires in emerging countries.
● PMC Contract for Venezuelan Large-Scale Heavy Oil UpgradingTOYO is handling the Project Management Consultant (PMC) work with local engineering company Y&V for a heavy oil upgrading project at the Puerto La Cruz Refinery in Venezuela. The heavy oil comes from the Orinoco Oil Belt.
● Caprolactam Plant in ChinaTOYO is constructing a 200,000 t/y caprolactam plant in Nanjing, China, for DSM Nanjing Chemical Company Ltd., a joint venture between DSM and Sinopec Group. TOYO is providing Engineering, Procurement services and Construction management (EPsCm) for the project.
Management’s Discussion and Analysis
Annual Report 2012 16Management’s Discussion and Analysis
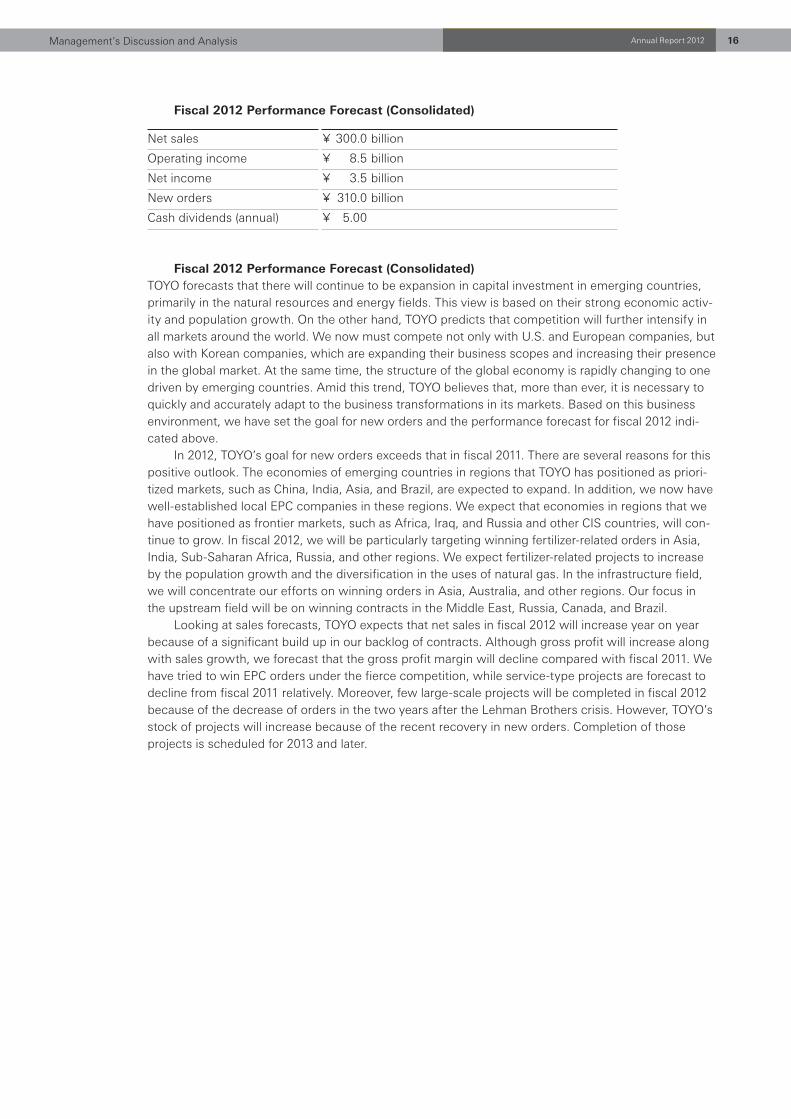
Fiscal 2012 Performance Forecast (Consolidated)
Net sales ¥ 300.0 billion
Operating income ¥ 8.5 billion
Net income ¥ 3.5 billion
New orders ¥ 310.0 billion
Cash dividends (annual) ¥ 5.00
Fiscal 2012 Performance Forecast (Consolidated)TOYO forecasts that there will continue to be expansion in capital investment in emerging countries, primarily in the natural resources and energy fields. This view is based on their strong economic activ-ity and population growth. On the other hand, TOYO predicts that competition will further intensify in all markets around the world. We now must compete not only with U.S. and European companies, but also with Korean companies, which are expanding their business scopes and increasing their presence in the global market. At the same time, the structure of the global economy is rapidly changing to one driven by emerging countries. Amid this trend, TOYO believes that, more than ever, it is necessary to quickly and accurately adapt to the business transformations in its markets. Based on this business environment, we have set the goal for new orders and the performance forecast for fiscal 2012 indi-cated above. In 2012, TOYO’s goal for new orders exceeds that in fiscal 2011. There are several reasons for this positive outlook. The economies of emerging countries in regions that TOYO has positioned as priori-tized markets, such as China, India, Asia, and Brazil, are expected to expand. In addition, we now have well-established local EPC companies in these regions. We expect that economies in regions that we have positioned as frontier markets, such as Africa, Iraq, and Russia and other CIS countries, will con-tinue to grow. In fiscal 2012, we will be particularly targeting winning fertilizer-related orders in Asia, India, Sub-Saharan Africa, Russia, and other regions. We expect fertilizer-related projects to increase by the population growth and the diversification in the uses of natural gas. In the infrastructure field, we will concentrate our efforts on winning orders in Asia, Australia, and other regions. Our focus in the upstream field will be on winning contracts in the Middle East, Russia, Canada, and Brazil. Looking at sales forecasts, TOYO expects that net sales in fiscal 2012 will increase year on year because of a significant build up in our backlog of contracts. Although gross profit will increase along with sales growth, we forecast that the gross profit margin will decline compared with fiscal 2011. We have tried to win EPC orders under the fierce competition, while service-type projects are forecast to decline from fiscal 2011 relatively. Moreover, few large-scale projects will be completed in fiscal 2012 because of the decrease of orders in the two years after the Lehman Brothers crisis. However, TOYO’s stock of projects will increase because of the recent recovery in new orders. Completion of those projects is scheduled for 2013 and later.

138
117
2
4
12
6
13 9
15145
10
New Orders
Name of Client Type Location Scope
1 Petróleo Brasileiro S.A. Refinery Utility Complex Brazil EPC (PETROBRAS)
2 Egyptian Ethylene and Derivatives Ethylene Plant and Butadiene Egypt EPC Company (ETHYDCO) Extraction Unit
3 OSX / MODEC, Inc. FPSO Topsides Brazil EPC
4 Al-Jubail Fertilizer Company Energy Optimization Saudi EPC (Albayroni) Project for Existing Ammonia Plant Arabia
5 DSM Nanjing Caprolactam Plant China EPsCm Chemical Company Ltd.
6 Indian Synthetic Rubber Limited (ISRL) Styrene-Butadiene Rubber (SBR) Plant India EPC
7 Petróleos de Venezuela, S.A. (PDVSA) Heavy Oil Upgrading Units Venezuela PMC
8 PETROBRAS / MODEC, Inc. FPSO Topsides Brazil EPC
Ongoing
9 GULF JP COMPANY LIMITED Small Power Producer Cogeneration Thailand EPC Plant (7 projects)
10 PT Pupuk Kalimantan Timur (Kaltim) Ammonia and Urea Plants Indonesia EPC
11 Petroquímica de Venezuela, S.A. (Pequiven) Ammonia and Urea Granulation Plants Venezuela EPC
12 Azerenerji Joint Stock Company Gas Combined Cycle Power Plant Azerbaijan EP
Completed
13 Qatar Shell GTL Limited Liquid Processing Unit of GTL Plant Qatar EPC 14 Lingyou Engineering-Plastics Polycarbonate Plant China EPC (Shanghai) Co., Ltd.
15 Dalian Sumika Jingang Chemicals Co., Ltd. Nutritional Feed Additive Manufacturing Facilities China EPsCm
EPC: Engineering, Procurement and ConstructionEPsCm: Engineering, Procurement service and Construction managementPMC: Project Management Contract
17TOYO ENGINEERING CORPORATIONMajor Projects
Financial Section 18 Annual Report 2012
Millions of yenThousands of U.S.
dollars (Note 1)
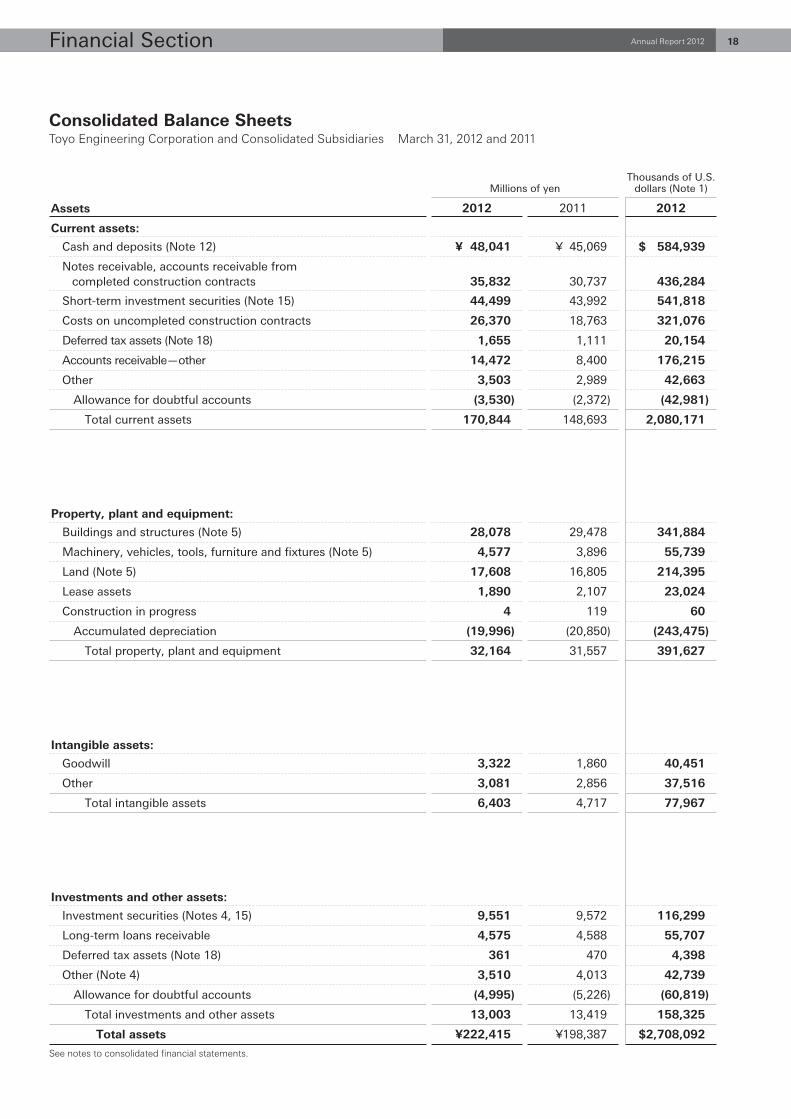
Assets 2012 2011 2012
Current assets:
Cash and deposits (Note 12) ¥ 48,041 ¥ 45,069 $ 584,939
Notes receivable, accounts receivable from completed construction contracts 35,832 30,737 436,284
Short-term investment securities (Note 15) 44,499 43,992 541,818
Costs on uncompleted construction contracts 26,370 18,763 321,076
Deferred tax assets (Note 18) 1,655 1,111 20,154
Accounts receivable—other 14,472 8,400 176,215
Other 3,503 2,989 42,663
Allowance for doubtful accounts (3,530) (2,372) (42,981)
Total current assets 170,844 148,693 2,080,171
Property, plant and equipment:
Buildings and structures (Note 5) 28,078 29,478 341,884
Machinery, vehicles, tools, furniture and fixtures (Note 5) 4,577 3,896 55,739
Land (Note 5) 17,608 16,805 214,395
Lease assets 1,890 2,107 23,024
Construction in progress 4 119 60
Accumulated depreciation (19,996) (20,850) (243,475)
Total property, plant and equipment 32,164 31,557 391,627
Intangible assets:
Goodwill 3,322 1,860 40,451
Other 3,081 2,856 37,516
Total intangible assets 6,403 4,717 77,967
Investments and other assets:
Investment securities (Notes 4, 15) 9,551 9,572 116,299
Long-term loans receivable 4,575 4,588 55,707
Deferred tax assets (Note 18) 361 470 4,398
Other (Note 4) 3,510 4,013 42,739
Allowance for doubtful accounts (4,995) (5,226) (60,819)
Total investments and other assets 13,003 13,419 158,325
Total assets ¥222,415 ¥198,387 $2,708,092
See notes to consolidated financial statements.
Consolidated Balance SheetsToyo Engineering Corporation and Consolidated Subsidiaries March 31, 2012 and 2011

Financial Section 19TOYO ENGINEERING CORPORATION
Millions of yenThousands of U.S.
dollars (Note 1)
Liabilities and Net Assets 2012 2011 2012
Current liabilities:
Notes payable, accounts payable for construction contracts and other ¥ 50,096 ¥ 40,811 $ 609,967
Short-term loans payable (Note 5) 12,983 18,774 158,088
Current portion of bonds (Note 5) — 1,000 —
Income taxes payable 355 533 4,323
Advances received on uncompleted construction contracts 46,164 33,951 562,085
Provision for bonuses 998 1,053 12,163
Provision for warranties for completed construction 596 1,892 7,257
Provision for loss on construction contracts 1,489 677 18,134
Provision for loss on disaster — 95 —
Other 5,263 6,472 64,091
Total current liabilities 117,947 105,261 1,436,110
Noncurrent liabilities:
Long-term loans payable (Note 5) 24,582 15,163 299,317
Lease obligations 913 1,281 11,121
Deferred tax liabilities (Note 18) 5 5 69
Provision for retirement benefits (Note 17) 5,314 4,971 64,713
Provision for repairs 913 842 11,124
Other 3,471 3,764 42,265
Total noncurrent liabilities 35,201 26,029 428,613
Total liabilities 153,149 131,290 1,864,723
Net assets:
Shareholders’ equity
Capital stock (Note 11) 18,198 18,198 221,587
Capital surplus 20,759 20,759 252,759
Retained earnings 31,203 28,434 379,929
Treasury stock (363) (347) (4,425)
Total shareholders’ equity 69,798 67,045 849,850
Accumulated other comprehensive income:
Valuation difference on available-for-sale securities 225 471 2,749
Deferred gains or losses on hedges (45) (18) (552)
Foreign currency translation adjustment (2,931) (2,157) (35,699)
Total accumulated other comprehensive income (2,751) (1,705) (33,502)
Minority interests 2,219 1,756 27,020
Total net assets 69,265 67,096 843,369
Contingent liabilities (Note 6)
Total liabilities and net assets ¥222,415 ¥198,387 $2,708,092

Financial Section 20 Annual Report 2012
Consolidated Statements of IncomeToyo Engineering Corporation and Consolidated Subsidiaries Years ended March 31, 2012 and 2011
Millions of yenThousands of U.S.
dollars (Note 1)
2012 2011 2012
Net sales ¥157,881 ¥155,696 $1,922,338
Cost of sales (Note 8) 132,963 129,123 1,618,935
Gross profit 24,918 26,573 303,402
Selling, general and administrative expenses (Notes 7, 8) 19,577 19,758 238,368
Operating income 5,341 6,815 65,034
Non-operating income:
Interest income 414 427 5,048
Dividends income 160 104 1,959
Equity in earnings of affiliates 543 608 6,615
Miscellaneous income 347 214 4,236
Total non-operating income 1,466 1,354 17,860
Non-operating expenses:
Interest expenses 1,064 771 12,956
Foreign exchange losses 151 175 1,847
Miscellaneous expenses 490 209 5,966
Total non-operating expenses 1,705 1,156 20,770
Ordinary income 5,102 7,012 62,124
Extraordinary loss:
Loss on valuation of investments in capital of subsidiaries and affiliates 160 — 1,951
Provision for loss on disaster — 95 —
Total extraordinary loss 160 95 1,951
Income before income taxes 4,941 6,917 60,172
Income taxes—current 1,454 3,768 17,708
Income taxes—deferred (255) (506) (3,109)
Total income taxes 1,198 3,262 14,598
Income before minority interests 3,743 3,654 45,574
Minority interests in income (loss) 14 (118) 174
Net income (Note 22) ¥ 3,728 ¥ 3,773 $ 45,399
See notes to consolidated financial statements.

Financial Section 21TOYO ENGINEERING CORPORATION
Millions of yenThousands of U.S.
dollars (Note 1)
2012 2011 2012
Income before minority interests ¥ 3,743 ¥3,654 $ 45,574
Other comprehensive income:
Valuation difference on available-for-sale securities (245) (147) (2,986)
Deferred gains or losses on hedges (26) 6 (326)
Foreign currency translation adjustment (784) (743) (9,556)
Share of other comprehensive income of associates accounted forusing equity method (88) (19) (1,082)
Total other comprehensive income (1,145) (903) (13,951)
Comprehensive income (Note 10) ¥ 2,597 ¥2,751 $ 31,622
Comprehensive income attributable to:
Owners of the parent 2,682 2,949 32,661
Minority interests ¥ (85) ¥ (198) $ (1,038)
See notes to consolidated financial statements.
Consolidated Statements of Comprehensive IncomeToyo Engineering Corporation and Consolidated Subsidiaries Years ended March 31, 2012 and 2011

Financial Section 22 Annual Report 2012
Consolidated Statements of Changes in Net Assets (Note 11)Toyo Engineering Corporation and Consolidated Subsidiaries Years ended March 31, 2012 and 2011
Millions of yen
Capitalstock
Capitalsurplus
Retainedearnings
Treasurystock
Valuation difference
on available-for-sale
securities
Deferredgains or
losses on hedges
Foreigncurrency
translationadjustment
Minorityinterests
Totalnet
assets
Balance at April 1, 2010 ¥18,198 ¥20,759 ¥25,525 ¥(315) ¥ 618 ¥(25) ¥(1,475) ¥2,009 ¥65,295
Dividends from surplus (864) (864)
Net income 3,773 3,773
Purchase of treasury stock (32) (32)
Disposal of treasury stock (0) 0 0
Net changes of items other than shareholders’ equity (147) 6 (682) (252) (1,075)
Balance at March 31, 2011 ¥18,198 ¥20,759 ¥28,434 ¥(347) ¥ 471 ¥(18) ¥(2,157) ¥1,756 ¥67,096
Balance at April 1, 2011 ¥18,198 ¥20,759 ¥28,434 ¥(347) ¥ 471 ¥(18) ¥(2,157) ¥1,756 ¥67,096
Dividends from surplus (959) (959)
Net income 3,728 3,728
Purchase of treasury stock (16) (16)
Disposal of treasury stock (0) 0 0
Net changes of items other than shareholders’ equity (245) (26) (774) 462 (583)
Balance at March 31, 2012 ¥18,198 ¥20,759 ¥31,203 ¥(363) ¥ 225 ¥(45) ¥(2,931) ¥2,219 ¥69,265
Thousands of U.S. dollars (Note 1)
Capitalstock
Capitalsurplus
Retainedearnings
Treasurystock
Valuation difference
on available-for-sale
securities
Deferredgains or
losses on hedges
Foreigncurrency
translationadjustment
Minorityinterests
Totalnet
assets
Balance at April 1, 2011 $221,587 $252,761 $346,214 $(4,234) $5,735 $(225) $(26,273) $21,391 $816,957
Dividends from surplus (11,684) (11,684)
Net income 45,399 45,399
Purchase of treasury stock (201) (201)
Disposal of treasury stock (2) 9 6
Net changes of items other than shareholders’ equity (2,986) (326) (9,425) 5,629 (7,108)
Balance at March 31, 2012 $221,587 $252,759 $379,929 $(4,425) $2,749 $(552) $(35,699) $27,020 $843,369
See notes to consolidated financial statements.

Financial Section 23TOYO ENGINEERING CORPORATION
Consolidated Statements of Cash FlowsToyo Engineering Corporation and Consolidated Subsidiaries Years ended March 31, 2012 and 2011
Millions of yenThousands of U.S.
dollars (Note 1)
2012 2011 2012Cash flows from operating activities:
Income before income taxes ¥ 4,941 ¥ 6,917 $ 60,172Depreciation and amortization 2,524 2,473 30,742Increase (decrease) in allowance for doubtful accounts 926 (76) 11,280Increase (decrease) in provision for retirement benefits (209) 162 (2,549)Increase (decrease) in provision for loss on construction contracts 812 (227) 9,888Increase (decrease) in provision for loss on disaster (95) 95 (1,160)Interest and dividends income (575) (531) (7,008)Interest expenses 1,064 771 12,956Foreign exchange losses (gains) (43) 11 (531)Equity in (earnings) losses of affiliates (543) (608) (6,615)Loss (gain) on valuation of investment securities 174 5 2,121Decrease (increase) in notes receivable, accounts receivable from completed construction contracts (3,848) (4,013) (46,861)Decrease (increase) in costs on uncompleted construction contracts (6,923) 2,950 (84,304)Decrease (increase) in accounts receivable—other (5,784) 3,722 (70,426)Increase (decrease) in notes and accounts payable—trade 7,835 6,064 95,404Increase (decrease) in advances received on uncompleted construction contracts 9,892 (1,512) 120,447Other, net (2,385) (1,069) (29,043)
Subtotal 7,762 15,135 94,514Interest and dividends income received 1,035 1,032 12,612Interest expenses paid (1,043) (781) (12,701)Income taxes paid (2,044) (4,081) (24,897)
Net cash provided by (used in) operating activities 5,710 11,305 69,527
Cash flows from investing activities:Net decrease (increase) in time deposits 940 (841) 11,446Purchase of property, plant and equipment (1,595) (542) (19,427)Proceeds from sales of property, plant and equipment 980 87 11,933Purchase of intangible assets (1,048) (1,157) (12,762)Purchase of investment securities (397) (305) (4,836)Proceeds from sales of investment securities 33 6 403Purchase of investments in subsidiaries (1,737) (2,562) (21,157)Collection of short-term loans receivable — 4,042 —Other, net 407 (97) 4,967
Net cash provided by (used in) investing activities (2,417) (1,371) (29,433)
Cash flows from financing activities:Net increase (decrease) in short-term loans payable 3,557 2,426 43,316Proceeds from long-term loans payable 13,200 7,600 160,720Repayment of long-term loans payable (14,063) (4,673) (171,233)Redemption of bonds (1,000) — (12,175)Repayments of finance lease obligations (565) (580) (6,882)Cash dividends paid (959) (864) (11,684)Other, net (66) (85) (813)
Net cash provided by (used in) financing activities 102 3,822 1,246Effect of exchange rate change on cash and cash equivalents (280) (374) (3,409)Net increase (decrease) in cash and cash equivalents 3,115 13,383 37,930Cash and cash equivalents at beginning of period 87,337 73,954 1,063,405Cash and cash equivalents at end of period (Note 12) ¥ 90,452 ¥87,337 $1,101,336See notes to consolidated financial statements.

Financial Section 24 Annual Report 2012
Notes to Consolidated Financial StatementsToyo Engineering Corporation and Consolidated Subsidiaries
1. BASIS OF PREPARATION
Toyo Engineering Corporation (the “Company”) and its domestic consolidated subsidiaries maintain their accounting records and prepare their financial statements in accordance with accounting principles generally accepted in Japan, and its overseas consolidated subsidiaries maintain their books of account in conformity with those of their respective countries of domicile. The accompanying consolidated financial statements have been compiled from the accounts prepared by the Company in accordance with the provisions set forth in the Financial Instruments and Exchange Law of Japan and with accounting principles generally accepted in Japan, which are different in certain respects as to the application and disclosure requirements of International Financial Reporting Standards. Certain reclassifications have been made to present the accompanying consolidated financial statements in a format which is familiar to readers outside Japan. For the convenience of readers, the accompanying consolidated financial statements and the relevant notes have also been presented in U.S. dollars by translating all Japanese yen amounts at the exchange rate of ¥82.13 to U.S.$1.00 prevailing on March 31, 2012.
2. SUMMARY OF SIGNIFICANT ACCOUNTING POLICIES
(a) Principles of ConsolidationThe accompanying consolidated financial statements include the accounts of the Company and its significant subsidiaries. Investment in significant affiliates is accounted for by the equity method. As of March 31, 2012, the numbers of consolidated subsidiaries and affiliates accounted for by the equity method were 14 and 3, respectively. Toyo Engineering Korea Limited, Toyo Engineering Corporation, China and 4 other subsidiaries are consolidated using their financial statements as of their respective fiscal year end, which falls on December 31, and necessary adjustments are made to their financial statements to reflect any significant transactions from January 1 to March 31. Intercompany accounts and transactions are eliminated in consolidation. The difference between the acquisition cost and the equity in the net assets at the time of acquisition is amortized in principle within twenty years on a straight-line basis.
(b) SecuritiesAll debt and equity securities other than equity securities issued by subsidiaries and affiliates are classified into one of three categories: trading, held-to-maturity, or available-for-sale securities. Trading securities are bought and held principally for the purpose of selling them in the near term. Held-to-maturity securities are those securities which the Company and its consolidated subsidiaries have the ability and intent to hold until maturity. All securities not included in trading or held-to-maturity are classified as available-for-sale securities. Trading securities are recorded at fair value. Held-to-maturity securities are recorded at amortized cost, adjusted for the amortization or accumulation of premiums or discounts. Unrealized gains or losses on trading securities are included in earnings. Short-term investment securities classified as available-for-sale securities are recorded at fair value with changes in unrealized holding gain or loss, net of the applicable income taxes, included directly in net assets. Non-marketable securities classified as available-for-sale securities are recorded at cost. Cost of securities sold is determined by the moving-average method.
(c) Derivative Financial InstrumentsThe Company and certain consolidated subsidiaries enter into various derivative transactions in order to manage certain risk arising from adverse fluctuations in foreign currency exchange rates and interest rates. Derivative financial instruments are carried at fair value with changes in unrealized gain or loss charged or credited to operations, except for those which meet the criteria for deferral hedge accounting under which unrealized gain of loss is deferred as a component of net assets. Deferral hedge accounting is adopted for derivatives which qualify as hedges, under which unrealized gain or loss is deferred. Hedging instruments are derivative transactions such as foreign exchange forward contract and interest rate swap, and hedged items are primarily forecast sales denominated in foreign currencies, and receivables and payables denominated in foreign currencies. Hedge effectiveness is not assessed if the substantial terms and conditions of the hedge instruments and the hedged forecasted transactions are the same. The Company and its consolidated manages its derivative transactions in accordance with its internal “Policies and Procedures for Risk Management.”
(d) Costs on Uncompleted Construction ContractsCosts on uncompleted construction contracts is stated at cost, determined by the identified-cost method.
(e) Depreciation and AmortizationDepreciation of property, plant and equipment is principally computed by the declining-balance method based on the estimated useful lives of the assets.

Financial Section 25TOYO ENGINEERING CORPORATION
However, buildings and rental properties acquired after April 1, 1998 are depreciated on a straight-line method. The useful lives of property, plant and equipment are as follows: Buildings and structures: 3 to 50 years Machinery, vehicles, tools, furniture and fixtures: 2 to 20 years Amortization of intangible assets of the Company and its consolidated subsidiaries is calculated principally by straight-line. Software is amortized on a straight-line method over 3 to 5 years of the estimated available period.
(f) LeasesDepreciation of assets on finance leases which do not transfer ownership of the leased assets to the lessee are calculated by the straight-line method over the lease period with their residual value zero.
(g) Allowance for Doubtful AccountsThe Company and its consolidated subsidiaries have provided an allowance for doubtful accounts at an estimated amount of probable and reasonably possible bad debts and an estimated amount computed on the actual percentage of credit losses.
(h) Provision for BonusesProvision for bonuses to employees is provided at the expected payment amount for the fiscal year.
(i) Provision for Warranties for Completed ConstructionProvision for warranties for completed construction is provided based on past experience.
(j) Provision for Retirement BenefitsThe provision for retirement benefits at the year-end are stated in accordance with the projected plan assets and the projected benefit obligation. The difference arising from the adoption of the new standard of accounting of ¥3,695 million ($45,000 thousand) is amortized over 15 years by the straight-line method. Actuarial gain or loss is amortized by the straight-line method over nine years within the average of the estimated remaining service years of the employees in the year following the year of recognition. Prior service cost is amortized as incurred over 13 years within the average of the estimated remaining service years when incurred.
(k) Provision for Loss on Construction ContractsProvision for loss on construction contracts is provided in case the material loss is forecasted for a certain large-scale contract work. The amounts of loss on costs on uncompleted construction contracts of ¥747 million ($9,097 thousand) is included in provision for loss on construction contracts and shown as a liability, not as a deduction from the amount of costs on uncompleted construction contracts. The amount of provision for loss on construction contracts included in cost of sales is ¥1,077 million ($13,118 thousand).
(l) Provision for RepairsThe Company and its consolidated subsidiaries have provided provision for repair at estimated amount for preparing the expenditure for major repairs. The Company provides a portion of estimated expenditure equally divided to each fiscal term from decision of repair plan to end of repair work.
(m) Provision for Loss on DisasterThe Company and its consolidated subsidiaries have provided Provision for loss on disaster at estimated amount for preparing the expenditure to recover from the Great East Japan Earthquake.
(n) Foreign Currency TranslationBoth short-term and long-term receivables and payables in foreign currencies are translated at the rates of exchange in effect at the balance sheet date and differences arising from the translation are included in the consolidated statements of income. The balance sheet accounts of the consolidated foreign subsidiaries are translated at the rates of exchange in effect at the balance sheet date, except for capital stock and capital surplus, which are translated at their historical exchange rates. Revenues, expenses and net income for the year are translated at the rates of exchange in effect at the balance sheet date. Differences arising from translation are presented as “Foreign currency translation adjustment” and “Minority interests” in the accompanying consolidated balance sheets.

Financial Section 26 Annual Report 2012
(o) Recognition of RevenuesRevenues and costs of construction contracts of which the percentage of completion can be reliably estimated, are recognized by the percentage-of-completion method. The percentage of completion is calculated at the cost incurred as a percentage of the estimated total cost. The completed-contract method continues to be applied for contracts for which the percentage of completion cannot be reliably estimated.
(p) Cash and Cash EquivalentsFor the purposes of the consolidated statements of cash flows, the Company and its consolidated subsidiaries consider all highly liquid investments with insignificant risk of changes in value purchased with an original maturity of three months or less to be cash equivalents.
(q) Consumption TaxTransactions subject to consumption tax are recorded at amounts exclusive of consumption taxes.
(r) Consolidated Tax ReturnThe Company files a consolidated tax return with certain domestic subsidiaries.
(s) Capitalization of Interest ExpensesInterest expenses incurred for real estate development projects conducted by certain subsidiaries have been capitalized as a part of the development cost of such projects.
(t) Advances Received on Uncompleted Construction ContractsAdvances received on uncompleted construction contracts from customers are shown as a liability, not as a deduction from the amount of costs on uncompleted construction contracts.
(u) Income TaxesDeferred tax assets and liabilities are determined based on the differences between carrying amounts of existing assets and liabilities in the financial statements and their respective tax bases. Deferred tax assets and liabilities are measured using the enacted tax rates and laws which will be in effect when the differences are expected to be reversed.
(v) Per Share InformationNet income per share is computed based on the weighted average number of shares outstanding during each year. Diluted net income per share is not presented since there was no potential for dilution by the issuance of common stock. Total net assets per share is computed based on outstanding shares at the balance sheet date.
(w) Research and Development CostsResearch and development costs are charged to income when incurred.
(x) Impairment of Fixed AssetsThe Company and its consolidated subsidiaries have grouped their fixed assets into each company for EPC Business, each object for Real Estate and Idle Assets. The recoverable amounts of the asset groups were measured by applying net selling prices which were assessed based on the current market price of land and other salable prices or value in use which was computed by using real-estate appraisal value, etc., for the year ended March 31, 2012.
3. ACCOUNTING CHANGES
There are no significant accounting changes for the year ending March 31, 2012.
4. INVESTMENTS AND OTHER ASSETS
Among investment securities and other in investment and other assets, the amounts of shares of unconsolidated subsidiaries and affiliates as of March 31, 2012 and 2011 are as follows:
Millions of yenThousands ofU.S. dollars
Years ended March 31, 2012 2011 2012Investments and other assets
Investment securities ¥3,583 ¥3,348 $43,631Other 951 967 11,580

Financial Section 27TOYO ENGINEERING CORPORATION
5. SHORT-TERM LOANS PAYABLE AND LONG-TERM LOANS PAYABLE
At March 31, 2012 and 2011, short-term loans payable and long-term loans payable consisted of the followings:
Millions of yenThousands ofU.S. dollars
Years ended March 31, 2012 2011 2012Short-term loans payable
Loans payable with collateral
Loans from banks and other financial institutions ¥ 2,709 ¥ 1,099 $ 32,992Loans payable without collateral
Loans from banks and other financial institutions 10,274 17,675 125,095Bonds, due 2012 — 1,000 —Current portion of long-term loans payable 3,260 14,383 39,701
12,983 19,774 158,088Long-term loans payable
Loans payable with collateral
Loans from banks and other financial institutions — 743 —Loans payable without collateral
Loans from banks and other financial institutions 27,843 27,803 339,019Bonds, due 2012 — 1,000 —
27,843 29,547 339,019Less: Current portion 3,260 14,383 39,701
24,582 15,163 299,317Total ¥37,566 ¥34,937 $457,405
The following assets at March 31, 2012 and 2011 were pledged as collateral principally for long-term loans payable:
Millions of yenThousands ofU.S. dollars
Years ended March 31, 2012 2011 2012Cash and deposits ¥2,924 ¥ 831 $35,609Short-term investment securities 177 — 2,160Buildings, net of accumulated depreciation 1,049 834 12,782Land 938 20 11,430
Total ¥5,090 ¥1,686 $61,982
The following schedule shows the maturities of long-term loans payable subsequent to March 31, 2012:
Years ending March 31, Millions of yenThousands ofU.S. dollars
2013 ¥3,260 $39,701
2014 3,588 43,689
2015 3,876 47,199
2016 3,676 44,764
2017 5,614 68,363
2018 and thereafter 7,827 95,301
In order to maintain access to a stable and effective source of operating capital, the company has entered into commitment-line contracts with seven trading banks. The balances of unused commitment-line based on these contracts at the end of the consolidated reporting periods are ¥9,500 million ($115,670 thousand) in 2012 and ¥11,000 million in 2011.
6. CONTINGENT LIABILITIES
The Company and its subsidiaries were contingently liable as guarantors of loans to others in the aggregate amount of ¥541 million ($6,587 thousand) and ¥529 million at March 31, 2012 and 2011, respectively.

Financial Section 28 Annual Report 2012
7. SELLING, GENERAL AND ADMINISTRATIVE ExPENSES
The main components of selling, general and administrative expenses for the year ended March 31, 2012 and 2011 are as follows:
Millions of yenThousands ofU.S. dollars
Years ended March 31, 2012 2011 2012Salaries ¥8,001 ¥8,133 $97,418Provision for bonuses 432 381 5,261Retirement benefit expenses 428 457 5,219Depreciation 415 279 5,062Research and development costs 825 1,277 10,053
8. RESEARCH AND DEVELOPMENT COSTS
Research and development costs included in cost of sales and selling, general and administrative expenses for the years ended March 31, 2012 and 2011 amounted to ¥825 million ($10,053 thousand) and ¥1,277 million, respectively.
9. IMPAIRMENT OF FIxED ASSETS
The Company and its consolidated subsidiaries adopted the accounting standard for impairment of fixed assets. There were no material impairments of fixed assets for the years ended March 31, 2012 and 2011.
10. OTHER COMPREHENSIVE INCOME
Millions of yenThousands ofU.S. dollars
Years ended March 31, 2012 2012Valuation difference on available-for-sale securities:
Amount arising during the year ¥ (438) $ (5,337)Reclassification adjustments for gains and losses realized in net income 2 32The amount of valuation on available-for-sale securities before tax effect (435) (5,304)Tax effect 190 2,318Valuation difference on available-for-sale securities (245) (2,986)
Deferred gains or losses on hedges:
Amount arising during the year (51) (631)Reclassification adjustments for gains and losses realized in net income — —The amount of deferred gains or losses on hedges before tax effect: (51) (631)Tax effect 25 304Deferred gains or losses on hedges (26) (326)
Foreign currency translation adjustment:
Amount arising during the year (784) (9,556)Reclassification adjustments for gains and losses realized in net income — —The amount of foreign currency translation adjustment before tax effect: (784) (9,556)Tax effect — —Foreign currency translation adjustment (784) (9,556)
Share of other comprehensive income of associates accounted for using equity method
Amount arising during the year (88) (1,082)Total other comprehensive income ¥(1,145) $(13,951)

Financial Section 29TOYO ENGINEERING CORPORATION
11. SUPPLEMENTARY INFORMATION FOR CONSOLIDATED STATEMENTS OF CHANGES IN NET ASSETS
For the year ended March 31, 2012
(a) Type and number of outstanding sharesNumber of shares
Type of sharesBalance at beginning
of yearIncrease in shares
during the yearDecrease in shares
during the yearBalance at end of
year
Issued stock:
Common stock 192,792,539 — — 192,792,539
Total 192,792,539 — — 192,792,539
Treasury stock:
Common stock 858,030 54,462 1,950 910,542
Total 858,030 54,462 1,950 910,542
Notes: 1. Treasury stock increased by 54,462 shares due to the repurchase of shares less than one unit. 2. Treasury stock decreased by 1,950 shares due to the sale of shares less than one unit.
(b) Dividends(b-1) Dividends from surplus
Date ofapproval
Resolution approved by
Type of shares
Amount(Millions of yen)
Amount(Thousands of U.S. dollars)
Amount per share(Yen)
Amount pershare
(U.S. Dollars)Shareholders’cut-off date
Effective date
June 23,2011
Annual general
meeting of shareholders
Commonstock 959 11,684 5.0 0.06
March 31,2011
June 24,2011
(b-2) Dividends with a shareholders’ cut-off date during the current fiscal year but an effective date subsequent to the current fiscal year
Date ofapproval
Resolution approved by
Type of shares Paid from
Amount(Millions of yen)
Amount(Thousands of U.S. dollars)
Amount per share(Yen)
Amount per share
(U.S. Dollars)Shareholders’cut-off date
Effective date
June 27,2012
Annual general
meeting of shareholders
Commonstock
Retainedearnings 1,151 14,017 6.0 0.07
March 31,2012
June 28,2012
For the year ended March 31, 2011
(a) Type and number of outstanding sharesNumber of shares
Type of sharesBalance at beginning
of yearIncrease in shares
during the yearDecrease in shares
during the yearBalance at end of
year
Issued stock:
Common stock 192,792,539 — — 192,792,539
Total 192,792,539 — — 192,792,539
Treasury stock:
Common stock 751,115 108,176 1,261 858,030
Total 751,115 108,176 1,261 858,030
Notes: 1. Treasury stock increased by 108,176 shares due to the repurchase of shares less than one unit. 2. Treasury stock decreased by 1,261 shares due to the sale of shares less than one unit.

Financial Section 30 Annual Report 2012
(b) Dividends(b-1) Dividends from surplus
Date ofapproval
Resolutionapproved by
Type of shares
Amount(Millions of yen)
Amount pershare(Yen)
Shareholders’cut-off date
Effective date
June 23,2010
Annualgeneral
meeting ofshareholders
Commonstock 864 4.5
March 31,2010
June 24,2010
(b-2) Dividends with a shareholders’ cut-off date during the current fiscal year but an effective date subsequent to the current fiscal year
Date ofapproval
Resolutionapproved by
Type of shares Paid from
Amount(Millions of yen)
Amount pershare(Yen)
Shareholders’cut-off date
Effective date
June 23,2011
Annualgeneral
meeting ofshareholders
Commonstock
Retainedearnings 959 5.0
March 31,2011
June 24,2011
12. CONSOLIDATED STATEMENTS OF CASH FLOWS
A reconciliation between the balance of cash and deposits reflected in the accompanying consolidated balance sheets and that of cash and cash equivalents in the accompanying consolidated statements of cash flows as of March 31, 2012 and 2011 is summarized as follows:
Millions of yenThousands ofU.S. dollars
2012 2011 2012Cash and deposits ¥48,041 ¥45,069 $ 584,939Time deposits with maturities over three months (1,582) (1,725) (19,267)Short-term investments with maturities within three months
included in securities 43,994 43,992 535,664Cash and cash equivalents ¥90,452 ¥87,337 $1,101,336
13. LEASES
The Company and its consolidated subsidiaries have adopted “Accounting Standard for Lease Transactions.”
(a) Finance LeasesFinance leases are capitalized, and recorded on the balance sheet based on finance lease contracts.
(b) Operating LeasesOperating leases are not capitalized, but future minimum lease payments and receivables are as follows:
(b-1) Operating Leases (as Lessee)Future minimum lease payments subsequent to March 31, 2012 and 2011 for noncancelable operating leases are summarized as follows:
Millions of yenThousands ofU.S. dollars
Years ended March 31, 2012 2011 2012Within one year ¥182 ¥310 $2,216Over one year 260 404 3,174
Total ¥442 ¥715 $5,390

Financial Section 31TOYO ENGINEERING CORPORATION
(b-2) Operating Leases (as Lessor)Future minimum lease receivables subsequent to March 31, 2012 and 2011 for noncancelable operating leases are summarized as follows:
Millions of yenThousands ofU.S. dollars
Years ended March 31, 2012 2011 2012Within one year ¥ 894 ¥ 897 $10,889Over one year 4,454 5,491 54,234
Total ¥5,348 ¥6,389 $65,123
(c) Operating Sub-leasesFuture minimum lease payments for noncancelable operating sub-leases are summarized as follows:
(c-1) Lease Investment Assets and Lease Receivables
Millions of yenThousands ofU.S. dollars
Years ended March 31, 2012 2011 2012Current assets ¥216 ¥302 $2,633Investment and other assets 67 282 818
(c-2) Lease Obligations
Millions of yenThousands ofU.S. dollars
Years ended March 31, 2012 2011 2012Current liabilities ¥216 ¥302 $2,632Noncurrent liabilities 67 282 818
14. FINANCIAL INSTRUMENTS
For the year ended March 31, 20121. Condition of Financial InstrumentsThe Company and its consolidated subsidiaries hold their temporary cash surplus through low-risk financial assets and raise funds through borrowing from banks and issuing corporate bonds. Derivative financial instruments are utilized for reducing the risk of exchange fluctuations, interest fluctuations, and credit. Therefore, there is no derivatives for speculative purpose. Notes receivable, accounts receivable from completed construction contracts are exposed to credit risks of customers and risks of exchange fluctuations. The Company deals with these risks by organizing careful reviews on awarding contracts, letters of credit, and export credit insurance. The Company minimizes exchange fluctuation risks by organizing their corresponding forward-exchange contracts, in principle. Short-term investment securities and investment securities are exposed to volatility risks of market price. The Company deals with these risks by periodic monitoring, as they mainly consist of short-term held-to-maturity bonds and stocks of our business partner. Notes payable, accounts payable for construction contracts and other are mostly due within one year. Borrowings from banks and corporate bonds are raised mainly for capital investment or working capital. For some long-term loans payable, the Company entered into interest swap agreements to minimize risks of interest rate fluctuations. Regarding derivatives, forward-exchange contracts are used to minimize exchange fluctuation in foreign-currency operations, and interest-swap contracts are used to minimize interest rate fluctuations. The fair value of financial instruments is based on their quoted market prices, if available, or reasonably estimated amounts if there is no market price. Since various assumptions and factors are reflected in estimating the fair value, different assumptions and factors could result in different fair value. In addition, the notional amounts below are not necessarily indicative of the actual market risk involved in derivative transactions.

Financial Section 32 Annual Report 2012
2. Fair Value of Financial InstrumentsBook value, fair value, and net unrealized gain or loss of financial instruments consist of the following:It does not include items for which it is extremely difficult to determine the fair value.
Millions of yen
At March 31, 2012 Book value Fair valueUnrealizedgain / loss
(1) Cash and deposits ¥ 48,041 ¥ 48,041 ¥ —(2) Notes receivable, accounts receivable from completed construction contracts 35,832
Less: Allowance for doubtful accounts (525) Notes receivable, accounts receivable from completed construction contracts, net 35,306 35,286 (20)
(3) Accounts receivable—other 14,472 Less: Allowance for doubtful accounts (1) Accounts receivable—other, net 14,470 14,470 —
(4) Short-term investment securities and investment securities
Held-to-maturity securities 43,994 43,993 0 —(0)Available-for-sale securities 4,665 4,665 —Total of assets 146,478 146,457 (20)
(1) Notes payable, accounts payable for construction contracts and other 50,096 50,093 (2)(2) Short-term loans payable 9,723 9,723 —(3) Long-term loans payable (including current portion) 27,843 28,028 185Total of liabilities 87,663 87,845 182Derivatives
not designated as hedging instruments 1 1 —designated as hedging instruments (69) (69) —
Total derivatives ¥ (68) ¥ (68) ¥ —
Notes receivable, accounts receivable from completed construction contracts and accounts receivable—other listed above are offset by the corresponding figures of allowance for doubtful accounts listed above. Net receivables and payables derived as a result of derivative transactions are presented. Values in parentheses show contra-asset account, net liabilities and unrealized loss.

Financial Section 33TOYO ENGINEERING CORPORATION
Thousands of U.S. dollars
At March 31, 2012 Book value Fair valueUnrealizedgain / loss
(1) Cash and deposits $ 584,939 $ 584,939 $ —(2) Notes receivable, accounts receivable from completed construction contracts 436,284
Less: Allowance for doubtful accounts (6,397) Notes receivable, accounts receivable from completed construction contracts, net 429,886 429,641 (244)
(3) Accounts receivable—other 176,215 Less: Allowance for doubtful accounts (24) Accounts receivable—other, net 176,191 176,191 —
(4) Short-term investment securities and investment securitiesHeld-to-maturity securities 535,664 535,659 (5)Available-for-sale securities 56,807 56,807 —Total of assets 1,783,489 1,783,239 (250)
(1) Notes payable, accounts payable for construction contracts and other 609,967 609,932 (34)(2) Short-term loans payable 118,386 118,386 —(3) Long-term loans payable (including current portion) 339,019 341,272 2,252Total of liabilities 1,067,373 1,069,591 2,218Derivatives
not designated as hedging instruments 12 12 —designated as hedging instruments (847) (847) —
Total derivatives $ (835) $ (835) $ —
(Note 1) Computational method and related issuesAssets(1) Cash and depositsBook values are used as fair values because they are nearly equal to such book values.(2) (3) Notes receivable, accounts receivable from completed construction contracts and accounts
receivable—otherBook values for items which are settled in a short-term used as fair values of these items because they are nearly equal tosuch book values. Fair values of other items are based on the present value discounted by the proper discount rate coupled with period for settlement and credit risks.(4) Short-term investment securities and investment securitiesFair value of stock items are based on the market prices and bond items are based on the market prices or their price provided by the financial institution.
Liabilities(1) Notes payable, accounts payable for construction contracts and otherBook values for items which are settled in a short-term are used as fair values of these items because they are nearly equal to such book values. Fair values of other items are based on the present value discounted by the proper discount rate coupled with period for settlement and credit risks.(2) Short-term loans payableBook values are used as fair values because they are nearly equal to such book values.(3) Long-term loans payable (including Current portion)The present values of the principal and total interest, discounted by the rate assumed to be applied to the new borrowings under the same conditions, are used as the fair values.
Derivative TransactionsSee “16. DERIVATIVE TRANSACTIONS.”

Financial Section 34 Annual Report 2012
(Note 2) Financial instruments of which it is extremely difficult to determine the fair valueUnlisted securities that amounted to ¥2,606 million ($31,737 thousand) as of March 31, 2012 are excluded from the above table because they are deemed extremely difficult to determine the fair values; they do not have market prices and it is not possible to conduct alternative methods such as the estimation of their future cash flows.
(Note 3) Redemption schedule for monetary assets with maturity date and short-term investment and investment securities
Millions of yen
Within one yearAfter one year
through five yearsAfter five years
through ten years After ten years
Cash and deposits ¥ 48,041 ¥ — ¥— ¥—Notes receivable, accounts receivable from completed construction contracts 29,075 6,756 — —Accounts receivable—other 14,470 1 — —Held-to-maturity securities 43,994 — — —
Total ¥135,581 ¥6,758 ¥— ¥—
Thousands of U.S. dollars
Within one yearAfter one year
through five yearsAfter five years
through ten years After ten years
Cash and deposits $ 584,939 $ — $— $—Notes receivable, accounts receivable from completed construction contracts 354,019 82,265 — —Accounts receivable—other 176,191 24 — —Held-to-maturity securities 535,664 — — —
Total $1,650,814 $82,289 $— $—
(Note 4) Schedule for repayment of bonds and long-term loans payableSee “5. SHORT-TERM LOANS PAYABLE AND LONG-TERM LOANS PAYABLE.”
For the year ended March 31, 20111. Condition of Financial InstrumentsThe Company and its consolidated subsidiaries hold their temporary cash surplus through low-risk financial assets and raise funds through borrowing from banks and issuing corporate bonds. Derivative financial instruments are utilized for reducing the risk of exchange fluctuations, interest fluctuations, and credit. Therefore, there is no derivatives for speculative purpose. Notes receivable, accounts receivable from completed construction contracts are exposed to credit risks of customers and risks of exchange fluctuations. The Company deals with these risks by organizing careful reviews on awarding contracts, letters of credit, and export credit insurance. The Company minimizes exchange fluctuation risks by organizing their corresponding forward-exchange contracts, in principle. Short-term investment securities and investment securities are exposed to volatility risks of market price. The Company deals with these risks by periodic monitoring, as they mainly consist of short-term held-to-maturity bonds and stocks of our business partner. Notes payable, accounts payable for construction contracts and other are mostly due within one year. Borrowings from banks and corporate bonds are raised mainly for capital investment or working capital. For some long-term loans payable, the Company entered into interest swap agreements to minimize risks of interest rate fluctuations. Regarding derivatives, forward-exchange contracts are used to minimize exchange fluctuation in foreign-currency operations, and interest-swap contracts are used to minimize interest rate fluctuations. The fair value of financial instruments is based on their quoted market prices, if available, or reasonably estimated amounts if there is no market price. Since various assumptions and factors are reflected in estimating the fair value, different assumptions and factors could result in different fair value. In addition, the notional amounts below are not necessarily indicative of the actual market risk involved in derivative transactions.

Financial Section 35TOYO ENGINEERING CORPORATION
2. Fair Value of Financial InstrumentsBook value, fair value, and net unrealized gain or loss of financial instruments consist of the following:It does not include items for which it is extremely difficult to determine the fair value.
Millions of yen
At March 31, 2011 Book value Fair valueUnrealizedgain / loss
(1) Cash and deposits ¥ 45,069 ¥ 45,069 ¥ —
(2) Notes receivable, accounts receivable from completed construction contracts 30,737
Less: Allowance for doubtful accounts (409)
Notes receivable, accounts receivable from completed construction contracts, net 30,327 30,326 (0)
(3) Accounts receivable—other 8,400
Less: Allowance for doubtful accounts (1)
Accounts receivable—other, net 8,398 8,398 —
(4) Short-term investment securities and investment securities
Held-to-maturity securities 43,992 43,992 0
Available-for-sale securities 4,329 4,329 —
Total of assets 132,118 132,117 (0)
(1) Notes payable, accounts payable for construction contracts and other 40,811 40,808 (2)
(2) Short-term loans payable 5,390 5,390 —
(3) Current portion of bonds 1,000 1,009 9
(4) Long-term loans payable (including current portion) 28,547 28,791 244
Total of liabilities 75,749 76,000 251
Derivatives
not designated as hedging instruments 9 9 —
designated as hedging instruments (17) (17) —
Total derivatives ¥ (8) ¥ (8) ¥ —
Notes receivable, accounts receivable from completed construction contracts and accounts receivable—other listed above are offset by the corresponding figures of allowance for doubtful accounts listed above. Net receivables and payables derived as a result of derivative transactions are presented. Values in parentheses show contra-asset account, net liabilities and unrealized loss.
(Note 1) Computational method and related issuesAssets(1) Cash and depositsBook values are used as fair values because they are nearly equal to such book values.(2) (3) Notes receivable, accounts receivable from completed construction contracts and accounts
receivable—otherBook values for items which are settled in a short-term used as fair values of these items because they are nearly equal to such book values. Fair values of other items are based on the present value discounted by the proper discount ratecoupled with period for settlement and credit risks.(4) Short-term investment securities and investment securitiesFair value of stock items are based on the market prices and bond items are based on the market prices or their priceprovided by the financial institution.
Liabilities(1) Notes payable, accounts payable for construction contracts and otherBook values for items which are settled in a short-term are used as fair values of these items because they are nearly equal to such book values. Fair values of other items are based on the present value discounted by the proper discount rate coupled with period for settlement and credit risks.

Financial Section 36 Annual Report 2012
(2) Short-term loans payableBook values are used as fair values because they are nearly equal to such book values.(3) Current portion of bondsFair values are shown as the present value discounted by the proper discount rate coupled with period for settlement and credit risks.(4) Long-term loans payable (including current portion)The present values of the principal and total interest, discounted by the rate assumed to be applied to the new borrowings under the same conditions, are used as the fair values.
Derivative TransactionsSee “16. DERIVATIVE TRANSACTIONS.”
(Note 2) Financial instruments for which it is extremely difficult to determine the fair valueUnlisted securities that amounted to ¥2,436 million as of March 31, 2011 are excluded from the above table because they are deemed extremely difficult to determine the fair values; they do not have market prices and it is not possible to conduct alternative methods such as the estimation of their future cash flows.
(Note 3) Redemption schedule for monetary assets with maturity date and short-term investment and investment securities
Millions of yen
Within one yearAfter one year
through five yearsAfter five years
through ten years After ten years
Cash and deposits ¥ 45,069 ¥ — ¥— ¥—
Notes receivable, accounts receivable from completed construction contracts 29,716 611 — —
Accounts receivable—other 8,398 1 — —
Held-to-maturity securities 43,992 — — —
Total ¥127,177 ¥613 ¥— ¥—
15. INVESTMENT SECURITIES
The book value, unrealized gain and loss and the related fair value of held-to-maturity securities at March 31, 2012 are summarized as follows:
Millions of yen
At March 31, 2012BookValue
FairValue
UnrealizedGain
Securities whose fair value exceeds their carrying value:
Government bonds ¥26,996 ¥26,996 ¥ 0Securities whose fair value does not exceed their carrying value:
Government bonds 16,997 16,996 (0)Total ¥43,994 ¥43,993 ¥(0)
Thousands of U.S. dollars
At March 31, 2012BookValue
FairValue
UnrealizedGain
Securities whose fair value exceeds their carrying value:
Government bonds $328,703 $328,707 $ 4Securities whose fair value does not exceed their carrying value:
Government bonds 206,960 206,951 (9)Total $535,664 $535,659 $(5)
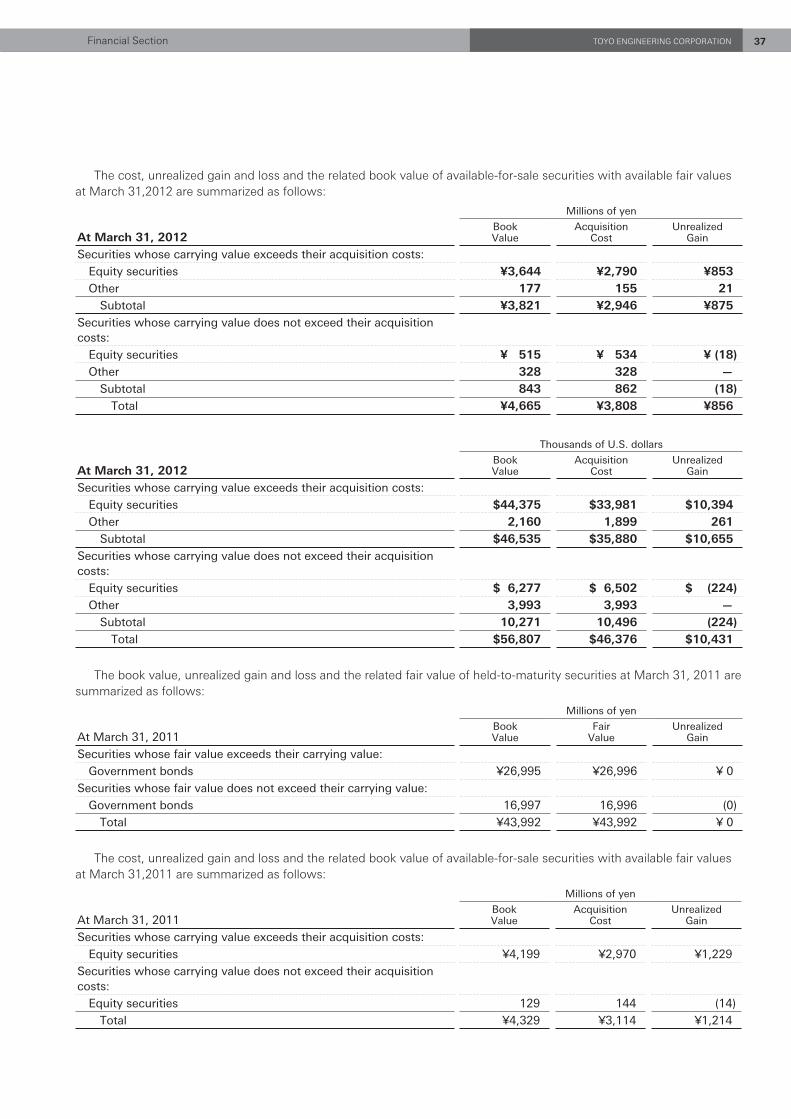
Financial Section 37TOYO ENGINEERING CORPORATION
The cost, unrealized gain and loss and the related book value of available-for-sale securities with available fair values at March 31,2012 are summarized as follows:
Millions of yen
At March 31, 2012BookValue
AcquisitionCost
UnrealizedGain
Securities whose carrying value exceeds their acquisition costs:
Equity securities ¥3,644 ¥2,790 ¥853Other 177 155 21
Subtotal ¥3,821 ¥2,946 ¥875Securities whose carrying value does not exceed their acquisition costs:
Equity securities ¥ 515 ¥ 534 ¥ (18)Other 328 328 —
Subtotal 843 862 (18)Total ¥4,665 ¥3,808 ¥856
Thousands of U.S. dollars
At March 31, 2012BookValue
AcquisitionCost
UnrealizedGain
Securities whose carrying value exceeds their acquisition costs:
Equity securities $44,375 $33,981 $10,394Other 2,160 1,899 261
Subtotal $46,535 $35,880 $10,655Securities whose carrying value does not exceed their acquisition costs:
Equity securities $ 6,277 $ 6,502 $ (224)Other 3,993 3,993 —
Subtotal 10,271 10,496 (224)Total $56,807 $46,376 $10,431
The book value, unrealized gain and loss and the related fair value of held-to-maturity securities at March 31, 2011 are summarized as follows:
Millions of yen
At March 31, 2011BookValue
FairValue
UnrealizedGain
Securities whose fair value exceeds their carrying value:
Government bonds ¥26,995 ¥26,996 ¥ 0
Securities whose fair value does not exceed their carrying value:
Government bonds 16,997 16,996 (0)
Total ¥43,992 ¥43,992 ¥ 0
The cost, unrealized gain and loss and the related book value of available-for-sale securities with available fair values at March 31,2011 are summarized as follows:
Millions of yen
At March 31, 2011BookValue
AcquisitionCost
UnrealizedGain
Securities whose carrying value exceeds their acquisition costs:
Equity securities ¥4,199 ¥2,970 ¥1,229
Securities whose carrying value does not exceed their acquisition costs:
Equity securities 129 144 (14)
Total ¥4,329 ¥3,114 ¥1,214

Financial Section 38 Annual Report 2012
16. DERIVATIVE TRANSACTIONS
For the year ended March 31, 2012
1. Derivatives not designated as hedging instruments(1) Currency-related
Millions of yen
All notionalamounts
Notionalamounts dueover one year Fair value
Unrealizedgain / loss
Non-market transaction:Foreign exchange forward contracts
BuyingUSD ¥ 0 ¥ — ¥0 ¥0EUR 51 51 1 1THB 0 — 0 0Total ¥51 ¥51 ¥1 ¥1
Thousands of U.S. dollars
All notionalamounts
Notionalamounts dueover one year Fair value
Unrealizedgain / loss
Non-market transaction:Foreign exchange forward contracts
BuyingUSD $ 1 $ — $ 0 $ 0EUR 630 630 12 12THB 0 — 0 0Total $632 $630 $12 $12
2. Derivatives designated as hedging instruments(1) Currency-related
Millions of yen
Main hedgeditems
All notionalamounts
Notionalamounts dueover one year Fair value
Computationalmethod of fair
values
Deferral hedge accounting method:Foreign exchange forward contracts
SellingAccounts receivable and accounts payable
Based on prices offered by the financial institution
USD ¥ 5,227 ¥1,708 ¥(82)Buying
USD 1,298 127 12EUR 1 — 0
Alternative method: Foreign exchange forward contracts
Selling
Accounts receivable and accounts payable
N/A
Based on forward exchange contract prices
USD 20,368 4,826SEK 1,412 825
Buying USD 10,816 608EUR 5,031 1,438SEK 1,678 —THB 2,761 —BRL 3,822 —CHF 347 —SGD 636 —Total ¥53,404 ¥9,536 ¥(69)

Financial Section 39TOYO ENGINEERING CORPORATION
Thousands of U.S. dollars
Main hedgeditems
All notionalamounts
Notionalamounts dueover one year Fair value
Computationalmethod of fair
value
Deferral hedge accounting method:Foreign exchange forward contracts
SellingAccounts receivable and accounts payable
Based on prices offered by the financial institution
USD $ 63,654 $ 20,804 $(1,005)Buying
USD 15,815 1,557 157EUR 18 — 0
Alternative method:Foreign exchange forward contracts
Selling
Accounts receivable and accounts payable
N/A
Based on forward exchange contract prices
USD 248,006 58,765SEK 17,200 10,056
Buying USD 131,696 7,413EUR 61,262 17,512SEK 20,434 —THB 33,622 —BRL 46,544 —CHF 4,235 —SGD 7,748 —Total $650,239 $116,109 $ (847)
(2) Interest-related
Millions of yen
Main hedgeditems
All notionalamounts
Notionalamounts dueover one year Fair value
Computationalmethod of fair
value
Special method for interest rate swaps:
Interest swap contractsfloating-for-fixed rate swap Long-term
loans payable¥10,242 ¥9,910 N/A Based on prices
offered by the financial institution
Total ¥10,242 ¥9,910 ¥—
Thousands of U.S. dollars
Main hedgeditems
All notionalamounts
Notionalamounts dueover one year Fair value
Computationalmethod of fair
value
Special method for interest rate swaps:
Interest swap contractsfloating-for-fixed rate swap Long-term
loans payable$124,710 $120,662 N/A Based on prices
offered by the financial institution
Total $124,710 $120,662 $—

Financial Section 40 Annual Report 2012
For the year ended March 31, 2011
1. Derivatives not designated as hedging instruments(1) Currency-related
Millions of yen
All notionalamounts
Notionalamounts dueover one year Fair value
Unrealizedgain / loss
Non-market transaction:
Foreign exchange forward contracts
Selling
USD ¥421 ¥— ¥ 4 ¥ 4
Buying
USD 2 — (0) (0)
EUR 47 — 5 5
Total ¥471 ¥— ¥ 9 ¥ 9
2. Derivatives designated as hedging instruments(1) Currency-related
Millions of yen
Main hedgeditems
All notionalamounts
Notionalamounts dueover one year Fair value
Computationalmethod of fair
value
Deferral hedge accounting method:
Foreign exchange forward contracts
Selling
Accounts receivable and accounts payable
Based on prices offered by the financial institution
USD ¥ 683 ¥ 384 ¥(5)
EUR 77 — (3)
Buying
USD 414 246 4
EUR 153 — 5
Alternative method:
Foreign exchange forward contracts
Selling
Accounts receivable and accounts payable
Based on forward exchange contract prices
USD 6,959 884
EUR 705 —
SEK 4,682 1,300
Buying N/A
USD 11,102 2,487
EUR 228 51
SEK 5,981 449
Total ¥30,989 ¥5,804 ¥ 2

Financial Section 41TOYO ENGINEERING CORPORATION
(2) Interest-related
Millions of yen
Main hedgeditems
All notionalamounts
Notionalamounts dueover one year Fair value
Computationalmethod of fair
value
Deferral hedge accounting method:
Interest swap contracts
floating-for-fixed rate swap Long-term loans payable
¥ 282 ¥ 247 ¥(19) Based on prices offered by the financial institution
Special method for interest rate swaps:
Interest swap contracts
floating-for-fixed rate swap Long-term loans payable
10,978 1,467 N/A Based on prices offered by the financial institution
Total ¥11,260 ¥1,714 ¥(19)
17. RETIREMENT BENEFITS
The Company and certain consolidated subsidiaries have defined benefit pension plans which provide for pension annuity payments or lump-sum payments to eligible employees upon retirement. The Company also has defined contribution pension plan, which was transferred from a portion of defined benefit pension plan in May, 2003.
(1) Provision for retirement benefits for employees at March 31, 2012 and 2011 consisted of the following:
Millions of yenThousands ofU.S. dollars
2012 2011 2012
Projected benefit obligation ¥(15,252) ¥(15,099) $(185,715)
Plan assets 9,390 8,865 114,332
Unreserved projected benefit obligation (5,862) (6,233) (71,383)
Unamortized obligation at transition 747 994 9,105
Unamortized actuarial loss 545 1,257 6,642
Unrecognized prior service cost (714) (939) (8,697)
Net projected benefit obligation (5,283) (4,922) (64,334)
Prepaid pension cost 31 49 379
Provision for retirement benefits for employees ¥ (5,314) ¥ (4,971) $ (64,713)

Financial Section 42 Annual Report 2012
(2) Net periodic pension cost for the years ended March 31, 2012 and 2011 consisted of the following:
Millions of yenThousands ofU.S. dollars
2012 2011 2012
Components of net periodic benefit cost:
Service cost ¥ 599 ¥ 594 $ 7,303
Interest cost 301 310 3,676
Expected return on plan assets (18) (20) (228)
Amortization of unrecognized retirement benefit obligation at transition 246 246 3,000
Amortization of unrecognized actuarial loss 488 727 5,950
Amortization of prior service cost (187) (187) (2,289)
Other 107 111 1,311
Net periodic pension cost 1,537 1,782 18,724
Total ¥1,537 ¥1,782 $18,724
(3) Basis of calculation of projected benefit obligation for the years ended 2012 and 2011, respectively.
Method of allocation of estimated pension cost Straight-line methodDiscount rate Mainly 2.0%Expected rate of return on plan assets Mainly 0.0%Amortization period for unrecognized actuarial loss Mainly nine yearsAmortization period for unrecognized obligation at transition 15 yearsAmortization period for unrecognized prior service cost Mainly 13 years
18. INCOME TAxES
The statutory tax rates applicable to the Company and its domestic subsidiaries for the year ended March 31, 2012 and 2011 were approximately 40.4%. Income taxes of the foreign subsidiaries are based generally on the tax rates applicable in their countries of incorporation.
(1) The effective tax rates on income before income taxes in the accompanying consolidated statements of income are not equal to the above-mentioned statutory tax rate for the following reasons:
Year ended March 31, 2012 2011
Statutory tax rate in Japan 40.4% 40.4%
Adjustments:
Permanently nondeductible expenses 3.1 2.3
Permanently nontaxable dividends received (3.0) (2.3)
Per capita levy on corporate inhabitant tax 0.5 0.3
Temporary differences excluded from calculation of deferred tax assets (23.9) 9.4
Difference in tax rates for foreign subsidiaries 1.4 (0.9)
Effective tax rate in the past years 2.8 4.5
Difference in tax base between corporate income tax and enterprise tax (1.6) (1.8)
Amendment of statutory tax rate 4.4 —
Other 0.2 (4.7)
Effective tax rate 24.3% 47.2%
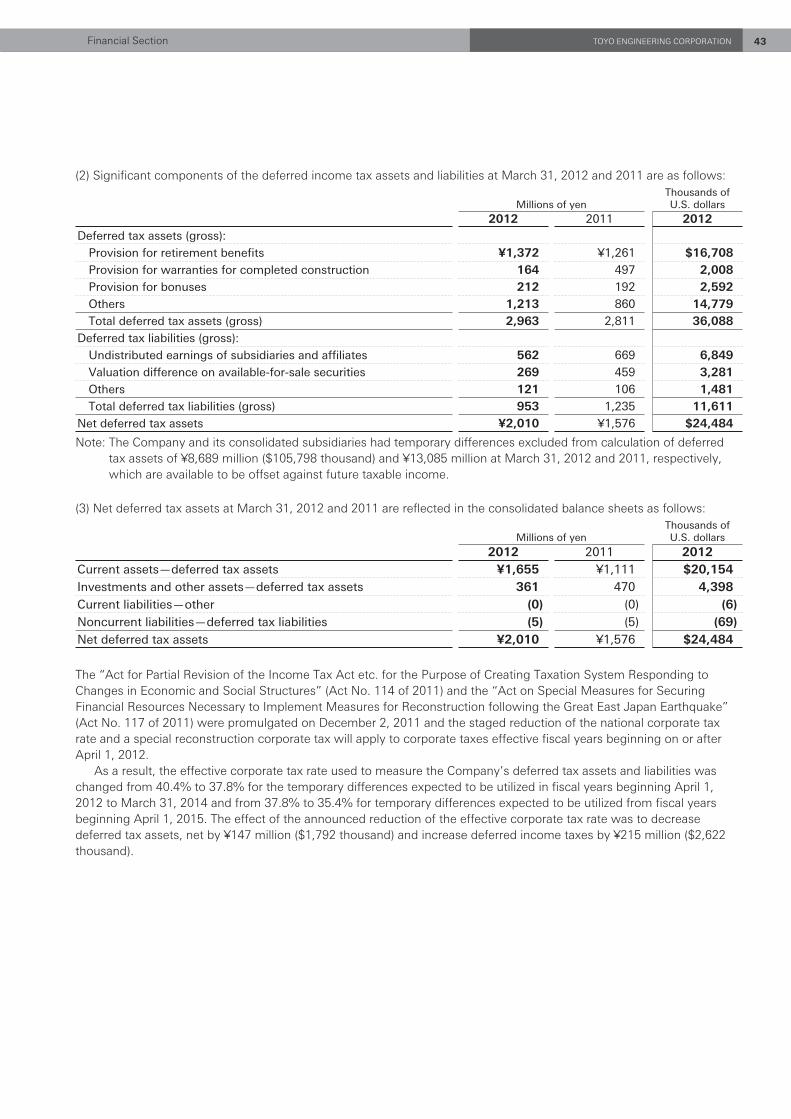
Financial Section 43TOYO ENGINEERING CORPORATION
(2) Significant components of the deferred income tax assets and liabilities at March 31, 2012 and 2011 are as follows:
Millions of yenThousands ofU.S. dollars
2012 2011 2012Deferred tax assets (gross):
Provision for retirement benefits ¥1,372 ¥1,261 $16,708Provision for warranties for completed construction 164 497 2,008Provision for bonuses 212 192 2,592Others 1,213 860 14,779Total deferred tax assets (gross) 2,963 2,811 36,088
Deferred tax liabilities (gross):
Undistributed earnings of subsidiaries and affiliates 562 669 6,849Valuation difference on available-for-sale securities 269 459 3,281Others 121 106 1,481Total deferred tax liabilities (gross) 953 1,235 11,611
Net deferred tax assets ¥2,010 ¥1,576 $24,484
Note: The Company and its consolidated subsidiaries had temporary differences excluded from calculation of deferred tax assets of ¥8,689 million ($105,798 thousand) and ¥13,085 million at March 31, 2012 and 2011, respectively, which are available to be offset against future taxable income.
(3) Net deferred tax assets at March 31, 2012 and 2011 are reflected in the consolidated balance sheets as follows:
Millions of yenThousands ofU.S. dollars
2012 2011 2012Current assets—deferred tax assets ¥1,655 ¥1,111 $20,154Investments and other assets—deferred tax assets 361 470 4,398Current liabilities—other (0) (0) (6)Noncurrent liabilities—deferred tax liabilities (5) (5) (69)Net deferred tax assets ¥2,010 ¥1,576 $24,484
The “Act for Partial Revision of the Income Tax Act etc. for the Purpose of Creating Taxation System Responding to Changes in Economic and Social Structures” (Act No. 114 of 2011) and the “Act on Special Measures for Securing Financial Resources Necessary to Implement Measures for Reconstruction following the Great East Japan Earthquake” (Act No. 117 of 2011) were promulgated on December 2, 2011 and the staged reduction of the national corporate tax rate and a special reconstruction corporate tax will apply to corporate taxes effective fiscal years beginning on or after April 1, 2012. As a result, the effective corporate tax rate used to measure the Company’s deferred tax assets and liabilities was changed from 40.4% to 37.8% for the temporary differences expected to be utilized in fiscal years beginning April 1, 2012 to March 31, 2014 and from 37.8% to 35.4% for temporary differences expected to be utilized from fiscal years beginning April 1, 2015. The effect of the announced reduction of the effective corporate tax rate was to decrease deferred tax assets, net by ¥147 million ($1,792 thousand) and increase deferred income taxes by ¥215 million ($2,622 thousand).

Financial Section 44 Annual Report 2012
19. RENTAL PROPERTIESFor the year ended March 31, 2012The Company and some of its consolidated subsidiaries own their commercial facilities, residences and office buildings (including land) for rent in Chiba prefecture and the other areas. For the year ended March 31, 2012, the Company and some of its consolidated subsidiaries recorded ¥792 million ($9,647 thousand) of rental revenues.
Book value, increase (decrease) in value, and fair value of rental properties are listed below.
Millions of yen Thousands of U.S. dollars
Book valueat March 31,
2011
Increase (decrease)
in book value
Book valueat March 31,
2012
Fair valueat March 31,
2012
Book valueat March 31,
2011
Increase (decrease)
in book value
Book valueat March 31,
2012
Fair valueat March 31,
2012
¥17,615 ¥(1,462) ¥16,152 ¥22,430 $214,485 $(17,810) $196,674 $273,105
Notes: 1. Book value is calculated by deducting accumulated depreciation and accumulated impairment loss from its acquisition cost.
2. The major items in “Increase (decrease) in value” consist of ¥946 million ($11,522 thousand) of sales of rental offices and ¥489 million ($5,960 thousand) of depreciation of buildings.
3. Computational method of fair value Mainly based on Real Estate Appraisal Standards.
For the year ended March 31, 2011The Company and some of its consolidated subsidiaries own their commercial facilities, residences and office buildings (including land) for rent in Chiba prefecture and the other areas. For the year ended March 31, 2011, the Company and some of its consolidated subsidiaries recorded ¥992 million of rental revenues.
Book value, increase (decrease) in value, and fair value of rental properties are listed below.Millions of yen
Book valueat March 31,
2010
Increase (decrease)
in book value
Book valueat March 31,
2011
Fair valueat March 31,
2011
¥18,154 ¥(538) ¥17,615 ¥23,102
Notes: 1. Book value is calculated by deducting accumulated depreciation and accumulated impairment loss from its acquisition cost.
2. Major item in “Increase (decrease) in value” consists of depreciation expense. 3. Computational method of fair value Mainly based on Real Estate Appraisal Standards.
20. SEGMENT INFORMATION
Effective the fiscal year ended March 31, 2012, the Company has adopted new accounting standards for disclosures about segments of an enterprise and related information. Segment information for the year ended March 31, 2011 has been restated in accordance with such accounting standards for comparative purposes.
(1) Operating SegmentsThe operating segments of the Group are components for which discrete financial information is available and whose operating results are regularly reviewed by the Executive Committee to make decisions about resource allocation and to assess performance. The Companies’ reportable operating segments consist of the following three business groups: EPC Business— Research and development, design, engineering, procurement, and construction of a variety of
plants, such as oil, gas, petrochemical, and general chemical. IT Business— Solution business based on other companies’ ERP package products and product business based
on our subsidiary ERP package products, etc. Real Estate— Rent of commercial facilities and residences, and administration.

Financial Section 45TOYO ENGINEERING CORPORATION
Millions of yen
Year ended March 31, 2012 EPC Business IT Business Real Estate Total Adjustments Consolidated
I Net sales and segment profits:
Net sales
(1) Net sales to outside customers ¥143,017 ¥12,228 ¥ 2,635 ¥157,881 ¥ — ¥157,881(2) Inter-segment net sales 239 25 230 495 (495) —
Total 143,256 12,253 2,866 158,376 (495) 157,881Segment profits 4,121 318 897 5,337 3 5,341II Segment assets ¥191,198 ¥ 6,257 ¥19,468 ¥216,924 ¥5,491 ¥222,415III Others
Depreciation ¥ 1,203 ¥ 764 ¥ 541 ¥ 2,509 ¥ (0) ¥ 2,508Amortization of goodwill 179 — — 179 — 179Amount invested in equity method
affiliates 2,974 — — 2,974 — 2,974Increase of fixed assets 2,124 500 13 2,637 — 2,637
Thousands of U.S. dollars
Year ended March 31, 2012 EPC Business IT Business Real Estate Total Adjustments Consolidated
I Net sales and segment profits:
Net sales
(1) Net sales to outside customers $1,741,353 $148,893 $ 32,091 $1,922,338 $ — $1,922,338(2) Inter-segment net sales 2,915 304 2,807 6,027 (6,027) —
Total 1,744,268 149,198 34,898 1,928,365 (6,027) 1,922,338Segment profits 50,186 3,880 10,926 64,993 41 65,034
II Segment assets $2,328,000 $ 76,186 $237,042 $2,641,229 $66,863 $2,708,092III Others
Depreciation $ 14,652 $ 9,303 $ 6,596 $ 30,552 $ (9) $ 30,542Amortization of goodwill 2,191 — — 2,191 — 2,191Amount invested in equity method
affiliates 36,221 — — 36,221 — 36,221Increase of fixed assets 25,861 6,088 164 32,114 — 32,114
Notes: 1. “Adjustments” for Segment profits and Depreciation represent the elimination of inter-segment transactions. 2. “Segment profits” represents operating income from Consolidated Statement of Income. 3. Segment assets adjustments include (¥466) million (($5,678) thousand) of inter-segment eliminations
and ¥5,957 million ($72,541 thousand) of non-allocated corporate assets, which is chiefly the Company’s investment securities attributed to the administrative department.
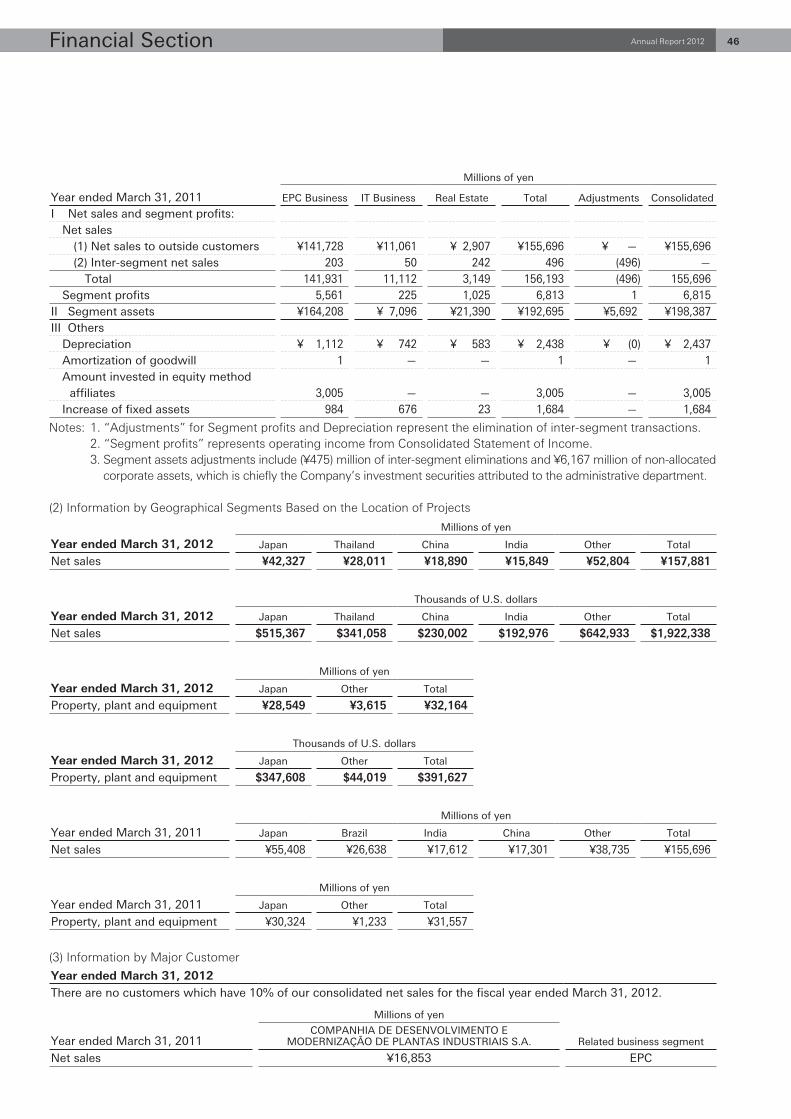
Financial Section 46 Annual Report 2012
Millions of yen
Year ended March 31, 2011 EPC Business IT Business Real Estate Total Adjustments Consolidated
I Net sales and segment profits:Net sales
(1) Net sales to outside customers ¥141,728 ¥11,061 ¥ 2,907 ¥155,696 ¥ — ¥155,696(2) Inter-segment net sales 203 50 242 496 (496) —
Total 141,931 11,112 3,149 156,193 (496) 155,696Segment profits 5,561 225 1,025 6,813 1 6,815
II Segment assets ¥164,208 ¥ 7,096 ¥21,390 ¥192,695 ¥5,692 ¥198,387III Others
Depreciation ¥ 1,112 ¥ 742 ¥ 583 ¥ 2,438 ¥ (0) ¥ 2,437Amortization of goodwill 1 — — 1 — 1Amount invested in equity method
affiliates 3,005 — — 3,005 — 3,005Increase of fixed assets 984 676 23 1,684 — 1,684
Notes: 1. “Adjustments” for Segment profits and Depreciation represent the elimination of inter-segment transactions. 2. “Segment profits” represents operating income from Consolidated Statement of Income. 3. Segment assets adjustments include (¥475) million of inter-segment eliminations and ¥6,167 million of non-allocated
corporate assets, which is chiefly the Company’s investment securities attributed to the administrative department.
(2) Information by Geographical Segments Based on the Location of Projects
Millions of yen
Year ended March 31, 2012 Japan Thailand China India Other Total
Net sales ¥42,327 ¥28,011 ¥18,890 ¥15,849 ¥52,804 ¥157,881
Thousands of U.S. dollars
Year ended March 31, 2012 Japan Thailand China India Other Total
Net sales $515,367 $341,058 $230,002 $192,976 $642,933 $1,922,338
Millions of yen
Year ended March 31, 2012 Japan Other Total
Property, plant and equipment ¥28,549 ¥3,615 ¥32,164
Thousands of U.S. dollars
Year ended March 31, 2012 Japan Other Total
Property, plant and equipment $347,608 $44,019 $391,627
Millions of yen
Year ended March 31, 2011 Japan Brazil India China Other Total
Net sales ¥55,408 ¥26,638 ¥17,612 ¥17,301 ¥38,735 ¥155,696
Millions of yen
Year ended March 31, 2011 Japan Other Total
Property, plant and equipment ¥30,324 ¥1,233 ¥31,557
(3) Information by Major Customer
Year ended March 31, 2012There are no customers which have 10% of our consolidated net sales for the fiscal year ended March 31, 2012.
Millions of yen
Year ended March 31, 2011COMPANHIA DE DESENVOLVIMENTO E
MODERNIZAÇÃO DE PLANTAS INDUSTRIAIS S.A. Related business segment
Net sales ¥16,853 EPC

Financial Section 47TOYO ENGINEERING CORPORATION
21. RELATED PARTY TRANSACTIONSAffiliate
For the year ended March 31, 2012Name: NEDL CONSTRUCOES DE
DUTOS DO NORDESTE LTDA.
Millions of yen Thousands of U.S. dollars
Transactionamount
Title ofaccount
Accountbalance
Transactionamount
Title ofaccount
Accountbalance
Address:
Brazil
Capital and investments:
2,524 thousand BRL
Business:
Construction
Equity ownership percentage: Long-termloans
receivable
Long-termloans
receivableHolding 42% directly — ¥3,707 — $45,146
Relation with related party:
Loan for operating fund
Summary of transactions:
Loan for operating fund
For the year ended March 31, 2011
Name: NEDL CONSTRUCOES DE DUTOS DO NORDESTE LTDA.
Millions of yen
Transactionamount
Title ofaccount
Accountbalance
Address:
Brazil
Capital and investments:
2,524 thousand BRL
Business:
Construction
Equity ownership percentage: Long-term
loans
receivable
Holding 42% directly — ¥3,707
Relation with related party:
Loan for operating fund
Summary of transactions:
Loan for operating fund
Note: Interest rate on loan is determined by considering effective market rates. The Company reserved ¥3,707 million ($45,146 thousand) and ¥3,707 million of allowance for doubtful accounts at
March 31, 2012 and 2011, against the loan above.

Financial Section 48 Annual Report 2012
Other affiliates subsidiary
For the year ended March 31, 2012Name: MIT-POWER LIMITED
Millions of yen Thousands of U.S. dollars
Transactionamount
Title ofaccount
Accountbalance
Transactionamount
Title ofaccount
Accountbalance
Address:
Thailand
Capital and investments:
14,019 thousand THB Advances received on
uncompleted construction
contracts
Advances received on
uncompleted construction
contracts
Business:
Construction ¥5,532 $67,365Equity ownership percentage:
N/A ¥10,210 $124,321Relation with related party:
Contract for engineering and Accounts Accounts construction receivable — receivable —
Summary of transactions:
Contract for engineering and
construction
For the year ended March 31, 2011
Name: MIT-POWER LIMITED
Millions of yen
Transactionamount
Title ofaccount
Accountbalance
Address:
Thailand
Capital and investments:
14,019 thousand THB Advances
received on
uncompleted
construction
contracts
Business:
Construction ¥3,253
Equity ownership percentage:
N/A ¥2,829
Relation with related party:
Contract for engineering and Accounts
construction receivable 14
Summary of transactions:
Contract for engineering and
construction
Note: “Contract for engineering and construction” is determined by price negotiation based on market price, which is similar to general transaction. “Transaction amount” does not include consumption tax while “Account balance” includes consumption tax.
22. AMOUNTS PER SHARE
Yen U.S. dollars
Years ended March 31, 2012 2011 2012Net income per share ¥ 19.43 ¥ 19.65 $0.23Net assets per share 349.42 340.43 4.25Dividends per share 6.00 5.00 0.07
Net income per share is computed based on the net income available for distribution to shareholders of common stock and the weighted average number of shares of common stock outstanding during each year. Cash dividends per share represent the cash dividends proposed by the Board of Directors as applicable to the respective years. Net assets per share are computed based on the net assets excluding minority interests and the number of common stock outstanding at the year end.

Financial Section 49TOYO ENGINEERING CORPORATION

Corporate Data
History
Corporate Name: Toyo Engineering Corporation (TOYO)
Founded: May 1, 1961
Number of Employees: 4,494 (Consolidated, As of March 31, 2012)
Business Activities: Engineering and Construction for Industrial Facilities
● R&D support, design, engineering, procurement, construction, commissioning, technical assistance for industrial facilities: oil, gas, oil & gas development, petrochemicals, chemicals, water treatment, transportation systems, power generation, nuclear power, advanced production systems, pharmaceutical, fine chemical, distribution systems, biotechnology, environment and others ● IT engineering services and system software supply
1961 ● TOYO was established. Capital: 300 million yen
1962 ● An agreement for engineering service and technical assistance was concluded with Lummus Co. (U.S.A.).
1963 ● The first overseas contract for a fertilizer plant with The Fertilizer Corporation of India Ltd. was awarded.
1964 ● The first urea plant contract in the former Soviet Union was awarded.
1965 ● TOYO was awarded its first ethylene plant contract (Osaka, Japan).
1969 ● TOYO was awarded the contract for the first ammonia plant in the former Soviet Union.
1970 ● TOYO was awarded the contract for two ammonia plants in the former East Germany.
1972 ● International Procurement & Service Corporation (Currently Toyo Engineering Europe, S.r.l.) established.
1973 ● A contract for a urea plant for China was awarded.
1975 ● Capital: 1,890 million yen
1976 ● Toyo Engineering India Limited established.
1977 ● Construction of the Research Center completed in Mobara, Chiba Prefecture.
1978 ● Capital: 2,970 million yen
1980 ● Capital: 3,300 million yen ● TOYO was listed on the second section of the Tokyo Stock Exchange.
1982 ● Capital: 5,040 million yen ● TOYO was listed on the first section of the Tokyo Stock Exchange.
1985 ● Toyo-Thai Corporation Ltd. established.
1986 ● Toyo U.S.A., Inc. established. ● Toyo Engineering & Construction Sdn. Bhd. established in Malaysia.
1987 ● Toyo Engineering Korea Limited established.
1989 ● Capital: 12,219 million yen
1990 ● Head Office/Engineering Center (Baytec Building) started operation in Narashino, Chiba.
1993 ● Capital: 13,017 million yen
1994 ● TOYO received ISO 9001 registration.
1998 ● Toyo do Brasil Consultoria e Construções Industriais Ltda. established.
1999 ● Toyo Business Engineering Corporation established.
2004 ● TOYO received ISO 14001 registration. ● Toyo Engineering Corporation, China established.
2006 ● Capital: 18,198 million yen
2007 ● Relocation of Tokyo head office.
2008 ● TOYO invested in Atlatec, S.A. de C.V. in Mexico.
2009 ● TOYO formulated TOYO’s MVV (Mission, Vision, Values).
2010 ● TOYO acquired Tri Ocean Engineering Limited in Calgary, Alberta, Canada.
2011 ● The 50th Anniversary ● TOYO invested in PT. Inti Karya Persada Tehnik (IKPT) in Indonesia.
2012 ● Medium-Term Business Plan (FY2012–FY2015) started. ● Katsumoto Ishibashi was elected as President and CEO. ● Consolidated group logo developed.
Annual Report 2012 50Corporate Information

Directors *Representative Director
Chairman
Yushi Nagata
Vice Chairman
Kenji Soejima
President
Katsumoto Ishibashi*
Directors
Makoto Fusayama*Hideki Shiinoki*Keiichi MatsumotoSatoshi KuwaharaMitsutoshi HamamuraMasayuki UchidaTakaya Naito
Auditors
Senior Corporate Auditor
Makoto Shimagaki
Corporate Auditors
Hideaki KinoshitaShingo Sato (Outside Auditor)
Yoshiyuki Shinohara (Outside Auditor)
Executive Officers
Chief Executive Officer
Katsumoto Ishibashi
Executive Vice President
Makoto Fusayama
Senior Executive Officers
Hideki ShiinokiKeiichi MatsumotoSatoshi KuwaharaMitsutoshi HamamuraMasayuki UchidaTakaya NaitoKiyoshi NakaoAkhilesh KumarTadashi HoriMasaru TakezawaHisashi Osone
Executive Officers
Kazuharu MurayamaMotoyoshi KamoshimaSeiichi ItakuraYutaka KitaMasaaki YamaguchiTakayoshi ImanishiShoji KoshikawaHiroshi SatoKoji KojimaMasayuki YoshizawaRyuji OkaItsuya YanagiTomohisa Abe
(As of June 27, 2012)
Board of Directors
E D C A B
A Yushi Nagata
B Kenji Soejima
C Katsumoto Ishibashi
D Makoto Fusayama
E Hideki Shiinoki
51TOYO ENGINEERING CORPORATIONCorporate Information

Worldwide Network
KUALA LUMPUR
RIO DE JANEIRO
SAO PAULO
HOUSTON
MONTERREY
CARACAS
JAKARTA
SHANGHAI
BANGKOK
MO
SC
OW
MU
MBA
I
TE
HR
AN
DU
BA
I
AL K
HO
BA
R
CA
LGA
RY
MIL
AN
SEOUL
TOKYO, CHIBA
BEIJING
Annual Report 2012 52
● HEAD OFFICE / ENGINEERING CENTER Chiba, Japan
● TOKYO HEAD OFFICE Tokyo, Japan
————————————————————————————
Overseas Offices
● Beijing, China
● Jakarta, Indonesia
● Dubai, United Arab Emirates
● Tehran, Iran
● Moscow, Russia
————————————————————————————
OVERSEAS GROUP COMPANIES
■ Toyo Engineering Korea Limited Seoul, Korea
■ Toyo Engineering Corporation, China Shanghai, China
■ PT. Inti Karya Persada Tehnik (IKPT) Jakarta, Indonesia
■ Toyo Engineering & Construction Sdn. Bhd. Kuala Lumpur, Malaysia
■ Toyo Engineering India Limited Mumbai, India
■ Saudi Toyo Engineering Company Al Khobar, Saudi Arabia
■ Toyo Engineering Europe, S.r.I. Milan, Italy
■ Toyo Engineering Canada Ltd. Calgary, Canada
■ Toyo U.S.A., Inc. Houston, U.S.A.
■ Toyo Ingeniería de Venezuela, C.A. Caracas, Venezuela
■ Toyo do Brasil Consultoria e Construções Industriais Ltda. Rio de Janeiro, Brazil
————————————————————————————
OTHER AFFILIATES
■ TS Participações e Investimentos S.A. Sao Paulo, Brazil
■ Toyo-Thai Corporation Public Company Limited Bangkok, Thailand
■ Atlatec, S.A. de C.V. Monterrey, Mexico
————————————————————————————
DOMESTIC GROUP COMPANIES
TEC Air Service Corporation Travel and insurance services
TEC Business Services Corporation Staffing service, contracted business service, translation and interpretation service, facility management service
TEC Project Services Corporation EPC for plants and facilities
Chiba Data Center Corporation Website planning and its production & maintenance, data entry, and commercial printing
TEC Estate, Ltd. Property development and real estate business
Toyo Business Engineering Corporation System consulting and solutions provider
TEC Accounting & Consulting Ltd. Business support and consulting for accounting and accounting systems
(As of July 1, 2012)
Corporate Information

————————————————————————— ————————————————————————————————————————————————
Capital Stock ¥18,198 million————————————————————————— ————————————————————————————————————————————————
Stock Exchange Listing Tokyo Stock Exchange————————————————————————— ————————————————————————————————————————————————
Authorized Shares 500,000,000————————————————————————— ————————————————————————————————————————————————
Capital Stock Issued 192,792,539————————————————————————— ————————————————————————————————————————————————
Number of Shareholders 13,875————————————————————————— ————————————————————————————————————————————————
Administrator of Sumitomo Mitsui Trust Bank, LimitedShareholders’ Register 1-4-1 Marunouchi, Chiyoda-ku, Tokyo 100-0005, Japan
(As of March 31, 2012)
Stock Price
200
400
100
300
500
25,000
0
0 50,000
4 5 6 7 8 9 10 11 12 1 2 3 4 5 6 7 8 9 10 11 12 1 2 3 4 5 6 7 8 9 10 11 12 1 2 3
FY2011FY2009 FY2010
Trading Volume (Thousands of Shares)
(Yen)
Mitsui & Co., Ltd.
Japan Trustee Services Bank, Ltd. (Mitsui Chemicals, Inc. Retirement Benefit Trust Account re-entrusted by Chuo Mitsui Asset Trust and Banking Company, Ltd.)
The Master Trust Bank of Japan, Ltd. Trust Account
Japan Trustee Services Bank, Ltd. Trust Account
The Nomura Trust & Banking Co., Ltd. Trust Account
Taisei Corporation
Trust and Custody Services Bank, Ltd. Pension Trust Account
Japan Trustee Services Bank, Ltd. Trust Account 9
Sumitomo Mitsui Banking Corporation
The Chase Manhattan Bank, N.A. London S.L. Omnibus Account
43,770
25,703
10,653
7,043
5,422
5,000
4,424
3,335
2,350
1,923
Number of shares(thousands)
Percentage of total(%)
22.70
13.33
5.52
3.65
2.81
2.59
2.29
1.72
1.21
0.99
Major Shareholders:
Stock Chart:
Others 0.79
Financial institutions37.34
Domestic companies28.03
Individuals 20.09
Foreign shareholders 13.75
Type of Shareholder
(%)
53TOYO ENGINEERING CORPORATIONStock Information

Toyo Engineering Corporation
2-8-1 Akanehama,
Narashino-shi, Chiba 275-0024, Japan
Tel: 81-47-451-1111 Fax: 81-47-454-1800
http://www.toyo-eng.co.jp/
©2012 Toyo Engineering Corp. Printed in Japan