JPMorgan Private Bank Funds I - J.P. Morgan Securities Pr… · JPMorgan Private Bank Funds I Board...
44
JPMorgan Private Bank Funds I Société d’Investissement à Capital Variable, Luxembourg AUDITED ANNUAL REPORT 31 MARCH 2011 REPORT FOR THE ATTENTION OF SWISS INVESTORS Certain of the sub-funds of the Fund are not authorised for offer or distribution in or from Switzerland. Accordingly, no reference is made to these sub-funds in this annual report. The attention of the investors is drawn to the fact that certain figures in this annual report are expressed on a consolidated basis and, thus, include the assets of those sub-funds which are not registered in Switzerland.
Transcript of JPMorgan Private Bank Funds I - J.P. Morgan Securities Pr… · JPMorgan Private Bank Funds I Board...
JPMorgan Private Bank Funds ISociété d’Investissement à Capital Variable, Luxembourg
CH-GB
AudIted ANNuAL RePoRt 31 MARCh 2011
RePoRt FoR the AtteNtIoN oF SwISS INVeStoRS
Certain of the sub-funds of the Fund are not authorised for offer or distribution in or from Switzerland. Accordingly, no reference is made to these sub-funds in this annual report. The attention of the investors is drawn to the fact that certain figures in this annual report are expressed on a consolidated basis and, thus, include the assets of those sub-funds which are not registered in Switzerland.
JPMorgan Private Bank Funds I
Audited Annual Report
As at 31 March 2011
Contents
Board of Directors 1
Management and Administration 2
Board of Directors’ Report 3
Investment Managers’ Report 4
Audit Report 5
Financial Statements and Statistical Information
Combined Statement of Net Assets 6-7Combined Statement of Operations and Changes in Net Assets 8-9Statement of Changes in the Number of Shares 10Statistical Information 11
Notes to the Financial Statements 12-16
Schedule of Investments
JPMorgan Private Bank Funds I - Access Balanced Fund (EUR) 17-19JPMorgan Private Bank Funds I - Access Balanced Fund (USD) 20-21JPMorgan Private Bank Funds I - Access Conservative Fund (EUR) 22-23JPMorgan Private Bank Funds I - Diversified Fixed Income Fund (EUR) 24-25JPMorgan Private Bank Funds I - Diversified Fixed Income Fund (USD) 26-27JPMorgan Private Bank Funds I - International Currency Fixed Income Fund 28-30JPMorgan Private Bank Funds I - Islamic Global Dynamic Equity Fund 31-33
Appendix: Unaudited Additional Disclosures
Fund Expense Ratios and Capped Expense Ratios 34Summary of Investment Objectives of the Sub-Funds 35Performance and Volatility 36Interest Rate Received/(Charged) on Bank Accounts 37Sub-Fund Share Classes Subject to Taxe d’Abonnement Rate of 0.01% 37Portfolio Turnover Ratio 37Historical Statement of Changes in the Number of Shares 38-39
No subscriptions can be received solely on the basis of this report. Subscriptions are only valid if made on the basis of the current prospectus, thecurrent simplified prospectus, supplemented by the latest audited annual report and, if published thereafter, the latest unaudited semi-annualreport.
The current prospectus, the current simplified prospectus, the unaudited semi-annual reports, as well as the audited annual reports can be obtainedfree of charge from the registered office of the SICAV and from the principal local paying agent.

JPMorgan Private Bank Funds I
Board of Directors
As at 31 March 2011
ChairmanJacques ElvingerPartnerElvinger, Hoss & Prussen2, place Winston ChurchillL-2014 LuxembourgGrand Duchy of Luxembourg
DirectorsAlain FeisInterinvest S.A.17, rue Antoine JansL-1820 LuxembourgGrand Duchy of Luxembourg
Jean FuchsFuchs & Associés Finance47, Boulevard Prince HenriL-1724, LuxembourgGrand Duchy of Luxembourg
Registered OfficeEuropean Bank & Business Centre6, route de TrèvesL-2633 SenningerbergGrand Duchy of Luxembourg
Benoît DumontManaging DirectorJ.P. Morgan (Suisse) S.A.8, rue de la ConfédérationCH-1204 GenevaSwitzerland
1

JPMorgan Private Bank Funds I
Management and Administration
As at 31 March 2011
Management Company, Registrar and Transfer Agent,Global Distributor and Domiciliary AgentJPMorgan Asset Management (Europe) S.à r.l.European Bank & Business Centre6, route de TrèvesL-2633 SenningerbergGrand Duchy of Luxembourg
Investment ManagersJ.P. Morgan International Bank Limited125 London WallLondon EC2Y 5AJUnited Kingdom
JPMorgan Asset Management (UK) Limited20 Finsbury StreetLondon EC2Y 9AQUnited Kingdom
JPMorgan Chase Bank National AssociationLondon Branch125 London WallLondon EC2Y 5AJUnited Kingdom
Custodian, Corporate and Administrative AgentJ.P. Morgan Bank Luxembourg S.A.European Bank & Business Centre6, route de TrèvesL-2633 SenningerbergGrand Duchy of Luxembourg
AuditorPricewaterhouseCoopers S.à r.l.400, Route d’EschB.P. 1443L-1014 LuxembourgGrand Duchy of Luxembourg
Legal AdviserElvinger, Hoss & Prussen2, place Winston ChurchillL-2014 LuxembourgGrand Duchy of Luxembourg
2

JPMorgan Private Bank Funds I
Board of Directors’ Report
As at 31 March 2011
The Board of Directors is pleased to present the Audited Annual Report for the year ended 31 March 2011.
Structure and Size of the FundJPMorgan Private Bank Funds I (the “Fund”) is a variable capital investment company, organised as a “Société Anonyme” under the laws ofthe Grand Duchy of Luxembourg. The Fund is organised as an “umbrella” with a number of Sub-Funds, each of which have their owninvestment policy and restrictions. At year end, the Fund has issued shares in 9 Sub-Funds.
The total net assets of the Fund increased from USD 1.6 billion to USD 2.5 billion at year end.
The following Sub-Funds were launched during the year:JPMorgan Private Bank Funds I – Access Balanced Fund (USD) on 20 October 2010;JPMorgan Private Bank Funds I – Access Conservative Fund (EUR) on 8 December 2010;
The Fund qualifies as an Undertaking for Collective Investments in Transferable Securities under the amended EC Directive 85/611 of20 December 1985 and may therefore be offered for sale in European Union Member States, subject to registration in countries other thanthe Grand Duchy of Luxembourg. In addition, applications to register the Fund and its Sub-Funds may be made in other countries.
The Fund and the Sub-Funds are currently registered for offer and distribution in the Grand Duchy of Luxembourg and in the followingjurisdictions: Belgium, France, Germany, Ireland, Italy, Singapore, Spain, Switzerland and the United Kingdom.
With effect from 1 July 2011, the Fund will, as a consequence of the repealing of the aforementioned EC Directive 85/611, qualify as anUndertaking for Collective Investment in Transferable Securities under the EC Directive 2009/65 of 13 July 2009 and be subject to theLuxembourg law of 17 December 2010 relating to Undertakings for Collective Investment.
Responsibility of the DirectorsThe responsibility of the Directors of the Fund is governed by Luxembourg law. With respect to the annual accounts of the Fund, the duties ofthe Directors are governed by general corporate law and the law of 19 December 2002 on, inter alia, the accounting and annual accounts ofundertakings and by the law of 20 December 2002 relating to undertakings for collective investments.
ALFI Code of ConductFollowing its introduction the Board of Directors has adopted the ALFI Code of Conduct (the “Code”) which sets out principles of goodgovernance. The Board of Directors considers that the Fund has been in compliance with the Code in all material aspects throughout thefinancial year ended 31 March 2011.
Annual General MeetingThe Annual General Meeting of the SICAV will be held at the Registered Office on Friday 29 July 2011.
The Board of DirectorsLuxembourg, 10 June 2011
3
JPMorgan Private Bank Funds I
Investment Managers’ Report
As at 31 March 2011
Market review
Although the 12 months under review were volatile for global equity markets, overall they yielded positive returns. The MSCI World Index wasup 8.7% in euro terms over the 12 months to 31 March 2011.
The review period began on a negative note as the Greek economy buckled under a mountain of public debt. Although the ailing Greekeconomy was eventually bailed out by the European Union (EU) and the International Monetary Fund (IMF) in early May 2010, the Greek crisisled to concerns about the financial status of other highly indebted peripheral eurozone countries - mainly Ireland, Italy, Portugal and Spain.Peripheral credit ratings were downgraded and bond spreads widened as traders sought to reduce their risk.
With the US economic recovery still looking fragile, Ben Bernanke, chairman of the US Federal Reserve (Fed), talked of the need for a secondround of quantitative easing (QE2). In September and October there was a significant rally in markets as investors changed allocationpriorities towards equities in anticipation of QE2. On 3 November, the Fed announced a larger-than-expected USD 600 billion asset purchasepackage, which was well received by the market.
However, the global stock market rally faltered in late November, as eurozone sovereign debt and Chinese inflation concerns furtherundermined investor confidence. Chinese inflation, which had been in retreat in the summer, jumped in November as commodity prices rose.This reignited fears that the Chinese economy may be overheating. Meanwhile, in the peripheral eurozone countries, bond yields andspreads over German Bunds reached their highest levels since the euro was founded as Ireland followed Greece and requested a rescuepackage from the EU and IMF.
The Irish bailout calmed nerves, helping global markets to regain their upward momentum towards the end of 2010. Sentiment was furthersupported in early 2011 by strong leading economic indicators from the developed world and generally good fourth-quarter corporateearnings results.
Geopolitical instability took centre stage in February, with political protests breaking out in Tunisia and Egypt. In March, violence escalatedand civil unrest spread to Bahrain and Libya, resulting in disruptions to the production of oil, which triggered a sharp rise in oil prices.
Developed country bond investors feared that rising oil prices would add to the existing inflationary pressure, resulting inearlier-than-expected interest rate rises. Meanwhile, in emerging markets, central banks in Brazil, Korea, India and Thailand raised their keylending rates in an effort to combat rising prices. In China, higher interest rates and lending curbs reduced credit demand. However,investors worried that aggressive monetary policy tightening - the People’s Bank of China has already raised interest rates three times in2011 - could risk a prolonged slowdown in domestic demand growth.
In mid March, markets succumbed to further uncertainty following a massive earthquake in Japan, measuring 9.0 in magnitude. The quakeand resulting tsunami caused huge economic and physical capital losses and sparked a nuclear crisis, with an accident at the Fukushimanuclear plant leading to growing radiation fears. Concerns about the repercussions of the earthquake resulted in losses for markets globallyand further volatility was caused by Portugal, which became the third eurozone country to request a bailout at the end of the review period.However, investors reacted positively to the announcement from the EU aimed at averting future debt problems and most markets rallied inlate March.
Market outlook
Global stock markets continue to offer attractive upside potential, but they are likely to experience further volatility over the course of theyear as civil unrest in the Middle East and North Africa persists and central banks grapple with rising inflation. The Japanese stock market islikely to remain volatile while the economic impact of the quake becomes clearer; however, in the long term, the earthquake in unlikely toderail the global recovery.
In fact the global economy continues to improve, with the private sector now beginning to pick up the slack as public sector stimulus fades.The IMF’s World Economic Outlook expects global growth of about 4.5% for 2011 and 2012. However, the potential restriction to growth fromelevated oil prices remains a principal concern for global markets and, while Middle East unrest continues, investors are likely to remaincautious.
Another principal concern for investors globally is inflation. Emerging markets continue to tighten policy in the face of rising inflation, butdeveloped markets have begun to see the divergence in rising headline and core inflation translate into rising inflationary expectations. Webelieve emerging markets are ahead of the inflation curve. We also think markets are exaggerating the pace of tightening in Europe and hopeboth the UK and US can stave off raising policy rates until much later this year.
Importantly, equity markets remain attractively values. Although the pace of earnings growth is slowing globally, we believe earnings remainwell above trend and continue to support equities valuations - the pickup in global Mergers & Acquisitions activity echoes our view.Furthermore, believing markets are fairly valued allows investors to refocus on the fundamentals and stop chasing momentum. This shouldcreate a more rewarding investment environment for active managers and quantitative strategies alike.
For now, we expect equity risk premia and volatility to remain unusually high, which we believe creates investment opportunity for thoselong-term investors. However, as in 2010, there are going to be points where it is not going to feel good holding on to risk assets.
Investment ManagersLuxembourg, 10 June 2011
The information stated in this report is historical and not necessarily indicative of future performance.
4
Audit Report
To the Shareholders ofJPMorgan Private Bank Funds I
Following our appointment by the General Meeting of the Shareholders of the SICAV dated 30 July 2010, we have audited the accompanyingfinancial statements of JPMorgan Private Bank Funds I and of each of its Sub-Funds , which comprise the Combined Statement of Net Assetsand the Schedule of Investments as at 31 March 2011 and the Combined Statement of Operations and Changes in Net Assets for the year thenended, and a summary of significant accounting policies and other explanatory notes to the financial statements.
Responsibility of the Board of Directors of the SICAV for the financial statementsThe Board of Directors of the SICAV is responsible for the preparation and fair presentation of these financial statements in accordance withLuxembourg legal and regulatory requirements relating to the preparation of the financial statements and for such internal control as theBoard of Directors of the SICAV determines is necessary to enable the preparation of financial statements that are free from materialmisstatement, whether due to fraud or error.
Responsibility of the “Réviseur d’entreprises agréé”Our responsibility is to express an opinion on these financial statements based on our audit. We conducted our audit in accordance withInternational Standards on Auditing as adopted for Luxembourg by the “Commission de Surveillance du Secteur Financier”. Those standardsrequire that we comply with ethical requirements and plan and perform the audit to obtain reasonable assurance whether the financialstatements are free from material misstatement.
An audit involves performing procedures to obtain audit evidence about the amounts and disclosures in the financial statements. Theprocedures selected depend on the judgment of the “Réviseur d’entreprises agréé”, including the assessment of the risks of materialmisstatement of the financial statements, whether due to fraud or error. In making those risk assessments, the “Réviseur d’entreprisesagréé” considers internal control relevant to the entity’s preparation and fair presentation of the financial statements in order to designaudit procedures that are appropriate in the circumstances, but not for the purpose of expressing an opinion on the effectiveness of theentity’s internal control. An audit also includes evaluating the appropriateness of accounting policies used and the reasonableness ofaccounting estimates made by the Board of Directors of the SICAV, as well as evaluating the overall presentation of the financial statements.
We believe that the audit evidence we have obtained is sufficient and appropriate to provide a basis for our audit opinion.
OpinionIn our opinion, the financial statements give a true and fair view of the financial position of JPMorgan Private Bank Funds I and of each of itsSub-Funds as of 31 March 2011, and of the results of their operations and changes in their net assets for the year then ended in accordancewith Luxembourg legal and regulatory requirements relating to the preparation of the financial statements.
Other mattersSupplementary information included in the annual report has been reviewed in the context of our mandate but has not been subject tospecific audit procedures carried out in accordance with the standards described above. Consequently, we express no opinion on suchinformation. However, we have no observation to make concerning such information in the context of the financial statements taken as awhole.
PricewaterhouseCoopers S.à r.l. Luxembourg, 10 June 2011Represented by
Régis Malcourant
PricewaterhouseCoopers S.à r.l., 400 Route d’Esch, B.P. 1443, L-1014 LuxembourgT: +352 494848 1, F:+352 494848 2900, www.pwc.lu
Cabinet de révision agréé. Expert-comptable (autorisation gouvernementale n° 00123693)R.C.S. Luxembourg B 65 477 - Capital social EUR 516 950 - TVA LU17564447
5
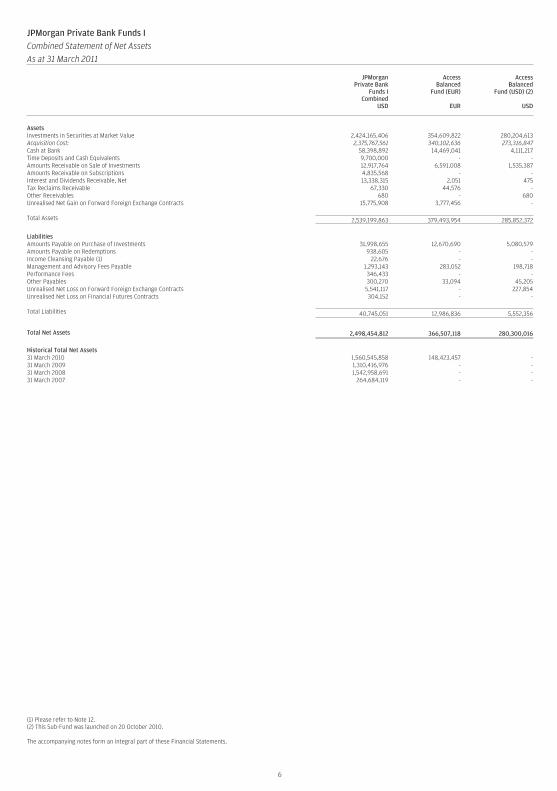
JPMorgan Private Bank Funds ICombined Statement of Net AssetsAs at 31 March 2011
JPMorganPrivate Bank
Funds ICombined
USD
AccessBalanced
Fund (EUR)
EUR
AccessBalanced
Fund (USD) (2)
USD
AssetsInvestments in Securities at Market Value 2,424,165,406 354,609,822 280,204,613Acquisition Cost: 2,375,767,561 340,102,636 273,316,847Cash at Bank 58,398,892 14,469,041 4,111,217Time Deposits and Cash Equivalents 9,700,000 - -Amounts Receivable on Sale of Investments 12,917,764 6,591,008 1,535,387Amounts Receivable on Subscriptions 4,835,568 - -Interest and Dividends Receivable, Net 13,338,315 2,051 475Tax Reclaims Receivable 67,330 44,576 -Other Receivables 680 - 680Unrealised Net Gain on Forward Foreign Exchange Contracts 15,775,908 3,777,456 -
Total Assets 2,539,199,863 379,493,954 285,852,372
LiabilitiesAmounts Payable on Purchase of Investments 31,998,655 12,670,690 5,080,579Amounts Payable on Redemptions 938,605 - -Income Cleansing Payable (1) 22,676 - -Management and Advisory Fees Payable 1,293,143 283,052 198,718Performance Fees 346,433 - -Other Payables 300,270 33,094 45,205Unrealised Net Loss on Forward Foreign Exchange Contracts 5,541,117 - 227,854Unrealised Net Loss on Financial Futures Contracts 304,152 - -
Total Liabilities 40,745,051 12,986,836 5,552,356
Total Net Assets 2,498,454,812 366,507,118 280,300,016
Historical Total Net Assets31 March 2010 1,560,545,858 148,423,457 -31 March 2009 1,310,416,976 - -31 March 2008 1,542,958,691 - -31 March 2007 264,684,119 - -
(1) Please refer to Note 12.(2) This Sub-Fund was launched on 20 October 2010.
The accompanying notes form an integral part of these Financial Statements.
6
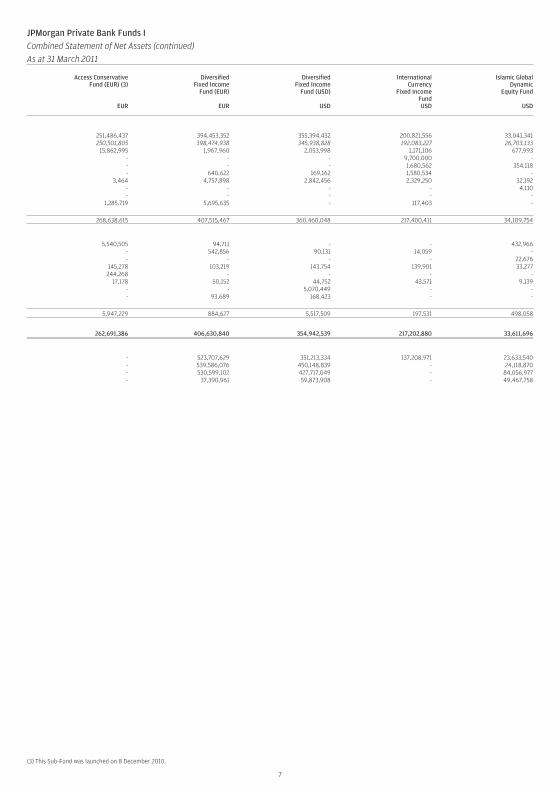
JPMorgan Private Bank Funds ICombined Statement of Net Assets (continued)As at 31 March 2011
Access ConservativeFund (EUR) (3)
EUR
DiversifiedFixed Income
Fund (EUR)
EUR
DiversifiedFixed Income
Fund (USD)
USD
InternationalCurrency
Fixed IncomeFundUSD
Islamic GlobalDynamic
Equity Fund
USD
251,486,437 394,453,352 355,394,432 200,821,556 33,041,341250,501,805 398,474,938 345,938,828 192,083,227 26,703,133
15,862,995 1,967,960 2,053,998 1,171,106 677,993- - - 9,700,000 -- - - 1,680,562 354,118- 640,622 169,162 1,580,534 -
3,464 4,757,898 2,842,456 2,329,250 32,192- - - - 4,110- - - - -
1,285,719 5,695,635 - 117,403 -
268,638,615 407,515,467 360,460,048 217,400,411 34,109,754
5,540,505 94,711 - - 432,966- 542,856 90,131 14,059 -- - - - 22,676
145,278 103,219 143,754 139,901 33,277244,268 - - - -
17,178 50,152 44,752 43,571 9,139- - 5,070,449 - -- 93,689 168,423 - -
5,947,229 884,627 5,517,509 197,531 498,058
262,691,386 406,630,840 354,942,539 217,202,880 33,611,696
- 523,707,629 351,213,334 137,208,971 23,633,540- 539,586,076 450,148,839 - 24,118,870- 530,599,102 427,717,049 - 84,056,977- 37,390,961 59,873,908 - 49,467,758
(3) This Sub-Fund was launched on 8 December 2010.
7
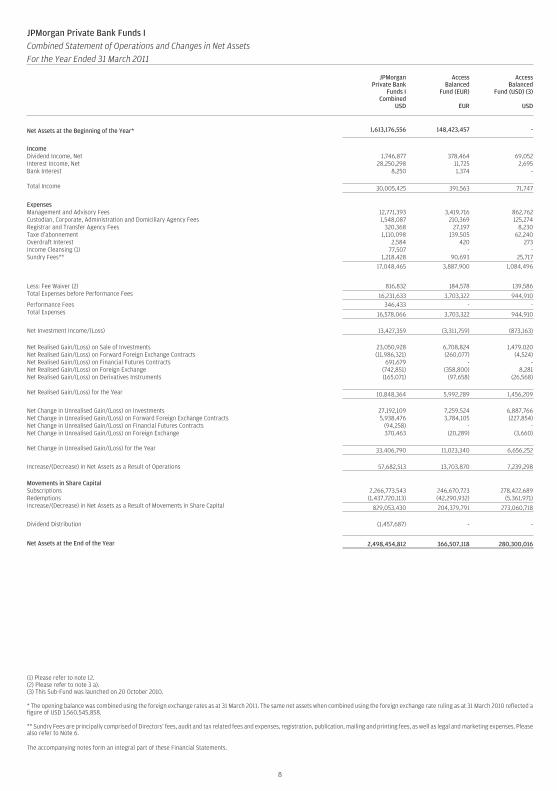
JPMorgan Private Bank Funds ICombined Statement of Operations and Changes in Net AssetsFor the Year Ended 31 March 2011
JPMorganPrivate Bank
Funds ICombined
USD
AccessBalanced
Fund (EUR)
EUR
AccessBalanced
Fund (USD) (3)
USD
Net Assets at the Beginning of the Year* 1,613,176,556 148,423,457 -
IncomeDividend Income, Net 1,746,877 378,464 69,052Interest Income, Net 28,250,298 11,725 2,695Bank Interest 8,250 1,374 -
Total Income 30,005,425 391,563 71,747
ExpensesManagement and Advisory Fees 12,771,393 3,419,716 862,762Custodian, Corporate, Administration and Domiciliary Agency Fees 1,548,087 210,369 125,274Registrar and Transfer Agency Fees 320,368 27,197 8,230Taxe d’abonnement 1,110,098 139,505 62,240Overdraft Interest 2,584 420 273Income Cleansing (1) 77,507 - -Sundry Fees** 1,218,428 90,693 25,717
17,048,465 3,887,900 1,084,496
Less: Fee Waiver (2) 816,832 184,578 139,586Total Expenses before Performance Fees 16,231,633 3,703,322 944,910Performance Fees 346,433 - -Total Expenses 16,578,066 3,703,322 944,910
Net Investment Income/(Loss) 13,427,359 (3,311,759) (873,163)
Net Realised Gain/(Loss) on Sale of Investments 23,050,928 6,708,824 1,479,020Net Realised Gain/(Loss) on Forward Foreign Exchange Contracts (11,986,321) (260,077) (4,524)Net Realised Gain/(Loss) on Financial Futures Contracts 691,679 - -Net Realised Gain/(Loss) on Foreign Exchange (742,851) (358,800) 8,281Net Realised Gain/(Loss) on Derivatives Instruments (165,071) (97,658) (26,568)
Net Realised Gain/(Loss) for the Year 10,848,364 5,992,289 1,456,209
Net Change in Unrealised Gain/(Loss) on Investments 27,192,109 7,259,524 6,887,766Net Change in Unrealised Gain/(Loss) on Forward Foreign Exchange Contracts 5,938,476 3,784,105 (227,854)Net Change in Unrealised Gain/(Loss) on Financial Futures Contracts (94,258) - -Net Change in Unrealised Gain/(Loss) on Foreign Exchange 370,463 (20,289) (3,660)
Net Change in Unrealised Gain/(Loss) for the Year 33,406,790 11,023,340 6,656,252
Increase/(Decrease) in Net Assets as a Result of Operations 57,682,513 13,703,870 7,239,298
Movements in Share CapitalSubscriptions 2,266,773,543 246,670,723 278,422,689Redemptions (1,437,720,113) (42,290,932) (5,361,971)Increase/(Decrease) in Net Assets as a Result of Movements in Share Capital 829,053,430 204,379,791 273,060,718
Dividend Distribution (1,457,687) - -
Net Assets at the End of the Year 2,498,454,812 366,507,118 280,300,016
(1) Please refer to note 12.(2) Please refer to note 3 a).(3) This Sub-Fund was launched on 20 October 2010.
* The opening balance was combined using the foreign exchange rates as at 31 March 2011. The same net assets when combined using the foreign exchange rate ruling as at 31 March 2010 reflected afigure of USD 1,560,545,858.
** Sundry Fees are principally comprised of Directors’ fees, audit and tax related fees and expenses, registration, publication, mailing and printing fees, as well as legal and marketing expenses. Pleasealso refer to Note 6.
The accompanying notes form an integral part of these Financial Statements.
8
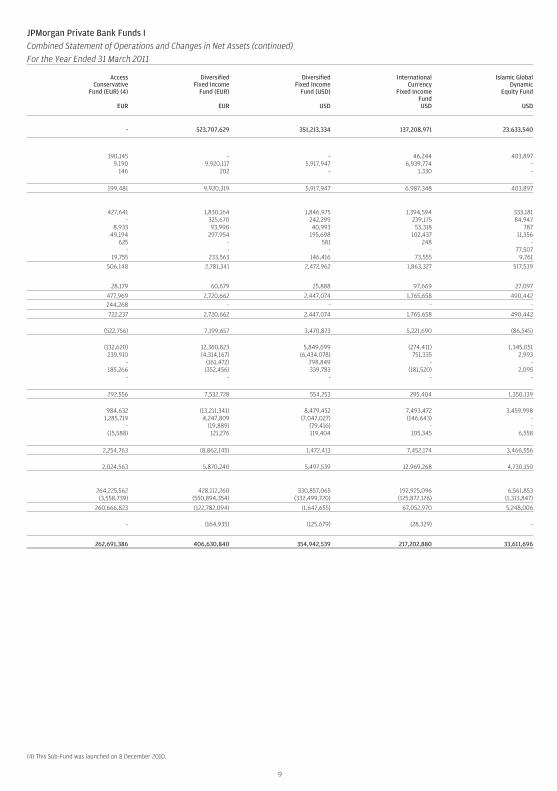
JPMorgan Private Bank Funds ICombined Statement of Operations and Changes in Net Assets (continued)For the Year Ended 31 March 2011
AccessConservative
Fund (EUR) (4)
EUR
DiversifiedFixed Income
Fund (EUR)
EUR
DiversifiedFixed Income
Fund (USD)
USD
InternationalCurrency
Fixed IncomeFundUSD
Islamic GlobalDynamic
Equity Fund
USD
- 523,707,629 351,213,334 137,208,971 23,633,540
190,145 - - 46,244 403,8979,190 9,920,117 5,917,947 6,939,774 -
146 202 - 1,330 -
199,481 9,920,319 5,917,947 6,987,348 403,897
427,641 1,830,164 1,846,975 1,394,594 333,181- 325,670 242,299 239,175 84,947
8,933 93,990 40,993 53,318 78749,194 297,954 195,698 102,437 11,356
625 - 581 248 -- - - - 77,507
19,755 233,563 146,416 73,555 9,761
506,148 2,781,341 2,472,962 1,863,327 517,539
28,179 60,679 25,888 97,669 27,097
477,969 2,720,662 2,447,074 1,765,658 490,442244,268 - - - -
722,237 2,720,662 2,447,074 1,765,658 490,442
(522,756) 7,199,657 3,470,873 5,221,690 (86,545)
(132,620) 12,360,823 5,849,699 (274,411) 1,345,051239,910 (4,314,167) (6,434,078) 751,335 2,993
- (161,472) 798,849 - -185,266 (352,456) 339,783 (181,520) 2,095
- - - - -
292,556 7,532,728 554,253 295,404 1,350,139
984,632 (13,211,341) 8,479,452 7,493,472 3,459,9981,285,719 4,247,809 (7,047,027) (146,643) -
- (19,889) (79,416) - -(15,588) 121,276 119,404 105,345 6,558
2,254,763 (8,862,145) 1,472,413 7,452,174 3,466,556
2,024,563 5,870,240 5,497,539 12,969,268 4,730,150
264,225,562 428,112,260 330,857,065 192,925,096 6,561,853(3,558,739) (550,894,354) (332,499,720) (125,872,126) (1,313,847)
260,666,823 (122,782,094) (1,642,655) 67,052,970 5,248,006
- (164,935) (125,679) (28,329) -
262,691,386 406,630,840 354,942,539 217,202,880 33,611,696
(4) This Sub-Fund was launched on 8 December 2010.
9
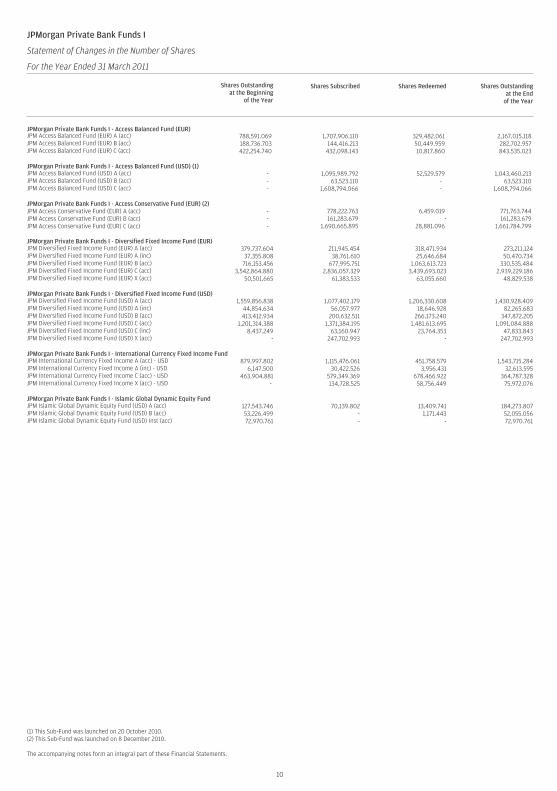
JPMorgan Private Bank Funds I
Statement of Changes in the Number of Shares
For the Year Ended 31 March 2011
Shares Outstandingat the Beginning
of the Year
Shares Subscribed Shares Redeemed Shares Outstandingat the End
of the Year
JPMorgan Private Bank Funds I - Access Balanced Fund (EUR)JPM Access Balanced Fund (EUR) A (acc) 788,591.069 1,707,906.110 329,482.061 2,167,015.118JPM Access Balanced Fund (EUR) B (acc) 188,736.703 144,416.213 50,449.959 282,702.957JPM Access Balanced Fund (EUR) C (acc) 422,254.740 432,098.143 10,817.860 843,535.023
JPMorgan Private Bank Funds I - Access Balanced Fund (USD) (1)JPM Access Balanced Fund (USD) A (acc) - 1,095,989.792 52,529.579 1,043,460.213JPM Access Balanced Fund (USD) B (acc) - 63,523.110 - 63,523.110JPM Access Balanced Fund (USD) C (acc) - 1,608,794.066 - 1,608,794.066
JPMorgan Private Bank Funds I - Access Conservative Fund (EUR) (2)JPM Access Conservative Fund (EUR) A (acc) - 778,222.763 6,459.019 771,763.744JPM Access Conservative Fund (EUR) B (acc) - 161,283.679 - 161,283.679JPM Access Conservative Fund (EUR) C (acc) - 1,690,665.895 28,881.096 1,661,784.799
JPMorgan Private Bank Funds I - Diversified Fixed Income Fund (EUR)JPM Diversified Fixed Income Fund (EUR) A (acc) 379,737.604 211,945.454 318,471.934 273,211.124JPM Diversified Fixed Income Fund (EUR) A (inc) 37,355.808 38,761.610 25,646.684 50,470.734JPM Diversified Fixed Income Fund (EUR) B (acc) 716,153.456 677,995.751 1,063,613.723 330,535.484JPM Diversified Fixed Income Fund (EUR) C (acc) 3,542,864.880 2,836,057.329 3,439,693.023 2,939,229.186JPM Diversified Fixed Income Fund (EUR) X (acc) 50,501.665 61,383.533 63,055.660 48,829.538
JPMorgan Private Bank Funds I - Diversified Fixed Income Fund (USD)JPM Diversified Fixed Income Fund (USD) A (acc) 1,559,856.838 1,077,402.179 1,206,330.608 1,430,928.409JPM Diversified Fixed Income Fund (USD) A (inc) 44,854.634 56,057.977 18,646.928 82,265.683JPM Diversified Fixed Income Fund (USD) B (acc) 413,412.934 200,632.511 266,173.240 347,872.205JPM Diversified Fixed Income Fund (USD) C (acc) 1,201,314.388 1,371,384.195 1,481,613.695 1,091,084.888JPM Diversified Fixed Income Fund (USD) C (inc) 8,437.249 63,160.947 23,764.353 47,833.843JPM Diversified Fixed Income Fund (USD) X (acc) - 247,702.993 - 247,702.993
JPMorgan Private Bank Funds I - International Currency Fixed Income FundJPM International Currency Fixed Income A (acc) - USD 879,997.802 1,115,476.061 451,758.579 1,543,715.284JPM International Currency Fixed Income A (inc) - USD 6,147.500 30,422.526 3,956.431 32,613.595JPM International Currency Fixed Income C (acc) - USD 463,904.881 579,349.369 678,466.922 364,787.328JPM International Currency Fixed Income X (acc) - USD - 134,728.525 58,756.449 75,972.076
JPMorgan Private Bank Funds I - Islamic Global Dynamic Equity FundJPM Islamic Global Dynamic Equity Fund (USD) A (acc) 127,543.746 70,139.802 13,409.741 184,273.807JPM Islamic Global Dynamic Equity Fund (USD) B (acc) 53,226.499 - 1,171.443 52,055.056JPM Islamic Global Dynamic Equity Fund (USD) Inst (acc) 72,970.761 - - 72,970.761
(1) This Sub-Fund was launched on 20 October 2010.(2) This Sub-Fund was launched on 8 December 2010.
The accompanying notes form an integral part of these Financial Statements.
10
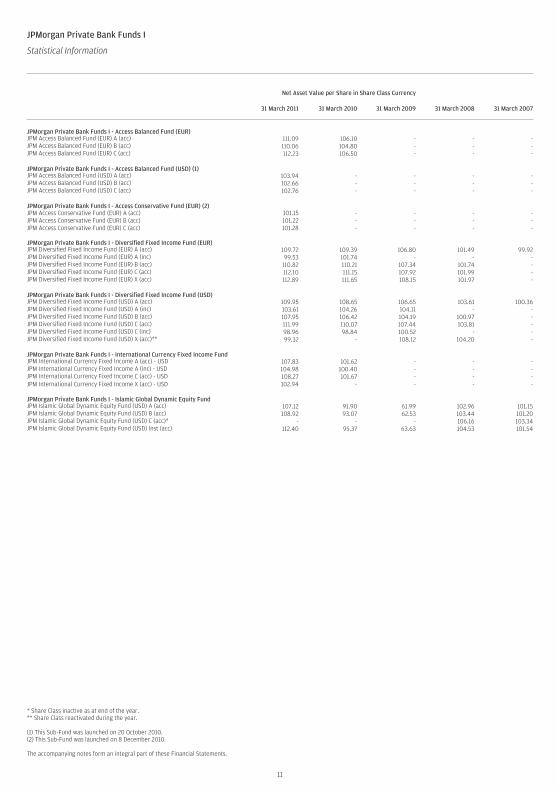
JPMorgan Private Bank Funds I
Statistical Information
Net Asset Value per Share in Share Class Currency
31 March 2011 31 March 2010 31 March 2009 31 March 2008 31 March 2007
JPMorgan Private Bank Funds I - Access Balanced Fund (EUR)JPM Access Balanced Fund (EUR) A (acc) 111.09 106.10 - - -JPM Access Balanced Fund (EUR) B (acc) 110.06 104.80 - - -JPM Access Balanced Fund (EUR) C (acc) 112.23 106.50 - - -
JPMorgan Private Bank Funds I - Access Balanced Fund (USD) (1)JPM Access Balanced Fund (USD) A (acc) 103.94 - - - -JPM Access Balanced Fund (USD) B (acc) 102.66 - - - -JPM Access Balanced Fund (USD) C (acc) 102.76 - - - -
JPMorgan Private Bank Funds I - Access Conservative Fund (EUR) (2)JPM Access Conservative Fund (EUR) A (acc) 101.15 - - - -JPM Access Conservative Fund (EUR) B (acc) 101.22 - - - -JPM Access Conservative Fund (EUR) C (acc) 101.28 - - - -
JPMorgan Private Bank Funds I - Diversified Fixed Income Fund (EUR)JPM Diversified Fixed Income Fund (EUR) A (acc) 109.72 109.39 106.80 101.49 99.92JPM Diversified Fixed Income Fund (EUR) A (inc) 99.53 101.74 - - -JPM Diversified Fixed Income Fund (EUR) B (acc) 110.82 110.21 107.34 101.74 -JPM Diversified Fixed Income Fund (EUR) C (acc) 112.10 111.15 107.92 101.99 -JPM Diversified Fixed Income Fund (EUR) X (acc) 112.89 111.65 108.15 101.97 -
JPMorgan Private Bank Funds I - Diversified Fixed Income Fund (USD)JPM Diversified Fixed Income Fund (USD) A (acc) 109.95 108.65 106.65 103.61 100.36JPM Diversified Fixed Income Fund (USD) A (inc) 103.61 104.26 104.11 - -JPM Diversified Fixed Income Fund (USD) B (acc) 107.95 106.42 104.19 100.97 -JPM Diversified Fixed Income Fund (USD) C (acc) 111.99 110.07 107.44 103.81 -JPM Diversified Fixed Income Fund (USD) C (inc) 98.96 98.84 100.52 - -JPM Diversified Fixed Income Fund (USD) X (acc)** 99.32 - 108.12 104.20 -
JPMorgan Private Bank Funds I - International Currency Fixed Income FundJPM International Currency Fixed Income A (acc) - USD 107.83 101.62 - - -JPM International Currency Fixed Income A (inc) - USD 104.98 100.40 - - -JPM International Currency Fixed Income C (acc) - USD 108.27 101.67 - - -JPM International Currency Fixed Income X (acc) - USD 102.94 - - - -
JPMorgan Private Bank Funds I - Islamic Global Dynamic Equity FundJPM Islamic Global Dynamic Equity Fund (USD) A (acc) 107.12 91.90 61.99 102.96 101.15JPM Islamic Global Dynamic Equity Fund (USD) B (acc) 108.92 93.07 62.53 103.44 101.20JPM Islamic Global Dynamic Equity Fund (USD) C (acc)* - - - 106.16 103.34JPM Islamic Global Dynamic Equity Fund (USD) Inst (acc) 112.40 95.37 63.63 104.53 101.54
* Share Class inactive as at end of the year.** Share Class reactivated during the year.
(1) This Sub-Fund was launched on 20 October 2010.(2) This Sub-Fund was launched on 8 December 2010.
The accompanying notes form an integral part of these Financial Statements.
11
12
JPMorgan Private Bank Funds I
Notes to the Financial Statements
As at 31 March 2011
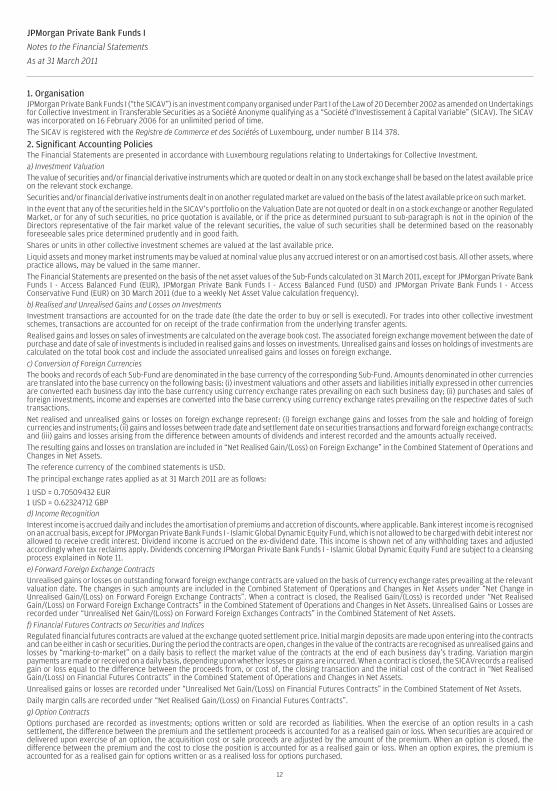
1. OrganisationJPMorgan Private Bank Funds I (“the SICAV”) is an investment company organised under Part I of the Law of 20 December 2002 as amended on Undertakingsfor Collective Investment in Transferable Securities as a Société Anonyme qualifying as a “Société d’Investissement à Capital Variable” (SICAV). The SICAVwas incorporated on 16 February 2006 for an unlimited period of time.The SICAV is registered with the Registre de Commerce et des Sociétés of Luxembourg, under number B 114 378.
2. Significant Accounting PoliciesThe Financial Statements are presented in accordance with Luxembourg regulations relating to Undertakings for Collective Investment.a) Investment ValuationThe value of securities and/or financial derivative instruments which are quoted or dealt in on any stock exchange shall be based on the latest available priceon the relevant stock exchange.Securities and/or financial derivative instruments dealt in on another regulated market are valued on the basis of the latest available price on such market.In the event that any of the securities held in the SICAV’s portfolio on the Valuation Date are not quoted or dealt in on a stock exchange or another RegulatedMarket, or for any of such securities, no price quotation is available, or if the price as determined pursuant to sub-paragraph is not in the opinion of theDirectors representative of the fair market value of the relevant securities, the value of such securities shall be determined based on the reasonablyforeseeable sales price determined prudently and in good faith.Shares or units in other collective investment schemes are valued at the last available price.Liquid assets and money market instruments may be valued at nominal value plus any accrued interest or on an amortised cost basis. All other assets, wherepractice allows, may be valued in the same manner.The Financial Statements are presented on the basis of the net asset values of the Sub-Funds calculated on 31 March 2011, except for JPMorgan Private BankFunds I - Access Balanced Fund (EUR), JPMorgan Private Bank Funds I - Access Balanced Fund (USD) and JPMorgan Private Bank Funds I - AccessConservative Fund (EUR) on 30 March 2011 (due to a weekly Net Asset Value calculation frequency).b) Realised and Unrealised Gains and Losses on InvestmentsInvestment transactions are accounted for on the trade date (the date the order to buy or sell is executed). For trades into other collective investmentschemes, transactions are accounted for on receipt of the trade confirmation from the underlying transfer agents.Realised gains and losses on sales of investments are calculated on the average book cost. The associated foreign exchange movement between the date ofpurchase and date of sale of investments is included in realised gains and losses on investments. Unrealised gains and losses on holdings of investments arecalculated on the total book cost and include the associated unrealised gains and losses on foreign exchange.c) Conversion of Foreign CurrenciesThe books and records of each Sub-Fund are denominated in the base currency of the corresponding Sub-Fund. Amounts denominated in other currenciesare translated into the base currency on the following basis: (i) investment valuations and other assets and liabilities initially expressed in other currenciesare converted each business day into the base currency using currency exchange rates prevailing on each such business day; (ii) purchases and sales offoreign investments, income and expenses are converted into the base currency using currency exchange rates prevailing on the respective dates of suchtransactions.Net realised and unrealised gains or losses on foreign exchange represent: (i) foreign exchange gains and losses from the sale and holding of foreigncurrencies and instruments; (ii) gains and losses between trade date and settlement date on securities transactions and forward foreign exchange contracts;and (iii) gains and losses arising from the difference between amounts of dividends and interest recorded and the amounts actually received.The resulting gains and losses on translation are included in “Net Realised Gain/(Loss) on Foreign Exchange” in the Combined Statement of Operations andChanges in Net Assets.The reference currency of the combined statements is USD.The principal exchange rates applied as at 31 March 2011 are as follows:
1 USD = 0.70509432 EUR1 USD = 0.62324712 GBPd) Income RecognitionInterest income is accrued daily and includes the amortisation of premiums and accretion of discounts, where applicable. Bank interest income is recognisedon an accrual basis, except for JPMorgan Private Bank Funds I - Islamic Global Dynamic Equity Fund, which is not allowed to be charged with debit interest norallowed to receive credit interest. Dividend income is accrued on the ex-dividend date. This income is shown net of any withholding taxes and adjustedaccordingly when tax reclaims apply. Dividends concerning JPMorgan Private Bank Funds I - Islamic Global Dynamic Equity Fund are subject to a cleansingprocess explained in Note 11.e) Forward Foreign Exchange ContractsUnrealised gains or losses on outstanding forward foreign exchange contracts are valued on the basis of currency exchange rates prevailing at the relevantvaluation date. The changes in such amounts are included in the Combined Statement of Operations and Changes in Net Assets under “Net Change inUnrealised Gain/(Loss) on Forward Foreign Exchange Contracts”. When a contract is closed, the Realised Gain/(Loss) is recorded under “Net RealisedGain/(Loss) on Forward Foreign Exchange Contracts” in the Combined Statement of Operations and Changes in Net Assets. Unrealised Gains or Losses arerecorded under “Unrealised Net Gain/(Loss) on Forward Foreign Exchanges Contracts” in the Combined Statement of Net Assets.f) Financial Futures Contracts on Securities and IndicesRegulated financial futures contracts are valued at the exchange quoted settlement price. Initial margin deposits are made upon entering into the contractsand can be either in cash or securities. During the period the contracts are open, changes in the value of the contracts are recognised as unrealised gains andlosses by “marking-to-market” on a daily basis to reflect the market value of the contracts at the end of each business day’s trading. Variation marginpayments are made or received on a daily basis, depending upon whether losses or gains are incurred. When a contract is closed, the SICAVrecords a realisedgain or loss equal to the difference between the proceeds from, or cost of, the closing transaction and the initial cost of the contract in “Net RealisedGain/(Loss) on Financial Futures Contracts” in the Combined Statement of Operations and Changes in Net Assets.Unrealised gains or losses are recorded under “Unrealised Net Gain/(Loss) on Financial Futures Contracts” in the Combined Statement of Net Assets.Daily margin calls are recorded under “Net Realised Gain/(Loss) on Financial Futures Contracts”.g) Option ContractsOptions purchased are recorded as investments; options written or sold are recorded as liabilities. When the exercise of an option results in a cashsettlement, the difference between the premium and the settlement proceeds is accounted for as a realised gain or loss. When securities are acquired ordelivered upon exercise of an option, the acquisition cost or sale proceeds are adjusted by the amount of the premium. When an option is closed, thedifference between the premium and the cost to close the position is accounted for as a realised gain or loss. When an option expires, the premium isaccounted for as a realised gain for options written or as a realised loss for options purchased.
JPMorgan Private Bank Funds I
Notes to the Financial Statements (continued)
As at 31 March 2011
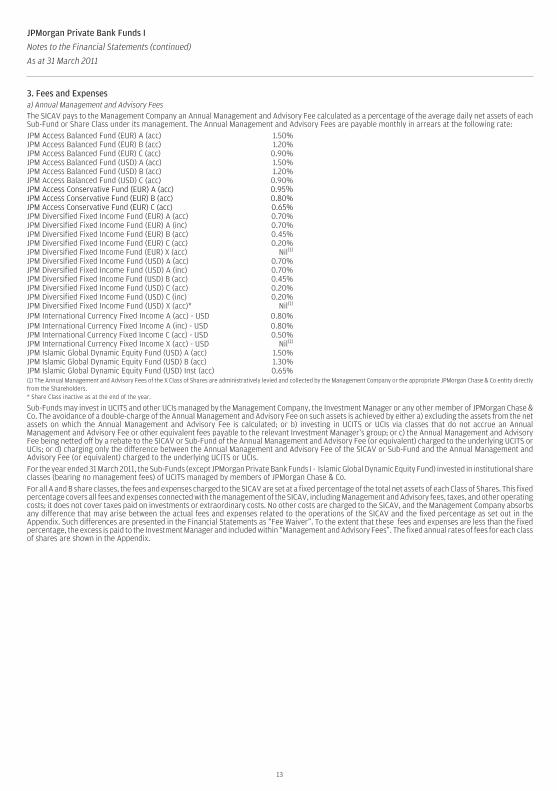
3. Fees and Expensesa) Annual Management and Advisory FeesThe SICAV pays to the Management Company an Annual Management and Advisory Fee calculated as a percentage of the average daily net assets of eachSub-Fund or Share Class under its management. The Annual Management and Advisory Fees are payable monthly in arrears at the following rate:JPM Access Balanced Fund (EUR) A (acc) 1.50%JPM Access Balanced Fund (EUR) B (acc) 1.20%JPM Access Balanced Fund (EUR) C (acc) 0.90%JPM Access Balanced Fund (USD) A (acc) 1.50%JPM Access Balanced Fund (USD) B (acc) 1.20%JPM Access Balanced Fund (USD) C (acc) 0.90%JPM Access Conservative Fund (EUR) A (acc) 0.95%JPM Access Conservative Fund (EUR) B (acc) 0.80%JPM Access Conservative Fund (EUR) C (acc) 0.65%JPM Diversified Fixed Income Fund (EUR) A (acc) 0.70%JPM Diversified Fixed Income Fund (EUR) A (inc) 0.70%JPM Diversified Fixed Income Fund (EUR) B (acc) 0.45%JPM Diversified Fixed Income Fund (EUR) C (acc) 0.20%JPM Diversified Fixed Income Fund (EUR) X (acc) Nil(1)
JPM Diversified Fixed Income Fund (USD) A (acc) 0.70%JPM Diversified Fixed Income Fund (USD) A (inc) 0.70%JPM Diversified Fixed Income Fund (USD) B (acc) 0.45%JPM Diversified Fixed Income Fund (USD) C (acc) 0.20%JPM Diversified Fixed Income Fund (USD) C (inc) 0.20%JPM Diversified Fixed Income Fund (USD) X (acc)* Nil(1)
JPM International Currency Fixed Income A (acc) - USD 0.80%JPM International Currency Fixed Income A (inc) - USD 0.80%JPM International Currency Fixed Income C (acc) - USD 0.50%JPM International Currency Fixed Income X (acc) - USD Nil(1)
JPM Islamic Global Dynamic Equity Fund (USD) A (acc) 1.50%JPM Islamic Global Dynamic Equity Fund (USD) B (acc) 1.30%JPM Islamic Global Dynamic Equity Fund (USD) Inst (acc) 0.65%(1) The Annual Management and Advisory Fees of the X Class of Shares are administratively levied and collected by the Management Company or the appropriate JPMorgan Chase & Co entity directlyfrom the Shareholders.* Share Class inactive as at the end of the year.
Sub-Funds may invest in UCITS and other UCIs managed by the Management Company, the Investment Manager or any other member of JPMorgan Chase &Co. The avoidance of a double-charge of the Annual Management and Advisory Fee on such assets is achieved by either a) excluding the assets from the netassets on which the Annual Management and Advisory Fee is calculated; or b) investing in UCITS or UCIs via classes that do not accrue an AnnualManagement and Advisory Fee or other equivalent fees payable to the relevant Investment Manager’s group; or c) the Annual Management and AdvisoryFee being netted off by a rebate to the SICAV or Sub-Fund of the Annual Management and Advisory Fee (or equivalent) charged to the underlying UCITS orUCIs; or d) charging only the difference between the Annual Management and Advisory Fee of the SICAV or Sub-Fund and the Annual Management andAdvisory Fee (or equivalent) charged to the underlying UCITS or UCIs.For the year ended 31 March 2011, the Sub-Funds (except JPMorgan Private Bank Funds I - Islamic Global Dynamic Equity Fund) invested in institutional shareclasses (bearing no management fees) of UCITS managed by members of JPMorgan Chase & Co.For all A and B share classes, the fees and expenses charged to the SICAV are set at a fixed percentage of the total net assets of each Class of Shares. This fixedpercentage covers all fees and expenses connected with the management of the SICAV, including Management and Advisory fees, taxes, and other operatingcosts; it does not cover taxes paid on investments or extraordinary costs. No other costs are charged to the SICAV, and the Management Company absorbsany difference that may arise between the actual fees and expenses related to the operations of the SICAV and the fixed percentage as set out in theAppendix. Such differences are presented in the Financial Statements as “Fee Waiver”. To the extent that these fees and expenses are less than the fixedpercentage, the excess is paid to the Investment Manager and included within “Management and Advisory Fees”. The fixed annual rates of fees for each classof shares are shown in the Appendix.
13
JPMorgan Private Bank Funds I
Notes to the Financial Statements (continued)
As at 31 March 2011
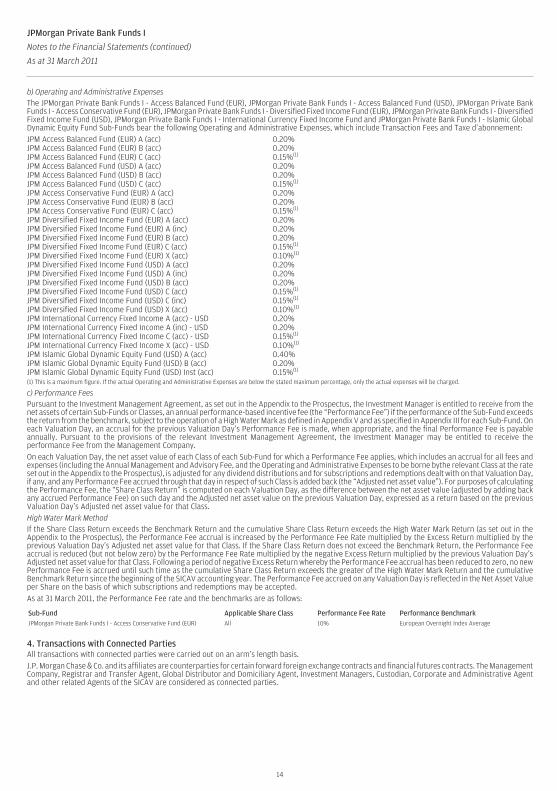
b) Operating and Administrative ExpensesThe JPMorgan Private Bank Funds I - Access Balanced Fund (EUR), JPMorgan Private Bank Funds I - Access Balanced Fund (USD), JPMorgan Private BankFunds I - Access Conservative Fund (EUR), JPMorgan Private Bank Funds I - Diversified Fixed Income Fund (EUR), JPMorgan Private Bank Funds I - DiversifiedFixed Income Fund (USD), JPMorgan Private Bank Funds I - International Currency Fixed Income Fund and JPMorgan Private Bank Funds I - Islamic GlobalDynamic Equity Fund Sub-Funds bear the following Operating and Administrative Expenses, which include Transaction Fees and Taxe d’abonnement:JPM Access Balanced Fund (EUR) A (acc) 0.20%JPM Access Balanced Fund (EUR) B (acc) 0.20%JPM Access Balanced Fund (EUR) C (acc) 0.15%(1)
JPM Access Balanced Fund (USD) A (acc) 0.20%JPM Access Balanced Fund (USD) B (acc) 0.20%JPM Access Balanced Fund (USD) C (acc) 0.15%(1)
JPM Access Conservative Fund (EUR) A (acc) 0.20%JPM Access Conservative Fund (EUR) B (acc) 0.20%JPM Access Conservative Fund (EUR) C (acc) 0.15%(1)
JPM Diversified Fixed Income Fund (EUR) A (acc) 0.20%JPM Diversified Fixed Income Fund (EUR) A (inc) 0.20%JPM Diversified Fixed Income Fund (EUR) B (acc) 0.20%JPM Diversified Fixed Income Fund (EUR) C (acc) 0.15%(1)
JPM Diversified Fixed Income Fund (EUR) X (acc) 0.10%(1)
JPM Diversified Fixed Income Fund (USD) A (acc) 0.20%JPM Diversified Fixed Income Fund (USD) A (inc) 0.20%JPM Diversified Fixed Income Fund (USD) B (acc) 0.20%JPM Diversified Fixed Income Fund (USD) C (acc) 0.15%(1)
JPM Diversified Fixed Income Fund (USD) C (inc) 0.15%(1)
JPM Diversified Fixed Income Fund (USD) X (acc) 0.10%(1)
JPM International Currency Fixed Income A (acc) - USD 0.20%JPM International Currency Fixed Income A (inc) - USD 0.20%JPM International Currency Fixed Income C (acc) - USD 0.15%(1)
JPM International Currency Fixed Income X (acc) - USD 0.10%(1)
JPM Islamic Global Dynamic Equity Fund (USD) A (acc) 0.40%JPM Islamic Global Dynamic Equity Fund (USD) B (acc) 0.20%JPM Islamic Global Dynamic Equity Fund (USD) Inst (acc) 0.15%(1)
(1) This is a maximum figure. If the actual Operating and Administrative Expenses are below the stated maximum percentage, only the actual expenses will be charged.
c) Performance FeesPursuant to the Investment Management Agreement, as set out in the Appendix to the Prospectus, the Investment Manager is entitled to receive from thenet assets of certain Sub-Funds or Classes, an annual performance-based incentive fee (the “Performance Fee”) if the performance of the Sub-Fund exceedsthe return from the benchmark, subject to the operation of a High Water Mark as defined in Appendix V and as specified in Appendix III for each Sub-Fund. Oneach Valuation Day, an accrual for the previous Valuation Day’s Performance Fee is made, when appropriate, and the final Performance Fee is payableannually. Pursuant to the provisions of the relevant Investment Management Agreement, the Investment Manager may be entitled to receive theperformance Fee from the Management Company.On each Valuation Day, the net asset value of each Class of each Sub-Fund for which a Performance Fee applies, which includes an accrual for all fees andexpenses (including the Annual Management and Advisory Fee, and the Operating and Administrative Expenses to be borne bythe relevant Class at the rateset out in the Appendix to the Prospectus), is adjusted for any dividend distributions and for subscriptions and redemptions dealt with on that Valuation Day,if any, and any Performance Fee accrued through that day in respect of such Class is added back (the “Adjusted net asset value”). For purposes of calculatingthe Performance Fee, the “Share Class Return” is computed on each Valuation Day, as the difference between the net asset value (adjusted by adding backany accrued Performance Fee) on such day and the Adjusted net asset value on the previous Valuation Day, expressed as a return based on the previousValuation Day’s Adjusted net asset value for that Class.High Water Mark MethodIf the Share Class Return exceeds the Benchmark Return and the cumulative Share Class Return exceeds the High Water Mark Return (as set out in theAppendix to the Prospectus), the Performance Fee accrual is increased by the Performance Fee Rate multiplied by the Excess Return multiplied by theprevious Valuation Day’s Adjusted net asset value for that Class. If the Share Class Return does not exceed the Benchmark Return, the Performance Feeaccrual is reduced (but not below zero) by the Performance Fee Rate multiplied by the negative Excess Return multiplied by the previous Valuation Day’sAdjusted net asset value for that Class. Following a period of negative Excess Return whereby the Performance Fee accrual has been reduced to zero, no newPerformance Fee is accrued until such time as the cumulative Share Class Return exceeds the greater of the High Water Mark Return and the cumulativeBenchmark Return since the beginning of the SICAV accounting year. The Performance Fee accrued on any Valuation Day is reflected in the Net Asset Valueper Share on the basis of which subscriptions and redemptions may be accepted.As at 31 March 2011, the Performance Fee rate and the benchmarks are as follows:
Sub-Fund Applicable Share Class Performance Fee Rate Performance BenchmarkJPMorgan Private Bank Funds I - Access Conservative Fund (EUR) All 10% European Overnight Index Average
4. Transactions with Connected PartiesAll transactions with connected parties were carried out on an arm’s length basis.J.P. Morgan Chase & Co. and its affiliates are counterparties for certain forward foreign exchange contracts and financial futures contracts. The ManagementCompany, Registrar and Transfer Agent, Global Distributor and Domiciliary Agent, Investment Managers, Custodian, Corporate and Administrative Agentand other related Agents of the SICAV are considered as connected parties.
14
JPMorgan Private Bank Funds I
Notes to the Financial Statements (continued)
As at 31 March 2011
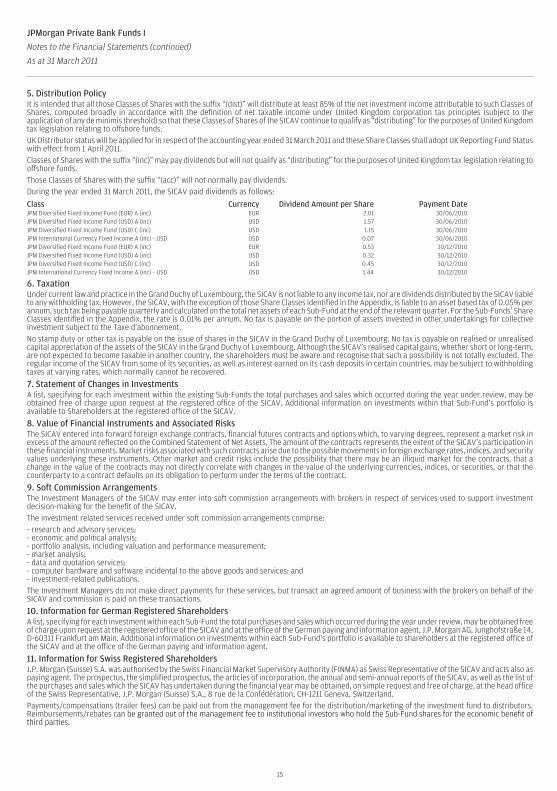
5. Distribution PolicyIt is intended that all those Classes of Shares with the suffix “(dist)” will distribute at least 85% of the net investment income attributable to such Classes ofShares, computed broadly in accordance with the definition of net taxable income under United Kingdom corporation tax principles (subject to theapplication of any de minimis threshold) so that these Classes of Shares of the SICAV continue to qualify as “distributing” for the purposes of United Kingdomtax legislation relating to offshore funds.UK Distributor status will be applied for in respect of the accounting year ended 31 March 2011 and these Share Classes shall adopt UK Reporting Fund Statuswith effect from 1 April 2011.Classes of Shares with the suffix “(inc)” may pay dividends but will not qualify as “distributing” for the purposes of United Kingdom tax legislation relating tooffshore funds.Those Classes of Shares with the suffix “(acc)” will not normally pay dividends.During the year ended 31 March 2011, the SICAV paid dividends as follows:
Class Currency Dividend Amount per Share Payment DateJPM Diversified Fixed Income Fund (EUR) A (inc) EUR 2.01 30/06/2010JPM Diversified Fixed Income Fund (USD) A (inc) USD 1.57 30/06/2010JPM Diversified Fixed Income Fund (USD) C (inc) USD 1.15 30/06/2010JPM International Currency Fixed Income A (inc) - USD USD 0.07 30/06/2010JPM Diversified Fixed Income Fund (EUR) A (inc) EUR 0.53 30/12/2010JPM Diversified Fixed Income Fund (USD) A (inc) USD 0.32 30/12/2010JPM Diversified Fixed Income Fund (USD) C (inc) USD 0.45 30/12/2010JPM International Currency Fixed Income A (inc) - USD USD 1.44 30/12/2010
6. TaxationUnder current law and practice in the Grand Duchy of Luxembourg, the SICAV is not liable to any income tax, nor are dividends distributed by the SICAV liableto any withholding tax. However, the SICAV, with the exception of those Share Classes identified in the Appendix, is liable to an asset based tax of 0.05% perannum, such tax being payable quarterly and calculated on the total net assets of each Sub-Fund at the end of the relevant quarter. For the Sub-Funds’ ShareClasses identified in the Appendix, the rate is 0.01% per annum. No tax is payable on the portion of assets invested in other undertakings for collectiveinvestment subject to the Taxe d’abonnement.No stamp duty or other tax is payable on the issue of shares in the SICAV in the Grand Duchy of Luxembourg. No tax is payable on realised or unrealisedcapital appreciation of the assets of the SICAV in the Grand Duchy of Luxembourg. Although the SICAV’s realised capital gains, whether short or long-term,are not expected to become taxable in another country, the shareholders must be aware and recognise that such a possibility is not totally excluded. Theregular income of the SICAV from some of its securities, as well as interest earned on its cash deposits in certain countries, may be subject to withholdingtaxes at varying rates, which normally cannot be recovered.
7. Statement of Changes in InvestmentsA list, specifying for each investment within the existing Sub-Funds the total purchases and sales which occurred during the year under review, may beobtained free of charge upon request at the registered office of the SICAV. Additional information on investments within that Sub-Fund’s portfolio isavailable to Shareholders at the registered office of the SICAV.
8. Value of Financial Instruments and Associated RisksThe SICAV entered into forward foreign exchange contracts, financial futures contracts and options which, to varying degrees, represent a market risk inexcess of the amount reflected on the Combined Statement of Net Assets. The amount of the contracts represents the extent of the SICAV’s participation inthese financial instruments. Market risks associated with such contracts arise due to the possible movements in foreign exchange rates, indices, and securityvalues underlying these instruments. Other market and credit risks include the possibility that there may be an illiquid market for the contracts, that achange in the value of the contracts may not directly correlate with changes in the value of the underlying currencies, indices, or securities, or that thecounterparty to a contract defaults on its obligation to perform under the terms of the contract.
9. Soft Commission ArrangementsThe Investment Managers of the SICAV may enter into soft commission arrangements with brokers in respect of services used to support investmentdecision-making for the benefit of the SICAV.The investment related services received under soft commission arrangements comprise:- research and advisory services;- economic and political analysis;- portfolio analysis, including valuation and performance measurement;- market analysis;- data and quotation services;- computer hardware and software incidental to the above goods and services; and- investment-related publications.The Investment Managers do not make direct payments for these services, but transact an agreed amount of business with the brokers on behalf of theSICAV and commission is paid on these transactions.
10. Information for German Registered ShareholdersA list, specifying for each investment within each Sub-Fund the total purchases and sales which occurred during the year under review, may be obtained freeof charge upon request at the registered office of the SICAV and at the office of the German paying and information agent, J.P. Morgan AG, Junghofstraße 14,D-60311 Frankfurt am Main. Additional information on investments within each Sub-Fund’s portfolio is available to shareholders at the registered office ofthe SICAV and at the office of the German paying and information agent.
11. Information for Swiss Registered ShareholdersJ.P. Morgan (Suisse) S.A. was authorised by the Swiss Financial Market Supervisory Authority (FINMA) as Swiss Representative of the SICAV and acts also aspaying agent. The prospectus, the simplified prospectus, the articles of incorporation, the annual and semi-annual reports of the SICAV, as well as the list ofthe purchases and sales which the SICAV has undertaken during the financial year may be obtained, on simple request and free of charge, at the head officeof the Swiss Representative, J.P. Morgan (Suisse) S.A., 8 rue de la Confédération, CH-1211 Geneva, Switzerland.Payments/compensations (trailer fees) can be paid out from the management fee for the distribution/marketing of the investment fund to distributors.Reimbursements/rebates can be granted out of the management fee to institutional investors who hold the Sub-Fund shares for the economic benefit ofthird parties.
15
JPMorgan Private Bank Funds I
Notes to the Financial Statements (continued)
As at 31 March 2011
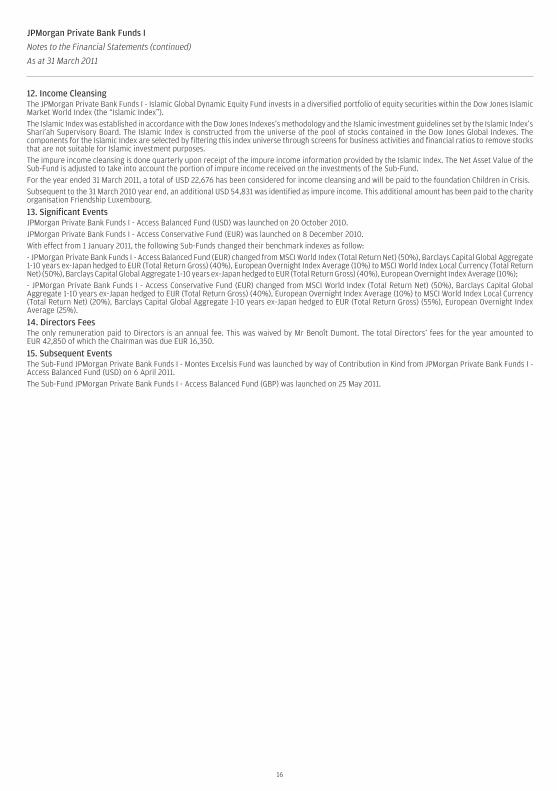
12. Income CleansingThe JPMorgan Private Bank Funds I - Islamic Global Dynamic Equity Fund invests in a diversified portfolio of equity securities within the Dow Jones IslamicMarket World Index (the “Islamic Index”).The Islamic Index was established in accordance with the Dow Jones Indexes’s methodology and the Islamic investment guidelines set by the Islamic Index’sShari’ah Supervisory Board. The Islamic Index is constructed from the universe of the pool of stocks contained in the Dow Jones Global Indexes. Thecomponents for the Islamic Index are selected by filtering this index universe through screens for business activities and financial ratios to remove stocksthat are not suitable for Islamic investment purposes.The impure income cleansing is done quarterly upon receipt of the impure income information provided by the Islamic Index. The Net Asset Value of theSub-Fund is adjusted to take into account the portion of impure income received on the investments of the Sub-Fund.For the year ended 31 March 2011, a total of USD 22,676 has been considered for income cleansing and will be paid to the foundation Children in Crisis.Subsequent to the 31 March 2010 year end, an additional USD 54,831 was identified as impure income. This additional amount has been paid to the charityorganisation Friendship Luxembourg.
13. Significant EventsJPMorgan Private Bank Funds I - Access Balanced Fund (USD) was launched on 20 October 2010.JPMorgan Private Bank Funds I - Access Conservative Fund (EUR) was launched on 8 December 2010.With effect from 1 January 2011, the following Sub-Funds changed their benchmark indexes as follow:- JPMorgan Private Bank Funds I - Access Balanced Fund (EUR) changed from MSCI World Index (Total Return Net) (50%), Barclays Capital Global Aggregate1-10 years ex-Japan hedged to EUR (Total Return Gross) (40%), European Overnight Index Average (10%) to MSCI World Index Local Currency (Total ReturnNet) (50%), Barclays Capital Global Aggregate 1-10 years ex-Japan hedged to EUR (Total Return Gross) (40%), European Overnight Index Average (10%);- JPMorgan Private Bank Funds I - Access Conservative Fund (EUR) changed from MSCI World Index (Total Return Net) (50%), Barclays Capital GlobalAggregate 1-10 years ex-Japan hedged to EUR (Total Return Gross) (40%), European Overnight Index Average (10%) to MSCI World Index Local Currency(Total Return Net) (20%), Barclays Capital Global Aggregate 1-10 years ex-Japan hedged to EUR (Total Return Gross) (55%), European Overnight IndexAverage (25%).
14. Directors FeesThe only remuneration paid to Directors is an annual fee. This was waived by Mr Benoît Dumont. The total Directors’ fees for the year amounted toEUR 42,850 of which the Chairman was due EUR 16,350.
15. Subsequent EventsThe Sub-Fund JPMorgan Private Bank Funds I - Montes Excelsis Fund was launched by way of Contribution in Kind from JPMorgan Private Bank Funds I -Access Balanced Fund (USD) on 6 April 2011.The Sub-Fund JPMorgan Private Bank Funds I - Access Balanced Fund (GBP) was launched on 25 May 2011.
16
17
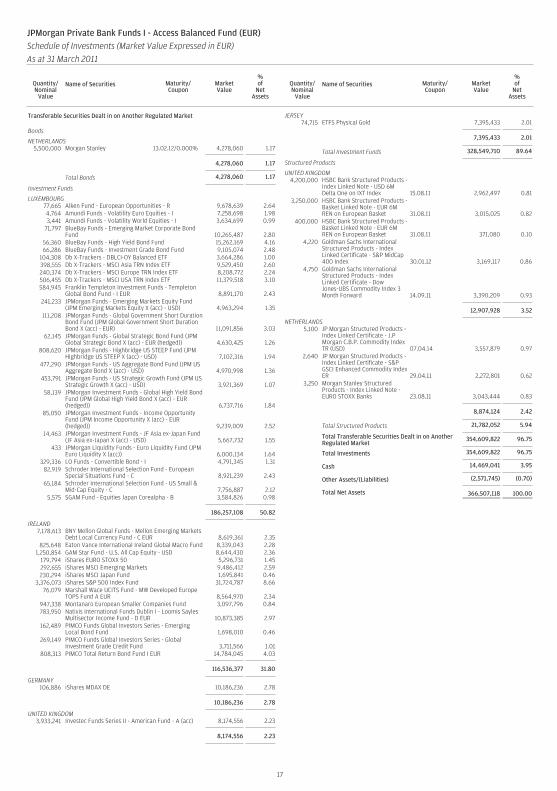
Transferable Securities Dealt in on Another Regulated Market
Bonds
NETHERLANDS5,500,000 Morgan Stanley 13.02.12/0.000% 4,278,060 1.17
4,278,060 1.17
Total Bonds 4,278,060 1.17
Investment Funds
LUXEMBOURG77,665 Alken Fund - European Opportunities - R 9,678,639 2.644,764 Amundi Funds - Volatility Euro Equities - I 7,258,698 1.983,441 Amundi Funds - Volatility World Equities - I 3,634,699 0.99
71,797 BlueBay Funds - Emerging Market Corporate BondFund 10,265,487 2.80
56,360 BlueBay Funds - High Yield Bond Fund 15,262,169 4.1666,286 BlueBay Funds - Investment Grade Bond Fund 9,105,074 2.48
104,308 Db X-Trackers - DBLCI-OY Balanced ETF 3,664,286 1.00398,555 Db X-Trackers - MSCI Asia TRN Index ETF 9,529,450 2.60240,374 Db X-Trackers - MSCI Europe TRN Index ETF 8,208,772 2.24506,455 Db X-Trackers - MSCI USA TRN Index ETF 11,379,518 3.10584,945 Franklin Templeton Investment Funds - Templeton
Global Bond Fund - I EUR 8,891,170 2.43241,233 JPMorgan Funds - Emerging Markets Equity Fund
(JPM Emerging Markets Equity X (acc) - USD) 4,963,294 1.35111,208 JPMorgan Funds - Global Government Short Duration
Bond Fund (JPM Global Government Short DurationBond X (acc) - EUR) 11,091,856 3.03
62,145 JPMorgan Funds - Global Strategic Bond Fund (JPMGlobal Strategic Bond X (acc) - EUR (hedged)) 4,630,425 1.26
808,620 JPMorgan Funds - Highbridge US STEEP Fund (JPMHighbridge US STEEP X (acc) - USD) 7,102,316 1.94
477,290 JPMorgan Funds - US Aggregate Bond Fund (JPM USAggregate Bond X (acc) - USD) 4,970,998 1.36
453,791 JPMorgan Funds - US Strategic Growth Fund (JPM USStrategic Growth X (acc) - USD) 3,921,369 1.07
58,139 JPMorgan Investment Funds - Global High Yield BondFund (JPM Global High Yield Bond X (acc) - EUR(hedged)) 6,737,716 1.84
85,050 JPMorgan Investment Funds - Income OpportunityFund (JPM Income Opportunity X (acc) - EUR(hedged)) 9,239,009 2.52
14,463 JPMorgan Investment Funds - JF Asia ex-Japan Fund(JF Asia ex-Japan X (acc) - USD) 5,667,732 1.55
433 JPMorgan Liquidity Funds - Euro Liquidity Fund (JPMEuro Liquidity X (acc)) 6,000,134 1.64
329,336 LO Funds - Convertible Bond - I 4,791,345 1.3182,919 Schroder International Selection Fund - European
Special Situations Fund - C 8,921,239 2.4365,184 Schroder International Selection Fund - US Small &
Mid-Cap Equity - C 7,756,887 2.125,575 SGAM Fund - Equities Japan Corealpha - B 3,584,826 0.98
186,257,108 50.82
IRELAND7,178,613 BNY Mellon Global Funds - Mellon Emerging Markets
Debt Local Currency Fund - C EUR 8,619,361 2.35825,648 Eaton Vance International Ireland Global Macro Fund 8,339,043 2.28
1,250,854 GAM Star Fund - U.S. All Cap Equity - USD 8,644,430 2.36179,794 iShares EURO STOXX 50 5,296,731 1.45292,655 iShares MSCI Emerging Markets 9,486,412 2.59230,294 iShares MSCI Japan Fund 1,695,841 0.46
3,376,073 iShares S&P 500 Index Fund 31,724,787 8.6676,079 Marshall Wace UCITS Fund - MW Developed Europe
TOPS Fund A EUR 8,564,970 2.34947,338 Montanaro European Smaller Companies Fund 3,097,796 0.84783,950 Natixis International Funds Dublin I - Loomis Sayles
Multisector Income Fund - D EUR 10,873,385 2.97162,489 PIMCO Funds Global Investors Series - Emerging
Local Bond Fund 1,698,010 0.46269,149 PIMCO Funds Global Investors Series - Global
Investment Grade Credit Fund 3,711,566 1.01808,313 PIMCO Total Return Bond Fund I EUR 14,784,045 4.03
116,536,377 31.80
GERMANY106,886 iShares MDAX DE 10,186,236 2.78
10,186,236 2.78
UNITED KINGDOM3,933,241 Investec Funds Series II - American Fund - A (acc) 8,174,556 2.23
8,174,556 2.23
JERSEY74,715 ETFS Physical Gold 7,395,433 2.01
7,395,433 2.01
Total Investment Funds 328,549,710 89.64
Structured Products
UNITED KINGDOM4,200,000 HSBC Bank Structured Products -
Index Linked Note - USD 6MDelta One on IXT Index 15.08.11 2,962,497 0.81
3,250,000 HSBC Bank Structured Products -Basket Linked Note - EUR 6MREN on European Basket 31.08.11 3,015,025 0.82
400,000 HSBC Bank Structured Products -Basket Linked Note - EUR 6MREN on European Basket 31.08.11 371,080 0.10
4,220 Goldman Sachs InternationalStructured Products - IndexLinked Certificate - S&P MidCap400 Index 30.01.12 3,169,117 0.86
4,750 Goldman Sachs InternationalStructured Products - IndexLinked Certificate - DowJones-UBS Commodity Index 3Month Forward 14.09.11 3,390,209 0.93
12,907,928 3.52
NETHERLANDS5,100 JP Morgan Structured Products -
Index Linked Certificate - J.PMorgan C.B.P. Commodity IndexTR (USD) 07.04.14 3,557,879 0.97
2,640 JP Morgan Structured Products -Index Linked Certificate - S&PGSCI Enhanced Commodity IndexER 29.04.11 2,272,801 0.62
3,250 Morgan Stanley StructuredProducts - Index Linked Note -EURO STOXX Banks 23.08.11 3,043,444 0.83
8,874,124 2.42
Total Structured Products 21,782,052 5.94
Total Transferable Securities Dealt in on AnotherRegulated Market
354,609,822 96.75
Total Investments 354,609,822 96.75
Cash 14,469,041 3.95
Other Assets/(Liabilities) (2,571,745) (0.70)
Total Net Assets 366,507,118 100.00
JPMorgan Private Bank Funds I - Access Balanced Fund (EUR)Schedule of Investments (Market Value Expressed in EUR)As at 31 March 2011
Quantity/Nominal
Value
Name of Securities Maturity/Coupon
MarketValue
%of
NetAssets
Quantity/Nominal
Value
Name of Securities Maturity/Coupon
MarketValue
%of
NetAssets

Allocation of Portfolio as at 31 March 2011 % ofNet Assets
Fixed Income SecuritiesNetherlands 1.17Total Fixed Income Securities 1.17Investment FundsLuxembourg 50.82Ireland 31.80Germany 2.78United Kingdom 2.23Jersey 2.01Total Investment Funds 89.64Structured ProductsUnited Kingdom 3.52Netherlands 2.42Total Structured Products 5.94Cash and Other Assets/(Liabilities) 3.25
Total 100.00
Allocation of Portfolio as at 30 September 2010 (Unaudited) % ofNet Assets
Fixed Income SecuritiesUnited Kingdom 1.25Netherlands 0.55Total Fixed Income Securities 1.80Investment FundsLuxembourg 60.75Ireland 21.00United Kingdom 4.16Germany 1.89Jersey 1.52Total Investment Funds 89.32Structured ProductsNetherlands 3.49United Kingdom 2.49United States of America 1.13Total Structured Products 7.11Cash and Other Assets/(Liabilities) 1.77
Total 100.00
JPMorgan Private Bank Funds I - Access Balanced Fund (EUR)Schedule of Investments (Market Value Expressed in EUR) (continued)As at 31 March 2011
Quantity/Nominal
Value
Name of Securities Maturity/Coupon
MarketValue
%of
NetAssets
Quantity/Nominal
Value
Name of Securities Maturity/Coupon
MarketValue
%of
NetAssets
18
19
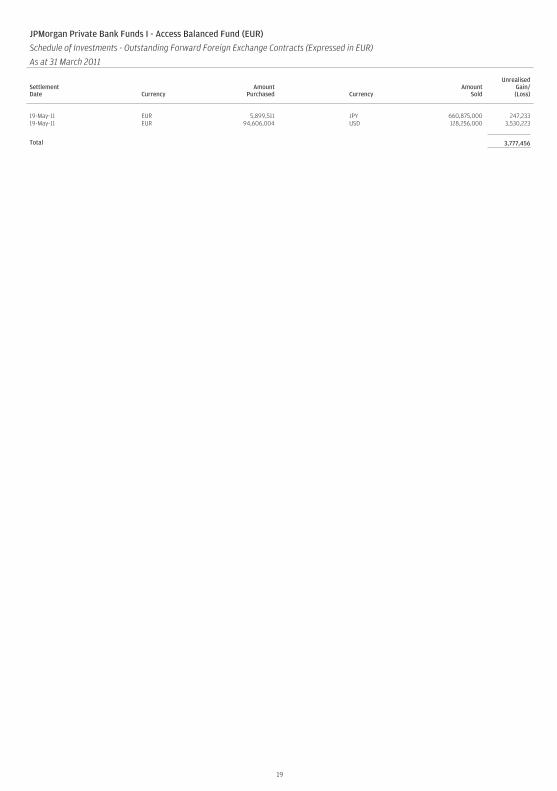
JPMorgan Private Bank Funds I - Access Balanced Fund (EUR)
Schedule of Investments - Outstanding Forward Foreign Exchange Contracts (Expressed in EUR)
As at 31 March 2011
SettlementDate Currency
AmountPurchased Currency
AmountSold
UnrealisedGain/(Loss)
19-May-11 EUR 5,899,511 JPY 660,875,000 247,23319-May-11 EUR 94,606,004 USD 128,256,000 3,530,223
Total 3,777,456
20
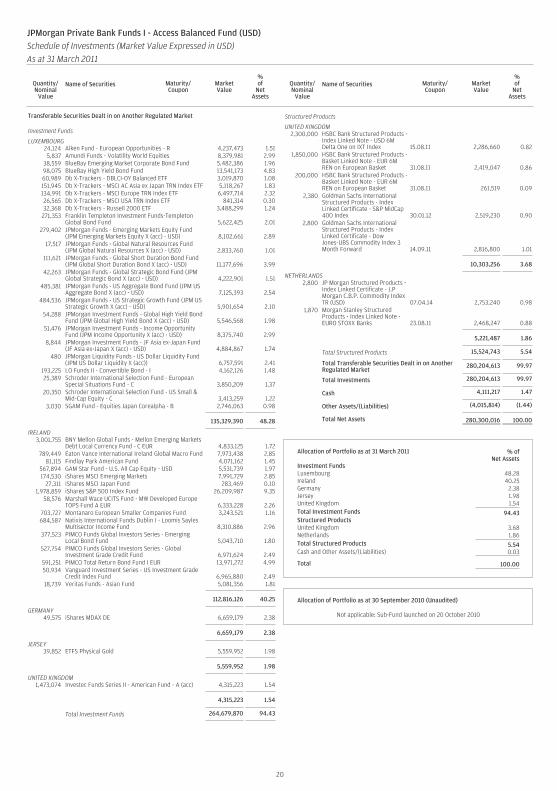
Transferable Securities Dealt in on Another Regulated Market
Investment Funds
LUXEMBOURG24,124 Alken Fund - European Opportunities - R 4,237,473 1.515,837 Amundi Funds - Volatility World Equities 8,379,981 2.99
38,559 BlueBay Emerging Market Corporate Bond Fund 5,482,386 1.9698,075 BlueBay High Yield Bond Fund 13,541,173 4.8360,989 Db X-Trackers - DBLCI-OY Balanced ETF 3,019,870 1.08151,945 Db X-Trackers - MSCI AC Asia ex Japan TRN Index ETF 5,118,267 1.83134,991 Db X-Trackers - MSCI Europe TRN Index ETF 6,497,714 2.3226,565 Db X-Trackers - MSCI USA TRN Index ETF 841,314 0.3032,368 Db X-Trackers - Russell 2000 ETF 3,488,299 1.24
271,353 Franklin Templeton Investment Funds-TempletonGlobal Bond Fund 5,622,425 2.01
279,402 JPMorgan Funds - Emerging Markets Equity Fund(JPM Emerging Markets Equity X (acc) - USD) 8,102,661 2.89
17,517 JPMorgan Funds - Global Natural Resources Fund(JPM Global Natural Resources X (acc) - USD) 2,833,760 1.01
111,621 JPMorgan Funds - Global Short Duration Bond Fund(JPM Global Short Duration Bond X (acc) - USD) 11,177,696 3.99
42,263 JPMorgan Funds - Global Strategic Bond Fund (JPMGlobal Strategic Bond X (acc) - USD) 4,222,901 1.51
485,381 JPMorgan Funds - US Aggregate Bond Fund (JPM USAggregate Bond X (acc) - USD) 7,125,393 2.54
484,536 JPMorgan Funds - US Strategic Growth Fund (JPM USStrategic Growth X (acc) - USD) 5,901,654 2.10
54,288 JPMorgan Investment Funds - Global High Yield BondFund (JPM Global High Yield Bond X (acc) - USD) 5,546,568 1.98
51,476 JPMorgan Investment Funds - Income OpportunityFund (JPM Income Opportunity X (acc) - USD) 8,375,740 2.99
8,844 JPMorgan Investment Funds - JF Asia ex-Japan Fund(JF Asia ex-Japan X (acc) - USD) 4,884,867 1.74
480 JPMorgan Liquidity Funds - US Dollar Liquidity Fund(JPM US Dollar Liquidity X (acc)) 6,757,591 2.41
193,225 LO Funds II - Convertible Bond - I 4,162,126 1.4825,389 Schroder International Selection Fund - European
Special Situations Fund - C 3,850,209 1.3720,350 Schroder International Selection Fund - US Small &
Mid-Cap Equity - C 3,413,259 1.223,030 SGAM Fund - Equities Japan Corealpha - B 2,746,063 0.98
135,329,390 48.28
IRELAND3,001,755 BNY Mellon Global Funds - Mellon Emerging Markets
Debt Local Currency Fund - C EUR 4,833,125 1.72789,449 Eaton Vance International Ireland Global Macro Fund 7,973,438 2.85
81,115 Findlay Park American Fund 4,071,162 1.45567,894 GAM Star Fund - U.S. All Cap Equity - USD 5,531,739 1.97174,530 iShares MSCI Emerging Markets 7,991,729 2.85
27,311 iShares MSCI Japan Fund 283,469 0.101,978,859 iShares S&P 500 Index Fund 26,209,987 9.35
58,576 Marshall Wace UCITS Fund - MW Developed EuropeTOPS Fund A EUR 6,333,228 2.26
703,727 Montanaro European Smaller Companies Fund 3,243,521 1.16684,587 Natixis International Funds Dublin I - Loomis Sayles
Multisector Income Fund 8,310,886 2.96377,523 PIMCO Funds Global Investors Series - Emerging
Local Bond Fund 5,043,710 1.80527,754 PIMCO Funds Global Investors Series - Global
Investment Grade Credit Fund 6,971,624 2.49591,251 PIMCO Total Return Bond Fund I EUR 13,971,272 4.9950,934 Vanguard Investment Series - US Investment Grade
Credit Index Fund 6,965,880 2.4918,739 Veritas Funds - Asian Fund 5,081,356 1.81
112,816,126 40.25
GERMANY49,575 iShares MDAX DE 6,659,179 2.38
6,659,179 2.38
JERSEY39,852 ETFS Physical Gold 5,559,952 1.98
5,559,952 1.98
UNITED KINGDOM1,473,074 Investec Funds Series II - American Fund - A (acc) 4,315,223 1.54
4,315,223 1.54
Total Investment Funds 264,679,870 94.43
Structured Products
UNITED KINGDOM2,300,000 HSBC Bank Structured Products -
Index Linked Note - USD 6MDelta One on IXT Index 15.08.11 2,286,660 0.82
1,850,000 HSBC Bank Structured Products -Basket Linked Note - EUR 6MREN on European Basket 31.08.11 2,419,047 0.86
200,000 HSBC Bank Structured Products -Basket Linked Note - EUR 6MREN on European Basket 31.08.11 261,519 0.09
2,380 Goldman Sachs InternationalStructured Products - IndexLinked Certificate - S&P MidCap400 Index 30.01.12 2,519,230 0.90
2,800 Goldman Sachs InternationalStructured Products - IndexLinked Certificate - DowJones-UBS Commodity Index 3Month Forward 14.09.11 2,816,800 1.01
10,303,256 3.68
NETHERLANDS2,800 JP Morgan Structured Products -
Index Linked Certificate - J.PMorgan C.B.P. Commodity IndexTR (USD) 07.04.14 2,753,240 0.98
1,870 Morgan Stanley StructuredProducts - Index Linked Note -EURO STOXX Banks 23.08.11 2,468,247 0.88
5,221,487 1.86
Total Structured Products 15,524,743 5.54
Total Transferable Securities Dealt in on AnotherRegulated Market
280,204,613 99.97
Total Investments 280,204,613 99.97
Cash 4,111,217 1.47
Other Assets/(Liabilities) (4,015,814) (1.44)
Total Net Assets 280,300,016 100.00
Allocation of Portfolio as at 31 March 2011 % ofNet Assets
Investment FundsLuxembourg 48.28Ireland 40.25Germany 2.38Jersey 1.98United Kingdom 1.54Total Investment Funds 94.43Structured ProductsUnited Kingdom 3.68Netherlands 1.86Total Structured Products 5.54Cash and Other Assets/(Liabilities) 0.03
Total 100.00
Allocation of Portfolio as at 30 September 2010 (Unaudited)
Not applicable: Sub-Fund launched on 20 October 2010
JPMorgan Private Bank Funds I - Access Balanced Fund (USD)Schedule of Investments (Market Value Expressed in USD)As at 31 March 2011
Quantity/Nominal
Value
Name of Securities Maturity/Coupon
MarketValue
%of
NetAssets
Quantity/Nominal
Value
Name of Securities Maturity/Coupon
MarketValue
%of
NetAssets
21
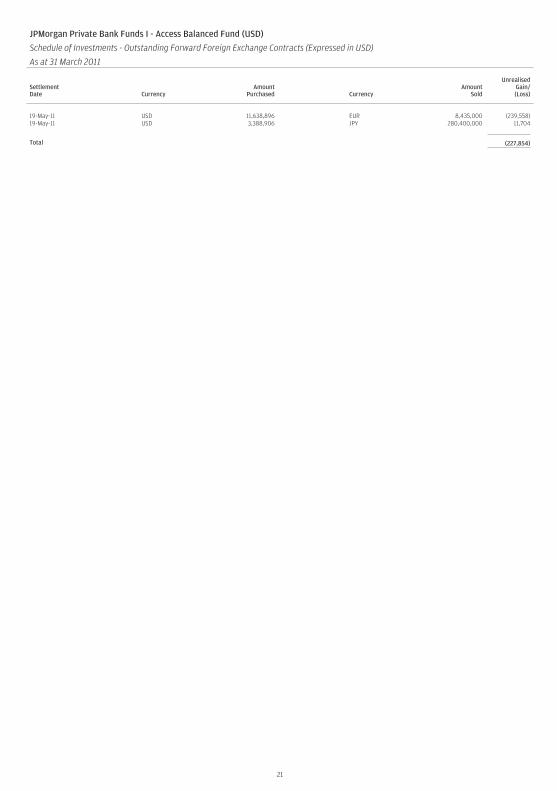
JPMorgan Private Bank Funds I - Access Balanced Fund (USD)
Schedule of Investments - Outstanding Forward Foreign Exchange Contracts (Expressed in USD)
As at 31 March 2011
SettlementDate Currency
AmountPurchased Currency
AmountSold
UnrealisedGain/(Loss)
19-May-11 USD 11,638,896 EUR 8,435,000 (239,558)19-May-11 USD 3,388,906 JPY 280,400,000 11,704
Total (227,854)
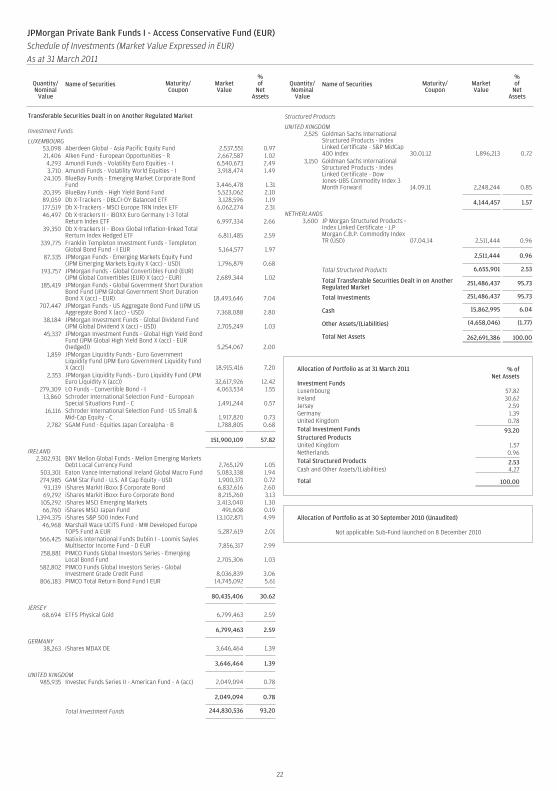
22
Transferable Securities Dealt in on Another Regulated Market
Investment Funds
LUXEMBOURG53,098 Aberdeen Global - Asia Pacific Equity Fund 2,537,551 0.9721,406 Alken Fund - European Opportunities - R 2,667,587 1.024,293 Amundi Funds - Volatility Euro Equities - I 6,540,673 2.493,710 Amundi Funds - Volatility World Equities - I 3,918,474 1.49
24,105 BlueBay Funds - Emerging Market Corporate BondFund 3,446,478 1.31
20,395 BlueBay Funds - High Yield Bond Fund 5,523,062 2.1089,059 Db X-Trackers - DBLCI-OY Balanced ETF 3,128,596 1.19177,519 Db X-Trackers - MSCI Europe TRN Index ETF 6,062,274 2.3146,497 Db X-trackers II - iBOXX Euro Germany 1-3 Total
Return Index ETF 6,997,334 2.6639,350 Db X-trackers II - iBoxx Global Inflation-linked Total
Rerturn Index Hedged ETF 6,811,485 2.59339,775 Franklin Templeton Investment Funds - Templeton
Global Bond Fund - I EUR 5,164,577 1.9787,335 JPMorgan Funds - Emerging Markets Equity Fund
(JPM Emerging Markets Equity X (acc) - USD) 1,796,879 0.68193,757 JPMorgan Funds - Global Convertibles Fund (EUR)
(JPM Global Convertibles (EUR) X (acc) - EUR) 2,689,344 1.02185,419 JPMorgan Funds - Global Government Short Duration
Bond Fund (JPM Global Government Short DurationBond X (acc) - EUR) 18,493,646 7.04
707,447 JPMorgan Funds - US Aggregate Bond Fund (JPM USAggregate Bond X (acc) - USD) 7,368,088 2.80
38,184 JPMorgan Investment Funds - Global Dividend Fund(JPM Global Dividend X (acc) - USD) 2,705,249 1.03
45,337 JPMorgan Investment Funds - Global High Yield BondFund (JPM Global High Yield Bond X (acc) - EUR(hedged)) 5,254,067 2.00
1,859 JPMorgan Liquidity Funds - Euro GovernmentLiquidity Fund (JPM Euro Government Liquidity FundX (acc)) 18,915,416 7.20
2,353 JPMorgan Liquidity Funds - Euro Liquidity Fund (JPMEuro Liquidity X (acc)) 32,617,926 12.42
279,309 LO Funds - Convertible Bond - I 4,063,534 1.5513,860 Schroder International Selection Fund - European
Special Situations Fund - C 1,491,244 0.5716,116 Schroder International Selection Fund - US Small &
Mid-Cap Equity - C 1,917,820 0.732,782 SGAM Fund - Equities Japan Corealpha - B 1,788,805 0.68
151,900,109 57.82
IRELAND2,302,931 BNY Mellon Global Funds - Mellon Emerging Markets
Debt Local Currency Fund 2,765,129 1.05503,301 Eaton Vance International Ireland Global Macro Fund 5,083,338 1.94274,985 GAM Star Fund - U.S. All Cap Equity - USD 1,900,371 0.72
93,139 iShares Markit iBoxx $ Corporate Bond 6,832,616 2.6069,292 iShares Markit iBoxx Euro Corporate Bond 8,215,260 3.13
105,292 iShares MSCI Emerging Markets 3,413,040 1.3066,760 iShares MSCI Japan Fund 491,608 0.19
1,394,375 iShares S&P 500 Index Fund 13,102,871 4.9946,968 Marshall Wace UCITS Fund - MW Developed Europe
TOPS Fund A EUR 5,287,619 2.01566,425 Natixis International Funds Dublin I - Loomis Sayles
Multisector Income Fund - D EUR 7,856,317 2.99258,881 PIMCO Funds Global Investors Series - Emerging
Local Bond Fund 2,705,306 1.03582,802 PIMCO Funds Global Investors Series - Global
Investment Grade Credit Fund 8,036,839 3.06806,183 PIMCO Total Return Bond Fund I EUR 14,745,092 5.61
80,435,406 30.62
JERSEY68,694 ETFS Physical Gold 6,799,463 2.59
6,799,463 2.59
GERMANY38,263 iShares MDAX DE 3,646,464 1.39
3,646,464 1.39
UNITED KINGDOM985,935 Investec Funds Series II - American Fund - A (acc) 2,049,094 0.78
2,049,094 0.78
Total Investment Funds 244,830,536 93.20
Structured Products
UNITED KINGDOM2,525 Goldman Sachs International
Structured Products - IndexLinked Certificate - S&P MidCap400 Index 30.01.12 1,896,213 0.72
3,150 Goldman Sachs InternationalStructured Products - IndexLinked Certificate - DowJones-UBS Commodity Index 3Month Forward 14.09.11 2,248,244 0.85
4,144,457 1.57
NETHERLANDS3,600 JP Morgan Structured Products -
Index Linked Certificate - J.PMorgan C.B.P. Commodity IndexTR (USD) 07.04.14 2,511,444 0.96
2,511,444 0.96
Total Structured Products 6,655,901 2.53
Total Transferable Securities Dealt in on AnotherRegulated Market
251,486,437 95.73
Total Investments 251,486,437 95.73
Cash 15,862,995 6.04
Other Assets/(Liabilities) (4,658,046) (1.77)
Total Net Assets 262,691,386 100.00
Allocation of Portfolio as at 31 March 2011 % ofNet Assets
Investment FundsLuxembourg 57.82Ireland 30.62Jersey 2.59Germany 1.39United Kingdom 0.78Total Investment Funds 93.20Structured ProductsUnited Kingdom 1.57Netherlands 0.96Total Structured Products 2.53Cash and Other Assets/(Liabilities) 4.27
Total 100.00
Allocation of Portfolio as at 30 September 2010 (Unaudited)
Not applicable: Sub-Fund launched on 8 December 2010
JPMorgan Private Bank Funds I - Access Conservative Fund (EUR)Schedule of Investments (Market Value Expressed in EUR)As at 31 March 2011
Quantity/Nominal
Value
Name of Securities Maturity/Coupon
MarketValue
%of
NetAssets
Quantity/Nominal
Value
Name of Securities Maturity/Coupon
MarketValue
%of
NetAssets

23
JPMorgan Private Bank Funds I - Access Conservative Fund (EUR)
Schedule of Investments - Outstanding Forward Foreign Exchange Contracts (Expressed in EUR)
As at 31 March 2011
SettlementDate Currency
AmountPurchased Currency
AmountSold
UnrealisedGain/(Loss)
19-May-11 EUR 2,652,096 JPY 299,430,000 91,15619-May-11 EUR 37,555,867 USD 51,205,220 1,194,563
Total 1,285,719

24
Transferable Securities Admitted to an Official Exchange Listing
Bonds
NETHERLANDS6,600,000 Fortis Bank Nederland 17.04.12/3.000% 6,691,575 1.655,750,000 ING Bank 03.03.14/3.375% 5,890,501 1.456,600,000 LeasePlan 22.05.14/3.250% 6,727,238 1.659,200,000 Netherlands (Kingdom of) 15.01.13/1.750% 9,199,977 2.26
21,530,000 Netherlands (Kingdom of) 15.07.13/4.250% 22,629,290 5.575,700,000 NIBC Bank 07.04.14/3.500% 5,853,963 1.44
56,992,544 14.02
GERMANY4,870,000 Germany (Federal Republic of) 04.01.13/4.500% 5,106,495 1.25
27,400,000 Germany (Federal Republic of) 10.10.14/2.500% 27,655,094 6.8019,000,000 Germany (Federal Republic of) 27.02.15/2.500% 19,098,971 4.70
51,860,560 12.75
FRANCE40,400,000 France (Government of) 25.10.12/4.750% 42,278,055 10.40
42,278,055 10.40
UNITED KINGDOM910,000 Bank of Scotland 05.12.11/3.375% 921,845 0.23
1,300,000 Coventry Building Society 05.04.12/2.000% 1,480,463 0.364,000,000 Lloyds TSB Bank 17.11.11/3.750% 4,057,200 1.002,770,000 Lloyds TSB Bank 16.03.12/2.750% 3,175,585 0.781,650,000 RBS 14.11.11/3.750% 1,673,719 0.413,045,000 UK Treasury 07.03.14/2.250% 3,488,285 0.864,000,000 UK Treasury 22.01.15/2.750% 4,608,439 1.137,205,000 UK Treasury 07.09.15/4.750% 8,940,932 2.204,411,000 West Bromwich Building Society 05.04.12/2.000% 5,023,327 1.242,727,000 Yorkshire Building Society 30.03.12/2.000% 3,105,741 0.763,200,000 Yorkshire Building Society 26.10.12/2.250% 3,211,517 0.79
39,687,053 9.76
AUSTRIA2,100,000 Austria (Republic of) 15.07.12/5.000% 2,190,319 0.54
12,560,000 Austria (Republic of) 15.07.14/4.300% 13,279,399 3.26
15,469,718 3.80
FINLAND7,200,000 Finland (Government of) 04.07.13/5.375% 7,738,211 1.90
7,738,211 1.90
UNITED STATES OF AMERICA1,130,000 Goldman Sachs Group 08.12.11/3.500% 1,145,852 0.29
1,145,852 0.29
Total Bonds 215,171,993 52.92
Total Transferable Securities Admitted to anOfficial Exchange Listing
215,171,993 52.92
Transferable Securities Dealt in on Another Regulated Market
Bonds
UNITED STATES OF AMERICA15,200,000 US Treasury 30.06.12/0.625% 10,745,902 2.6417,000,000 US Treasury 30.09.12/4.250% 12,649,612 3.1110,800,000 US Treasury 15.02.13/1.375% 7,707,827 1.904,970,000 US Treasury 31.10.13/2.750% 3,658,180 0.90
32,100,000 US Treasury 30.11.13/2.000% 23,171,074 5.708,550,000 US Treasury 28.02.14/1.875% 6,144,418 1.51
14,200,000 US Treasury 31.03.14/1.750% 10,162,524 2.5019,850,000 US Treasury 31.07.14/2.625% 14,551,593 3.5818,500,000 US Treasury 31.12.14/2.625% 13,519,137 3.3212,800,000 US Treasury 31.01.16/2.000% 8,970,915 2.21
111,281,182 27.37
FRANCE895,000 French Treasury Bill (i) 28.07.11/0.000% 892,707 0.22
30,000,000 French Treasury Note 12.01.14/2.500% 30,253,065 7.4429,080,000 French Treasury Note 12.07.14/3.000% 29,648,485 7.29
60,794,257 14.95
Total Bonds 172,075,439 42.32
Investment Funds
LUXEMBOURG520 JPMorgan Liquidity Funds - Euro Liquidity Fund (JPM
Euro Liquidity X (acc)) 7,205,920 1.77
7,205,920 1.77
Total Investment Funds 7,205,920 1.77
Total Transferable Securities Dealt in on AnotherRegulated Market
179,281,359 44.09
Total Investments 394,453,352 97.01
Cash 1,967,960 0.48
Other Assets/(Liabilities) 10,209,528 2.51
Total Net Assets 406,630,840 100.00
(i) Security partially or totally held as collateral against financial futures contracts by the broker.
Allocation of Portfolio as at 31 March 2011 % ofNet Assets
Fixed Income SecuritiesUnited States of America 27.66France 25.35Netherlands 14.02Germany 12.75United Kingdom 9.76Austria 3.80Finland 1.90Total Fixed Income Securities 95.24Investment FundsLuxembourg 1.77Total Investment Funds 1.77Cash and Other Assets/(Liabilities) 2.99
Total 100.00
Allocation of Portfolio as at 30 September 2010 (Unaudited) % ofNet Assets
Fixed Income SecuritiesGermany 23.83France 21.09United States of America 19.60Netherlands 11.58Japan 9.92United Kingdom 5.68Austria 3.70Finland 1.19International Agencies 0.62Total Fixed Income Securities 97.21Investment FundsLuxembourg 0.31Total Investment Funds 0.31Cash and Other Assets/(Liabilities) 2.48
Total 100.00
JPMorgan Private Bank Funds I - Diversified Fixed Income Fund (EUR)Schedule of Investments (Market Value Expressed in EUR)As at 31 March 2011
Quantity/Nominal
Value
Name of Securities Maturity/Coupon
MarketValue
%of
NetAssets
Quantity/Nominal
Value
Name of Securities Maturity/Coupon
MarketValue
%of
NetAssets
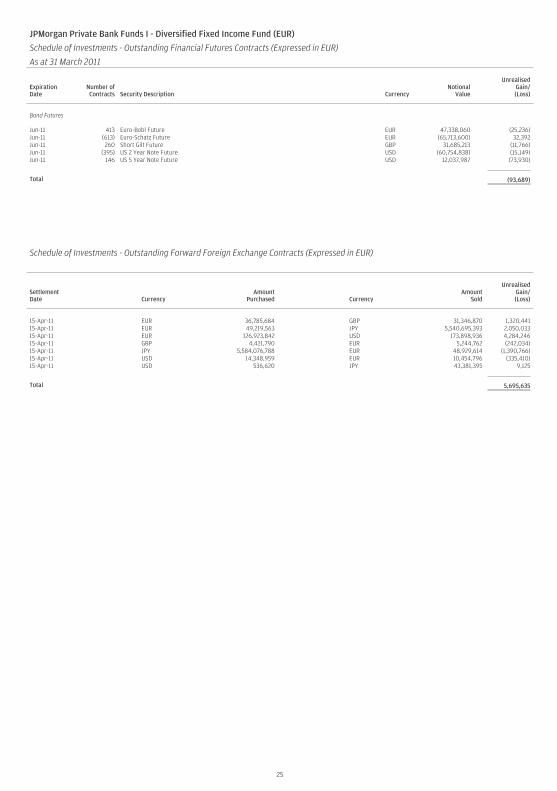
25
JPMorgan Private Bank Funds I - Diversified Fixed Income Fund (EUR)
Schedule of Investments - Outstanding Financial Futures Contracts (Expressed in EUR)
As at 31 March 2011
ExpirationDate
Number ofContracts Security Description Currency
NotionalValue
UnrealisedGain/(Loss)
Bond Futures
Jun-11 413 Euro-Bobl Future EUR 47,338,060 (25,236)Jun-11 (613) Euro-Schatz Future EUR (65,713,600) 32,392Jun-11 260 Short Gilt Future GBP 31,685,213 (11,766)Jun-11 (395) US 2 Year Note Future USD (60,754,838) (15,149)Jun-11 146 US 5 Year Note Future USD 12,037,987 (73,930)
Total (93,689)
Schedule of Investments - Outstanding Forward Foreign Exchange Contracts (Expressed in EUR)
SettlementDate Currency
AmountPurchased Currency
AmountSold
UnrealisedGain/(Loss)
15-Apr-11 EUR 36,785,684 GBP 31,346,870 1,320,44115-Apr-11 EUR 49,219,563 JPY 5,540,695,393 2,050,03315-Apr-11 EUR 126,923,842 USD 173,898,936 4,284,24615-Apr-11 GBP 4,421,790 EUR 5,244,762 (242,034)15-Apr-11 JPY 5,584,076,788 EUR 48,929,614 (1,390,766)15-Apr-11 USD 14,348,959 EUR 10,454,796 (335,410)15-Apr-11 USD 536,620 JPY 43,381,395 9,125
Total 5,695,635
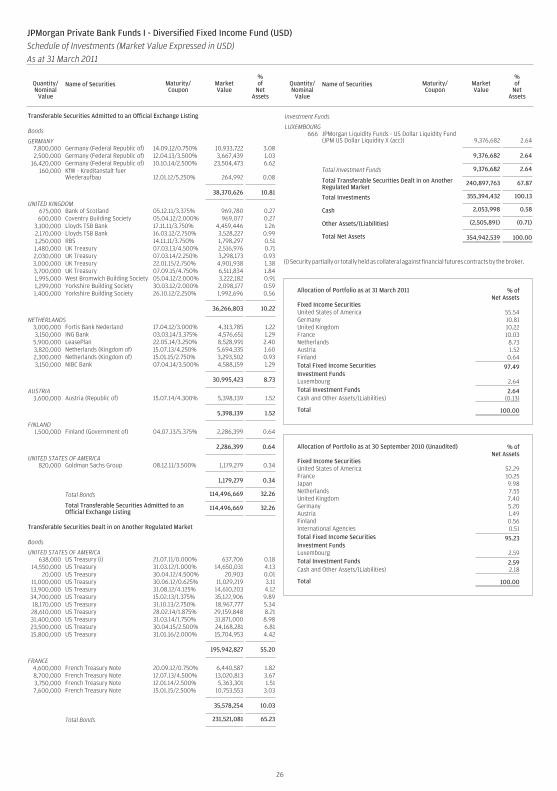
26
Transferable Securities Admitted to an Official Exchange Listing
Bonds
GERMANY7,800,000 Germany (Federal Republic of) 14.09.12/0.750% 10,933,722 3.082,500,000 Germany (Federal Republic of) 12.04.13/3.500% 3,667,439 1.03
16,420,000 Germany (Federal Republic of) 10.10.14/2.500% 23,504,473 6.62160,000 KfW - Kreditanstalt fuer
Wiederaufbau 12.01.12/5.250% 264,992 0.08
38,370,626 10.81
UNITED KINGDOM675,000 Bank of Scotland 05.12.11/3.375% 969,780 0.27600,000 Coventry Building Society 05.04.12/2.000% 969,077 0.27
3,100,000 Lloyds TSB Bank 17.11.11/3.750% 4,459,446 1.262,170,000 Lloyds TSB Bank 16.03.12/2.750% 3,528,227 0.991,250,000 RBS 14.11.11/3.750% 1,798,297 0.511,480,000 UK Treasury 07.03.13/4.500% 2,516,976 0.712,030,000 UK Treasury 07.03.14/2.250% 3,298,173 0.933,000,000 UK Treasury 22.01.15/2.750% 4,901,938 1.383,700,000 UK Treasury 07.09.15/4.750% 6,511,834 1.841,995,000 West Bromwich Building Society 05.04.12/2.000% 3,222,182 0.911,299,000 Yorkshire Building Society 30.03.12/2.000% 2,098,177 0.591,400,000 Yorkshire Building Society 26.10.12/2.250% 1,992,696 0.56
36,266,803 10.22
NETHERLANDS3,000,000 Fortis Bank Nederland 17.04.12/3.000% 4,313,785 1.223,150,000 ING Bank 03.03.14/3.375% 4,576,651 1.295,900,000 LeasePlan 22.05.14/3.250% 8,528,991 2.403,820,000 Netherlands (Kingdom of) 15.07.13/4.250% 5,694,335 1.602,300,000 Netherlands (Kingdom of) 15.01.15/2.750% 3,293,502 0.933,150,000 NIBC Bank 07.04.14/3.500% 4,588,159 1.29
30,995,423 8.73
AUSTRIA3,600,000 Austria (Republic of) 15.07.14/4.300% 5,398,139 1.52
5,398,139 1.52
FINLAND1,500,000 Finland (Government of) 04.07.13/5.375% 2,286,399 0.64
2,286,399 0.64
UNITED STATES OF AMERICA820,000 Goldman Sachs Group 08.12.11/3.500% 1,179,279 0.34
1,179,279 0.34
Total Bonds 114,496,669 32.26
Total Transferable Securities Admitted to anOfficial Exchange Listing
114,496,669 32.26
Transferable Securities Dealt in on Another Regulated Market
Bonds
UNITED STATES OF AMERICA638,000 US Treasury (i) 21.07.11/0.000% 637,706 0.18
14,550,000 US Treasury 31.03.12/1.000% 14,650,031 4.1320,000 US Treasury 30.04.12/4.500% 20,903 0.01
11,000,000 US Treasury 30.06.12/0.625% 11,029,219 3.1113,900,000 US Treasury 31.08.12/4.125% 14,610,203 4.1234,700,000 US Treasury 15.02.13/1.375% 35,122,906 9.8918,170,000 US Treasury 31.10.13/2.750% 18,967,777 5.3428,610,000 US Treasury 28.02.14/1.875% 29,159,848 8.2131,400,000 US Treasury 31.03.14/1.750% 31,871,000 8.9823,500,000 US Treasury 30.04.15/2.500% 24,168,281 6.8115,800,000 US Treasury 31.01.16/2.000% 15,704,953 4.42
195,942,827 55.20
FRANCE4,600,000 French Treasury Note 20.09.12/0.750% 6,440,587 1.828,700,000 French Treasury Note 12.07.13/4.500% 13,020,813 3.673,750,000 French Treasury Note 12.01.14/2.500% 5,363,301 1.517,600,000 French Treasury Note 15.01.15/2.500% 10,753,553 3.03
35,578,254 10.03
Total Bonds 231,521,081 65.23
Investment Funds
LUXEMBOURG666 JPMorgan Liquidity Funds - US Dollar Liquidity Fund
(JPM US Dollar Liquidity X (acc)) 9,376,682 2.64
9,376,682 2.64
Total Investment Funds 9,376,682 2.64
Total Transferable Securities Dealt in on AnotherRegulated Market
240,897,763 67.87
Total Investments 355,394,432 100.13
Cash 2,053,998 0.58
Other Assets/(Liabilities) (2,505,891) (0.71)
Total Net Assets 354,942,539 100.00
(i) Security partially or totally held as collateral against financial futures contracts by the broker.
Allocation of Portfolio as at 31 March 2011 % ofNet Assets
Fixed Income SecuritiesUnited States of America 55.54Germany 10.81United Kingdom 10.22France 10.03Netherlands 8.73Austria 1.52Finland 0.64Total Fixed Income Securities 97.49Investment FundsLuxembourg 2.64Total Investment Funds 2.64Cash and Other Assets/(Liabilities) (0.13)
Total 100.00
Allocation of Portfolio as at 30 September 2010 (Unaudited) % ofNet Assets
Fixed Income SecuritiesUnited States of America 52.29France 10.25Japan 9.98Netherlands 7.55United Kingdom 7.40Germany 5.20Austria 1.49Finland 0.56International Agencies 0.51Total Fixed Income Securities 95.23Investment FundsLuxembourg 2.59Total Investment Funds 2.59Cash and Other Assets/(Liabilities) 2.18
Total 100.00
JPMorgan Private Bank Funds I - Diversified Fixed Income Fund (USD)Schedule of Investments (Market Value Expressed in USD)As at 31 March 2011
Quantity/Nominal
Value
Name of Securities Maturity/Coupon
MarketValue
%of
NetAssets
Quantity/Nominal
Value
Name of Securities Maturity/Coupon
MarketValue
%of
NetAssets
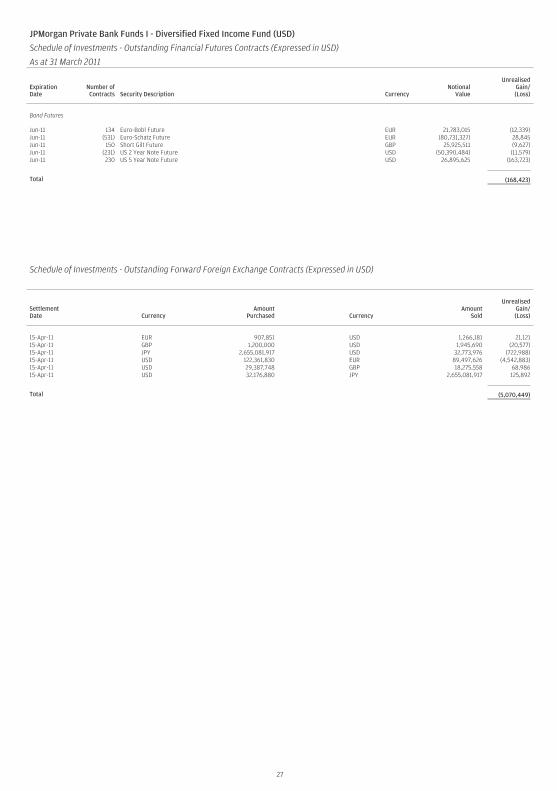
27
JPMorgan Private Bank Funds I - Diversified Fixed Income Fund (USD)
Schedule of Investments - Outstanding Financial Futures Contracts (Expressed in USD)
As at 31 March 2011
ExpirationDate
Number ofContracts Security Description Currency
NotionalValue
UnrealisedGain/(Loss)
Bond Futures
Jun-11 134 Euro-Bobl Future EUR 21,783,015 (12,339)Jun-11 (531) Euro-Schatz Future EUR (80,731,327) 28,845Jun-11 150 Short Gilt Future GBP 25,925,511 (9,627)Jun-11 (231) US 2 Year Note Future USD (50,390,484) (11,579)Jun-11 230 US 5 Year Note Future USD 26,895,625 (163,723)
Total (168,423)
Schedule of Investments - Outstanding Forward Foreign Exchange Contracts (Expressed in USD)
SettlementDate Currency
AmountPurchased Currency
AmountSold
UnrealisedGain/(Loss)
15-Apr-11 EUR 907,851 USD 1,266,181 21,12115-Apr-11 GBP 1,200,000 USD 1,945,690 (20,577)15-Apr-11 JPY 2,655,081,917 USD 32,773,976 (722,988)15-Apr-11 USD 122,361,830 EUR 89,497,626 (4,542,883)15-Apr-11 USD 29,387,748 GBP 18,275,558 68,98615-Apr-11 USD 32,176,880 JPY 2,655,081,917 125,892
Total (5,070,449)
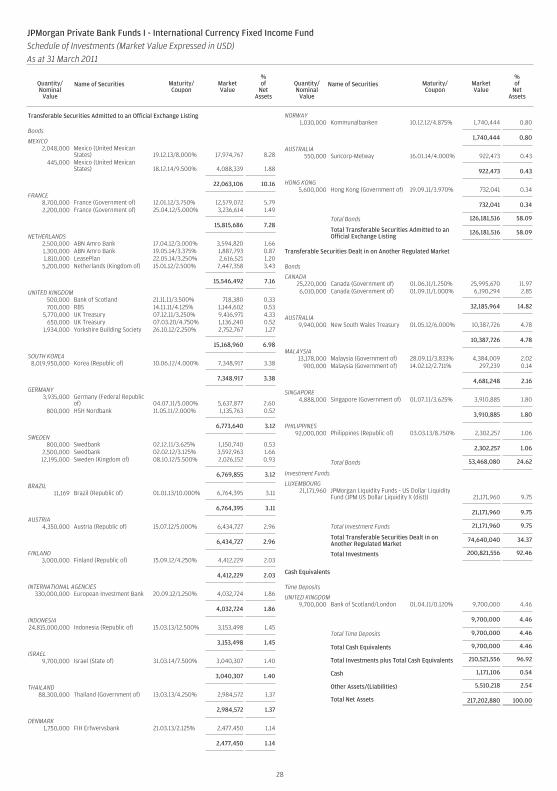
28
Transferable Securities Admitted to an Official Exchange Listing
Bonds
MEXICO2,048,000 Mexico (United Mexican
States) 19.12.13/8.000% 17,974,767 8.28445,000 Mexico (United Mexican
States) 18.12.14/9.500% 4,088,339 1.88
22,063,106 10.16
FRANCE8,700,000 France (Government of) 12.01.12/3.750% 12,579,072 5.792,200,000 France (Government of) 25.04.12/5.000% 3,236,614 1.49
15,815,686 7.28
NETHERLANDS2,500,000 ABN Amro Bank 17.04.12/3.000% 3,594,820 1.661,300,000 ABN Amro Bank 19.05.14/3.375% 1,887,793 0.871,810,000 LeasePlan 22.05.14/3.250% 2,616,521 1.205,200,000 Netherlands (Kingdom of) 15.01.12/2.500% 7,447,358 3.43
15,546,492 7.16
UNITED KINGDOM500,000 Bank of Scotland 21.11.11/3.500% 718,380 0.33700,000 RBS 14.11.11/4.125% 1,144,602 0.53
5,770,000 UK Treasury 07.12.11/3.250% 9,416,971 4.33650,000 UK Treasury 07.03.20/4.750% 1,136,240 0.52
1,934,000 Yorkshire Building Society 26.10.12/2.250% 2,752,767 1.27
15,168,960 6.98
SOUTH KOREA8,019,950,000 Korea (Republic of) 10.06.12/4.000% 7,348,917 3.38
7,348,917 3.38
GERMANY3,935,000 Germany (Federal Republic
of) 04.07.11/5.000% 5,637,877 2.60800,000 HSH Nordbank 11.05.11/2.000% 1,135,763 0.52
6,773,640 3.12
SWEDEN800,000 Swedbank 02.12.11/3.625% 1,150,740 0.53
2,500,000 Swedbank 02.02.12/3.125% 3,592,963 1.6612,195,000 Sweden (Kingdom of) 08.10.12/5.500% 2,026,152 0.93
6,769,855 3.12
BRAZIL11,169 Brazil (Republic of) 01.01.13/10.000% 6,764,395 3.11
6,764,395 3.11
AUSTRIA4,350,000 Austria (Republic of) 15.07.12/5.000% 6,434,727 2.96
6,434,727 2.96
FINLAND3,000,000 Finland (Republic of) 15.09.12/4.250% 4,412,229 2.03
4,412,229 2.03
INTERNATIONAL AGENCIES330,000,000 European Investment Bank 20.09.12/1.250% 4,032,724 1.86
4,032,724 1.86
INDONESIA24,815,000,000 Indonesia (Republic of) 15.03.13/12.500% 3,153,498 1.45
3,153,498 1.45
ISRAEL9,700,000 Israel (State of) 31.03.14/7.500% 3,040,307 1.40
3,040,307 1.40
THAILAND88,300,000 Thailand (Government of) 13.03.13/4.250% 2,984,572 1.37
2,984,572 1.37
DENMARK1,750,000 FIH Erhvervsbank 21.03.13/2.125% 2,477,450 1.14
2,477,450 1.14
NORWAY1,030,000 Kommunalbanken 10.12.12/4.875% 1,740,444 0.80
1,740,444 0.80
AUSTRALIA550,000 Suncorp-Metway 16.01.14/4.000% 922,473 0.43
922,473 0.43
HONG KONG5,600,000 Hong Kong (Government of) 19.09.11/3.970% 732,041 0.34
732,041 0.34
Total Bonds 126,181,516 58.09
Total Transferable Securities Admitted to anOfficial Exchange Listing
126,181,516 58.09
Transferable Securities Dealt in on Another Regulated Market
Bonds
CANADA25,220,000 Canada (Government of) 01.06.11/1.250% 25,995,670 11.976,010,000 Canada (Government of) 01.09.11/1.000% 6,190,294 2.85
32,185,964 14.82
AUSTRALIA9,940,000 New South Wales Treasury 01.05.12/6.000% 10,387,726 4.78
10,387,726 4.78
MALAYSIA13,178,000 Malaysia (Government of) 28.09.11/3.833% 4,384,009 2.02
900,000 Malaysia (Government of) 14.02.12/2.711% 297,239 0.14
4,681,248 2.16
SINGAPORE4,888,000 Singapore (Government of) 01.07.11/3.625% 3,910,885 1.80
3,910,885 1.80
PHILIPPINES92,000,000 Philippines (Republic of) 03.03.13/8.750% 2,302,257 1.06
2,302,257 1.06
Total Bonds 53,468,080 24.62
Investment Funds
LUXEMBOURG21,171,960 JPMorgan Liquidity Funds - US Dollar Liquidity
Fund (JPM US Dollar Liquidity X (dist)) 21,171,960 9.75
21,171,960 9.75
Total Investment Funds 21,171,960 9.75
Total Transferable Securities Dealt in onAnother Regulated Market
74,640,040 34.37
Total Investments 200,821,556 92.46
Cash Equivalents
Time Deposits
UNITED KINGDOM9,700,000 Bank of Scotland/London 01.04.11/0.120% 9,700,000 4.46
9,700,000 4.46
Total Time Deposits 9,700,000 4.46
Total Cash Equivalents 9,700,000 4.46
Total Investments plus Total Cash Equivalents 210,521,556 96.92
Cash 1,171,106 0.54
Other Assets/(Liabilities) 5,510,218 2.54
Total Net Assets 217,202,880 100.00
JPMorgan Private Bank Funds I - International Currency Fixed Income FundSchedule of Investments (Market Value Expressed in USD)As at 31 March 2011
Quantity/Nominal
Value
Name of Securities Maturity/Coupon
MarketValue
%of
NetAssets
Quantity/Nominal
Value
Name of Securities Maturity/Coupon
MarketValue
%of
NetAssets
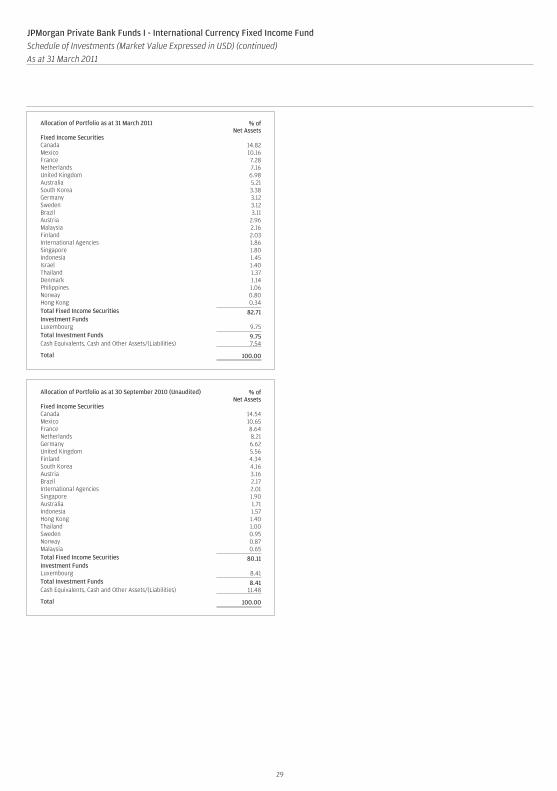
Allocation of Portfolio as at 31 March 2011 % ofNet Assets
Fixed Income SecuritiesCanada 14.82Mexico 10.16France 7.28Netherlands 7.16United Kingdom 6.98Australia 5.21South Korea 3.38Germany 3.12Sweden 3.12Brazil 3.11Austria 2.96Malaysia 2.16Finland 2.03International Agencies 1.86Singapore 1.80Indonesia 1.45Israel 1.40Thailand 1.37Denmark 1.14Philippines 1.06Norway 0.80Hong Kong 0.34Total Fixed Income Securities 82.71Investment FundsLuxembourg 9.75Total Investment Funds 9.75Cash Equivalents, Cash and Other Assets/(Liabilities) 7.54
Total 100.00
Allocation of Portfolio as at 30 September 2010 (Unaudited) % ofNet Assets
Fixed Income SecuritiesCanada 14.54Mexico 10.65France 8.64Netherlands 8.21Germany 6.62United Kingdom 5.56Finland 4.34South Korea 4.16Austria 3.16Brazil 2.17International Agencies 2.01Singapore 1.90Australia 1.71Indonesia 1.57Hong Kong 1.40Thailand 1.00Sweden 0.95Norway 0.87Malaysia 0.65Total Fixed Income Securities 80.11Investment FundsLuxembourg 8.41Total Investment Funds 8.41Cash Equivalents, Cash and Other Assets/(Liabilities) 11.48
Total 100.00
JPMorgan Private Bank Funds I - International Currency Fixed Income FundSchedule of Investments (Market Value Expressed in USD) (continued)As at 31 March 2011
Quantity/Nominal
Value
Name of Securities Maturity/Coupon
MarketValue
%of
NetAssets
Quantity/Nominal
Value
Name of Securities Maturity/Coupon
MarketValue
%of
NetAssets
29
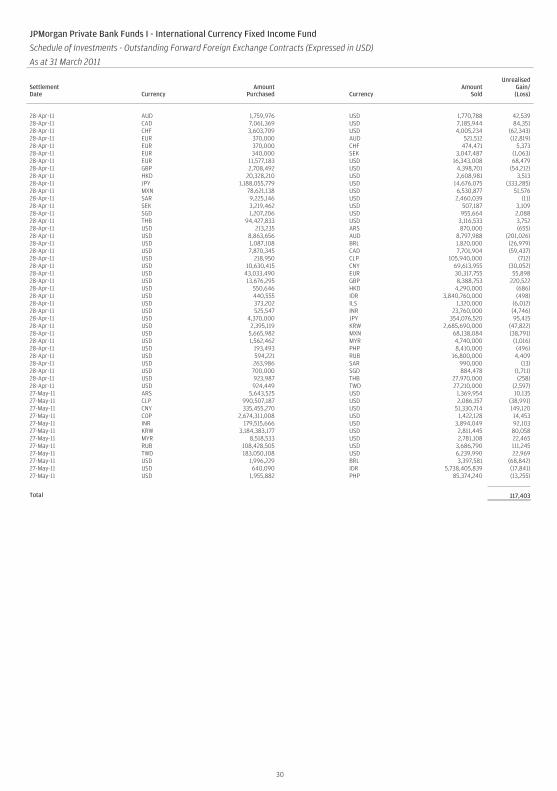
30
JPMorgan Private Bank Funds I - International Currency Fixed Income Fund
Schedule of Investments - Outstanding Forward Foreign Exchange Contracts (Expressed in USD)
As at 31 March 2011
SettlementDate Currency
AmountPurchased Currency
AmountSold
UnrealisedGain/(Loss)
28-Apr-11 AUD 1,759,976 USD 1,770,788 42,53928-Apr-11 CAD 7,061,369 USD 7,185,944 84,35128-Apr-11 CHF 3,603,709 USD 4,005,234 (62,343)28-Apr-11 EUR 370,000 AUD 521,512 (12,819)28-Apr-11 EUR 370,000 CHF 474,471 5,37328-Apr-11 EUR 340,000 SEK 3,047,487 (1,063)28-Apr-11 EUR 11,577,183 USD 16,343,008 68,47928-Apr-11 GBP 2,708,492 USD 4,398,701 (54,212)28-Apr-11 HKD 20,328,210 USD 2,608,981 3,51328-Apr-11 JPY 1,188,055,779 USD 14,676,075 (333,285)28-Apr-11 MXN 78,621,138 USD 6,530,877 51,57628-Apr-11 SAR 9,225,146 USD 2,460,039 (11)28-Apr-11 SEK 3,219,462 USD 507,187 3,10928-Apr-11 SGD 1,207,206 USD 955,664 2,08828-Apr-11 THB 94,427,833 USD 3,116,533 3,75228-Apr-11 USD 213,235 ARS 870,000 (655)28-Apr-11 USD 8,863,656 AUD 8,797,988 (201,026)28-Apr-11 USD 1,087,108 BRL 1,820,000 (26,979)28-Apr-11 USD 7,870,345 CAD 7,701,904 (59,437)28-Apr-11 USD 218,950 CLP 105,940,000 (712)28-Apr-11 USD 10,630,415 CNY 69,613,955 (30,052)28-Apr-11 USD 43,033,490 EUR 30,317,755 55,89828-Apr-11 USD 13,676,295 GBP 8,388,753 220,52228-Apr-11 USD 550,646 HKD 4,290,000 (686)28-Apr-11 USD 440,555 IDR 3,840,760,000 (498)28-Apr-11 USD 373,202 ILS 1,320,000 (6,012)28-Apr-11 USD 525,547 INR 23,760,000 (4,746)28-Apr-11 USD 4,370,000 JPY 354,076,520 95,41528-Apr-11 USD 2,395,119 KRW 2,685,690,000 (47,822)28-Apr-11 USD 5,665,982 MXN 68,138,084 (38,791)28-Apr-11 USD 1,562,462 MYR 4,740,000 (1,016)28-Apr-11 USD 193,493 PHP 8,410,000 (496)28-Apr-11 USD 594,221 RUB 16,800,000 4,40928-Apr-11 USD 263,986 SAR 990,000 (13)28-Apr-11 USD 700,000 SGD 884,478 (1,711)28-Apr-11 USD 923,987 THB 27,970,000 (258)28-Apr-11 USD 924,449 TWD 27,210,000 (2,597)27-May-11 ARS 5,643,525 USD 1,369,954 10,13527-May-11 CLP 990,507,187 USD 2,086,157 (38,991)27-May-11 CNY 335,455,270 USD 51,330,714 149,12027-May-11 COP 2,674,311,008 USD 1,422,128 14,45327-May-11 INR 179,515,666 USD 3,894,049 92,10327-May-11 KRW 3,184,383,177 USD 2,811,445 80,05827-May-11 MYR 8,518,533 USD 2,781,108 22,46527-May-11 RUB 108,428,505 USD 3,686,790 111,24527-May-11 TWD 183,050,108 USD 6,239,990 22,96927-May-11 USD 1,996,229 BRL 3,397,581 (68,842)27-May-11 USD 640,090 IDR 5,738,405,839 (17,841)27-May-11 USD 1,955,882 PHP 85,374,240 (13,255)
Total 117,403

31
Transferable Securities Admitted to an Official Exchange Listing
Shares
UNITED STATES OF AMERICA2,407 Abbott Laboratories 117,678 0.352,051 Abercrombie & Fitch - A Shares 119,860 0.361,701 Advance Auto Parts 110,616 0.33
2,047 Albemarle 121,530 0.362,600 Amgen 140,166 0.423,047 Analog Devices 120,387 0.36
921 Apache 121,821 0.366,746 AVX 100,313 0.301,569 Biogen Idec 113,690 0.344,758 Bristol-Myers Squibb 125,040 0.371,988 Cameron International 115,205 0.342,740 Carlisle Companies 119,820 0.363,967 Centene 129,443 0.396,245 Chevron 680,080 2.021,072 Cimarex Energy 123,891 0.375,109 Cisco Systems 88,386 0.261,221 Cliffs Natural Resources 119,756 0.36
3,478 Coca-Cola 231,357 0.691,577 Cognizant Technology Solutions - A Shares 128,872 0.381,199 Concho Resources/Midland 129,504 0.393,221 ConocoPhillips 262,705 0.781,581 Continental Resources 114,370 0.345,311 Corning 111,159 0.331,142 Cummins 125,095 0.37
2,468 Danaher 127,447 0.381,405 Deckers Outdoor 120,802 0.369,398 Dell 136,647 0.411,775 Devon Energy 163,389 0.491,927 Dover 125,505 0.371,242 Eastman Chemical 123,343 0.373,245 EI du Pont de Nemours & Co. 180,130 0.545,854 EMC/Massachusetts 156,887 0.472,837 Endo Pharmaceuticals Holdings 108,005 0.322,150 Energen 135,407 0.41
12,328 Entegris 108,733 0.3210,558 Exxon Mobil 892,045 2.65
2,810 Forest Laboratories 90,679 0.271,238 Fossil 113,005 0.342,968 Freeport-McMoRan Copper & Gold 165,496 0.491,560 Gardner Denver 121,165 0.362,128 Genuine Parts 113,635 0.342,788 Gilead Sciences 117,821 0.35
577 Google - A Shares 336,599 1.003,498 Halliburton 174,970 0.522,057 Health Net 67,161 0.202,039 Helmerich & Payne 138,693 0.411,736 Hess 149,053 0.44
6,002 Hewlett-Packard 247,883 0.742,833 Hill-Rom Holdings 107,172 0.323,543 Home Depot 130,701 0.392,330 Honeywell International 139,427 0.417,566 Intel 152,531 0.452,895 International Business Machines 473,825 1.415,477 Johnson & Johnson 325,498 0.973,127 Johnson Controls 128,488 0.381,977 Kohl’s 103,773 0.312,035 Lam Research 115,059 0.342,227 Littelfuse 127,117 0.382,291 Marathon Oil 122,316 0.363,254 Medtronic 127,622 0.383,423 Merck & Co. 113,472 0.34
12,532 Microsoft 320,193 0.951,648 National Oilwell Varco 133,142 0.403,002 Novellus Systems 110,534 0.332,498 Nucor 115,582 0.345,504 Nvidia 102,044 0.301,764 Occidental Petroleum 186,190 0.553,692 Omnivision Technologies 132,617 0.3911,276 Oracle 373,010 1.11
25,440 Pfizer 515,669 1.533,400 Pharmaceutical Product Development 94,826 0.28
764 Precision Castparts 112,682 0.343,626 Procter & Gamble 223,797 0.675,343 Qualcomm 291,621 0.871,398 Rockwell Automation 131,692 0.391,511 Rovi 81,549 0.24
2,444 SanDisk 112,815 0.343,289 Sensient Technologies 118,536 0.35
909 SM Energy 67,639 0.20
2,462 Sotheby’s 124,799 0.372,395 Tempur-Pedic International 121,235 0.366,406 Teradyne 114,795 0.341,940 Thermo Fisher Scientific 106,118 0.324,434 TIBCO Software 119,984 0.352,489 Timken 128,159 0.382,227 TJX 110,036 0.331,551 Union Pacific 152,603 0.453,215 UnitedHealth Group 146,347 0.442,418 Varian Semiconductor Equipment Associates 117,491 0.352,181 Veeco Instruments 111,471 0.331,206 VF 117,645 0.352,180 WABCO Holdings 133,242 0.403,773 Wal-Mart Stores 196,196 0.581,982 Watson Pharmaceuticals 111,864 0.331,762 Whiting Petroleum 130,511 0.39
837 WW Grainger 114,912 0.341,930 Zimmer Holdings 117,344 0.35
15,551,135 46.26
UNITED KINGDOM48,937 Afren 126,348 0.38
6,169 AMEC 118,085 0.353,262 Anglo American 169,133 0.504,986 Antofagasta 109,360 0.3311,290 ARM Holdings 105,519 0.31
3,123 AstraZeneca 145,265 0.4314,200 BG Group 356,226 1.06
9,328 Bodycote 49,301 0.1529,290 BP 214,559 0.64
7,378 Burberry Group 139,807 0.4224,833 Electrocomponents 105,947 0.3211,356 EnQuest 24,926 0.0718,265 Ferrexpo 127,453 0.3810,109 GlaxoSmithKline 194,882 0.5860,936 Howden Joinery Group 107,745 0.32
7,124 IMI 117,848 0.3510,937 John Wood Group 112,310 0.3316,244 Persimmon 117,755 0.35
7,632 Smith & Nephew 85,658 0.255,677 Tullow Oil 132,988 0.404,135 Weir Group 114,911 0.349,580 Xstrata 225,340 0.67
3,001,366 8.93
SWITZERLAND7,175 ABB Registered Shares 173,782 0.522,238 Compagnie Financiere Richemont - Bearer A Shares 130,250 0.388,657 Novartis Registered Shares 472,768 1.41
288 Rieter Holding Registered Shares 117,834 0.35738 Sulzer Registered Shares 111,414 0.33395 Syngenta Registered Shares 129,031 0.38
3,873 TE Connectivity 134,548 0.402,745 Tyco International 122,866 0.37
1,392,493 4.14
FRANCE909 Air Liquide 121,158 0.36
1,898 Cap Gemini 111,402 0.334,727 Sanofi-Aventis 332,857 0.99
998 Schneider Electric 170,203 0.511,290 Société BIC 115,261 0.347,250 Total 442,911 1.32
1,293,792 3.85
CANADA1,695 Canadian National Railway 127,086 0.383,851 Canadian Natural Resources 192,490 0.575,846 Centerra Gold 103,406 0.313,185 EnCana 110,804 0.33
903 First Quantum Minerals 116,003 0.355,855 Kinross Gold 92,104 0.27
10,499 Lundin Mining 87,284 0.262,887 Pacific Rubiales Energy 78,131 0.231,136 Research In Motion 63,968 0.196,272 RONA 91,557 0.277,096 SEMAFO 68,789 0.205,591 Talisman Energy 137,428 0.42
1,269,050 3.78
JPMorgan Private Bank Funds I - Islamic Global Dynamic Equity FundSchedule of Investments (Market Value Expressed in USD)As at 31 March 2011
Quantity/Nominal
Value
Name of Securities MarketValue
%of
NetAssets
Quantity/Nominal
Value
Name of Securities MarketValue
%of
NetAssets

JAPAN6,900 Brother Industries 101,778 0.302,700 Canon 117,979 0.353,200 Denso 106,609 0.324,100 Komatsu 139,809 0.437,600 Kuraray 98,343 0.291,000 Kyocera 101,756 0.301,300 Murata Manufacturing 93,995 0.285,000 Nippon Electric Glass 71,097 0.214,100 Nissin Kogyo 70,870 0.21
800 SMC 132,199 0.39
1,034,435 3.08
AUSTRALIA12,314 BHP Billiton 592,633 1.774,992 Flight Centre 114,964 0.34
79,434 Gindalbie Metals 93,191 0.287,419 Iluka Resources 101,993 0.30
902,781 2.69
GERMANY3,528 GEA Group 116,308 0.34
11,362 Infineon Technologies 117,085 0.352,453 SAP 150,152 0.452,107 Siemens Registered Shares 289,592 0.861,337 Wincor Nixdorf 107,875 0.32
781,012 2.32
TAIWAN4,169 Chunghwa Telecom ADR 130,240 0.38
28,000 Formosa Plastics 98,421 0.2915,797 Hon Hai Precision Industry Registered Shares GDR 112,633 0.343,000 HTC 117,168 0.35
12,846 Taiwan Semiconductor Manufacturing ADR 156,079 0.4642,424 United Microelectronics ADR 116,666 0.35
731,207 2.17
RUSSIA4,416 Gazprom OAO ADR 143,034 0.431,793 Lukoil ADR 128,289 0.38
4,465 MMC Norilsk Nickel 117,697 0.352,925 Novolipetsk Steel Registered Shares GDR 128,758 0.383,126 Tatneft ADR 137,481 0.41
655,259 1.95
INDIA4,339 Crompton Greaves Registered Shares GDR 132,535 0.393,401 Dr Reddy’s Laboratories ADR 127,163 0.381,697 Infosys Technologies ADR 122,795 0.373,684 Larsen & Toubro Registered Shares GDR 137,597 0.412,746 Reliance Industries GDR 144A 130,572 0.39
650,662 1.94
SOUTH KOREA425 Hyundai Mobis 126,770 0.38304 LG Chem 127,365 0.38
1,162 POSCO ADR 133,828 0.40599 Samsung Electronics GDR 144A 253,976 0.75
641,939 1.91
BRAZIL8,521 Duratex 90,749 0.27
10,383 MRV Engenharia e Participacoes 83,222 0.257,800 OGX Petroleo e Gas Participacoes 94,787 0.283,710 Petroleo Brasileiro ADR 151,145 0.455,660 Vale ADR 187,572 0.56
607,475 1.81
INDONESIA64,000 Indocement Tunggal Prakarsa 120,207 0.36
195,000 International Nickel Indonesia 106,964 0.32265,500 Perusahaan Gas Negara 118,949 0.35464,000 Perusahaan Perkebunan London Sumatra Indonesia 121,264 0.36
46,500 United Tractors 115,916 0.34
583,300 1.73
SOUTH AFRICA19,358 Clicks Group 121,477 0.3614,314 Mr Price Group 130,239 0.396,580 MTN Group 132,784 0.4011,682 Truworths International 122,317 0.36
506,817 1.51
CAYMAN ISLANDS886 Baidu ADR 121,160 0.36
87,000 Haitian International Holdings 111,785 0.33177,000 Lonking Holdings 124,401 0.37
1,225 Sina 131,639 0.39
488,985 1.45
IRELAND2,675 Accenture - A Shares 146,670 0.442,695 Covidien 139,763 0.4111,927 Dragon Oil 112,674 0.34
399,107 1.19
HONG KONG8,000 China Mobile 73,650 0.22
64,000 CNOOC 161,176 0.4837,000 MTR 136,917 0.41
371,743 1.11
MEXICO2,651 America Movil ADR - L Shares 152,326 0.45
34,184 Grupo Mexico - B Shares 127,212 0.38
279,538 0.83
JERSEY5,101 Petrofac 122,357 0.364,677 Shire 136,502 0.41
258,859 0.77
SINGAPORE14,000 Keppel 136,612 0.4177,000 Yangzijiang Shipbuilding Holdings 110,567 0.33
247,179 0.74
BERMUDA25,000 Cheung Kong Infrastructure Holdings 118,049 0.3566,000 COSCO Pacific 124,829 0.37
242,878 0.72
FINLAND2,377 Konecranes 109,900 0.332,844 Nokian Renkaat 121,691 0.36
231,591 0.69
DENMARK1,399 Novo Nordisk - B Shares 176,285 0.52
176,285 0.52
PANAMA5,377 McDermott International 137,006 0.41
137,006 0.41
TURKEY14,036 Ford Otomotiv Sanayi 134,070 0.40
134,070 0.40
SWEDEN9,251 Lundin Petroleum 133,380 0.40
133,380 0.40
NETHERLANDS2,919 ASML Holding 129,661 0.39
129,661 0.39
JPMorgan Private Bank Funds I - Islamic Global Dynamic Equity FundSchedule of Investments (Market Value Expressed in USD) (continued)As at 31 March 2011
Quantity/Nominal
Value
Name of Securities MarketValue
%of
NetAssets
Quantity/Nominal
Value
Name of Securities MarketValue
%of
NetAssets
32

CHINA34,000 Yanzhou Coal Mining - H Shares * 123,632 0.36
123,632 0.36
ITALY720 Tod’s 84,704 0.25
84,704 0.25
Total Shares 33,041,341 98.30
Total Transferable Securities Admitted to anOfficial Exchange Listing
33,041,341 98.30
Total Investments 33,041,341 98.30
Cash 677,993 2.02
Other Assets/(Liabilities) (107,638) (0.32)
Total Net Assets 33,611,696 100.00
* Hong Kong Registered Shares.
Allocation of Portfolio as at 31 March 2011 % ofNet Assets
SharesEnergy 21.03Information Technology 21.00Industrials 13.36Health Care 13.05Materials 12.95Consumer Discretionary 11.54Consumer Staples 2.06Telecommunication Services 1.45Financials 1.10Utilities 0.76Total Shares 98.30Cash and Other Assets/(Liabilities) 1.70
Total 100.00
Allocation of Portfolio as at 30 September 2010 (Unaudited) % ofNet Assets
SharesInformation Technology 22.32Energy 16.99Health Care 14.65Industrials 13.79Consumer Discretionary 13.65Materials 12.93Telecommunication Services 2.25Consumer Staples 1.93Utilities 0.64Total Shares 99.15Cash and Other Assets/(Liabilities) 0.85
Total 100.00
JPMorgan Private Bank Funds I - Islamic Global Dynamic Equity FundSchedule of Investments (Market Value Expressed in USD) (continued)As at 31 March 2011
Quantity/Nominal
Value
Name of Securities MarketValue
%of
NetAssets
Quantity/Nominal
Value
Name of Securities MarketValue
%of
NetAssets
33
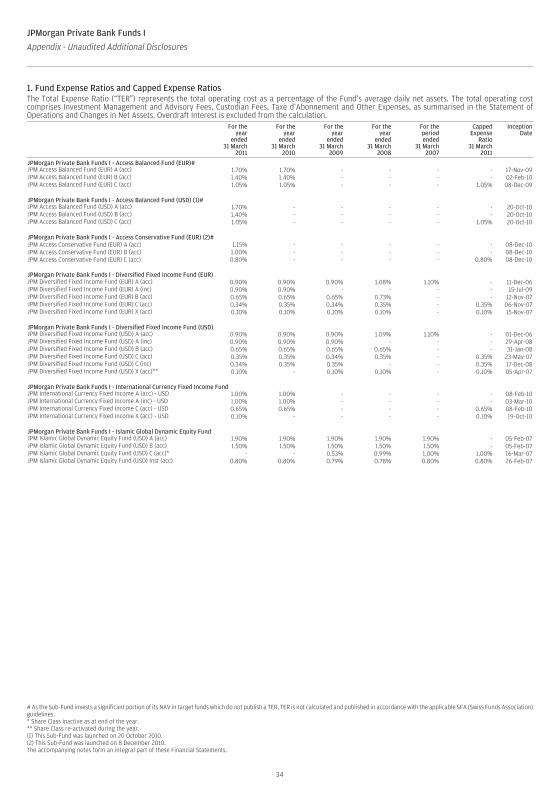
34
JPMorgan Private Bank Funds I
Appendix - Unaudited Additional Disclosures
1. Fund Expense Ratios and Capped Expense RatiosThe Total Expense Ratio (“TER”) represents the total operating cost as a percentage of the Fund’s average daily net assets. The total operating costcomprises Investment Management and Advisory Fees, Custodian Fees, Taxe d’Abonnement and Other Expenses, as summarised in the Statement ofOperations and Changes in Net Assets. Overdraft Interest is excluded from the calculation.
For theyear
ended31 March
2011
For theyear
ended31 March
2010
For theyear
ended31 March
2009
For theyear
ended31 March
2008
For theperiodended
31 March2007
CappedExpense
Ratio31 March
2011
InceptionDate
JPMorgan Private Bank Funds I - Access Balanced Fund (EUR)#JPM Access Balanced Fund (EUR) A (acc) 1.70% 1.70% - - - - 17-Nov-09JPM Access Balanced Fund (EUR) B (acc) 1.40% 1.40% - - - - 02-Feb-10JPM Access Balanced Fund (EUR) C (acc) 1.05% 1.05% - - - 1.05% 08-Dec-09
JPMorgan Private Bank Funds I - Access Balanced Fund (USD) (1)#JPM Access Balanced Fund (USD) A (acc) 1.70% - - - - - 20-Oct-10JPM Access Balanced Fund (USD) B (acc) 1.40% - - - - - 20-Oct-10JPM Access Balanced Fund (USD) C (acc) 1.05% - - - - 1.05% 20-Oct-10
JPMorgan Private Bank Funds I - Access Conservative Fund (EUR) (2)#JPM Access Conservative Fund (EUR) A (acc) 1.15% - - - - - 08-Dec-10JPM Access Conservative Fund (EUR) B (acc) 1.00% - - - - - 08-Dec-10JPM Access Conservative Fund (EUR) C (acc) 0.80% - - - - 0.80% 08-Dec-10
JPMorgan Private Bank Funds I - Diversified Fixed Income Fund (EUR)JPM Diversified Fixed Income Fund (EUR) A (acc) 0.90% 0.90% 0.90% 1.08% 1.10% - 11-Dec-06JPM Diversified Fixed Income Fund (EUR) A (inc) 0.90% 0.90% - - - - 15-Jul-09JPM Diversified Fixed Income Fund (EUR) B (acc) 0.65% 0.65% 0.65% 0.73% - - 12-Nov-07JPM Diversified Fixed Income Fund (EUR) C (acc) 0.34% 0.35% 0.34% 0.35% - 0.35% 06-Nov-07JPM Diversified Fixed Income Fund (EUR) X (acc) 0.10% 0.10% 0.10% 0.10% - 0.10% 15-Nov-07
JPMorgan Private Bank Funds I - Diversified Fixed Income Fund (USD)JPM Diversified Fixed Income Fund (USD) A (acc) 0.90% 0.90% 0.90% 1.09% 1.10% - 01-Dec-06JPM Diversified Fixed Income Fund (USD) A (inc) 0.90% 0.90% 0.90% - - - 29-Apr-08JPM Diversified Fixed Income Fund (USD) B (acc) 0.65% 0.65% 0.65% 0.65% - - 31-Jan-08JPM Diversified Fixed Income Fund (USD) C (acc) 0.35% 0.35% 0.34% 0.35% - 0.35% 23-May-07JPM Diversified Fixed Income Fund (USD) C (inc) 0.34% 0.35% 0.35% - - 0.35% 17-Dec-08JPM Diversified Fixed Income Fund (USD) X (acc)** 0.10% - 0.10% 0.10% - 0.10% 05-Apr-07
JPMorgan Private Bank Funds I - International Currency Fixed Income FundJPM International Currency Fixed Income A (acc) - USD 1.00% 1.00% - - - - 08-Feb-10JPM International Currency Fixed Income A (inc) - USD 1.00% 1.00% - - - - 03-Mar-10JPM International Currency Fixed Income C (acc) - USD 0.65% 0.65% - - - 0.65% 08-Feb-10JPM International Currency Fixed Income X (acc) - USD 0.10% - - - - 0.10% 19-Oct-10
JPMorgan Private Bank Funds I - Islamic Global Dynamic Equity FundJPM Islamic Global Dynamic Equity Fund (USD) A (acc) 1.90% 1.90% 1.90% 1.90% 1.90% - 05-Feb-07JPM Islamic Global Dynamic Equity Fund (USD) B (acc) 1.50% 1.50% 1.50% 1.50% 1.50% - 05-Feb-07JPM Islamic Global Dynamic Equity Fund (USD) C (acc)* - - 0.53% 0.99% 1.00% 1.00% 16-Mar-07JPM Islamic Global Dynamic Equity Fund (USD) Inst (acc) 0.80% 0.80% 0.79% 0.78% 0.80% 0.80% 26-Feb-07
# As the Sub-Fund invests a significant portion of its NAV in target funds which do not publish a TER, TER is not calculated and published in accordance with the applicable SFA (Swiss Funds Association)guidelines.* Share Class inactive as at end of the year.** Share Class re-activated during the year.(1) This Sub-Fund was launched on 20 October 2010.(2) This Sub-Fund was launched on 8 December 2010.The accompanying notes form an integral part of these Financial Statements.

JPMorgan Private Bank Funds I
Appendix - Unaudited Additional Disclosures (continued)
2. Summary of Investment Objectives of the Sub-Funds
JPMorgan Private Bank Funds I – Access Balanced Fund (EUR)Seeks to achieve a total level of return in EUR in excess of global equity and fixed income markets by investing primarily in a diversified portfolio of UCITS andother UCIs and using derivatives where appropriate.
JPMorgan Private Bank Funds I – Access Balanced Fund (USD)Seeks to achieve a total level of return in USD in excess of global equity and fixed income markets by investing primarily in a diversified portfolio of UCITS andother UCIs and using derivatives where appropriate.
JPMorgan Private Bank Funds I - Access Conservative Fund (EUR)Seeks to achieve a total level of return in EUR in excess of global fixed income and equity markets by investing primarily in a diversified portfolio of UCITS andother UCIs and using derivatives where appropriate.
JPMorgan Private Bank Funds I - Diversified Fixed Income Fund (EUR)Seeks to achieve a total level of return in EUR in excess of global government fixed income markets by investing primarily in a diversified portfolio of bondsand other debt securities.
JPMorgan Private Bank Funds I - Diversified Fixed Income Fund (USD)Seeks to achieve a total level of return in USD in excess of global government fixed income markets by investing primarily in a diversified portfolio of bondsand other debt securities.
JPMorgan Private Bank Funds I – International Currency Fixed Income FundSeeks to achieve a competitive level of return by investing primarily in short-term global fixed and floating rate debt securities denominated in currenciesother than USD, using financial derivative instruments where appropriate.
JPMorgan Private Bank Funds I - Islamic Global Dynamic Equity FundSeeks to achieve long-term capital growth, by investing in a diversified portfolio of equity securities within the Dow Jones Islamic Market World Index (the“Islamic Index”).
35
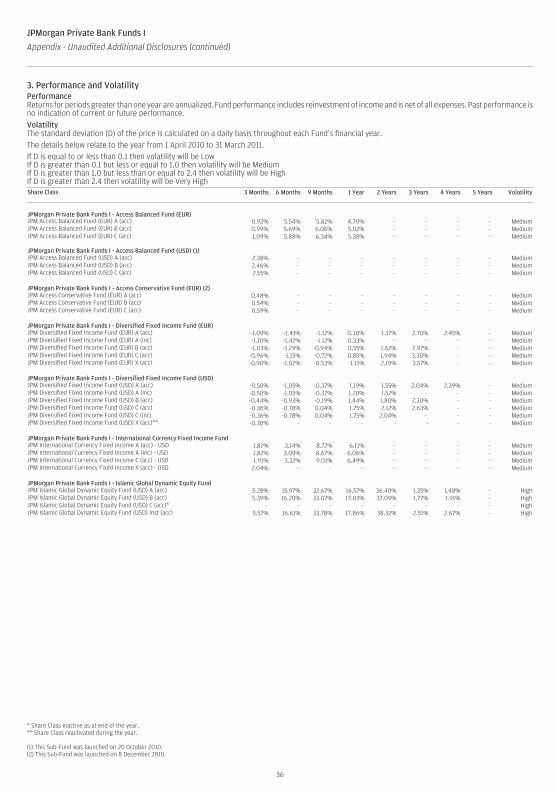
JPMorgan Private Bank Funds I
Appendix - Unaudited Additional Disclosures (continued)
3. Performance and VolatilityPerformanceReturns for periods greater than one year are annualized. Fund performance includes reinvestment of income and is net of all expenses. Past performance isno indication of current or future performance.VolatilityThe standard deviation (D) of the price is calculated on a daily basis throughout each Fund’s financial year.The details below relate to the year from 1 April 2010 to 31 March 2011.If D is equal to or less than 0.1 then volatility will be LowIf D is greater than 0.1 but less or equal to 1.0 then volatility will be MediumIf D is greater than 1.0 but less than or equal to 2.4 then volatility will be HighIf D is greater than 2.4 then volatility will be Very HighShare Class 3 Months 6 Months 9 Months 1 Year 2 Years 3 Years 4 Years 5 Years Volatility
JPMorgan Private Bank Funds I - Access Balanced Fund (EUR)JPM Access Balanced Fund (EUR) A (acc) 0.92% 5.54% 5.82% 4.70% - - - - MediumJPM Access Balanced Fund (EUR) B (acc) 0.99% 5.69% 6.06% 5.02% - - - - MediumJPM Access Balanced Fund (EUR) C (acc) 1.09% 5.88% 6.34% 5.38% - - - - Medium
JPMorgan Private Bank Funds I - Access Balanced Fund (USD) (1)JPM Access Balanced Fund (USD) A (acc) 2.38% - - - - - - - MediumJPM Access Balanced Fund (USD) B (acc) 2.46% - - - - - - - MediumJPM Access Balanced Fund (USD) C (acc) 2.55% - - - - - - - Medium
JPMorgan Private Bank Funds I - Access Conservative Fund (EUR) (2)JPM Access Conservative Fund (EUR) A (acc) 0.48% - - - - - - - MediumJPM Access Conservative Fund (EUR) B (acc) 0.54% - - - - - - - MediumJPM Access Conservative Fund (EUR) C (acc) 0.59% - - - - - - - Medium
JPMorgan Private Bank Funds I - Diversified Fixed Income Fund (EUR)JPM Diversified Fixed Income Fund (EUR) A (acc) -1.09% -1.41% -1.12% 0.30% 1.37% 2.70% 2.45% - MediumJPM Diversified Fixed Income Fund (EUR) A (inc) -1.10% -1.42% -1.12% 0.33% - - - - MediumJPM Diversified Fixed Income Fund (EUR) B (acc) -1.03% -1.29% -0.94% 0.55% 1.62% 2.97% - - MediumJPM Diversified Fixed Income Fund (EUR) C (acc) -0.96% -1.15% -0.72% 0.85% 1.94% 3.30% - - MediumJPM Diversified Fixed Income Fund (EUR) X (acc) -0.90% -1.02% -0.53% 1.11% 2.19% 3.57% - - Medium
JPMorgan Private Bank Funds I - Diversified Fixed Income Fund (USD)JPM Diversified Fixed Income Fund (USD) A (acc) -0.50% -1.05% -0.37% 1.19% 1.55% 2.04% 2.39% - MediumJPM Diversified Fixed Income Fund (USD) A (inc) -0.50% -1.05% -0.37% 1.20% 1.52% - - - MediumJPM Diversified Fixed Income Fund (USD) B (acc) -0.44% -0.93% -0.19% 1.44% 1.80% 2.30% - - MediumJPM Diversified Fixed Income Fund (USD) C (acc) -0.36% -0.78% 0.04% 1.75% 2.12% 2.63% - - MediumJPM Diversified Fixed Income Fund (USD) C (inc) -0.36% -0.78% 0.04% 1.75% 2.04% - - - MediumJPM Diversified Fixed Income Fund (USD) X (acc)** -0.30% - - - - - - - Medium
JPMorgan Private Bank Funds I - International Currency Fixed Income FundJPM International Currency Fixed Income A (acc) - USD 1.82% 3.14% 8.72% 6.11% - - - - MediumJPM International Currency Fixed Income A (inc) - USD 1.82% 3.09% 8.67% 6.06% - - - - MediumJPM International Currency Fixed Income C (acc) - USD 1.91% 3.32% 9.01% 6.49% - - - - MediumJPM International Currency Fixed Income X (acc) - USD 2.04% - - - - - - - Medium
JPMorgan Private Bank Funds I - Islamic Global Dynamic Equity FundJPM Islamic Global Dynamic Equity Fund (USD) A (acc) 5.28% 15.97% 32.67% 16.57% 36.40% 1.35% 1.48% - HighJPM Islamic Global Dynamic Equity Fund (USD) B (acc) 5.39% 16.20% 33.07% 17.03% 37.09% 1.77% 1.91% - HighJPM Islamic Global Dynamic Equity Fund (USD) C (acc)* - - - - - - - - HighJPM Islamic Global Dynamic Equity Fund (USD) Inst (acc) 5.57% 16.61% 33.78% 17.86% 38.32% 2.51% 2.67% - High
* Share Class inactive as at end of the year.** Share Class reactivated during the year.
(1) This Sub-Fund was launched on 20 October 2010.(2) This Sub-Fund was launched on 8 December 2010.
36
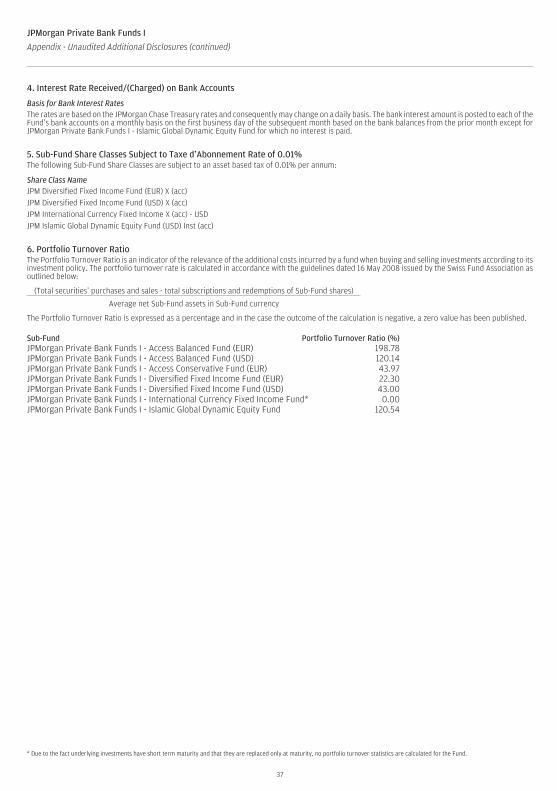
JPMorgan Private Bank Funds I
Appendix - Unaudited Additional Disclosures (continued)
4. Interest Rate Received/(Charged) on Bank Accounts
Basis for Bank Interest RatesThe rates are based on the JPMorgan Chase Treasury rates and consequently may change on a daily basis. The bank interest amount is posted to each of theFund’s bank accounts on a monthly basis on the first business day of the subsequent month based on the bank balances from the prior month except forJPMorgan Private Bank Funds I - Islamic Global Dynamic Equity Fund for which no interest is paid.
5. Sub-Fund Share Classes Subject to Taxe d’Abonnement Rate of 0.01%The following Sub-Fund Share Classes are subject to an asset based tax of 0.01% per annum:
Share Class NameJPM Diversified Fixed Income Fund (EUR) X (acc)JPM Diversified Fixed Income Fund (USD) X (acc)JPM International Currency Fixed Income X (acc) - USDJPM Islamic Global Dynamic Equity Fund (USD) Inst (acc)
6. Portfolio Turnover RatioThe Portfolio Turnover Ratio is an indicator of the relevance of the additional costs incurred by a fund when buying and selling investments according to itsinvestment policy. The portfolio turnover rate is calculated in accordance with the guidelines dated 16 May 2008 issued by the Swiss Fund Association asoutlined below:
(Total securities’ purchases and sales - total subscriptions and redemptions of Sub-Fund shares)
Average net Sub-Fund assets in Sub-Fund currency
The Portfolio Turnover Ratio is expressed as a percentage and in the case the outcome of the calculation is negative, a zero value has been published.
Sub-Fund Portfolio Turnover Ratio (%)JPMorgan Private Bank Funds I - Access Balanced Fund (EUR) 198.78JPMorgan Private Bank Funds I - Access Balanced Fund (USD) 120.14JPMorgan Private Bank Funds I - Access Conservative Fund (EUR) 43.97JPMorgan Private Bank Funds I - Diversified Fixed Income Fund (EUR) 22.30JPMorgan Private Bank Funds I - Diversified Fixed Income Fund (USD) 43.00JPMorgan Private Bank Funds I - International Currency Fixed Income Fund* 0.00JPMorgan Private Bank Funds I - Islamic Global Dynamic Equity Fund 120.54
* Due to the fact underlying investments have short term maturity and that they are replaced only at maturity, no portfolio turnover statistics are calculated for the Fund.
37
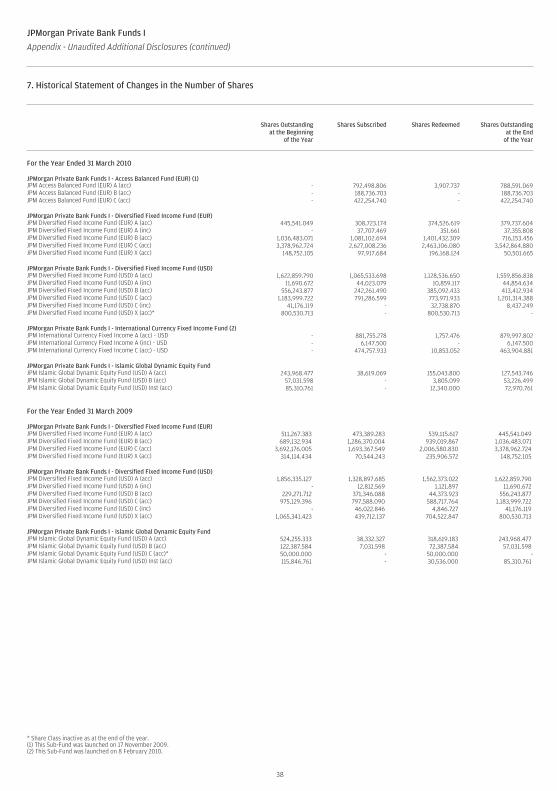
JPMorgan Private Bank Funds I
Appendix - Unaudited Additional Disclosures (continued)
7. Historical Statement of Changes in the Number of Shares
Shares Outstandingat the Beginning
of the Year
Shares Subscribed Shares Redeemed Shares Outstandingat the End
of the Year
For the Year Ended 31 March 2010
JPMorgan Private Bank Funds I - Access Balanced Fund (EUR) (1)JPM Access Balanced Fund (EUR) A (acc) - 792,498.806 3,907.737 788,591.069JPM Access Balanced Fund (EUR) B (acc) - 188,736.703 - 188,736.703JPM Access Balanced Fund (EUR) C (acc) - 422,254.740 - 422,254.740
JPMorgan Private Bank Funds I - Diversified Fixed Income Fund (EUR)JPM Diversified Fixed Income Fund (EUR) A (acc) 445,541.049 308,723.174 374,526.619 379,737.604JPM Diversified Fixed Income Fund (EUR) A (inc) - 37,707.469 351.661 37,355.808JPM Diversified Fixed Income Fund (EUR) B (acc) 1,036,483.071 1,081,102.694 1,401,432.309 716,153.456JPM Diversified Fixed Income Fund (EUR) C (acc) 3,378,962.724 2,627,008.236 2,463,106.080 3,542,864.880JPM Diversified Fixed Income Fund (EUR) X (acc) 148,752.105 97,917.684 196,168.124 50,501.665
JPMorgan Private Bank Funds I - Diversified Fixed Income Fund (USD)JPM Diversified Fixed Income Fund (USD) A (acc) 1,622,859.790 1,065,533.698 1,128,536.650 1,559,856.838JPM Diversified Fixed Income Fund (USD) A (inc) 11,690.672 44,023.079 10,859.117 44,854.634JPM Diversified Fixed Income Fund (USD) B (acc) 556,243.877 242,261.490 385,092.433 413,412.934JPM Diversified Fixed Income Fund (USD) C (acc) 1,183,999.722 791,286.599 773,971.933 1,201,314.388JPM Diversified Fixed Income Fund (USD) C (inc) 41,176.119 - 32,738.870 8,437.249JPM Diversified Fixed Income Fund (USD) X (acc)* 800,530.713 - 800,530.713 -
JPMorgan Private Bank Funds I - International Currency Fixed Income Fund (2)JPM International Currency Fixed Income A (acc) - USD - 881,755.278 1,757.476 879,997.802JPM International Currency Fixed Income A (inc) - USD - 6,147.500 - 6,147.500JPM International Currency Fixed Income C (acc) - USD - 474,757.933 10,853.052 463,904.881
JPMorgan Private Bank Funds I - Islamic Global Dynamic Equity FundJPM Islamic Global Dynamic Equity Fund (USD) A (acc) 243,968.477 38,619.069 155,043.800 127,543.746JPM Islamic Global Dynamic Equity Fund (USD) B (acc) 57,031.598 - 3,805.099 53,226.499JPM Islamic Global Dynamic Equity Fund (USD) Inst (acc) 85,310.761 - 12,340.000 72,970.761
For the Year Ended 31 March 2009
JPMorgan Private Bank Funds I - Diversified Fixed Income Fund (EUR)JPM Diversified Fixed Income Fund (EUR) A (acc) 511,267.383 473,389.283 539,115.617 445,541.049JPM Diversified Fixed Income Fund (EUR) B (acc) 689,132.934 1,286,370.004 939,019.867 1,036,483.071JPM Diversified Fixed Income Fund (EUR) C (acc) 3,692,176.005 1,693,367.549 2,006,580.830 3,378,962.724JPM Diversified Fixed Income Fund (EUR) X (acc) 314,114.434 70,544.243 235,906.572 148,752.105
JPMorgan Private Bank Funds I - Diversified Fixed Income Fund (USD)JPM Diversified Fixed Income Fund (USD) A (acc) 1,856,335.127 1,328,897.685 1,562,373.022 1,622,859.790JPM Diversified Fixed Income Fund (USD) A (inc) - 12,812.569 1,121.897 11,690.672JPM Diversified Fixed Income Fund (USD) B (acc) 229,271.712 371,346.088 44,373.923 556,243.877JPM Diversified Fixed Income Fund (USD) C (acc) 975,129.396 797,588.090 588,717.764 1,183,999.722JPM Diversified Fixed Income Fund (USD) C (inc) - 46,022.846 4,846.727 41,176.119JPM Diversified Fixed Income Fund (USD) X (acc) 1,065,341.423 439,712.137 704,522.847 800,530.713
JPMorgan Private Bank Funds I - Islamic Global Dynamic Equity FundJPM Islamic Global Dynamic Equity Fund (USD) A (acc) 524,255.333 38,332.327 318,619.183 243,968.477JPM Islamic Global Dynamic Equity Fund (USD) B (acc) 122,387.584 7,031.598 72,387.584 57,031.598JPM Islamic Global Dynamic Equity Fund (USD) C (acc)* 50,000.000 - 50,000.000 -JPM Islamic Global Dynamic Equity Fund (USD) Inst (acc) 115,846.761 - 30,536.000 85,310.761
* Share Class inactive as at the end of the year.(1) This Sub-Fund was launched on 17 November 2009.(2) This Sub-Fund was launched on 8 February 2010.
38
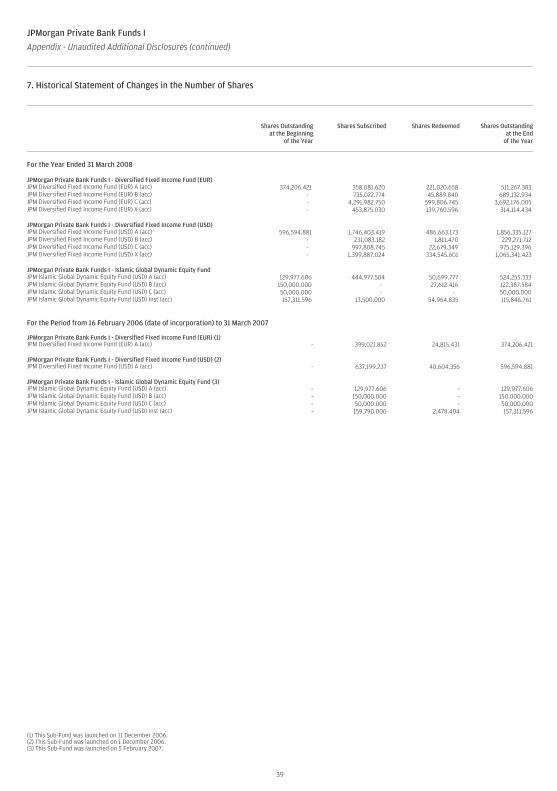
Shares Outstandingat the Beginning
of the Year
Shares Subscribed Shares Redeemed Shares Outstandingat the End
of the Year
For the Year Ended 31 March 2008
JPMorgan Private Bank Funds I - Diversified Fixed Income Fund (EUR)JPM Diversified Fixed Income Fund (EUR) A (acc) 374,206.421 358,081.620 221,020.658 511,267.383JPM Diversified Fixed Income Fund (EUR) B (acc) - 735,022.774 45,889.840 689,132.934JPM Diversified Fixed Income Fund (EUR) C (acc) - 4,291,982.750 599,806.745 3,692,176.005JPM Diversified Fixed Income Fund (EUR) X (acc) - 453,875.030 139,760.596 314,114.434
JPMorgan Private Bank Funds I - Diversified Fixed Income Fund (USD)JPM Diversified Fixed Income Fund (USD) A (acc) 596,594.881 1,746,403.419 486,663.173 1,856,335.127JPM Diversified Fixed Income Fund (USD) B (acc) - 231,083.182 1,811.470 229,271.712JPM Diversified Fixed Income Fund (USD) C (acc) - 997,808.745 22,679.349 975,129.396JPM Diversified Fixed Income Fund (USD) X (acc) - 1,399,887.024 334,545.601 1,065,341.423
JPMorgan Private Bank Funds I - Islamic Global Dynamic Equity FundJPM Islamic Global Dynamic Equity Fund (USD) A (acc) 129,977.606 444,977.504 50,699.777 524,255.333JPM Islamic Global Dynamic Equity Fund (USD) B (acc) 150,000.000 - 27,612.416 122,387.584JPM Islamic Global Dynamic Equity Fund (USD) C (acc) 50,000.000 - - 50,000.000JPM Islamic Global Dynamic Equity Fund (USD) Inst (acc) 157,311.596 13,500.000 54,964.835 115,846.761
For the Period from 16 February 2006 (date of incorporation) to 31 March 2007
JPMorgan Private Bank Funds I - Diversified Fixed Income Fund (EUR) (1)JPM Diversified Fixed Income Fund (EUR) A (acc) - 399,021.852 24,815.431 374,206.421
JPMorgan Private Bank Funds I - Diversified Fixed Income Fund (USD) (2)JPM Diversified Fixed Income Fund (USD) A (acc) - 637,199.237 40,604.356 596,594.881
JPMorgan Private Bank Funds I - Islamic Global Dynamic Equity Fund (3)JPM Islamic Global Dynamic Equity Fund (USD) A (acc) - 129,977.606 - 129,977.606JPM Islamic Global Dynamic Equity Fund (USD) B (acc) - 150,000.000 - 150,000.000JPM Islamic Global Dynamic Equity Fund (USD) C (acc) - 50,000.000 - 50,000.000JPM Islamic Global Dynamic Equity Fund (USD) Inst (acc) - 159,790.000 2,478.404 157,311.596
(1) This Sub-Fund was launched on 11 December 2006.(2) This Sub-Fund was launched on 1 December 2006.(3) This Sub-Fund was launched on 5 February 2007.
39
JPMorgan Private Bank Funds I
Appendix - Unaudited Additional Disclosures (continued)
7. Historical Statement of Changes in the Number of Shares

Language Disclaimer Annual


JPMorgan Asset Management (Europe) S.à r.l.Postal Address: L-2888 LuxembourgTel No: (352) 34 101 Fax No: (352) 3410 8000E-mail: [email protected]
H747 07/11CH GB
CH-GB
For further information concerning JPMorgan Private Bank Funds I, please contact the Global Distributor:


![PROSPETTO GENNAIO 2020 JPMorgan FundsPRO]_[IT_IT].pdf · JPMorgan Funds - Multi-Manager Alternatives Fund 195 JPMorgan Funds - Multi-Manager Sustainable Long-Short Fund 197 Altri](https://static.fdocuments.in/doc/165x107/5e92f6d54aa8b723a022e93b/prospetto-gennaio-2020-jpmorgan-proititpdf-jpmorgan-funds-multi-manager.jpg)