JPMorgan Diversified Alternatives ETF - J.P. Morgan …. MORGAN DIVERSIFIED ALTERNATIVES ETF EMPLOYS...
22
FOR INSTITUTIONAL USE ONLY | NOT FOR PUBLIC DISTRIBUTION JPMorgan Diversified Alternatives ETF J.P. Morgan Asset Management | 2016
-
Upload
truongcong -
Category
Documents
-
view
220 -
download
1
Transcript of JPMorgan Diversified Alternatives ETF - J.P. Morgan …. MORGAN DIVERSIFIED ALTERNATIVES ETF EMPLOYS...

FOR INSTITUTIONAL USE ONLY | NOT FOR PUBLIC DISTRIBUTION
JPMorgan Diversified Alternatives ETF
J.P. Morgan Asset Management | 2016

1 | FOR INSTITUTIONAL USE ONLY | NOT FOR PUBLIC DISTRIBUTION
GUIDE TO THE MARKETS – PAGES 32,36 2
(NOMINAL 10-YEAR TREASURY YIELD)
0%
2%
4%
6%
8%
10%
12%
14%
16%
18%
20%
'62 '67 '72 '77 '82 '87 '92 '97 '02 '07 '12
GUIDE TO THE MARKETS – PAGE 4 1
(S&P 500 INDEX AT INFLECTION POINTS)
600
800
1,000
1,200
1,400
1,600
1,800
2,000
2,200
'97 '98 '99 '00 '01 '02 '03 '04 '05 '06 '07 '08 '09 '10 '11 '12 '13 '14 '15 '16
Current equity market levels and the prospect of rising rates may mean lower returns
and higher volatility in traditional portfolios
1 Source: J.P. Morgan Asset Management Guide to the Market 3Q 2016, Standard & Poor’s, Compustat, FactSet. Dividend yield is calculated as the annualized dividend rate divided by price, as provided
by Compustat. Forward Price to Earnings Ratio is a bottom-up calculation based on the most recent S&P500 Index Price, divided by consensus estimates for earnings in the next 12 months (NTM), and is
provided by FactSet Market Aggregates. Returns are cumulative and based on S&P500 Index price movement only, and do not include the reinvestment of dividends.
2 Source: J.P. Morgan Asset Management Guide to the Market 3Q 2016, Federal Reserve, BLS, Barclays Capital, U.S. Treasury. Change in bond prices is calculated using both duration and convexity
according to the following formula: New Price = (Price + (Price * -Duration * Change in Interest Rates)) + (0.5 * Price * Convexity * (Change in Interest Rates)^2).
Shown for illustrative purposes only. Past performance is not indicative of future results.
S&P 500 INDEX AT INFLECTION POINTS… …AND U.S. INTEREST RATE CYCLE IN TRANSITION
-19.2%
-8.7%
-4.7%
-4.9%
-2.0%
-25% -20% -15% -10% -5% 0%
30y UST
10y UST
5y UST
TIPS
2y UST
PRICE IMPACT OF A 1% RISE IN
INTEREST RATES Characteristic Mar-2000 Oct-2007 Mar-2016
Index Level 1,527 1,565 2,099
P/E Ratio (fwd.) 27.2x 15.7x 16.6x
Dividend Yield 1.1% 1.8% 2.3%
Dec. 31, 1996
P/E (fwd.) = 16.0x
741
+106%
Mar. 24, 2000
P/E (fwd.) = 27.2x
1,527
-49%
Oct. 9, 2002
P/E (fwd.) = 14.1x
777
+101%
Oct. 9, 2007
P/E (fwd.) = 15.7x
1,565
-57%
Mar. 9, 2009
P/E (fwd.) = 10.3x
677
+210%
Jun. 30, 2016
P/E (fwd.) = 16.6x
2,099
Sep. 30, 1981:
15.84%
Jun. 30, 2016:
1.49%
2 | FOR INSTITUTIONAL USE ONLY | NOT FOR PUBLIC DISTRIBUTION
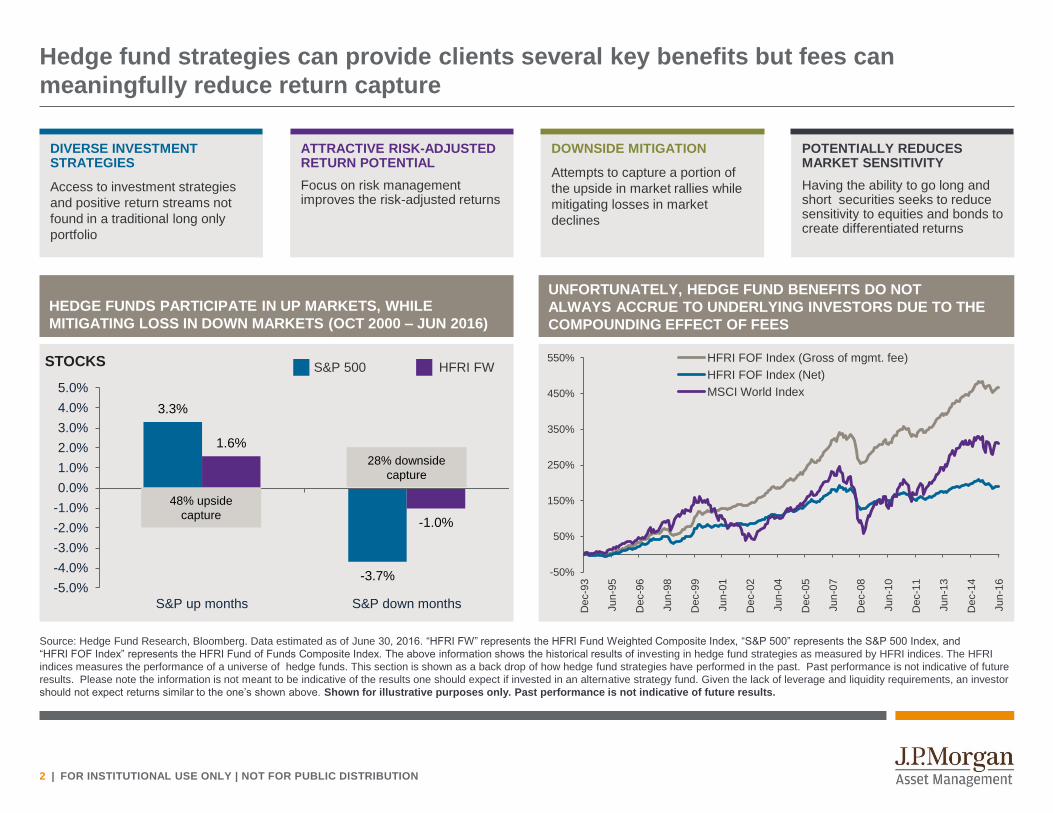
Hedge fund strategies can provide clients several key benefits but fees can
meaningfully reduce return capture
Source: Hedge Fund Research, Bloomberg. Data estimated as of June 30, 2016. “HFRI FW” represents the HFRI Fund Weighted Composite Index, “S&P 500” represents the S&P 500 Index, and
“HFRI FOF Index” represents the HFRI Fund of Funds Composite Index. The above information shows the historical results of investing in hedge fund strategies as measured by HFRI indices. The HFRI
indices measures the performance of a universe of hedge funds. This section is shown as a back drop of how hedge fund strategies have performed in the past. Past performance is not indicative of future
results. Please note the information is not meant to be indicative of the results one should expect if invested in an alternative strategy fund. Given the lack of leverage and liquidity requirements, an investor
should not expect returns similar to the one’s shown above. Shown for illustrative purposes only. Past performance is not indicative of future results.
HEDGE FUNDS PARTICIPATE IN UP MARKETS, WHILE
MITIGATING LOSS IN DOWN MARKETS (OCT 2000 – JUN 2016)
3.3%
-3.7%
1.6%
-1.0%
-5.0%
-4.0%
-3.0%
-2.0%
-1.0%
0.0%
1.0%
2.0%
3.0%
4.0%
5.0%
S&P up months S&P down months
48% upside
capture
28% downside
capture
S&P 500 HFRI FW STOCKS
-50%
50%
150%
250%
350%
450%
550%
Dec-9
3
Jun
-95
Dec-9
6
Jun
-98
Dec-9
9
Jun
-01
Dec-0
2
Jun
-04
Dec-0
5
Jun
-07
Dec-0
8
Jun
-10
Dec-1
1
Jun
-13
Dec-1
4
Jun
-16
HFRI FOF Index (Gross of mgmt. fee)
HFRI FOF Index (Net)
MSCI World Index
UNFORTUNATELY, HEDGE FUND BENEFITS DO NOT
ALWAYS ACCRUE TO UNDERLYING INVESTORS DUE TO THE
COMPOUNDING EFFECT OF FEES
DIVERSE INVESTMENT STRATEGIES
Access to investment strategies
and positive return streams not
found in a traditional long only
portfolio
ATTRACTIVE RISK-ADJUSTED RETURN POTENTIAL
Focus on risk management improves the risk-adjusted returns
DOWNSIDE MITIGATION
Attempts to capture a portion of
the upside in market rallies while
mitigating losses in market
declines
POTENTIALLY REDUCES MARKET SENSITIVITY
Having the ability to go long and short securities seeks to reduce sensitivity to equities and bonds to create differentiated returns

3 | FOR INSTITUTIONAL USE ONLY | NOT FOR PUBLIC DISTRIBUTION
Hedge fund strategies, once offered only to institutional clients, are now offered to
retail clients
COMMON MISCONCEPTIONS ABOUT HEDGE FUND STRATEGIES
Only institutional or accredited investors can access high quality hedge fund strategies
Individual investors can access hedge fund strategies through an array of Alternative ETFs and Mutual Funds which have been created in recent years
Investing in one hedge fund strategy will diversify my portfolio
Investing in only one hedge fund strategy may provide some diversification benefits but can also concentrate risk exposures; diversifying across strategies may create a more optimal portfolio
Alternative strategies are too risky for individual investors
Prudent allocations to hedge fund strategies in a diversified portfolio can help reduce volatility and help your clients stay invested
Hedge fund returns are solely attributed to manager skill
As sources of return are better understood, a significant portion of hedge fund returns can be systematically captured
For discussion and illustrative purposes only. Diversification does not guarantee investment returns and does not eliminate the risk of loss.

4 | FOR INSTITUTIONAL USE ONLY | NOT FOR PUBLIC DISTRIBUTION
Diversified Alternatives ETF is designed to capture key exposures and benefits of
hedge fund strategies
Exposure to 80% of
hedge fund universe
AUM through
systematic bottoms-up
approach
Broad
Core Solution to diversify
investors’ portfolio
Positive Return
THE FUND IS DESIGNED TO DELIVER FUND SEEKS TO PROVIDE
Diversification
Long/Short Exposure +
-
JPM Insights
For discussion and illustrative purposes only. Diversification does not guarantee investment returns and does not eliminate the risk of loss.
There are additional risks related to short exposure and active management. Please refer to the disclosure page for additional information.

5 | FOR INSTITUTIONAL USE ONLY | NOT FOR PUBLIC DISTRIBUTION
Fund is managed by an experienced team and pioneer in hedge fund beta investing
1 Years of Experience: Industry / JPM
As of March 31, 2016. There can be no assurance that the professionals currently employed by J.P. Morgan Asset Management will continue to be employed by J.P. Morgan Asset Management or that the
past performance or success of any such professional serves as an indicator of such professional's future performance or success.
Sources: Financial News ‘40 under 40’ (2015), Pensions & Investments (November 2012), Financial Times (April 2012), Nordic Region Pensions and Investments News (April 2012)
YAZANN ROMAHI, PHD, CFA
Managing Director
Global Head of Quantitative Research
Years of Experience: 17/131
LEAD PORTFOLIO MANAGER
Supported by team of 17 investment specialists on Multi-
Asset Solutions Quantitative Strategies and Research team
– 5 dedicated technologists
Researching and developing alternative beta philosophy
since 2005
Recognized as thought leaders in the space authoring many
papers and articles
Investing in alternative beta strategies since July 2009, with
>$3.6 billion in assets under management
PORTFOLIO MANAGEMENT TEAM HIGHLIGHTS
RECOGNITION
Dr. Romahi named in the Financial News ‘40 under 40’ Rising
Hedge Fund Stars List

6 | FOR INSTITUTIONAL USE ONLY | NOT FOR PUBLIC DISTRIBUTION
GLOBAL MACRO
EQUITY LONG SHORT
EVENT-DRIVEN STRATEGIES
Sub strategies
Merger arbitrage
Spinoff announcements
Activist following
Share buybacks
Post reorganization
Index reconstitution arbitrage
Diversified Alternatives ETF is uniquely positioned in the alternatives space
Source: JP Morgan Asset Management, as of June 30, 2016. Target Equity Beta in reference to MSCI World Index
For discussion and illustrative purposes only.
HEDGE FUND INDEX REPLICATION ALTERNATIVE BETA MULTI-MANAGER
Top-down approach that seeks to replicate the
historical performance of broad hedge fund
universe
Bottom-up approach to systematically build the
exposures to beta of various hedge fund styles
(80% of universe by AUM)
Allocates to a diversified set of hedge fund styles
through highly specialized sub advisors
More Quantitative More Qualitative
J.P. MORGAN DIVERSIFIED ALTERNATIVES ETF EMPLOYS A RULES BASED, BOTTOM UP SECURITY SELECTION PROCESS
J.P. MORGAN DIVERSIFIED ALTERNATIVES ETF
Sub strategies
Carry
Momentum
Sub strategies
Value Premium
Momentum
Quality
Size Premium
Target Equity Beta: 0.3

7 | FOR INSTITUTIONAL USE ONLY | NOT FOR PUBLIC DISTRIBUTION
Employs a multi-strategy construct to access different alternative strategy styles
The manger seeks to achieve the stated objectives. There can be no guarantee the objectives will be met.
EVENT-DRIVEN
Traditionally a core hedge fund style that
seeks to exploit mispricing related to
companies that are undergoing
significant corporate change
We focus on six sub-strategies: merger
arbitrage, spinoff announcements,
activist following, share buybacks, post
reorg and index reconstitution arbitrage
We seek to capture a significant portion
of the event-driven hedge fund style
using this systematic process
Alternative Beta Sub-Strategies
EQUITY LONG / SHORT
Attempts to capture four risk factors:
Momentum, Value, Size and Quality.
These factors form the backbone of
many quantitative and qualitative equity
products and drive many equity
investment philosophies
Portfolio constructed to have a beta of
0.3, across developed markets and be
sector neutral
Broad developed market universe (S&P
Developed BMI), with a portfolio of
approximately 350 long and 300 short
positions
GLOBAL MACRO BASED STRATEGIES
Seeks to capture exposure to carry and
momentum across fixed income, currency,
commodity and equity markets
Carry trades are across 6 developed bond
markets, G10 and 20 EM currencies, and
17 commodities (roll yield)
Time series momentum trades are across
6 developed bond markets, 11 developed
market equity indices and 17 commodities
Relative value momentum trades are made
in G10 currencies and 17 commodities

8 | FOR INSTITUTIONAL USE ONLY | NOT FOR PUBLIC DISTRIBUTION
How to allocate to alternatives
For discussion and illustrative purposes only . All investment decisions should be based on prevailing market conditions as well as individual investors’ facts and financial circumstances.
Diversification does not guarantee investment returns and does not eliminate the risk of loss.
2. REALLOCATE BASED ON DESIRED OUTCOME 1. TARGET 10-20% ALLOCATION
REDUCE EQUITY BETA
INCREASE DIVERSIFICATION
REDUCE INTEREST RATE RISK
75% from Equities
25% from Fixed Income
50% from Equities
50% from Fixed Income
25% from Equities
75% from Fixed Income
3. CREATE A MIX OF ALTERNATIVES
EQUITIES
40-60%
FIXED INCOME
40-60%
ALTERNATIVES
10-20%
EQUITY
ALTERNATIVES
Diversify long-only
equity holdings by
investing in equity
alternative strategies
CORE
DIVERSIFIERS
Diversify the overall
portfolio by investing in
diversified alternative
strategies
JPMORGAN
DIVERSIFIED
ALTERNATIVES ETF
FIXED INCOME
ALTERNATIVES
Diversify long-only fixed
income holdings by
investing in fixed
income alternative
strategies

9 | FOR INSTITUTIONAL USE ONLY | NOT FOR PUBLIC DISTRIBUTION
Appendix 1: Diversified Alternatives ETF Sub-Strategies

10 | FOR INSTITUTIONAL USE ONLY | NOT FOR PUBLIC DISTRIBUTION
Approximately 15% of all activist targets turn into merger transactions
Uses 13-D filings to track activist campaigns in an effort to capture abnormal returns unrelated to classical equity risk premia
SHAREHOLDER
ACTIVISM
Attempts to capture positive performance of parent company as value is unlocked through spinoff announcement. The source of the premium is the additional information released to the markets, which typically leads to a revaluation of the company
Long positions in all parent companies post-announcement to capture post-announcement price drift, closing just prior to record date
PARENTS AND
SPINOFFS
Attempts to capture the deal risk premium inherent in merger transactions
Invests in the target company of all merger deals globally, subject to a number of size and liquidity filters, while shorting the acquirer
MERGER
ARBITRAGE
Attempts to exploit outperformance of a company engaged in a share buyback program, which is generally driven by market underreaction in the reduction in the cost of capital
Long positions in stocks whose outstanding shares have been declining while hedging the beta using equity futures
SHARE
REPURCHASES
Index changes typically pre-announced to avoid market dislocation on effective date due to price pressure from beta trackers
Buy index additions at announcement and sell on effective date; compensation for liquidity provision to the market
EQUITY INDEX
ARBITRAGE
Companies emerging from bankruptcy exhibit risk of failure, low analyst coverage, unusual shareholder composition, and have the stigma of the former bankrupt entity despite often being restructured into a different company
Buy companies that have emerged from the Chapter 11 bankruptcy process to capture this set of unique risks
POST-
REORGANIZATION
EQUITY
EVENT DRIVEN Event-driven investing: systematic capture of underlying strategies
Source: J.P. Morgan Asset Management. For illustrative purposes only.

11 | FOR INSTITUTIONAL USE ONLY | NOT FOR PUBLIC DISTRIBUTION
Event-driven
Source: Factset, Bloomberg, J.P. Morgan Asset Management, January 31, 1993 through June 30, 2016.
For illustrative purposes only.
INDEX PERFORMANCE ANALYSIS RISK-RETURN PROFILE
Periods to June 30,
2016
HFRI Event-
Driven Index
MSCI World
Index
Total return 9.7% 6.2%
Risk 6.6% 14.8%
Maximum drawdown 24.8% 55.4%
Information ratio 1.47 0.42
Beta 0.34 0%
100%
200%
300%
400%
500%
600%
700%
800%
900%
1000%
Jan-93Jan-95Jan-97Jan-99Jan-01Jan-03Jan-05Jan-07Jan-09Jan-11Jan-13Jan-15
HFRI Event Driven Index
MSCI World Index
EVENT DRIVEN

12 | FOR INSTITUTIONAL USE ONLY | NOT FOR PUBLIC DISTRIBUTION
Equity long / short – diversified, systematic capture of risk premia
Source: J.P. Morgan Asset Management. For illustrative purposes only.
Return Driver: Behavioral bias
Strategy: (1) Long positions with decreasing accruals, short stocks with growing accruals (2) Long positions with low beta, shorts stocks with high beta
QUALITY
Return Driver: Behavioral bias
Strategy: (1) Long positive earnings revision stocks, short negative revision stocks (2) Buy stocks whose momentum is in the top decile while shorting those in the bottom decile
MOMENTUM
Return Driver: Risk premium
Strategy: Long “cheap” stocks, short “expensive” stocks (as measured by P/E, Div Yld etc)
These factors form the backbone of many quantitative and qualitative equity products and drive many equity investment philosophies
VALUE PREMIUM
Return Driver: Risk premium
Strategy: Buy small cap stocks, short large cap stocks SIZE PREMIUM
EQUITY LONG/SHORT
CAPTURING THE RISK PREMIA IN OUR EQUITY LONG / SHORT STRATEGY
Equity Long/Short strategies –low correlation to equity markets
Beta profile of 0.3 similar to the beta found across different equity long short strategies
8,500 companies in universe (S&P Broad Market Index), around 300-350 long and short companies in portfolio
Diversify idiosyncratic risk, includes mid and small cap exposure
Equally weighted minimum market cap USD 500m; Liquidity: Minimum 3mth average daily volume above USD 2m
Capital efficient investment, low turnover

13 | FOR INSTITUTIONAL USE ONLY | NOT FOR PUBLIC DISTRIBUTION
Equity long / short
Source: Factset, Bloomberg, J.P. Morgan Asset Management, January 31, 1993 through June 30, 2016.
For illustrative purposes only.
INDEX PERFORMANCE ANALYSIS
0%
100%
200%
300%
400%
500%
600%
700%
800%
900%
1000%
Jan-93Jan-95Jan-97Jan-99Jan-01Jan-03Jan-05Jan-07Jan-09Jan-11Jan-13Jan-15
HFRI Equity Hedge Index
MSCI World Index
RISK-RETURN PROFILE
Periods to June 30,
2016
HFRI Equity
Hedge Index
MSCI World
Index
Total return 9.8% 6.2%
Risk 8.9% 14.8%
Maximum drawdown 30.6% 55.4%
Information ratio 1.11 0.42
Beta 0.48
EQUITY LONG/SHORT

14 | FOR INSTITUTIONAL USE ONLY | NOT FOR PUBLIC DISTRIBUTION
Time Series Momentum - across fixed income, equity indices and commodities
– Momentum measured over 3, 6, and 12 months
– Universe of 10 developed market equity indices; 6 developed market bond indices and 17 commodities
Relative Value Momentum - across currency and commodities
– Developed market FX strategy
– Commodity momentum over 17 commodities using 12 month momentum
MOMENTUM
Fixed income – compensation for uncertainty around future interest rate paths and realized inflation
– Long the long end of steepest curves and short the long end of the flattest curves
– Long the highest carry bond markets and short the lowest carry bond markets
Currency – compensation for potential exchange rate devaluation / forward rate bias
– Long the highest yielding currencies and short the lowest yielding currencies across 10 developed and 20 emerging market currencies
Commodities – compensation for price risk transfer between hedgers (producers and consumers) and speculators
– Relative Roll Yield – long backwardated commodities and short those in contango across 17 commodities
CARRY
Capturing macro risk premia
Source: J.P. Morgan Asset Management. For illustrative purposes only.
CAPTURING THE MACRO RISK PREMIA IN OUR GLOBAL MACRO STRATEGY
Carry and momentum strategies across asset classes are uncorrelated
Within carry and within momentum, the strategies are also generally uncorrelated
The two fixed income carry strategies are negatively correlated
FX strategies exhibit the highest correlation within an asset class but are still diversifying to one another
Use both time series momentum and relative value momentum
GLOBAL MACRO

15 | FOR INSTITUTIONAL USE ONLY | NOT FOR PUBLIC DISTRIBUTION
Global macro
Source: Factset, Bloomberg, J.P. Morgan Asset Management, January 31, 1993 through June 30, 2016.
For illustrative purposes only.
INDEX PERFORMANCE ANALYSIS RISK-RETURN PROFILE
Periods to June 30,
2016
HFRI Macro
Index
MSCI World
Index
Total return 8.6% 6.2%
Risk 6.8% 14.8%
Maximum drawdown 10.7% 55.4%
Information ratio 1.27 0.42
Beta 0.16 0%
100%
200%
300%
400%
500%
600%
700%
800%
900%
1000%
Jan-93 Jan-95 Jan-97 Jan-99 Jan-01 Jan-03 Jan-05 Jan-07 Jan-09 Jan-11 Jan-13 Jan-15
HFRI Macro Index
MSCI World Index
GLOBAL MACRO

FOR INSTITUTIONAL USE ONLY | NOT FOR PUBLIC DISTRIBUTION
Appendix 2: Team Overview

17 | FOR INSTITUTIONAL USE ONLY | NOT FOR PUBLIC DISTRIBUTION
Quantitative strategies and research team
Source: J.P. Morgan Asset Management. As of March 31st 2016. There can be no assurance that the professionals currently employed by J.P. Morgan Asset Management will continue to be employed by
J.P. Morgan Asset Management or that the past performance or success of any such professional serves as an indicator of such professional's future performance or success.
JAMES ELLIOT
MULTI-ASSET SOLUTIONS, CIO INTERNATIONAL
Investment Director Review
Model Risk and Development
INDEPENDENT FUNCTIONS
JPMAM Risk Management
GIM SOLUTIONS - MASCOO
GIMS – MAS MIDDLE OFFICE
Katherine
Santiago
Kartik
Aiyar
Victor
Li
Jonathan
Msika
Joe
Staines
Albert
Chuang
YAZANN ROMAHI
GLOBAL HEAD OF ALTERNATIVE BETA AND QUANTITATIVE RESEARCH
QUANTITATIVE STRATEGIES AND RESEARCH
Steven
Wu
Yann
Vestring
Grace
Koo
Abdullah
Sheikh
Livia
Wu
David
Lu
GLOBAL RESEARCH TECHNOLOGY
Kai
Shen
Rafael
Forte
Kent
Zheng
Erkut
Gokan
Oleg
Mihailik
KEY INVESTMENT PARTNERS
John Bilton,
Head of Global
Multi-Asset Strategy
Antony Vallee,
Head of Convertible
Bond and Capital
Structure Team
Shrenick Shah,
Total Return
Portfolio Manager
Talib Sheikh,
Total Return
Portfolio Manager

18 | FOR INSTITUTIONAL USE ONLY | NOT FOR PUBLIC DISTRIBUTION
Key personnel
There can be no assurances that the professionals currently employed by JPMAM will continue to be employed by JPMAM or that the past performance or success of any such professional serves as an
indicator of such professional’s future performance or success.
YAZANN ROMAHI
Yazann Romahi, PhD, CFA, managing director, is the Head of Research and Quantitative Strategies in GIM - Multi Asset
Solutions. The Research and Quantitative Strategies Team is responsible for the quantitative models that help establish the
broad asset allocation reflected across Multi-Asset Solutions portfolios globally. In addition, Yazann and his team are
responsible for the design and portfolio management of the Alternative Beta suite of products. An employee since 2003, prior
to joining J.P.Morgan, Yazann worked as a research analyst at the Centre for Financial Research at the University of
Cambridge and undertook consulting assignments for a number of financial institutions including Pioneer Asset
Management, PricewaterhouseCoopers and HSBC. Yazann holds a PhD in Applied Mathematics from the University of
Cambridge and is a CFA charterholder.
VICTOR LI
Victor Li, PhD, CFA, vice president, is a portfolio manager for the Alternative Beta suite of products in the Quantitative
Portfolio Strategies team within Global Investment Management-Multi Asset Solutions based in London. He is a member of
the quantitative research team focused on quantitative asset allocation and global Multi-strategy. An employee since July
2010, Victor joined the firm after completing a PhD in Communications and Signal Processing at Imperial College London,
where he was also employed as a full time research assistant. Victor also obtained an MSc with Distinction in
Communications Engineering from the University of Manchester and a BEng in Information Engineering from the Beijing
Institute of Technology. He is a CFA charterholder.

19 | FOR INSTITUTIONAL USE ONLY | NOT FOR PUBLIC DISTRIBUTION
Glossary of terms
Normal backwardation is when the futures price is below the expected future spot price. This is desirable for speculators who are net long in their
positions; they want the futures price to increase. Thus, normal backwardation is when the futures price is increasing
Contango is when the futures price is above the expected future spot price. Because the futures price must converge on the expected future spot
price, contango implies that future prices are falling over time as new information brings them into line with the expected future spot price
Spot price is the current price at which a particular commodity, security or currency can be bought or sold at a specified time and place
The maximum drawdown is the largest percentage drawdown that has occurred in any investment data record from peak to trough
Beta is a measure of the volatility, or systematic risk, of a security or a portfolio in comparison to the market as a whole. Beta is calculated using
regression. A beta of one indicates that the security’s price will move in line with the market. A beta less than one means that the security will be
less volatile than the market. A beta greater than one indicates that the security’s price will be more volatile than the market
Alpha is the portion of an investment return arising from a specific (non-market) risk. It is an estimate of the amount of return expected from an
investment’s inherent values and is distinct from the amount of return caused by volatility, which is measured by beta
Volatility is the characteristic of a security, commodity or market to rise or fall sharply in price within a short-term period. A measure of the relative
volatility of a stock to the overall market is its beta
Carry refers to return obtained from an asset (if positive) or cost of holding an asset (if negative). Carry is usually associated with a currency carry
trade where an investor sells a certain low-yielding currency and uses the funds to buy a different currency yielding a higher interest rate. The
strategy attempts to capture the difference between the rates
Forward rate bias refers to tendency of currency markets to over-estimate changes in exchange rates, whereby actual movements tend to be
smaller than those implied by forward rates
Momentum investing is a strategy that aims to capture the continuation of existing trends in the market. Two different forms of momentum investing
include: 1) time series momentum, and 2) relative value momentum. Time series momentum refers to the potential asset pricing anomaly whereby
past returns of an investment instrument may be a positive predictor of its future return Relative value momentum refers to the potential asset
pricing anomaly whereby an investment instrument’s relative or cross-sectional returns may be a positive predictor of its future return
Information ratio is a ratio of excess portfolio returns (relative to benchmark) divided by the volatility of excess returns (relative to benchmark)
For illustrative and discussion purposes only.

20 | FOR INSTITUTIONAL USE ONLY | NOT FOR PUBLIC DISTRIBUTION
J.P. Morgan Asset Management
RISKS ASSOCIATED WITH INVESTING
Investing involves risk, including possible loss of principal. The price of equity securities may rise or fall because of changes in the broad market or changes in a company’s financial condition, sometimes
rapidly or unpredictably. These price movements may result from factors affecting individual companies, sectors or industries selected for the portfolio or the securities market as a whole, such as changes in
economic or political conditions. Investments in smaller companies may be riskier, more volatile and more vulnerable to economic, market and industry changes.
There is no guarantee that the use of long and short positions will succeed in limiting the Fund's exposure to domestic stock market movements, capitalization, sector-swings or other risk factors. Investment
in a portfolio involved in long and short selling may have higher portfolio turnover rates. This will likely result in additional tax consequences. Short selling involves certain risks, including additional costs
associated with covering short positions and a possibility of unlimited loss on certain short sale positions. The Securities and Exchange Commission (SEC) and financial industry regulatory authorities in
other countries may impose prohibitions, restrictions or other regulatory requirements on short sales, which could inhibit the ability of the adviser to enter into short sale transactions on behalf of the Fund.
Investments in bonds and other debt securities will change in value based on changes in interest rates. If rates rise, the value of these investments generally drops. Securities with greater interest rate
sensitivity and longer are subject to greater fluctuations in value. Credit risk is the risk of loss of principal or loss of a financial reward stemming from a borrower’s failure to repay a loan or otherwise meet a
contractual obligation.
International investing involves a greater degree of risk and increased volatility. Changes in currency exchange rates and differences in accounting and taxation policies outside the U.S. can raise or lower
returns. Also, some overseas markets may not be as politically and economically stable as the United States and other nations. Investments that are concentrated in a single country or region are subject to
the additional risk associated with a smaller number of issuers. International investing bears greater risk due to social, economic, regulatory and political instability in countries in "emerging markets." This
makes emerging market securities more volatile and less liquid developed market securities. Changes in exchange rates and differences in accounting and taxation policies outside the U.S. can also affect
returns.
Investing in alternative assets involves higher risks than traditional investments and is suitable only for sophisticated investors. Alternative investments involve greater risks than traditional investments and
should not be deemed a complete investment program. They are not tax efficient and an investor should consult with his/her tax advisor prior to investing. Alternative investments have higher fees than
traditional investments and they may also be highly leveraged and engage in speculative investment techniques, which can magnify the potential for investment loss or gain. The value of the investment may
fall as well as rise and investors may get back less than they invested.
The Fund will also employ various alternative investment strategies that involve the use of complicated investment techniques. There is no guarantee that these strategies will succeed and their use may
subject the Fund to greater volatility and loss. Alternative strategies involve complex securities transactions that involve risks in addition to those risks with direct investments in securities.
The Fund will invest in derivatives, including swaps, futures, options, and forward contracts, which may be riskier than other types of investments and may increase the volatility of the Fund. Derivatives may
be sensitive to changes in economic and market conditions and may create leverage, which could result in significant losses. Derivatives expose the Fund to counterparty risk, which is the risk that the
derivative counterparty will not fulfill its contractual obligations (and includes credit risk associated with the counterparty). Under normal market conditions, the adviser currently expects that a significant
portion of the Fund’s exposure will be attained through the use of derivatives. Investing in derivatives will result in a form of leverage, which may be significant. Leverage involves special risks. Derivatives
may not perform as expected, so the Fund may not realize the intended benefits. When used for hedging, the change in value of a derivative may not correlate as expected with the currency, security or
other risk being hedged. In addition, given their complexity, derivatives expose the Fund to risks of mispricing or improper valuation. The Fund may be more volatile than if the Fund had not been leveraged
because leverage tends to exaggerate the effect of any increase or decrease in the value of the Fund’s portfolio securities. The Fund cannot assure that the use of leverage will result in higher returns, and
using leverage could result in a net loss.
The Fund will likely engage in active and frequent trading leading to increased portfolio turnover, higher transaction costs, and the possibility of increased capital gains.
The Fund is actively managed and may not achieve its objective.
Diversification does not guarantee investment returns and does not eliminate the risk of loss.
ETF shares are bought and sold throughout the day on an exchange at market price (not NAV) through a brokerage account, and are not individually redeemed from the fund.

21 | FOR INSTITUTIONAL USE ONLY | NOT FOR PUBLIC DISTRIBUTION
J.P. Morgan Asset Management
Investors should carefully consider the investment objectives and risks as well as charges and expenses of the JPMorgan ETF before
investing. The prospectus contains this and other information about the ETF. Read the prospectus carefully before investing. Call
1-844-4JPM-ETF or visit www.jpmorganETFs.com to obtain a prospectus.
Opinions, estimates, forecasts, and statements of financial market trends that are based on current market conditions constitute our judgment and are
subject to change without notice. We believe the information provided here is reliable. These views and strategies described may not be suitable for all
investors. References to specific securities, asset classes and financial markets are for illustrative purposes only and are not intended to be, and
should not be interpreted as, recommendations. Past performance is no guarantee of future results.
There can be no assurance that the professionals currently employed by JPMAM will continue to be employed by JPMAM or that the past performance
or success of any such professional serves as an indicator of such professional’s future performance or success.
Any securities/portfolio holdings mentioned throughout the presentation are shown for illustrative purposes only and should not be interpreted as
recommendations to buy or sell. A full list of firm recommendations for the past year are available upon request.
Past performance does not guarantee future results. Total returns assumes reinvestment of any income. The deduction of an advisory fee reduces an
investor’s return. Actual account performance will vary on individual portfolio security selection and the applicable fee schedule. Fees are available
upon request.
Securities may be sold through J.P. Morgan Institutional Investments Inc., member FINRA/SIPC.
J.P. Morgan Asset Management is the marketing name for the asset management businesses of JPMorgan Chase & Co. Those businesses include,
but are not limited to, JPMorgan Chase Bank N.A., J.P. Morgan Investment Management Inc., Security Capital Research & Management Incorporated,
J.P. Morgan Alternative Asset Management, Inc., and J.P. Morgan Asset Management (Canada), Inc.
J.P. Morgan Funds ETF products are distributed by SEI Investments Distribution Co., which is not affiliated with J.P. Morgan Chase & Co. or any of its
affiliates.
Copyright 2016 JPMorgan Chase & Co. All rights reserved.