Gaurav Mishra Indian Chamber of Commerce Strategic Corporate Communications Summit 220809

Volume 2, Numbers 1 and 2 ISSN 1554-5393
JOURNAL OFSTRATEGIC E-COMMERCE
An official Journal of theAllied Academies, Inc.
David WyldCo-Editor
Southeastern Louisiana University
Randall SettoonCo-Editor
Southeastern Louisiana University
Academy Informationis published on the Allied Academies web page
www.alliedacademies.org
The Allied Academies, Inc. is a non-profit corporationchartered under the laws of North Carolina in the UnitedStates. The Academy is an association of scholars andpractitioners whose purpose is to advance the knowledge,understanding, and teaching of e-commerce and e-government throughout the world.
Whitney Press, Inc.
Printed by Whitney Press, Inc.PO Box 1064, Cullowhee, NC 28723
www.whitneypress.com

Authors provide the Academy with a publication permissionagreement. The Allied Academies is not responsible for thecontent of the individual manuscripts. Any omissions orerrors are the sole responsibility of the individual authors.The Editorial Board is responsible for the selection ofmanuscripts for publication from among those submitted forconsideration. The Editors accept final manuscripts in digitalform and the Publishers make adjustments solely for thepurposes of pagination and organization.
The Journal of Strategic E-Commerce is published by theAllied Academies, Inc., PO Box 2689, 145 Travis Road,Cullowhee, NC 28723, USA, (828) 293-9151, FAX (828)293-9407. Those interested in subscribing to the Journal,advertising in the Journal, or otherwise communicating withthe Journal, should contact the Executive Director [email protected].
Copyright 2004 by the Allied Academies, Inc., Cullowhee, NC, USA

iii
Journal of Strategic E-Commerce, Volume 2, Numbers 1 and 2, 2004
JOURNAL OFSTRATEGIC E-COMMERCE
Volume 2, Numbers 1 and 2

iv
Journal of Strategic E-Commerce, Volume 2, Numbers 1 and 2, 2004
JOURNAL OF STRATEGIC E-COMMERCE
CONTENTS OF VOLUME 2, NUMBER 1
LETTER FROM THE EDITORS . . . . . . . . . . . . . . . . . . . . . . . . . . . . . . vi
B2B E-COMMERCE AND SMALLBUSINESS EXPORTERS . . . . . . . . . . . . . . . . . . . . . . . . . . . . . . . 1Philip D. Olson, University of IdahoNewell Gough, Boise State University
CAN-SPAM ACT OF 2003: HOW TO SPAM LEGALLY . . . . . . . . . . 15John W. Yeargain, Southeastern Louisiana UniversityRandall P. Settoon, Southeastern Louisiana UniversitySandra E. McKay, Southeastern Louisiana University
ASSOCIATIONS BETWEEN E-BUSINESS MODELSAND THEIR BUSINESS PERFORMANCES . . . . . . . . . . . . . . 31Dae Ryong Kim, Delaware State UniversityHoe-Kyun Shin, Kumoh National Institute of Technology Jong-Chun Kim, Kumoh National Institute of Technology Sehwan Yoo, University of Maryland Eastern ShoreJongdae Jin, William Paterson University

v
Journal of Strategic E-Commerce, Volume 2, Numbers 1 and 2, 2004
JOURNAL OF STRATEGIC E-COMMERCE
CONTENTS OF VOLUME 2, NUMBER 2
ASSESSING CROSS-INDUSTRY EFFECTSOF B2B E-COMMERCE . . . . . . . . . . . . . . . . . . . . . . . . . . . . . . 51Uday M. Apte, Southern Methodist University Hiranya K. Nath, Sam Houston State University
A HYBRID WEB-CENTRIC AND PEER-TO-PEERARCHITECTURE FORCONSUMER-TO-CONSUMER E-COMMERCE . . . . . . . . . . . 81James Otto, Towson UniversityWilliam Wagner, Villanova UniversityVik Pant, Ixos Software, AG
A LONGITUDINAL ANALYSIS OF THE PRIVACYPOLICIES OF THE FORTUNE E-50 FIRMS . . . . . . . . . . . . . 101Harlan L. Etheridge, University of Louisiana at LafayetteKathy H. Y. Hsu, University of Louisiana at Lafayette

vi
Journal of Strategic E-Commerce, Volume 2, Numbers 1 and 2, 2004
LETTER FROM THE EDITORS
Welcome to the Journal of Strategic E-Commerce. We areextremely pleased to be able to present what we intend to become a primaryvehicle for communication of e-commerce issues throughout the world.
The Allied Academies is a non-profit association of scholars andpractitioners in entrepreneurship whose purpose is to encourage and supportthe advancement of knowledge, understanding and teaching of e-commercethroughout the world. The Journal of Strategic E-Commerce is a principalvehicle for achieving the objectives of the organization. The editorialmission of this journal is to publish empirical and theoretical manuscriptswhich advance the e-commerce initiatives. To learn more about theAcademy, its affiliates, and upcoming conferences, please check our website:www.alliedacademies.org. We look forward to having you share your workwith us.
David WyldRandall Settoon
Southeastern Louisiana University

vii
Journal of Strategic E-Commerce, Volume 2, Number 1, 2004
ARTICLES for Volume 2, Number 1

viii
Journal of Strategic E-Commerce, Volume 2, Number 1, 2004
ARTICLES for Volume 2, Number 1

1
Journal of Strategic E-Commerce, Volume 2, Number 1, 2004
B2B E-COMMERCE AND SMALLBUSINESS EXPORTERS
Philip D. Olson, University of IdahoNewell Gough, Boise State University
ABSTRACT
This paper focuses on B2B e-commerce use by small businessexporters. When a firm purchases products from or sells its products toother businesses over the Internet, it engages in B2B e-commerce. Thepurpose of this empirical study is to examine the following small businessInternet B2B topics: factors motivating Internet use, strategies, andperformance. To obtain information for the study, a sample of Idaho smallbusiness exporters was selected. Two key study results were observed. First,it appears that high levels of both collaborative pressure from businesspartners as well as perceived benefits of B2B e-commerce can be linked withhigh satisfaction of B2B performance. Second, it appears that high degreesof importance in B2B partnering with other domestic (but not foreign)businesses can also be linked with high satisfaction of B2B performance.
INTRODUCTION
E-commerce is a topic of high interest today. Businesses, both largeand small, began exploring the Internet's potential in the early 1990s after thefirst commercial provider of Internet dial-up access was launched. Prior tothis date, advances in information technology (IT) focused mainly onimproving the efficiency of individuals and operating departments "inside"a firm. Since the 1990s, IT has centered on building bridges between an

2
Journal of Strategic E-Commerce, Volume 2, Number 1, 2004
enterprise and key "outside" elements--i.e., between a business and otherbusinesses with which it conducts activities (B2B), and between a businessand its end users or consumers (B2C).
At the present time, much of what is written about e-commerce orcommercial activity over the Internet is in the popular press--e.g., Wall StreetJournal, Business Week, Computerworld, Ecommerce Times, etc. However,more and more texts are being written. In addition, research studies areincreasingly being conducted and published to help guide businesses as theyexplore Internet options. In the B2B e-commerce area, research hassharpened the focus on strategies (Cunningham, 2001; Haig, 2001; Iyer,G.R., 2002) and, in some cases, has tied strategies to performance (Connell,2000; Subramaniam & Shaw, 2002). Other B2B studies have examinedtechnical complexities that may affect both strategies and performance(Easton & Araujo, 2003; Hubbard, 2001; Kauffman, 2002).
The aim of this study is to help fill the gap in B2B scholarly studies.More specifically, the paper focuses on small businesses exporters thatrecently began B2B e-commerce activities. The study's purpose is toexamine for these firms the following B2B topics: motivation or triggerfactors, strategies, and performance. Hopefully, what is learned from thesefirms' experiences will be useful for other small exporters who arecontemplating what B2B e-commerce actions they can/should take.
Background information on e-commerce and B2B e-commerce,including a discussion of the motivation and strategy topics, is covered next.Sections on methodology, results and discussion, and the conclusion follow.
BACKGROUND
Some people associate e-commerce with Amazon.com. As such, theirdefinition of e-commerce is the exchange of retail goods and services forpayment over the Internet. But this view overlooks businesses working withother businesses. In its broadest sense, electronic commerce encompassesany commercial activity that takes place directly between a business, its

3
Journal of Strategic E-Commerce, Volume 2, Number 1, 2004
partners (e.g., suppliers, distributors), or its customers through a combinationof computing and communications technologies (Trepper, 2000).
According to Focazio (2001), there are four core e-commerceinteractive communications channels for a company:
Business to Business (B2B). The working relationship a companyhas with suppliers, vendors, business partners, and others. This is a trustedrelationship and frequently involves the transfer of products betweenbusinesses. Often, these channels are closed and protected. In the interactivespace, the channels are typically enabled through extranet projects.
Business to Consumer (B2C). The public interface a company haswith the consumer or end user. It includes marketing, advertising, servicebefore and after the sale, and the sales channel. In the interactive space, thesechannels are typically public Web sites and e-mail.
Consumer to Business (C2B). A relationship made practical bylarge-scale interactive technologies. In this situation consumers becomepotential customers through proactive means or as a result of a compensatedrelationship facilitated by a third party. An example of this channel would bethe request from a consumer to a business facilitated by Priceline.com.
Consumer to Consumer (C2C). As with the C2B communicationschannel, C2C is made practical by large-scale interactive technologies. Onesuch approach is where consumers directly influence other consumers'decisions via one-to-one communications such as e-mail and instantmessaging. Another C2C approach is where a third-party organizationleverages interactive communications technologies that enable a largenumber of people with similar likes or needs to communicate. An exampleof a C2C e-commerce business is eBay.
Of the four communication channels, those involving consumers-i.e.,B2C, C2B and C2C--are the most visible and familiar. This does not mean,however, that B2B e-commerce is less important. Consider the followingevidence. Gartner research group forecasts that global B2B e-commercesales will grow from USD 1.93 trillion in 2002 to USD 8.53 trillion in 2005.Further, a Gartner spokesman stated: "B2B has already outperformed initialexpectations and will continue to far surpass B2C e-commerce transactions"(Clark, 2002).

4
Journal of Strategic E-Commerce, Volume 2, Number 1, 2004
Included under B2B e-commerce is a broad spectrum of activities.Two sub-groups of the spectrum are operating resource activities and supplychain activities. Operating resources are the goods and services required tooperate a company. Included here are procuring computers, office suppliesand travel as well as maintaining and repairing buildings and equipment.These activities are all part of running a business. Managing these operatingresources is both costly and time consuming.
A supply chain is the business process used to produce and delivergoods and services. A product supply chain could include: raw materialproviders, part providers, manufacturers (assemblers), distributors, retailers,and consumers. These entities must work together in a coordinated fashionin order to deliver a product. Each product that is delivered must passthrough its supply chain entities and be acted on in some fashion. Managingthese activities can be a challenge for a business. Firms with internationalpartners may find the B2B communication channel helpful in reducingcommunication problems with its operating resource partners and its supplychain partners.
What motivates a firm's leaders to engage in B2B e-commerceactivities? Iacovou, Benbasat and Dexter (1995) suggest there are twofactors that can motivate/impact Internet use: external pressures andperceived benefits. Examples of external pressures are use of the Internet bycompetitors and customer demands; examples of perceived benefits areincreased productivity and reduced costs.
Competitive pressures can be a strong motivator. In a competitivemarket, a firm's leaders will often be incited to imitate its rivals becausestaying current with industry best practices can be associated with successfulperformance. One example of imitating (or copying) is benchmarking, atechnique associated with the total quality management movement.Benchmarking means identifying a rival who is best at something and thenduplicating the activity (Daft, 1998).
The perceived benefits associated with using a new idea/innovationcan also be a strong motivator for a firm's leaders. Adopting an innovationthat has the potential to increase productivity and reduce costs can help afirm create a competitive advantage over its rivals.

5
Journal of Strategic E-Commerce, Volume 2, Number 1, 2004
Motivation is an important topic because it has been linked to a firm'sperformance. More specifically, previous studies have suggested a positiverelationship exists between the motivation of a small firm's leaders and thefirm's performance (Olson, 1986; Olson & Bosserman, 1984). Based onthese arguments, one proposition in this study is: B2B e-commerceexporting firms with leaders who have a high motivation to use thistechnology (i.e., those with either high levels of external pressures orperceived benefits or both), versus those with leaders who have a lowmotivation, will generally report higher levels of satisfaction with their B2Bperformance.
Turn next to B2B e-commerce strategies an exporting firm can pursuewith its domestic and international partners. Some firms may develop B2BInternet connections with their "domestic" operating resource or supply chainpartners. Other companies could generate B2B connections with their"foreign" operating resource or supply chain partners. Even other firmscould develop B2B connections with both their domestic and foreignpartners. It would appear that an Internet communication channel would beparticularly attractive between an exporting firm and its international partnersbecause it can help overcome some of the distance barriers separating thecompanies.
Given these strategies, a second proposition in this study is: B2Be-commerce exporting firms which attach high degrees of strategicimportance to B2B links with their business partners, versus those whichattach low degrees of importance, will generally report higher levels ofsatisfaction with their B2B performance. This proposition is based on Covey,Merrill and Merrill's (1994) research. Their position is that a firm's importantactivities are those linked to the firm's goals; hence, important activities arethose that receive the highest levels of attention and resources. One goal ofa firm, in turn, is to achieve high performance. Hence, the link betweenimportance and performance, and the argument that firms which attach moreimportant to their B2B strategies will generally report higher satisfactionlevels with their B2B performance.

6
Journal of Strategic E-Commerce, Volume 2, Number 1, 2004
METHODOLOGY
To obtain information for this study, firms were selected from theIdaho International Trade Directory, 1999-2000. The directory lists Idahomanufacturers, distributors, retailers and service firms which sell bothdomestically and internationally. Further, to meet study requirements onlyfirms with less than 100 employees and those with at least one year B2Be-commerce experience were chosen.
Information about each business was gathered through a phoneinterview with the CEO or other knowledgeable person. Forty firms weresurveyed of which 22 were mainly manufacturers and 18 were mainly otherbusinesses (e.g., distributors, retailers and service firms).
The 40 interviewees were asked the following questions:
1. What motivated your firm's leader to implement B2B e-commerceactivities? (Please respond to the following three reasons using 1 forstrongly agree, 2 for agree, 3 for neutral, 4 for disagree, and 5 forstrongly disagree).
1 (a). Your rivals were using B2B e-commerce activities?1 (b). Your business partners (e.g., suppliers, distributors, retailers)
requested that you use the B2B electronic communicationchannel?
1 (c). You perceived B2B e-commerce benefits to outweigh thecosts?
2. How important for your firm are the following B2B e-commercestrategies (or ways your firm uses this technology)? (Please respondto the following two strategies using 1 for important, 2 for somewhatimportant, 3 for neutral, 4 for somewhat not important, and 5 for notimportant).
2 (a). Partnering with other "domestic" businesses with whom youwork (either operating resource or supply chain partners)?

7
Journal of Strategic E-Commerce, Volume 2, Number 1, 2004
2 (b). Partnering with other "foreign" businesses with whom youwork (either operating resource or supply chain partners)?
3. What is your attitude towards, or degree of satisfaction with, yourfirm's B2B e-commerce performance? (Use the following scale: 1 forexceedingly above expectations, 2 for somewhat above expectations,3 for meeting expectations, 4 for somewhat below expectations, and5 for exceedingly below expectations.)
RESULTS AND DISCUSSION
Results concerning the first motivation-performance relationship arepresented in Table 1. More specifically, it focuses on the degree to whichrivals incited or "pushed" firms into B2B e-commerce. Using a clusteringprocedure, the 40 observations of the index were grouped into twocategories, those with lower versus higher values. A non-parametricprocedure, the Mann-Whitney U test, was utilized to test the relationship.The statistics in Table 1 reveal that there is no significant (.238) differencein satisfaction with B2B performance between the group of exporting firmsmost motivated to compete with, and imitate, their rivals in B2Be-commerce, versus those firms with lower motivation. This result can beinterpreted to mean that pressure from rivals to engage in B2B e-commercedoes not appear to impact an exporting firm's satisfaction with its B2Bperformance.
Table 2 contains information on another motivation-performancerelationship. The specific motivation issue is the degree to which a firm'sbusiness partners requested that it use B2B e-commerce. Using the sameclustering procedure and statistical test, results in Table 2 indicate that thegroup of firms most motivated to respond to their business partners requestswere also significantly (.034) more satisfied with their performance. A highdegree of pressure (or push) from an exporting firm's business partners, then,appears to impact the firm's satisfaction with its B2B performance. Note thatpressure from a business partner when compared to a rival is a different type

8
Journal of Strategic E-Commerce, Volume 2, Number 1, 2004
of force for a firm. The former is "collaborative" while the latter is"competitive."
Table 1: B2B E-Commerce Motivation (Measured by Degree toWhich Rivals Pushed a Firm) and Performance Satisfaction Results
Motivation Performance Mean Rank*n
Stronger levels(indicated by lower scores) 18.11 27
Weaker levels(indicated by higher scores) 22.91 11
U = 111.00
significance = .238
*Lower values indicate higher performance satisfaction
Table 2: B2B E-Commerce Motivation (Measured by Degree toWhich Business Partners Requested Firm to Participate) and Performance
Satisfaction Results
Motivation Performance Mean Rank* n
Stronger levels(indicated by lower scores) 14.65 23
Weaker levels(indicated by higher scores) 22.40 10
U = 61.00
significance = .034
*Lower values indicate higher performance satisfaction

9
Journal of Strategic E-Commerce, Volume 2, Number 1, 2004
Table 3 contains information on the third motivation-performancerelationship. The motivation question covered here concerns the degree towhich a firm perceived B2B e-commerce benefits to outweigh the costs.Again, using the prior clustering procedure and statistical test, results inTable 3 indicate a significant (.038) relationship. In this case, exportingfirms that perceived, to a high degree, B2B benefits to outweigh the costsalso were more satisfied with their B2B performance. To summarizemotivation issues, it appears that high levels of both collaborative pressurefrom business partners as well as perceived benefits of B2B e-commerce canbe linked with high satisfaction of B2B performance.
Table 3: B2B E-Commerce Motivation (Measured by Degree toWhich a Firm perceived B2B Benefits to Outweigh the Cost) and Performance
Satisfaction Results
Motivation Performance Mean Rank* n
Stronger levels(indicated by lower scores) 16.80 25
Weaker levels(indicated by higher scores) 24.69 13
U = 95.00
significance = .038
*Lower values indicate higher performance satisfaction
Table 4 displays the first strategy-performance relationship. Theparticular strategy covered here is the importance of B2B partnering withother "domestic" businesses with whom a firm works. After the clusteringprocedure, the Mann-Whitney U test reveals an significant (.003) difference.In other words, firms that perceived high degrees of importance in B2Bpartnering with other domestic businesses, versus those holding lower

10
Journal of Strategic E-Commerce, Volume 2, Number 1, 2004
degrees of importance in B2B partnering, also were more satisfied with theirB2B performance.
Table 4: B2B E-Commerce Strategy (Partnering With Othe Domestic Businesses
With Whom You Work) and Performance Satisfaction Results
Strategy Importance Performance MeanRank*
n
Higher levels(indicated by lower scores) 12.58 18
Lower levels(indicated by higher scores) 22.30 15
U = 55.50
significance = .003
*Lower values indicate higher performance satisfaction
The second strategy-performance relationship, that of the importanceof B2B partnering with other "foreign" businesses and its linkage toperformance satisfaction, is examined in Table 5. The test result was notsignificant (.064). Hence, no difference in satisfaction with B2Bperformance was found between firms that perceived high degrees ofimportance in B2B partnering with other foreign businesses versus and thosethat perceived low degrees of importance in B2B partnering.
Originally it was thought that firms reporting high importance orinterest in B2B partnering with foreign businesses would be those reportinghigh B2B performance satisfaction, because B2B transactions can helpreduce communication costs. Different reasons can be used to argue why thisresult did not occur. First, some firms had limited experiences with B2Be-commerce, only one year. Hence, they might not have been able to observepositive B2B performance outcomes yet. In addition, to further analyze the

11
Journal of Strategic E-Commerce, Volume 2, Number 1, 2004
foreign partner and performance relationship (in a post hoc sense), it wasthought that manufacturing firms using B2B e-commerce might haveresponded differently than other firms (e.g., retail and service firms). Toexamine this position, the sample was split into two sets, manufacturingversus other firms. Interestingly, a significant relationship was found formanufacturing firms. Hence, future research should be directed in this area.
Table 5: B2B E-Commerce Strategy (Partnering With Other Foreign BusinessesWith Whom You Work) and Performance Satisfaction Results
Strategy Importance Performance MeanRank*
n
Higher levels(indicated by lower scores) 16.48 21
Lower levels(indicated by higher scores) 23.24 17
U = 115.00
significance = .064
*Lower values indicate higher performance satisfaction
CONCLUSION
The current study has several limitations. First, the exporting firmssampled in the survey were all from Idaho. Second, questions about, anddescriptions of, B2B e-commerce are open to misinterpretation. Further, inthis study both types of B2B partners for a firm (operating resource andsupply chain partners) were not treated separately in the survey motivation,strategy, and performance questions. In future studies, researchers coulddevelop separate questions about these partner types to ask interviewees.Although these limitations exist, the results of this study should stimulatefuture B2B e-commerce research.

12
Journal of Strategic E-Commerce, Volume 2, Number 1, 2004
In terms of information from this study for small business exporters,two general conclusions can be drawn concerning the B2B motivation,strategy, and performance topics. First, it appears that high levels of bothcollaborative pressure from business partners as well as perceived benefitsof B2B e-commerce can be linked with high satisfaction of B2Bperformance. Second, it appears that high degrees of importance in B2Bpartnering with other domestic (but not foreign) businesses can also be linkedwith high satisfaction of B2B performance.
REFERENCES
Covey, S.R., A.R. Merrill & R.R. Merrill (1994). First things first. New York: Simon &Schuster.
Clark, M. (2002). B2B e-commerce sales to skyrocket. Retrieved May 8, 2002 fromhttp://www.electricnews.net/news.html
Cunningham, M.J. (2001). B2B: How to build a profitable e-commerce strategy.Cambridge, MA: Perseus Publishing.
Daft, R.L. (2001). Organization theory (Seventh Edition). Cincinnati, OH: South-WesternPublishing.
Easton, G. & L. Araujo (2003). Evaluating the impact of B2B e-commerce: A contingentapproach. Industrial Marketing Management, 32(5), 431- 440.
Focazio, M.T. (2001). The e-factor: Building a 24/7, customer centric, electronic businessfor the internet age. New York: AMACOM.
Haig, M. (2001). The B2B e-commerce handbook. London: Kogan Page, Limited.
Hubbard, K. (2001). B2B e-commerce (working paper series, report no. 01- 104).Marketing Science Institute.
Iacovou, C.L., I.W. Benbasat & A.S. Dexter (1995). Electronic data interchange and smallorganizations: Adoption and impact of technology. MIS Quarterly, 19(4), 465-485.

13
Journal of Strategic E-Commerce, Volume 2, Number 1, 2004
Iyer, G.R. (2002). B2B e-commerce: Economy and strategies. Journal ofBusiness-to-Business Marketing, 9(1), 77-93.
Kauffman, R.J. (2002). B2B e-commerce revisited: Leading perspectives on the key issuesand research directions. Electronic Markets, 12(2), 67-84.
O'Connell, B. (2000). B2B com: Cashing in on the business-to-business e -commercebonanza. Holbrook, MA: Adams Media.
Olson, P.D. (1986). Entrepreneurs: Opportunistic decision makers. Journal of SmallBusiness Management, 24(3), 29-35.
Olson, P.D. & D.A. Bosserman (1984). Attributes of the entrepreneurial type. BusinessHorizons 27(3), 53-56.
Subramaniam, C. & M.J. Shaw (2002). A study of the value and impact of B2Be-commerce: The case of web-based procurement. International Journal ofElectronic Commerce, 6(4), 19-41.
Trepper, C. (2000). E-commerce strategies: Mapping your organization's success in today'scompetitive marketplace. Redmond, WA: Microsoft Press.

14
Journal of Strategic E-Commerce, Volume 2, Number 1, 2004

15
Journal of Strategic E-Commerce, Volume 2, Number 1, 2004
CAN-SPAM ACT OF 2003: HOW TO SPAM LEGALLY
John W. Yeargain, Southeastern Louisiana UniversityRandall P. Settoon, Southeastern Louisiana UniversitySandra E. McKay, Southeastern Louisiana University
ABSTRACT
With the growing use of the Internet for unsolicited commercialelectronic mail (spam), many individuals and businesses are complainingabout the time and effort necessary to delete such material from personal andbusiness computers. Although filtering has been tried, it seems the sendersof such unwanted mail have found ways around such blocks. To attempt tomeet the growing demand for a legal method to control and discourage theunwelcome growth of unsolicited email, bills were introduced in both theHouse of Representatives and the Senate of the United States to try toregulate such activities. This paper will examine the Can-Spam Act of 2003and point out its salient features, which include requirements to send legalspam. It will also discuss the futility of this act in attempting to stopunwanted spam.
INTRODUCTION
Spam is becoming a growing source of concern among legitimateelectronic marketers, businesses, and individuals. A study released in 2003found that spam costs United States corporations $8.9 billion dollars peryear, European businesses $2.5 billion per year, and United States andEuropean service providers $500 million per year (Associated Press, 2003).

16
Journal of Strategic E-Commerce, Volume 2, Number 1, 2004
A New York consulting firm Basex blamed unsolicited e-mail for nearly $20billion in lost time and expenses worldwide (Lyman, 2003). Spam within anorganization can cost between $600 and $1,000 per year in lost productivityfor every user. Another study found that spam costs companies $874 peremployee per year in lost productivity (Roberts, 2003). The study releasedby Nucleus Research contains interviews of IT administrators at 76 differentUS companies. The $874 figure is based on a pay rate of $30 per hour anda work year of 2,080 hours. Findings of the study include:
‚ Companies lose approximately 1.4% of each employee's productively eachyear because of spam.
‚ The average employee receives 13.3 spam messages each day. ‚ Employees spend, on average, 6.5 minutes a day managing spam.
Table 1 shows current estimates of the volume of email messagesfrom reputable sources such as Google, Brightmail, Jupiter Research,eMarketer, Gartner, MailShell, Harris Interactive, and Ferris Research. Asseen in the table, nearly 31 billion emails are sent daily, 56 emails sent dailyper email address, at a cost of $255 million to all Internet users
Table 1: Volume of Email Messages
Category Email Statistics
Daily emails sent 31 billion
Daily emails sent per email address 56
Daily emails sent per person 174
Daily emails sent per corporate user 34
Daily emails received per person 10
Email addresses per person 3.1 average
Cost to all Internet Users $255 million

17
Journal of Strategic E-Commerce, Volume 2, Number 1, 2004
Due to the volume of email daily, it is reasonable to expect thatclogged e-mail systems due to spam have also been listed as a major cost forInternet access providers and businesses. Annual spam received per personhas been estimated to be 2,200 with 12.4 billion spam emails sent daily.Spam currently accounts for about 60 percent of all email activity, which isan increase of over 30 percent since 2001. Through its Logistics andOperations Center, Brightmail.com, an anti-spam software company, hastracked the percentage of total Internet email identified as spam since March2003. The data is shown in Table 2.
Table 2: Percentage of Email Identified as Spam
Month Percentage
February 2004 62%
January 2004 60%
December 2003 58%
November 2003 56%
October 2003 52%
September 2003 54%
August 2003 50%
July 2003 50%
June 2003 49%
May 2003 48%
April 2003 46%
March 2003 45%
As seen in the Table 2, the percentage of spam emails has grown bynearly 40% since March 2003. To shed light on spam email received per

18
Journal of Strategic E-Commerce, Volume 2, Number 1, 2004
person, SpamLinks.net created a Hotmail account in September 2001 andtracked the spam received per month for a year. The data is shown in Table3 and reflects the tremendous growth in spam from 2001 to 2002.
Table 3: Spam Received on Hotmail Account
Month Number
September 2002 1262
August 2002 1174
July 2002 899
June 2002 846
May 2002 1023
April 2002 753
March 2002 795
February 2002 546
January 2002 355
December 2001 392
November 2001 337
October 2001 318
September 2001 167
Unsolicited commercial electronic mail poses network securityproblems to government and businesses via viruses and worms. Theincreasing amount of spam has resulted in a decline in consumer trust oflegitimate email marketers. (Findings, Reduction in Distribution of SpamAct, 2003). The receipt of spam results in costs to receivers who cannot

19
Journal of Strategic E-Commerce, Volume 2, Number 1, 2004
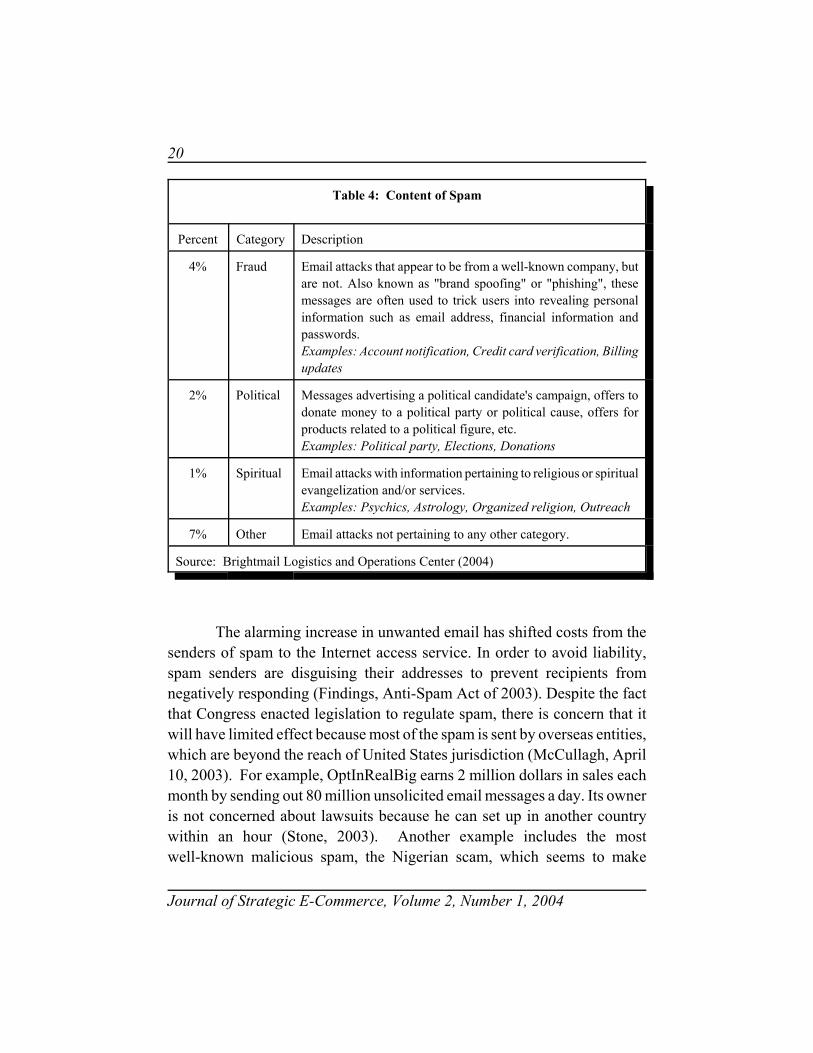
refuse to accept such mail, incur costs for storage, and for accessing,reviewing, and discarding such items. As seen in Table 4, the content ofspam is varied, with spam related to advertising products garnering 24percent of the total.
Table 4: Content of Spam
Percent Category Description
24% Products Email attacks offering or advertising general goods and services.Examples: Devices, Investigation services, Clothing, Makeup
18% Financial Email attacks that contain references or offers related to money,the stock market or other financial "opportunities."Examples: Investments, Credit Reports, Real Estate, Loans
14% Adult Email attacks containing or referring to products or servicesintended for persons above the age of 18, often offensive orinappropriate.Examples: Porn, Personal Ads, Relationship Advice
11% Scams Email attacks recognized as fraudulent, intentionally misguiding,or known to result in fraudulent activity on the part of the sender.Examples: Nigerian Investment, Pyramid Schemes, ChainLetters
7% Health Email attacks offering or advertising health-related products andServices.Examples: Pharmaceuticals, Medical treatments, Herbalremedies
6% Internet Email attacks specifically offering or advertising Internet orcomputer related goods and services.Examples: Web hosting, Web design, Spamware
6% Leisure Email attacks offering or advertising prizes, awards, ordiscounted leisure activities.Examples: Vacation offers, Online casinos, Games
20
Table 4: Content of Spam
Percent Category Description
Journal of Strategic E-Commerce, Volume 2, Number 1, 2004
4% Fraud Email attacks that appear to be from a well-known company, butare not. Also known as "brand spoofing" or "phishing", thesemessages are often used to trick users into revealing personalinformation such as email address, financial information andpasswords.Examples: Account notification, Credit card verification, Billingupdates
2% Political Messages advertising a political candidate's campaign, offers todonate money to a political party or political cause, offers forproducts related to a political figure, etc.Examples: Political party, Elections, Donations
1% Spiritual Email attacks with information pertaining to religious or spiritualevangelization and/or services.Examples: Psychics, Astrology, Organized religion, Outreach
7% Other Email attacks not pertaining to any other category.
Source: Brightmail Logistics and Operations Center (2004)
The alarming increase in unwanted email has shifted costs from thesenders of spam to the Internet access service. In order to avoid liability,spam senders are disguising their addresses to prevent recipients fromnegatively responding (Findings, Anti-Spam Act of 2003). Despite the factthat Congress enacted legislation to regulate spam, there is concern that itwill have limited effect because most of the spam is sent by overseas entities,which are beyond the reach of United States jurisdiction (McCullagh, April10, 2003). For example, OptInRealBig earns 2 million dollars in sales eachmonth by sending out 80 million unsolicited email messages a day. Its owneris not concerned about lawsuits because he can set up in another countrywithin an hour (Stone, 2003). Another example includes the mostwell-known malicious spam, the Nigerian scam, which seems to make

21
Journal of Strategic E-Commerce, Volume 2, Number 1, 2004
particular victims of Americans (Wagner, 2002). A report by the U.K.National Criminal Intelligence Service stated that as many as five Americansper day have been seen waiting in London hotel lobbies to meet peopleconnected with the scam. MessageLabs predicted Nigerian scam operationswill gross more than $2 billion in 2003.
PROPOSALS
There were two bills in the Senate, two in the House, plus proposalsfrom the Federal Trade Commission to strengthen the ability of the federalgovernment to discourage spam both by civil and criminal penalties. In theSenate, both bills had powerful bi-partisan supporters. The Can-Spam Actwas sponsored by Senators Conrad Burns, R-Mont., and Ron Wyden, D-Ore.,who serve on the Commerce Committee. The Criminal Spam Act (CSA) wassponsored by Senators Oren Hatch, R-Ut., and Patrick Leahy, D-Vt., whoserve on the Judiciary Committee. Both Microsoft and Yahoo supported theCan-Spam bill (McCullagh, D. June 19, 2003). The Can-Spam Act sought toregulate interstate commerce by imposing limitations and penalties on thesending of unsolicited commercial email via the Internet. It gives authorityto the Federal Trade Commission (FTC) to enforce its provisions withappropriate regulations. It declares criminal the sending of spam withfraudulent routing information and proposes a fine or imprisonment for notmore than 1 year, or both. The use of deceptive subject headings isprohibited. There must be a method for the recipient to opt-out of receivingfurther spam from the sender which the sender has 10 business days withwhich to comply. The sender must include in its message a physical postaladdress. The attorneys-general of the states may enforce the provisions ofthis act in federal district court in their respective states. The damages maybe multiplied by $10 per each separately addressed message with a cap of$500,000, unless the court finds the sender knowingly committed the acts, inwhich case the court may increase damages up to $1.5 million. Attorney feesmay also be assessed if the state is successful in its civil action against thespam sender. The Criminal Spam Act (CSA) would punish repeat spammers

22
Journal of Strategic E-Commerce, Volume 2, Number 1, 2004
with a maximum of 5 years in federal prison and fines up to $25,000 per day.Can-Spam would jail first offenders with up to 3 years and repeat offenderswith up to five year terms. The Senate Commerce Committee approved theCan-Spam Act with the provisions that the FTC and Internet serviceproviders could sue spammers who use false email headers, or do not letrecipients opt-out, or send spam to email addresses obtained by crawling theweb (McCullagh, June 19, 2003).
The two main House bills in play for controlling spam were theAnti-Spam Act sponsored by 33 Democrats and 20 Republicans and theReduction in Distribution of Spam Act (RID Spam) sponsored by 19Republicans and 2 Democrats. The main difference between the two billswas a political one. The Anti-Spam Act would permit class action lawsuitswhereas the RID Spam Act expressly prohibited such suits. Trial lawyersfavor class action suits and heavily contribute to Democratic candidates. ACommon Cause study of the 2000 elections estimated that trial lawyersfavored the Democratic Party over the Republican Party by a 40-1 margin forsoft money contributions. Since the RID Spam act was sponsored by twoRepublican committee chairmen, Energy and Commerce - Billy Tauzin andJudiciary - James Sensenbrenner, who control the two committees to whichanti-spam legislation was assigned, this was the bill that was favored to makeit out of the House. This proposal included criminal sanctions for spammerswho use fraudulent headers or send unlabeled pornographic solicitations, butit did not give the FTC as much authority as the Anti-Spam Act. Both billspermitted spammers to send unsolicited bulk email provided an opt-outprovision was included. Some critics have noted that this permits emailmarketers to send spam until the recipient opts-out. So, some liberalDemocrats are proposing an opt-in requirement, which is opposed bylegitimate commercial marketers, that would forbid any unsolicitedcommercial email unless a prior business relationship exists (McCullagh,July 9, 2003). This opt-in requirement has been ruled by the Supreme Courtin other cases to be an unconstitutional First Amendment violation whereasthe court has approved of less intrusive ways to protect privacy such asposting "No Solicitors or Peddlers Invited" (Schaumburg, 1980). This is whythe court will probably uphold the federal Do Not Call statute.

23
Journal of Strategic E-Commerce, Volume 2, Number 1, 2004
Some legislators attempted to broaden these proposals to includeunsolicited marketing messages sent to wireless devices and cell phonesusing means other than email. This expansion of coverage of the acts wouldnecessitate more time in committee for study, testimony, etc. All of theproposed bills exempted from regulation any type of spam from politicians,charitable, religious or nonprofit organizations (McCullagh, July 9).
RESULT
On October 22, 2003, the Senate voted 97-0 to approve the Can-SpamAct (Bridis, 2003). When it reached the House of Representatives it wasreferred to Representative Tauzin's Energy and Commerce Committee. Inshort order, it emerged from his committee with amendments that attachedthe features of his RID Spam bill to the Can-Spam bill. The House voted392-5 in favor of the bill as amended ( Thomas, 2003), and the Senateconcurred. President Bush signed the bill into law on December 16, 2003. Itbecame effective January 1, 2004.
As enacted the Controlling the Assault of Non-Solicited Pornographyand Marketing Act of 2003 or Can-Spam Act of 2003 provides for criminalpenalties of up to five years imprisonment for previous convictions underfederal or state law involving multiple commercial electronic mail messagesor unauthorized access to a computer system. A fine or imprisonment for upto three years, or both, would be assessed for those convicted of obtaining 20or more falsified email account registrations, or 10 or more falsified domainname registrations; and the volume of email messages exceeded 2,500 in any24-hour period, 25,000 during any 30-day period, or 250,000 during any1-year period. The offender would also forfeit any proceeds, property, orequipment obtained from such offense (Can-Spam Act, Section 4).
Section 5 of the Act (15 U.S.C. 7704) prohibits the transmission offalse or misleading information. Thus, header information which includes adomain name or Internet Protocol address which was obtained by falserepresentations is materially misleading. Subject headings which aredeceptive as defined by the Federal Trade Commission Act are prohibited.

24
Journal of Strategic E-Commerce, Volume 2, Number 1, 2004
There must be a return address which enables the recipient of commercialemail to submit a request not to receive future messages from the sender.This is the opt-out provision. Once the sender receives the opt-out message,it has 10 business days to act upon the request. The sender may not sell,lease, or transfer the addresses of those recipients who have opted out of itscommercial email messages. All commercial email messages must containclear and conspicuous notice that they are advertisements, an opt-outprovision, and a valid physical postal address of the sender. It is illegal fora sender of commercial email to obtain recipient email addresses byautomated means from an Internet web site or proprietary online servicebelonging to another person who includes a notice stating that it does not sellor lease its addresses to others for use in sending email messages. The FTCis given the authority to modify the 10-business day period if it deems itnecessary for good faith compliance with the opt-out provision bycommercial senders. Senders of sexually oriented material are required toinclude in the subject heading notices required by the FTC. No warning isnecessary if the recipient has given prior consent to receive such material.The FTC in consultation with the Attorney-General has 120 days fromJanuary 1, 2004, to issue marks or notices to be included in sexually explicitcommercial email. These notices will be published in the Federal Register.Thereafter, anyone who knowingly violates this standard shall be fined orimprisoned for up to 5 years or both.
Section 6 of the act (15 U.S.C. 7705) forbids businesses to sendcommercial email with false or misleading transmission informationknowingly through a third party. It is assumed that the business knew of thewrongful intentions of the sender if the business owns a 50 percent or greaterinterest in the person that violated this section.
Section 7 (15 U.S.C. 7706) defines violations of this act as unfair anddeceptive practices and authorizes the FTC to enforce violations as if theyhad occurred under the Federal Trade Commission Act (15 U.S.C. 57). Otherfederal agencies are given authority to enforce these provisions overcommercial email senders under their respective jurisdictions. So, nationalbanks are regulated by the Office of the Comptroller of the Currency; savingsassociations by the Director of the Office of Thrift Supervision; federal credit

25
Journal of Strategic E-Commerce, Volume 2, Number 1, 2004
unions by the Board of the National Credit Union Administration; brokersand dealers of securities by the Securities and Exchange Commission;insurance companies by state insurance authority; air carriers by theSecretary of Transportation; radio and television stations by the FederalCommunications Commission. The FTC may use its usual powers againstthose who violate this act. Thus, it may issue cease and desist orders andinjunctions without having to prove intent of the party charged with aviolation. The attorney general of a state may bring a civil action on behalfof the state's citizens in a federal district court in the state. The damages shallbe determined by multiplying the number of violations ( each separatelyaddressed message received by a state resident) to a maximum of $250. Themaximum fine cannot exceed 2 million dollars unless the court findsaggravating circumstances, such as willful violation, in which case thedamages may be increased to up to three times the damages. The court mayalso award attorney fees to the state for a successful action. However, beforethe state attorney general can bring an action he must notify the FTC orappropriate federal agency. The FTC shall have the right to intervene and toremove the action to another United States district court. If there is an FTCaction currently before the court, the state attorney general may not bring anaction against a defendant already named in the FTC action. Internet accessproviders may also bring actions against those who violate section 5 (15U.S.C. 7704) of this act to enjoin further violations and recover damages upto $100 per each separate address transmitted over its facilities. The courtmay also find aggravating circumstances and increase the damage award upto three times. Attorney fees may also be recovered by the successful Internetaccess provider.
Section 8 (15 U.S.C. 7707) exercises the doctrine of preemption. Itspecifically states that the Can-Spam Act supersedes any state statute orregulation covering commercial email.
Section 9 (15 U.S.C. 7709) orders the FTC to report back to Congresswithin two years regarding the effectiveness and enforcement of theCan-Spam Act and to make recommendations for any modifications. TheCongress specifically wants the report to address changes in devices throughwhich consumers receive email, how to handle commercial email that

26
Journal of Strategic E-Commerce, Volume 2, Number 1, 2004
originates in other nations, and options for protecting children from obsceneemail.
Section 10 (15 U.S.C. 7710) orders the FTC to send to the Congresswithin 9 months from date of enactment (December 16, 2003) a report thatsets out a method for rewarding those persons who give information aboutviolations of the act. The reward should be not less than 20 percent of thecivil penalty to the person who identifies the wrongdoer and suppliesinformation that leads to the successful collection of a civil penalty by theFTC. Also, within 18 months the FTC shall report to Congress a plan forrequiring commercial email to be identified from its subject line by means ofcompliance with Internet Engineering Task Force Standards the use of thecharacters "ADV"(advertisement) in the subject line or other comparableidentifier.
Section 11 (15 U.S.C. 7711) authorizes the FTC to issue regulationsto implement the act. However, the FTC is not authorized under section5(a)(5)(A) covering identification of advertisement, opt-out provision, andphysical postal address of sender to include any specific words, characters,marks, or labels in commercial email or to specify any particular part of themessage to include such requirements, e.g., subject line or body.
Section 12 (15 U.S.C. 7712) orders the Federal CommunicationsCommission (FCC) in consultation with the FTC to issue rules within 270days to protect consumers from unwanted mobile service commercialmessages. The FCC shall give subscribers of commercial mobile services away to avoid receiving commercial messages unless the subscriber has givenprior authorization to the sender; allow subscribers to indicate via theirmobile service a desire not to receive future commercial messages from thesender; or allow subscribers to opt-out at time of subscribing and in anybilling.
CONCLUSION
By its exercise of the preemption doctrine in the Can-Spam Act thefederal act nullified state statutes which sought to control spam in some

27
Journal of Strategic E-Commerce, Volume 2, Number 1, 2004
individual states. The states which had passed spam acts were Alaska,Arizona, Arkansas, California, Colorado, Connecticut, Delaware, Florida,Idaho, Illinois, Indiana, Iowa, Kansas, Kentucky, Louisiana, Maine,Maryland, Michigan, Missouri, Nevada, New Mexico, North Carolina, NorthDakota, Ohio, Oklahoma, Oregon, Pennsylvania, Rhode Island, SouthDakota, Tennessee, Texas, Utah, Virginia, Washington, West Virginia,Wisconsin, and Wyoming. These states which had mandated "ADV" on thesubject line must now wait for the FTC to publish its regulations( Spamlaws).
The Can-Spam Act has legalized unsolicited commercial email byspecifying five rules for spammers to follow. First, one may not use false ofmisleading transmission information, but can use a corporate address.Second, the subject line and content should not mislead the recipient aboutthe purpose or objective of the message. Third, a return address must beincluded. It must remain valid for 30 days from date of transmission. Thisaddress should be where the recipient's reply would go. Fourth, if therecipient replies with an opt-out request, the sender has 10 business days todelete them from its list. Sending a message after 10 days, can result inmonetary damage awards of up to 250 dollars per email address. Fifth andlast, unsolicited commercial email must contain clear identification that themessage is an ad or solicitation. It does not have to be in the subject line.There must be a way for the recipient to opt-out from receiving furthermessages from the sender. The sender must include a valid physical postaladdress. If the recipient has given prior consent to receive commercialmessages from the sender, the sender does not have to identify its messageas an advertisement or solicitation (Kahn, 2004).
After voting in favor of the Can-Spam Act, Senator John McCainsaid he felt the odds of defeating spam by a legislative act were low. SteveLinford of Spamhaus.org thought the law placed too many duties on the FTCand that the amount of spam would increase because the act basicallylegalized commercial email (Stone,2003). In reaction, in part, to suchpessimism, a movement has been growing in the United Nations to try toregulate spam, cybercrime, and the disparity between the developed worldand developing world's access to the Internet and telecommunications

28
Journal of Strategic E-Commerce, Volume 2, Number 1, 2004
innovations. In December 2003, the UN appointed the InternationalTelecommunications Union (ITU) to propose a plan to solve these issues.The ITU is a 139-year old trade body that established the country code rulesfor international telephone dialing. At a UN meeting on the Internet inDecember, delegates from Africa, the Middle East, and Eastern Europerejected the open market approach to growing the Internet espoused by theInternational Corporation for Assigned Names and Numbers (ICANN).ICANN was incorporated in 1998 to manage the Internet's addressing systemand help resolve domain name disputes. Governments believe the Internethas grown too complex to be governed solely by ICANN. The ITU sees itsrole as fostering international cooperation in fighting spam, cybercrime, andprotecting civil liberties and individuals' privacy.
Since the Can-Spam Act went into effect, there has been no reductionin the volume of spam. Indeed, it appears that the opposite has occurred,with spam rates actually increasing. MX Logic, a spam-filtering vendor,classified 77 percent of its customers' email as spam on January 12, up 6.5percent from January 1 (Gross, 2004). Further, both MX Logic andCommtouch Software, also a spam-filtering vendor, found that less than onepercent of unsolicited commercial email sent to U.S. inboxes during the firsttwo weeks of January complied with the provisions of the law. In a surveyof email, a third spam-filtering vendor, Audiotrieve, found just over tenpercent of spam email complied with Can-Spam requirements (Gross, 2004).According to Rupert Walmsley, a partner at ITC Internet which offers Webhosting and spam filtering, "Unless there is a globally ratified act it is nevergoing to be very effective" (Bishara, 2004). Based on such gloomyassessments of the Can-Spam Act, it may be time to try for an internationalaccord to regulate this growing menace to the Internet and businessproductivity.

29
Journal of Strategic E-Commerce, Volume 2, Number 1, 2004
REFERENCES
Anti-Spam Act of 2003, H.R. 2515, 108th Congress.
Associated Press (2003, January 5). Study costs businesses $13 billion. Retrieved March4, 2004, from http://www.cnn.com/2003/TECH/biztech/01/03/spam.costs.ap.
Bishara, M. (2004). New Anti-Spam Laws Fail to Bite. Retrieved January 15, 2004, fromhttp://cnn.technology.printthis.clickabillity.com/pt/cpt?action=cpt&title=CNN.com+-+New+anti-spam+laws.
Bridis, T. (2003, October 23). Senate approves limits on 'spam', Baton Rouge Advocate, 5A.
Brightmail Logistics and Operations Center (2004). Retrieved March 5, 2004, fromhttp://fbm.brightmail.com/spamstats.html.
Can-Spam Act of 2003, S. 877, 108th Congress. Retrieved February 29, 2003, fromhttp://web.lexis-nexis.com/universe/document.
Gross, Grant (2004). Is the Can-Spam Law Working? Retrieved January 15, 2004, fromhttp://www.pcworld.com/resource/printablearticle/0,aid,114287,00.asp.
Kahn, R. (2004). Can-spam summary for legal marketing. Retrieved February 24, 2004, fromhttp://practice.findlaw.com/scripts/printer_friendly.pl?page=/top10-0204.html.
Lyman, J. (2003). Spam costs $20 billion each year in lost productivity. Retrieved March 5,2004, from http://www.ecommercetimes.com/perl/story/32478.html.
McCullagh, D. (2003). Antispam bill gets a second go. Retrieved April 10, 2003, fromhttp://news.com.com/2110-1028-1019430.html.
McCullagh, D. (2003). Spam fight divides on party lines. Retrieved July 9, 2003, fromhttp://news.com.com/2100-1028-1024385.html.
McCullagh, D. (2003). Spam goes through Capital mincer. Retrieved June 19, 2003, fromhttp://new.com.com/2100-1028-1019430.html.
Reduction in Distribution of Spam Act of 2003, H.R. 2214, 108th Congress.

30
Journal of Strategic E-Commerce, Volume 2, Number 1, 2004
Roberts, P. (2003). Spam costs companies $874 per employee a year. Retrieved March 5,2004, from http://www.cw360.com/Article123098.htm.
Schaumburg v. Citizens for Better Environment (1980). 444 U.S. 620, 63 L.Ed. 2d 73, at 89.
Spam laws. Retrieved February 23, 2003, from http://www.spamlaws.com/statelaws.
Stone, B. (2003, November24). Soaking in Spam, Newsweek, 66-69.
Thomas Voting Reports (2003, November 23). Louisiana tally, Baton Rouge SundayAdvocate, 17A.
Wagner, M. (2002). Spam may overtake e-mail in 2003. Retrieved March 5, 2004, fromhttp://www.ecommercetimes.com/perl/story/32478.html.
Warner, B. (2004). Tug-of-War for Control of Net Set for Rome Summit. Retrieved March1, 2004, from http://www.reuters.com/newsArticle.jhtml;?storyID=4456234.

31
Journal of Strategic E-Commerce, Volume 2, Number 1, 2004
ASSOCIATIONS BETWEEN E-BUSINESSMODELS AND THEIR BUSINESS
PERFORMANCES
Dae Ryong Kim, Delaware State UniversityHoe-Kyun Shin, Kumoh National Institute of Technology Jong-Chun Kim, Kumoh National Institute of Technology
Sehwan Yoo, University of Maryland Eastern ShoreJongdae Jin, William Paterson University
ABSTRACT
The right selection of e-business model is one of the most criticalfactors of e-business success and should be chosen carefully. However, littleis understood about the association between e-business models and businessperformance. This study develops e-business models with different strategicpositions in the value chain that accommodate unique demands in thee-business environment, then examines the association between e-businessmodels and performance measures.Five e-business models are developed from 6 strategic factors that are, inturns, derived from 22 strategic variables introduced by Hambrick (1983).Model 1 is an e-business model with the strategic emphases on 'comparativeadvantage' and 'concentration,' model 2 is that with expansion and low price,model 3 is that with expansion and product improvement, model 4 is thatwith 'comparative advantage' and process, and model 5 is that with thestrategic emphasis on product improvement. These 5 e-business models arecompared with their corresponding performance measures using Duncangrouping method.
32
Journal of Strategic E-Commerce, Volume 2, Number 1, 2004
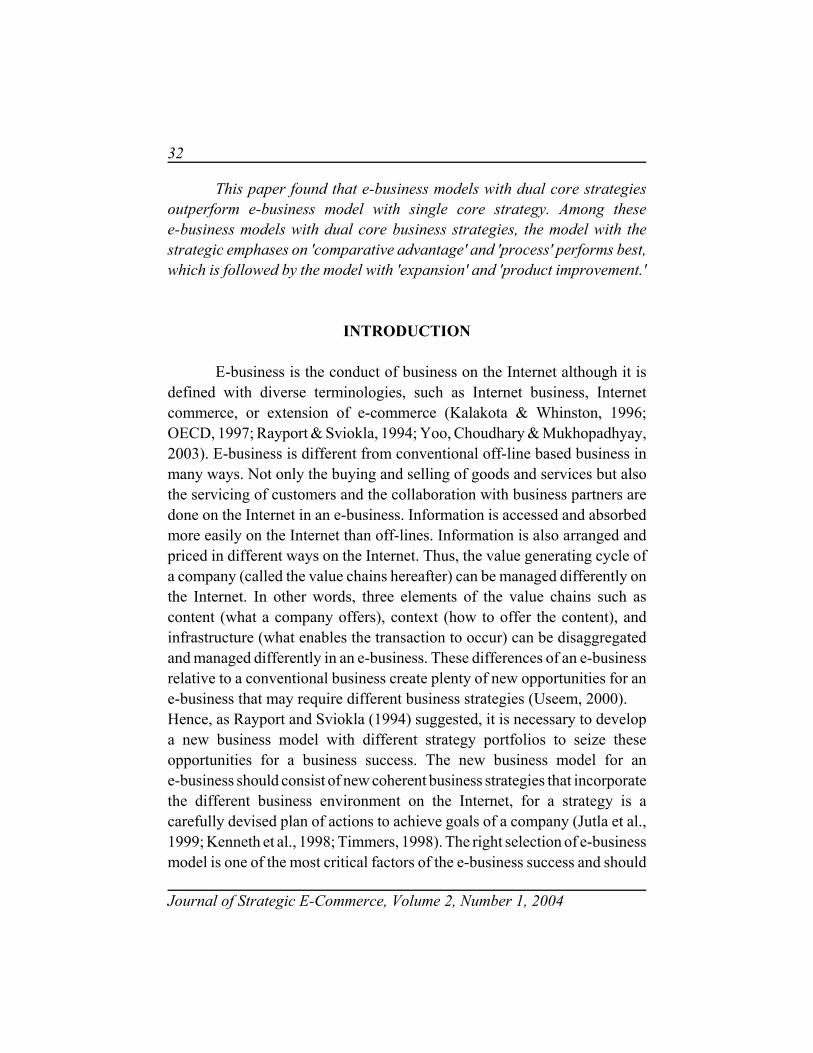
This paper found that e-business models with dual core strategiesoutperform e-business model with single core strategy. Among thesee-business models with dual core business strategies, the model with thestrategic emphases on 'comparative advantage' and 'process' performs best,which is followed by the model with 'expansion' and 'product improvement.'
INTRODUCTION
E-business is the conduct of business on the Internet although it isdefined with diverse terminologies, such as Internet business, Internetcommerce, or extension of e-commerce (Kalakota & Whinston, 1996;OECD, 1997; Rayport & Sviokla, 1994; Yoo, Choudhary & Mukhopadhyay,2003). E-business is different from conventional off-line based business inmany ways. Not only the buying and selling of goods and services but alsothe servicing of customers and the collaboration with business partners aredone on the Internet in an e-business. Information is accessed and absorbedmore easily on the Internet than off-lines. Information is also arranged andpriced in different ways on the Internet. Thus, the value generating cycle ofa company (called the value chains hereafter) can be managed differently onthe Internet. In other words, three elements of the value chains such ascontent (what a company offers), context (how to offer the content), andinfrastructure (what enables the transaction to occur) can be disaggregatedand managed differently in an e-business. These differences of an e-businessrelative to a conventional business create plenty of new opportunities for ane-business that may require different business strategies (Useem, 2000).Hence, as Rayport and Sviokla (1994) suggested, it is necessary to developa new business model with different strategy portfolios to seize theseopportunities for a business success. The new business model for ane-business should consist of new coherent business strategies that incorporatethe different business environment on the Internet, for a strategy is acarefully devised plan of actions to achieve goals of a company (Jutla et al.,1999; Kenneth et al., 1998; Timmers, 1998). The right selection of e-businessmodel is one of the most critical factors of the e-business success and should

33
Journal of Strategic E-Commerce, Volume 2, Number 1, 2004
be chosen carefully. However, it has been difficult to apply e-businessmodels developed so far to the practices, because little is understood aboutthe association between e-business models and their business performance(Hermanek et al., 2001; Lee & Choi, 2000).
The purpose of this study is to develop e-business models withdifferent strategic positions in the value chain that accommodate uniquedemands in the e-business environment and then examine the associationbetween e-business models and performance measures.
RESEARCH PROCEDURE
Strategic variables for the business success introduced by Robinsonand Pearce (1988) are analyzed using the factor loading method to develop6 so-called critical success strategic factors with Eigen-values higher than 1.The 6 critical success strategic factors are 'comparative advantage,''expansion,' process, 'concentration,' 'low price,' and 'product improvement.'Using the cluster analysis, 5 e-business models with various emphases on thecritical success strategic factors were developed. The cluster analysis that isalso used in many previous researches (Galbraith & Schendel, 1983; Dess &Davis, 1984) derives the business models in such a way that the distanceamong those 5 e-business models is maximum in terms of the 6 criticalsuccess strategic factors. The five e-business models are as follows: Model1 is an e-business model with the strategic emphases on 'comparativeadvantage' and 'concentration.' Model 2 is an e-business model with thestrategic emphases on expansion and low price. Model 3 is an e-businessmodel with the strategic emphases on expansion and product improvement.Model 4 is an e-business model with the strategic emphases on 'comparativeadvantage' and process. And model 5 is an e-business model with thestrategic emphasis on product improvement. Then, the association betweenthe 5 e-business models and 4 performance measures are investigated usingthe Duncan grouping method. As business performance measures, rate ofreturn on sales (ROS), rate of return on total assets (ROA), sales growth rate(SGR), and rate of return on equity (ROE) are used in this study.

34
Journal of Strategic E-Commerce, Volume 2, Number 1, 2004
We found that business models with dual strategic emphases (model4, 3, 2, & 1) outperform a business model with a single strategic emphasis(model 5) in terms of all four-performance measures, which is consistentwith Robinson and Pearce's findings with manufacturing companies 1988).Research procedures taken in this study are described in Figure 1.
Strategy Variables Competitive Pricing Developing New Product/Service Product Diversification Enhancing Customer Service Retaining Skilled Human Resource Quality Control Low Cost Focus Inventory Level Control Product Limit Establishing Brand Identity Product Improvement Establishing Influence on Distribution Channel Resource Utilization Research on Business Process Concentrating a Certain Geographic Market Promoting Advertisement for E-commerce Product Specialization Establishing Reputation in E-business Industry Process Innovation Targeting High Price Market Targeting Low Price Market Innovating Internet Marketing Techniques
Survey Collecting Data on Strategic Variables
Reliability Test and Factor Analysis Testing Reliability and Validity of Strategy Variables & Extract Factors from the Variables for Cluster Analysis
Cluster Analysis Extract Diverse E-business Models (Clusters) by Business Strategy
Performance Variables Return on Sales (ROS) Return on Total Assets (ROA) Sales Growth Rate (SGR) Return on Equity (ROE)
Survey Collecting Data on Performance Variables Variance Analysis with Duncan
Grouping Testing Models Extracted from Cluster Analysis with Performance Measure
Figure 1 Analysis Procedure

35
Journal of Strategic E-Commerce, Volume 2, Number 1, 2004
METHODOLOGY
Instrument Administration
We developed a 35-item questionnaire including 22 items for thestrategic variables adopted by Robinson and Pearce (1988), 4 items for theperformance variables, and 9 demographic and company profile items. As apilot-test, to improve the validity of the survey instrument, the instrumentwas reviewed by 12 Information Systems professionals and revised accordingto their recommendations until there are no further substantiverecommendations from the reviews. Then, the revised instrument waspre-tested by 49 executive MBA students. Five demographic and fourcompany profile variables were also measured in the instrument. Size wasmeasured by number of employees, while industry was identified bycategorical scale.
Data Collection
Data were collected via a survey questionnaire through on/off-line atthe same time. The survey method was adopted to maximize generalizabilityof the test result by obtaining a statistically testable representation of thevarious categories of variables. In order to maximize the response rate, thesurvey questionnaire was carefully designed and pilot-tested. The cover letterwas carefully worded and addressed to respondents by name. For thoseundelivered survey packages, we called those subject firms to obtain correctnames or addresses and resent the packages. For those undelivered e-mails,we checked websites of those subject firms and called them later when wecould not find the right e-mail addresses to confirm the addresses ofrespondents. We also mailed/e-mailed confirmation/remind letters fourweeks after the first mailing according to Sudman and Bradburn's (1982)recommendation.
Five hundred survey questionnaires were e-mailed and 210 weremailed to those subject firms in the list of 2001 Annual MembershipDirectory of the 'Association of Internet Enterprise' in Korea. A total of 130

36
Journal of Strategic E-Commerce, Volume 2, Number 1, 2004
responses were received representing a response rate of about 18.3%. 127questionnaires were used for analysis after 3 survey questionnaires werediscarded for incompleteness.
Subject Characteristics
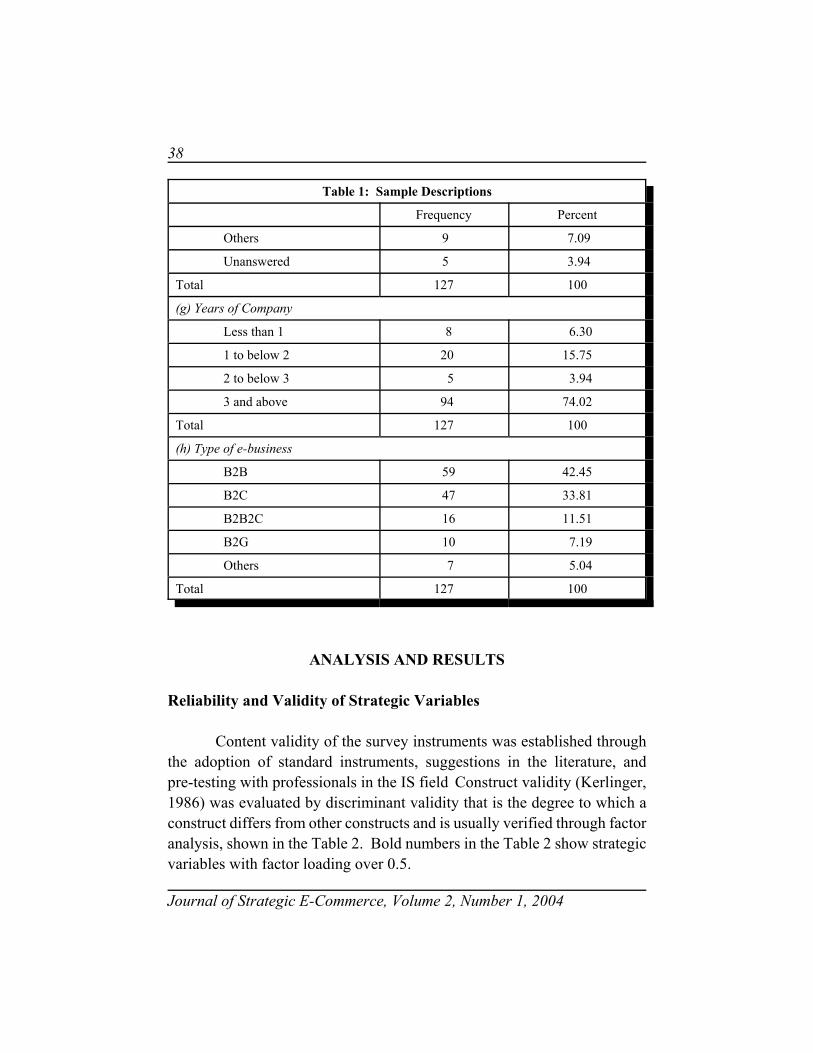
The collected data show that manufacturing firms practicinge-business make the most and service firms practicing e-business make thesecond most sample firms. A total of 83 sample firms are manufacturingfirms, 65.35% of the total sample. The age of sample firms is widelydispersed. 94 out of the 127 sample firms have been in the e-business formore than 3 years (74.02%), and 20 for between 1 and 2 years. Regardinge-business area, 59 sample firms are involved in B2B e-commerce, 47 firmsare in B2C, 16 firms are in B2B2C, and 10 firms are in B2G e-commerce.Demographic data show that 89.89% of the respondents are male and thelargest group of employees is in between 30 to 40 years old (57.48%) withaverage age 31. A total of 94 of the 127 respondents (73.99%) haveundergraduate education or higher, which implies firms practicing e-businessrequire more educated people to run e-business with computers. Averagework experience of the respondents is 7.7 years. Table 1 shows the profile ofthe respondents and responding companies.
Table 1: Sample Descriptions
Frequency Percent
(a) Sex
Male 113 88.89
Female 14 11.11
Total 127 100
(b) Age
Less than 30 30 23.62
30 to below 40 73 57.48

37
Table 1: Sample Descriptions
Frequency Percent
Journal of Strategic E-Commerce, Volume 2, Number 1, 2004
40 and above 24 18.90
Total 127 100
(c) Education
High School 12 9.45
Community College 21 16.54
Undergraduate 77 60.63
Graduate School 17 13.39
Total 127 100
(d) Rank
Clerk 38 29.92
Supervisor 40 31.50
Manager 20 15.75
Director 11 8.66
Executive 18 14.17
Total 127 100
(e) Years on the Job
Less than 3 41 32.28
3 to below 6 28 22.05
6 to below 9 20 15.75
9 to below 12 16 12.60
12 and above 22 17.32
Tota1 127 100
(f) Industry
Manufacturing 83 65.36
Service 23 18.11
Telecommunication 5 3.94
Distribution 2 1.57
38
Table 1: Sample Descriptions
Frequency Percent
Journal of Strategic E-Commerce, Volume 2, Number 1, 2004
Others 9 7.09
Unanswered 5 3.94
Total 127 100
(g) Years of Company
Less than 1 8 6.30
1 to below 2 20 15.75
2 to below 3 5 3.94
3 and above 94 74.02
Total 127 100
(h) Type of e-business
B2B 59 42.45
B2C 47 33.81
B2B2C 16 11.51
B2G 10 7.19
Others 7 5.04
Total 127 100
ANALYSIS AND RESULTS
Reliability and Validity of Strategic Variables
Content validity of the survey instruments was established throughthe adoption of standard instruments, suggestions in the literature, andpre-testing with professionals in the IS field Construct validity (Kerlinger,1986) was evaluated by discriminant validity that is the degree to which aconstruct differs from other constructs and is usually verified through factoranalysis, shown in the Table 2. Bold numbers in the Table 2 show strategicvariables with factor loading over 0.5.

39
Journal of Strategic E-Commerce, Volume 2, Number 1, 2004
Table 2: Factor Analysis
Factors & Strategy Variables C A. Exp. Proc Concent L P PI
Comparative Advantage (CA)
Product Diversification 0.7371 0.0967 0.2102 -0.2295 -0.0384 0.1522
New Product/Service 0.6742 0.2985 0.1574 -0.1901 0.0357 0.1978
Skilled Human Resource 0.6091 0.4871 -0.0300 -0.0118 -0.1462 0.1429
Competitive Pricing 0.5694 0.1141 0.2964 0.0275 0.5189 0.1753
Low Cost Focus 0.5399 -0.0183 0.2639 0.1930 0.3108 -0.0420
Expansion (Exp)
Internet Marketing Technique -0.0251 0.8202 0.1199 -0.0368 0.2125 0.0027
Reputation in E-business Industry
0.2180 0.7664 0.0496 0.0462 0.1450 0.3077
Distribution Channel 0.1897 0.6268 0.1641 0.0681 -0.0872 0.2012
Establishing Brand Identity 0.1836 0.6084 0.1160 -0.0935 -0.1266 -0.1350
Enhancing Customer Service 0.5030 0.5148 0.1912 -0.1768 -0.0834 -0.0579
Process (Proc)
Process Innovation 0.0736 0.0440 0.8036 -0.0445 0.1438 -0.0807
Resource Utilization 0.1015 0.0460 0.7080 0.1140 0.0858 0.3112
Quality Control 0.1790 0.2205 0.5992 -0.0420 -0.3252 0.0214
Research on Business Process 0.3782 0.2325 0.5582 -0.0792 0.0123 0.1287
Concentration (Concent)
Inventory Level Control -0.0310 0.1872 0.2147 0.7318 -0.0635 0.0384
Geographic Market -0.0468 -0.2471 -0.1382 0.6704 -0.0240 0.1223
Product Limit -0.2079 -0.0548 -0.1528 0.6295 0.3287 -0.2496
Low Price (LP)
Targeting Low Price Market 0.1142 0.0960 0.0481 0.0287 0.8097 -0.0419
Product Improvement (PI)
Product Improvement 0.2604 0.1889 0.2169 0.0758 -0.1214 0.7402
Cronbach's alpha 0.7683 0.7852 0.6314 0.5252 1.0000 1.0000
Eigen-Value 3.1335 3.1300 2.6971 1.7134 1.6550 1.4243
Percent (%) Explained 14.2431 14.2272 12.2598 7.7883 7.5230 6.4742

40
Journal of Strategic E-Commerce, Volume 2, Number 1, 2004
From the factor analysis, 6 strategic factors (Comparative advantage,Expansion, Process, Concentration, Low Price, and Product Improvement)with Eigen-value greater than 1 were selected. Since 3 strategic variablessuch as 'Promoting Advertisement for E-commerce,' 'Product Specialization,'and 'Targeting High Price Market' did not exhibit high discriminant validity(loadings < 0.5), only 19 strategic variables out of the initial 22 were loadedto 6 strategic factors.
To examine the internal coherence amongst determinants of eachstrategic factor, the Cronbach's alpha coefficient was measured. Coefficientsof all 6 strategic factors are larger than 0.5252, indicating that internalcoherence among determinants is good (Nunnally, 1978). The results fromthe reliability and validity analysis of the strategy variables are presented inTable 2. Each strategic factor identified by factor analysis has its ownstrategic behavior. These different behaviors are described in Table 3.
Table 3: Behavior of Strategic Factors
Factor Interpretation
Comparative Advantage Focus on retaining comparative advantage on diverse fieldssuch as product, cost, price, and human resource
Expansion Focus on distribution channel and marketing effort toestablish reputation within an e-business industry and toenhance customer service
Process Focus on business process by investing research on businessprocess, innovating the process, utilizing material effectively,and applying strict quality control
Concentration Concentrate on a certain geographic area, a limited numberof product, and inventory control
Low Price Focus on low price to defeat competitors in e-businessmarket
Product Improvement Focus on continuous product improvement

41
Journal of Strategic E-Commerce, Volume 2, Number 1, 2004
Cluster Analysis
Using the cluster analysis introduced by Hambrick (1983), 5e-business models with various emphases on strategic factors weredeveloped. This cluster analysis used in many previous researches (Dess &Davis 1984; Galbraith & Schendel, 1983; Hambrick & Schecter, 1983)derives the business models in such a way that the distances among those 5e-business models are maximums in terms of the 6 strategic factors. Althougheach strategic factor has its own portfolio of strategic variables, these factorscould be grouped together to form a business model according to Hambrick(1983). Thus, these five e-business models were extracted from 6 strategicfactors. These models are different business models that take differentstrategies to compete with other companies in the e-business industry. Theresult of cluster analysis shows that 4 models (model 1, 2, 3, & 4) takemultiple core strategies, while model 5 takes single core strategy, productimprovement. Summary results of the cluster analysis are presented in Table4.
Table 4: Cluster Analysis
Cluster (Model)
ComparativeAdvantage
Expansion Process Concent. Low Price
ProductImprovemt
1 (n=32) 0.42* 0.09 0.19 0.57* -0.25 -0.99
2 (n=26) 0.15 0.98* 0.31 0.15 0.78* 0.42
3 (n=15) 0.37 0.77 -1.33 -0.78 -0.40 0.72*
4 (n=20) 0.77* -1.16 0.56* -0.69 0.12 0.20
5 (n=33) -1.16 -0.50 -0.16 0.13 -0.27 019*
* Cluster means selected

42
Journal of Strategic E-Commerce, Volume 2, Number 1, 2004
Table 5 describes strategic behaviors of each model (cluster) indetails. Each model behaves differently for competition. Four of them takemultiple core strategies to be in better position in e-business industry. Onlyone of them focuses on single core strategy to compete with other companies,but this model might have limitation in adaptability to business environmentchanges.
Table 5: Strategic Behavior of Each Model
Cluster Strategy Description
1 Comparative Advantage &Concentration
This model focuses on comparative advantage andconcentration strategies. Companies utilizing this strategyinvolve product diversification, product and servicedevelopment, skilled human resource arrangement, competitivepricing, low cost focus, advertisement, and low inventorylevel. They also are interested in providing a limited productto a limited market segment to focus on a market.
2 Expandability & Low Price
This model focuses on expandability and low price.Companies utilizing this strategy invest in Internet marketingto establish name on e-business industry, try to set up powerfulinfluence on distribution channel, and expand customerservice. They also focus on low price market.
3 Expandability & Product Improvement
This model focuses on expandability and productimprovement. Companies utilizing this strategy rely on theexpandability strategy and try to improve its product quality.
4 Comparative Advantage & ProcessFocus
This model focuses on comparative advantage and businessprocess. In addition to the comparative advantage strategy,companies utilizing this strategy invest in research oninnovative business process, quality control process, and betterutilization of material.
5 ProductImprovement
This model focuses only on product improvement. Thisstrategy is simple and also powerful on the product innovation,but has limitations on environmental changes.

43
Journal of Strategic E-Commerce, Volume 2, Number 1, 2004
Variance Analysis and Duncan Grouping Test
Since e-business models are developed and performance measures aremeasured, the relationship between e-business models and performancemeasures are investigated. First, correlation analysis has been conducted onperformance measures to see if there is homogeneity amongst the fourperformance measures. As shown in Table 6, all correlation coefficientsamong the performance measures are higher than 0.7 (P < 0.0001), whichmeans that the four performance measures are significantly related oneanother and can be used in variance analysis as variables.
Table 6: Correlation Among Performance Measures
Mean StdDev
ROS ROA SGR ROE
Return on Sales(ROS)
3.07874 1.10989 1.00000
Return on Assets(ROA)
3.09449 1.10865 0.85820* 1.00000
Sales GrowthRate (SGR)
3.24409 1.12487 0.72189* 0.73868* 1.00000
Return on Equity(ROE)
3.29921 1.11494 0.70554* 0.71533* 0.80192* 1.00000
*: P < 0.0001
This study conducted MANOVA tests to examine if e-businessmodels affect their business performances. The results from this MANOVApresented in Table 7 show that F-value is 8.98 (P < 0.0001), which meansthat the e-business models affect the business performance.

44
Journal of Strategic E-Commerce, Volume 2, Number 1, 2004
Table 7:MANOVA: Overall Impact of E-Business Models on Business Performances
Source DF Sum of Squares
Mean Square F Value Pr > F
Model 4 35.47894 8.86973 8.98 <.0001
Error 121 119.44964 0.98719
CorrectedTotal
125 154.92857
Finally, the association between e-business models and performancemeasures is analyzed using Duncan grouping method where each businessmodel is given a letter grade of A, B, and C for its performance in terms offour different performance measures. As shown in Table 8, Model 4 with thestrategic emphases on 'comparative advantage' and 'concentration' has thehighest performance mean and hence grade of A in all four performancemeasures. Model 3 with the strategic emphases on expansion and productimprovement has the second highest performance mean in all fourperformance measures but earns 3 A's with 1 B. Model 2 with the strategicemphases on expansion and low price has the median performance mean butearns only 2 A's with 2 B's. Model 1 with the strategic emphases on'comparative advantage' and 'concentration' has the second lowestperformance mean and earns 2 B's, 1 A, & 1 C. Model 5 with the strategicemphasis on product improvement has the lowest performance mean andearns 2 B's with 2 C's.
The result of Duncan grouping method indicates that e-businessmodels with dual core strategies (model 4, 3, 2, and 1) outperform e-businessmodel with a single core strategy (model 5). Among these e-business modelswith dual core business strategies, the model with the strategic emphases on'comparative advantage' and process (model 4) performs best, which isfollowed by the model with expansion and product improvement (model 3),

45
Journal of Strategic E-Commerce, Volume 2, Number 1, 2004
the model with expansion and low price (model 2), and the model with'comparative advantage' and 'concentration' (model 1).
Table 8: Duncan Grouping Analysis
Statistic Value FValue
Num DF Den DF Pr > F
Wilks'Lambda
0.7169 3.48 12 315.14 <.0001
Return on Equity (ROE)
Return on Sale (ROS)
Return onAssets (ROA)
Sales Growth Rate (SGR)
Cluster N Mean D/G* Mean D/G* Mean D/G* Mean D/G*
4 20 3.9000 A 3.650 A 3.650 A 4.100 A
3 15 3.8000 A 3.467 A 3.533 A 3.667 B
2 26 3.6923 A 3.192 B 3.346 A 3.462 B
1 32 3.2188 B 3.000 B 3.125 A 3.094 C
5 33 2.5152 C 2.546 B 2.364 B 2.546 C
* Duncan Grouping
CONCLUSIONS AND IMPLECATIONS
The purpose of this study is to develop e-business models withdifferent strategic positions in the value chain that accommodate uniquedemands in the e-business environment and then examine the associationbetween e-business models and performance measures. To accomplish theseobjectives, 5 e-business models are developed from 6 strategic factors thatare, in turns, derived from 22 strategic variables introduced by Hambrick(1983). Then, these 5 e-business models with different core strategies are

46
Journal of Strategic E-Commerce, Volume 2, Number 1, 2004
compared with their corresponding performance measures using Duncangrouping method.
This study found that e-business models with dual core strategiesoutperform e-business model with one core strategy. Among those e-businessmodels with dual core business strategies, model 4 with 'comparativeadvantage' and 'concentration' as core strategies performs best, which isfollowed by model 3, model 2, and model 1 in the order of the performance.According to the results of this study, companies should pay attention to thestrategies such as 'comparative advantage' and 'concentration' to competevery best with other companies. The strategies that these companies shouldinvolve are product diversification, product and service development, skilledhuman resource arrangement, competitive pricing, low cost commitment,advertisement promotion, low inventory level, and limited product supply toa certain market segment.
The findings of the study have interesting implications for practice.E-business companies that want to compete with other e-business companiesshould focus on multiple core strategies rather than a single strategy. Whenthey select one of e-business models with a strategic consideration, theyshould check where they put their emphases. The results of this study maybe one of the guidelines in practice when companies choose their strategice-business model.
Since this research is an empirical study using large sample andvalidated instruments, the results can be generalized with high degree ofconfidence. The results of this study have meaningful implications for thedevelopment of e-business model, in general. However, due to a relativelyshort history of e-business industry, a thorough investigation into theoreticaland empirical background of e-business strategies could not be performed.It also should be noted that the analysis was based on an 18.3% response rate.Although non-response bias was estimated, it should be recognized that thepotential of sample frame error exists. Also, the scope of this study wasrestricted to the demographic variables of industry and business type.

47
Journal of Strategic E-Commerce, Volume 2, Number 1, 2004
REFERENCES
Dess, G.G. & P.S. Davis (1984). Porter's (1980) Generic Strategies as Determinants ofStrategic Membership and Organizational Performance, Academy of ManagementJournal, 27, 467-488.
Galbraith, C. & D. Schendel (1983). An Empirical Analysis of Strategy Types, StrategicManagement Journal, 4, 153-173.
Hambrick, D.C. (1983). High Profit Strategies in Mature Capital Goods Industries: AContingency Approach, Academy of Management Journal, 26, 687-707.
Hambrick, D.C. &S.M. Schecter (1983). Turnaround Strategies for Mature IndustrialProduct Business Unit, Academy of Management Journal, 26, 231-248.
Hermanek, M., C. Schlemmer, B.G. Hope & S.L. Huff (2001). Critical Success Factors inBusiness-to-Business E-commerce: The Views of IS Managers, The Proceedingsof Pacific Asia Conference on Information Systems, 238-252.
Jutla, D.N., P. Bodorik, C. Hajnal & D. Davis (1999). Making Business Sense of ElectronicCommerce, IEEE Computer, 32(3), 67-75.
Kalakota, R. & A.B. Whinston (1996). Frontiers of Electronic Commerce, Boston, MA:Addison-Wesley Publishing Company, Inc.
Kenneth, B., L. Harrington, D. Layton-Rodin & V. Rerolle (November 1998). ElectronicCommerce: Three Emerging Strategies, The McKinsey Quarterly, 17-25.
Kerlinger, F.N. (1986). Foundations of Behavioral Research, Fort Worth, TX: Holt, Rinehartand Winston.
Lee. K.B. & M.K. Choi (2000). Study of Strategic Success Factor in Internet BusinessModel, Proceedings of Annual Meeting of Association of Korean AI Systems,225-234.
Nunnally, J.C. (1978). Psychometric Theory. New York, NY: McGraw-Hill.
OECD (1997). Electronic Commerce: Opportunities and Challenges for Governments, TheSacher Report, 6(12), 19-23.

48
Journal of Strategic E-Commerce, Volume 2, Number 1, 2004
Rayport, J.F. & J.J. Sviokla (November-December 1994). Marketing in the Marketspace,Harvard Business Review, 17-34.
Robinson, R.B. Jr. & J.A. Pearce II (1988). Planned Patterns of Strategic Behavior and TheirRelationship to Business-Unit Performance, Strategic Management Journal, 9,43-60.
Sudman, E. & N. Bradburn, (1982). Asking Questions: A Practical Guide to Questionnaire
Design, San Francisco, CA: Jossey-Base Publishers.
Timmers, P. (1998). Business Models for Electronic Markets, Electronic Markets, 8(2), 3-8.
Useem, J. (2000). Lessons From the Dot-Com Crash, Fortune Magazine, 11(6), 46-79.
Yoo, B., V. Choudhary & T. Mukhopadhyay (2003). A Model of Neutral B2BIntermediaries, Journal of Management Information Systems, 19(3), 43-68.

49
Journal of Strategic E-Commerce, Volume 2, Number 2, 2004
ARTICLES for Volume 2, Number 2

50
Journal of Strategic E-Commerce, Volume 2, Number 2, 2004
ARTICLES for Volume 2, Number 2

51
Journal of Strategic E-Commerce, Volume 2, Number 2, 2004
ASSESSING CROSS-INDUSTRY EFFECTSOF B2B E-COMMERCE
Uday M. Apte, Southern Methodist University Hiranya K. Nath, Sam Houston State University
ABSTRACT
The productivity gain that an industry experiences by engaging inB2B e-commerce gets transmitted to other industries through input-outputlinkages. This paper considers a multi-industry equilibrium model thatexplicitly incorporates input-output structure to examine the propagation ofproductivity gain across industries and to provide a framework toquantitatively evaluate the overall impact of B2B e-commerce. This modelalso helps identify the industries with potential for largest impact on otherindustries. We also demonstrate how this model can be used to makeprojections of output growth that would result from the introduction of B2Bin selected industries.
INTRODUCTION
The economic impact of the Internet has already been visible: incommodity market, in capital market as well as in labor market. There hasbeen a drop in prices of many consumer items. Online trading of stocks andbonds has increased over the years.1 A sizeable portion of the labor force isemployed in Internet related activities. As we will see shortly, the revenuegenerated and the number of workers employed by the Internet basedeconomic activities have been so large that they can well be described asconstituting an independent economic system. One characteristic feature of

52
Journal of Strategic E-Commerce, Volume 2, Number 2, 2004
these developments is the speed. This Internet based economy has grownvery fast within a very short period of time. Enough time has not elapsed toobserve long-run economic impact of the Internet. Nevertheless, speculationsabound. Economists are divided between predicting long-run growth and lowinflation in one end, and dismissing it as a temporary phenomenon in theother. Although recent dot com bust has produced more skeptics than ever,it is important to recognize that the potential size and overall economicimpact of the Internet is larger than what we can imagine today. However,given that the Internet has taken the world, or at least the advancedeconomies, by storm, it is worthwhile to examine some of the speculationsfor their substance.
From the point of view of business and economics, trading over theInternet, also known as electronic commerce or e-commerce, is the fastestgrowing Internet based economic activity in the present time. Thephenomenal growth of e-commerce in recent times has the most visibleeffects on the consumption economy. The consumer items are cheaper onlinethan in conventional stores.2 Internet cuts down on transaction costs andmakes goods available to consumers at lower prices. Moreover, consumersare exposed to a wider range of choices. This proliferation of e-commercehas an indirect effect: competition from the Internet has forced traditionalretailers to cut their prices. The speculation among the experts, however, isthat the business-to-business (B2B) e-commerce will have the largest impactin the economy.3 B2B e-commerce can simply be defined as transactionsbetween businesses conducted over the Internet. Since it involves trading ofgoods in the intermediate stages of the production process the value andvolume of transactions will relatively be high. Moreover, the gains fromengaging in B2B e-commerce in terms of increased productivity or reducedcost have indirect effects on other businesses through various linkages. Thispaper examines the cross-industry effects of B2B gain that spill over throughinter-industry interactions in the context of a multi-industry equilibriummodel. It also identifies the sectors that have the potential for spreading thebeneficial effects across industries by reducing costs. In particular, we areinterested in direct as well as indirect (which is sometimes referred to as'second-round effects') impact of B2B e-commerce across industries. The

53
Journal of Strategic E-Commerce, Volume 2, Number 2, 2004
model provides a framework for quantitatively assessing the impact of B2Be-commerce across industries. From both qualitative and quantitativeanalysis it appears that some industries hold brighter prospects than othersdo.
The rest of the paper is organized as follows. In section 2, we providea discussion on the definition of the Internet economy, its size and growth.We also discuss various aspects of B2B e-commerce. Section 3 discusseshow B2B e-commerce benefits industries directly by reducing costs orincreasing productivity, and indirectly through various inter-industrylinkages. We then present a simple multi-industry equilibrium model4 toevaluate how inter-industry linkages help the gains from B2B in one industryget transmitted to the others. First we specify the model and then define acompetitive equilibrium. By explicitly introducing the input-output structureinto the model we theoretically examine the impact of using the Internet forB2B e-commerce on the output and prices of different industries. Then wecalibrate the parameters of the model so that we can make quantitativestatements about the economy-wide impact of introducing B2B e-commercein different industries. Section 4 investigates for each individual industry theeffects of introducing B2B e-commerce on output of various goods in theeconomy. Quantitative implications of introducing B2B in a few industrieshave been worked out and included in this section. Section 5 includes ourconcluding remarks.
THE INTERNET ECONOMY AND B2B E-COMMERCE
Electronic commerce is an important and integral part of theburgeoning Internet economy, which is loosely defined to encompass allresources related to, and all economic activities based on the Internettechnology. The transactions carried out between different agents, i.e.,between retailers and consumers, between wholesale traders and retailers, orbetween firms, over the Internet, constitute what we know as e-commerce.Depending on who are on the two sides of these transactions, e-commerce isgiven fancy names. For example, when it involves transactions between

54
Journal of Strategic E-Commerce, Volume 2, Number 2, 2004
business and consumers it is called B2C. Similarly, when such transactionsare between firms, i.e., between businesses, it is named B2B. Beforeexplaining the notion of B2B e-commerce and its economic significance wewill have an overview of the Internet economy, its size, structure and growth.
The Internet Economy
In a recent comprehensive study conducted by the Center forResearch in Electronic Commerce of the University of Texas at Austin, theInternet economy has been defined as 'a complete economic systemconsisting of (i) ubiquitous, low cost communication networks using Internettechnologies and standards, (ii) applications and human capital that enablebusiness to be conducted over this network infrastructure, (iii) interconnectedelectronic markets that operate over the network and applicationsinfrastructure, (iv) producers and intermediaries providing a variety of digitalproducts and services to facilitate market efficiency and liquidity, and (v)emerging policy and legal frameworks for conducting business over theInternet' (page 7). In this new emerging economic system, information playsthe key role, a role that is played by the physical assets in the traditionaleconomy.
According to this study, in 2000 the Internet economy employed2.476 million workers and generated half a trillion dollars in revenue.Various studies5 indicate increased use of internet in every walk of life.According to a report from the Online Publishers Association and ComScore,consumer spending on online content in the US totaled USD1.3 billion in2002, that marks an increase of 95 percent compared to 2001. eMarketerpredicts that by 2004, worldwide e-commerce revenues would total USD2.7trillion. According to this research company's latest report, the US willaccount for over one-half of worldwide revenues this year. A study byNielsen-Netratings reveals that the top traditional advertisers increased theirshare of online advertising by 30 percent by the end of 2002. More than 22million US Internet users visited an online tax services website duringFebruary 2003. New research from Pew Internet and American Life indicates

55
Journal of Strategic E-Commerce, Volume 2, Number 2, 2004
that two-thirds of politically engaged Internet users during the 2002 electioncycle sent or received email related to the campaign. The fact that America'sleading cable and DSL providers added a combined 6.4 million high-speedInternet subscribers during 2002 is evidence of continuing expansion of theInternet economy. Leichtman Research Group forecasts that the total numberof broadband cable and DSL Internet subscribers in the US will surpass thenumber of narrowband subscribers in 2005 and will grow to nearly 49million by the end of 2007. New jobs are being created to cater to the needsof this ever expanding Internet economy. Workers are being shifted fromother vocations to take advantage of new opportunities. The convenience,flexibility and efficiency of doing business through the Internet havecontributed to this phenomenal growth of this emerging Internet economy.There is no doubt that the Internet economy is going to be a majorcontributor to the U.S. economy.
What is B2B?
E-commerce is the fastest growing segment of the Internet economy.Within this segment, B2B e-commerce is considered to have the brightestprospect of future growth and expansion. As we have already mentioned, ithas been projected that the B2B will soon outpace B2C with its turnovergrowing up to ten times higher by the end of year 2003. The Goldman SachsReport on the e-commerce has defined 'B2B' as 'business-to-businesscommerce conducted over the Internet' (page 2). B2B has two majorcomponents: 'e-frastructure' and 'e-market'. Auction solutions software,content management software, and web-based commerce enablers constitutewhat the report calls 'e-frastructure'. Essentially, these three componentsprovide the infrastructure for conducting electronic commerce. On the otherhand, the 'web sites where buyers and sellers come together to communicate,exchange ideas, advertise, bid in auctions, conduct transactions, andcoordinate inventory and fulfillment' constitute the marketplace where thee-commerce actually takes place.

56
Journal of Strategic E-Commerce, Volume 2, Number 2, 2004
HOW DOES B2B AFFECT PRICE AND OUTPUT ACROSSINDUSTRIES?
In addition to the speculation that B2B itself would evolve into arevenue-and-employment generating business, it can as well be argued thatit would have beneficial impact on traditional industries. Since B2Be-commerce is directly associated with the production process of theindustries the impact could be widespread. By improving flow of informationit would ensure allocation of resources to their most productive uses, andthus would make markets more efficient. Efficient allocation of resourceswould make production process less costly and therefore more productive.6
Since industries are linked to one another as buyers and sellers of inputs, theproductivity gain7 to an industry that is engaged in B2B e-commerce, willeventually spill over to other industries through various linkages. Thus, B2Be-commerce will have economy-wide effects.8 However, how the gain in oneparticular industry affects other industries in the economy depends on whichindustry experiences these productivity gains, and on the nature of itsinteractions with other industries in the economy.
Intuitively, a productivity gain in an industry will entail a reductionin unit cost of its production. It implies that the price of its output will fall.If this particular good is used as inputs in other industries then it will lead toa reduction in the cost of production in the downstream industries, which inits turn will presumably lead to a fall in prices and rise in output of variouscommodities. On the other hand, since industries can now easily procure theirintermediate inputs they would not accumulate large amount of inventory ata particular period of time. In other words, the scale of operation in terms ofproductive capacity will be smaller. Also, as the allocation of resourcesimproves and as a result the resources become more productive, the demandfor intermediate inputs or other resources might decrease. It may havenegative effects on the upstream industries. Thus B2B e-commercepotentially has both positive and negative effects.
However, we would like to categorize the effects of B2B gain intodirect and indirect effects. Direct effects are realized in the industries thatpurchase intermediate inputs through B2B e-commerce. If this productivity

57
Journal of Strategic E-Commerce, Volume 2, Number 2, 2004
gain does not affect the demand for its output, these effects are expected tobe in the form of rise in output and fall in prices. Indirect effects, on the otherhand, are realized in other industries, which have downstream or upstreamlinkages with the industry experiencing B2B gain. In downstream industriesit would look like a supply shock: price would fall and output would rise. Inupstream industries it would look like a negative demand shock: both priceand output fall. Total effects depend on the nature (whether positive ornegative) and relative weights of direct and indirect effects.
In order to help us understand the direct effects, let us consider apartial equilibrium framework. Consider figure 1.a. In the short-run, industryi has an upward sloping supply curve Si and faces a downward slopingdemand curve Di. Suppose the industry is in short-run equilibrium at Ei withequilibrium price Pi and output Qi. As productivity increases as a result ofB2B e-commerce the supply curve shifts to the right. This is represented inthe diagram by Si'. In the new equilibrium Ei', price declines to Pi' and outputincreases to Qi'. Note that in this illustration we have assumed that the B2Bhas not affected the demand for the output of industry i. B2B has similarindirect effects in the downstream industries. Indirect effects in the upstreamindustries, on the other hand, would look like negative demand shock. Infigure 1.b, the demand curve faced by industry j, which provides intermediateinputs to the industry i experiencing B2B gain, shifts to the left for reasonsexplained above. The new equilibrium price and output are Pj and Qj
respectively.However, in a more general framework industries interact in such a
complicated fashion that it is difficult to distinguish between downstream andupstream linkages among industries. Two industries may be linked to oneanother both as downstream and upstream industries. In such cases, it isdifficult to infer what the net effect would be for each of these industries.Moreover, the industry that experiences B2B gain could also be a majorprovider of intermediate inputs to itself. In such a situation, the positiveimpact of B2B gain could be neutralized by the negative impact of anopposite demand effect. In other words, since the industry now becomesmore productive it uses less of its output as intermediate inputs. That is, thedemand for its output falls. The net effect would depend on the relative

58
Journal of Strategic E-Commerce, Volume 2, Number 2, 2004
magnitudes of the positive supply effect of productivity growth and thenegative demand effect of fall in inventory accumulation.
Figure 1Effects of B2B Gain
Figure 1.a'Direct effects' and 'indirect effects on downstream industries'
Figure 1.b'Indirect effects on upstream industries'

59
Journal of Strategic E-Commerce, Volume 2, Number 2, 2004
In brief, the productivity gain that is induced by the B2B e-commercewould set out a chain of changes that would work out through a complicatednetwork of interactions among industries. Intuitively, it is not clear what thefinal effects would be. In order to capture the interactions among industriesin the form of input-output relationship, we now construct a simplemulti-industry equilibrium model that is capable of predicting thecross-industry effects of a B2B gain in individual industries. Note that thisis a static model. However, there could well be dynamic effects of this typeof productivity shock. After all, it is very likely that these productivity shockswill affect the economy with time lags. Also, there are other factors in theeconomy, which are important for the behavior of the economic variables.Since our aim is to evaluate short-run direct and indirect effects of B2B gainacross industries, we are considering a simple production economy with anexplicit input-output structure that captures inter-industry interactions. In themodel, it is assumed that introduction of B2B e-commerce is an exogenousfactor or a 'shock' that has positive productivity effect on the industries.
A Simple Multi-Industry Equilibrium Model
Model Specification
We assume that there are n industries in the economy. Each industryconsists of large number of identical firms. The production technologyavailable to a representative firm in industry i is given by the followingproduction function9
(1)∏=
=n
1j
ijaijii XZY
where aij > 0 and for i = 1,2,….n. Yi is the output of industry i,10 Zi1an
1jij <∑
=
is a random variable that denotes a shift in total factor productivity inindustry i due to B2B e-commerce.11 Thus use of Internet will presumably

60
Journal of Strategic E-Commerce, Volume 2, Number 2, 2004
increase productivity and that will be captured by Zi s in our model. Xij is thequantity of industry j output used as input in industry i. Since we have notexplicitly introduced labor and capital in this production function one caninterpret it as a short-run production function. That is, capital and labor donot change while intermediate inputs are the only variable factors. Thus theproduction function exhibits decreasing returns to scale in intermediateinputs. The firm maximizes its short-run profits subject to a constraintimposed by the technology given by (1). The short-run profit function forfirm i is given by
(2)∑=
−=Πn
1jijjiii XPYP
where Pi is the price of industry i output.A market clearing condition for each industry completes the
specification of the model. Thus
(3)∑=
+=n
1jjiii XFY
where Fi is the amount used for final uses. This implies that available outputof industry i is used either for final uses such as consumption, investment andgovernment purchases or as inputs in other industries (including industry i).To highlight the importance of demand and supply of intermediate inputs indetermining output and prices, however, we assume that Fi's are fixed. Themodel is now solved for competitive equilibrium.
First-Order Conditions for Firm's Profit Maximization
(4)j
jk
ikaik
1ijaijiiij PXXZPa =∏
≠
−
for all i, j = 1,2,….n

61
Journal of Strategic E-Commerce, Volume 2, Number 2, 2004
This condition states that the marginal revenue product of input j in industryi is equal to its price. Manipulation of the equilibrium condition (4) yields
(5)i
j
iijij Y
PP
aX =
It is not difficult to see from this equation that as Yi increases as a result ofthe exogenous productivity gain, ceteris paribus, Pi decreases. On the otherhand, as Pi decreases, demand for ith input in industry k rises, i.e. Xki
increases, which in turn leads to an increase in Yk as we can see from theproduction function. This will set out another chain of changes in prices andoutput. Thus it is the constant interactions between demand and supply thatlead to cross-industry effects on prices and output.
A Competitive Equilibrium
A competitive equilibrium for this simple economy is defined as thequantity vectors X and Y and price vector P such that for a given vector Z ofproductivity shift,
(i) the firms' profit maximization problems are solved.
(ii) all markets clear.
Let be the competitive equilibrium solutions of Xij, Yi andiiij P&Y,X
Pi's in terms of 's. Since we are interested in the effects ofii ZZ =displacements in total factor productivity from 's on the choices variables
iZXij, Yi and Pi's, we state the following theorem.
Theorem 1: In a production economy, if industries are inter-linked throughinput-output structure, then the percentage deviations in Xij, Yi and Pi's from

62
Journal of Strategic E-Commerce, Volume 2, Number 2, 2004
these equilibrium values respectively, are given by linear functions of zi'swhere zi's are the percentage deviations of Zi's from 's.
iZProof: (see Appendix)
Calibration
In order to make some quantitative statements about the effects ofB2B productivity gains across different industries we now calibrate themodel for thirty-five industry groups12 of the U.S. economy. We follow theindustry classification scheme of Jorgenson, Gollop and Fraumeni (1987).These thirty-five industries roughly match the 2-digit Standard IndustrialClassification (SIC) of U.S. industries. The parameters that we need tocalibrate are aij's and sij's. Fortunately, the Input-Output (I-O) Tables provideinformation on how the industries at various levels of aggregation interactamong themselves, which can be used to obtain the values of theseparameters. In 1996 annual I-O tables, 95 industries are covered at thetwo-digit level.13 We consolidate the 1996 I-O direct requirement table to
thirty-five sectors that we are considering here. Note that , where Xiji
ijij Y
Xa =
is the amount of industry j output used as input in industry i and Yi is thetotal output of industry i. On the other hand, we use 1996 I-O use table to
calibrate the parameter values sij's. , where Xij is the amount ofj
ijij Y
Xs =
industry j output used as input in industry i and Yj is the total output ofindustry j.
CROSS-INDUSTRY EFFECTS OF INDIVIDUAL B2B GAIN
In this section, we examine how a B2B productivity gain getspropagated to other industries. First we look into the effects on real output in

63
Journal of Strategic E-Commerce, Volume 2, Number 2, 2004
different industries of a one percent increase in productivity in a particularindustry. We then use the potential savings and Internet penetration ratiosestimated by Goldman Sachs for different industries to estimate the potentialoutput gain in the economy, as implied by our model.
What Does a 1 Percent Productivity Gain in an Industry Imply for RealOutput across Industries?
Figure 2 illustrates how a one percent productivity gain14 in each ofthe thirty-five industries affects real output across industries. As we can seefrom this figure, for each industry the effects on other industries are bothpositive and negative. It is difficult to discern a general pattern. As we havediscussed, positive supply shock and negative demand shocks aresimultaneously at work to determine cross-industry effects of B2B gain.However, the net effect depends on the relative strength of the demand andsupply factors.
Figure 2Cross-industry effects of 1 percent increase in productivity due to B2B e-commerce
0 10 20 30-2
0
2
4
% c
ha
ng
e i
n y
Agriculture
0 10 20 30-0.5
0
0.5
1Metal mining
0 10 20 30-1
0
1
2Coal mining
0 10 20 30-1
0
1
2
% c
ha
ng
e i
n y
Crude petroleum and natural gas
0 10 20 30-0.5
0
0.5
1Mineral mining
0 10 20 30-5
0
5Construction
0 10 20 30-4
-2
0
2
% c
ha
ng
e i
n y
Food and kindred products
0 10 20 30-0.2
0
0.2Tobacco products
0 10 20 30-1
0
1
2Textile

64
Journal of Strategic E-Commerce, Volume 2, Number 2, 2004
0 10 20 30-0.5
0
0.5%
ch
an
ge
in
y
Apparel
0 10 20 30-1
0
1Lumber and wood
0 10 20 30-0.5
0
0.5Furniture and fixtures
0 10 20 30-2
0
2
% c
ha
ng
e i
n y
Paper
0 10 20 30 40-1
0
1Printing
0 10 20 30-2
0
2
4Chemicals
0 10 20 30-1
0
1
2
Industries
% c
ha
ng
e i
n y
Petroleum refining
0 10 20 30-1
0
1
Industries
Rubber
0 10 20 30
0
0.2
0.4
0.6
Industries
Footwear,leather and..
0 10 20 30-1
0
1
2
% c
hang
e in
y
Stone
0 10 20 30-2
0
2Primary metal
0 10 20 30-2
0
2Fabricated metal
0 10 20 30-2
0
2
% c
hang
e in
y
Machinery
0 10 20 30-2
0
2
4Electrical machinery
0 10 20 30-2
0
2Motor vehicle
0 10 20 30-0.2
0
0.2
% c
hang
e in
y
Transportation equip
0 10 20 30-1
0
1Instruments
0 10 20 30-0.5
0
0.5Misc manufacturing

65
Journal of Strategic E-Commerce, Volume 2, Number 2, 2004
0 10 20 30-5
0
5
% c
ha
ng
e i
n y
Transportation
0 10 20 30-2
0
2Communications
0 10 20 30-2
0
2Elec tric utility
0 10 20 30-1
0
1
2
% c
ha
ng
e i
n y
Gas production and dis t
0 10 20 30-10
0
10W holesale and retail trade
0 10 20 30-20
0
20FIRE
0 10 20 30-20
0
20
Industries
% c
ha
ng
e i
n y
Services
0 10 20 30-1
0
1
Industries
Government Enterprises
From the figure, we can make a few general observations. First, whenpredominantly intermediate inputs or investment goods producingindustries15 experience B2B gain, the magnitudes of changes in real outputacross industries are relatively large. For example, B2B gain to intermediategoods producing industries such as 'agriculture', 'crude petroleum and naturalgas', 'chemicals', 'petroleum refining', 'primary metal', 'electrical machinery','transportation' and 'communications' and investment goods producingindustries such as 'construction' and 'machinery' have large impact acrossindustries. Second, three service industries, namely, 'wholesale and retailtrade', 'finance, insurance and real estate' and 'services' have the largestimpact across industries. As we can see from Table 1, more than half of theiroutput is used for consumption purposes. Third, direct effects are not always positive. For example, the 'construction'industry and 'transportation' experienced negative direct effects. This impliesthat in these industries, the demand factors are more powerful so much sothat the negative effects outweigh the positive impact of the productivitygain.

66
Journal of Strategic E-Commerce, Volume 2, Number 2, 2004
Table 1: Fractions of gross output in different uses by industry in 1996
Commodity/ Industry Inter-mediateinputs
Consump-tion
Gross invest-ment
Govt.purchase
NetExportsExports-Imports
Total
1 Agriculture 0.835 0.116 0.000 0.009 0.022 1.0
2 Metal mining 0.705 0.000 0.074 -0.023 0.251 1.0
3 Coal mining 0.885 0.002 0.000 0.004 0.098 1.0
4 Crude petroleumand natural gas
1.551 0.000 0.001 -0.004 -0.551 1.0
5 Mineral mining 0.979 0.003 0.000 0.005 -0.021 1.0
6 Construction 0.227 0.000 0.555 0.218 0.000 1.0
7 Food and kindredproducts
0.384 0.589 0.000 0.024 -0.001 1.0
8 Tobacco products 0.067 0.796 0.000 -0.001 0.131 1.0
9 Textile 0.849 0.134 0.044 0.007 -0.024 1.0
10 Apparel 0.334 1.107 0.000 0.030 -0.475 1.0
11 Lumber and woodproducts
0.946 0.026 0.080 0.002 -0.058 1.0
12 Furniture andfixtures
0.158 0.512 0.381 0.063 -0.119 1.0
13 Paper 0.876 0.113 0.000 0.033 -0.018 1.0
14 Printing 0.601 0.304 0.000 0.083 0.009 1.0
15 Chemicals 0.673 0.264 0.005 0.049 0.001 1.0
16 Petroleum refiningand relatedproducts
0.569 0.346 0.000 0.099 -0.024 1.0
17 Rubber 0.897 0.127 0.002 0.023 -0.056 1.0

67
Table 1: Fractions of gross output in different uses by industry in 1996
Commodity/ Industry Inter-mediateinputs
Consump-tion
Gross invest-ment
Govt.purchase
NetExportsExports-Imports
Total
Journal of Strategic E-Commerce, Volume 2, Number 2, 2004
18 Footwear, leather,and leatherproducts
0.481 2.152 0.000 0.031 -1.692 1.0
19 Stone 0.993 0.058 0.000 0.012 -0.070 1.0
20 Primary metal 1.096 0.001 0.001 0.005 -0.112 1.0
21 Fabricated metal 0.920 0.037 0.042 0.019 -0.027 1.0
22 Machinery 0.457 0.038 0.510 0.048 -0.054 1.0
23 Electricalmachinery
0.722 0.165 0.175 0.054 -0.118 1.0
24 Motor vehicle 0.321 0.300 0.360 0.104 -0.093 1.0
25 Transportationequipment
0.109 0.421 0.244 0.247 -0.030 1.0
26 Instruments 0.304 0.095 0.408 0.197 -0.005 1.0
27 Miscellaneous manufacturing
0.312 0.949 0.151 0.058 -0.490 1.0
28 Transportation 0.583 0.238 0.020 0.051 0.107 1.0
29 Communications 0.475 0.433 0.021 0.055 0.015 1.0
30 Electric utility 0.489 0.413 0.000 0.102 -0.003 1.0
31 Gas production and distribution
0.628 0.320 0.000 0.048 0.004 1.0
32 Wholesale and retail trade
0.301 0.555 0.068 0.015 0.059 1.0
33 Finance, insuranceand real estate(FIRE)
0.374 0.561 0.019 0.018 0.028 1.0

68
Table 1: Fractions of gross output in different uses by industry in 1996
Commodity/ Industry Inter-mediateinputs
Consump-tion
Gross invest-ment
Govt.purchase
NetExportsExports-Imports
Total
Journal of Strategic E-Commerce, Volume 2, Number 2, 2004
34 Services 0.391 0.570 0.037 -0.004 0.006 1.0
35 Governmententerprises
0.563 0.377 0.000 0.057 0.003 1.0
Source: Compiled from the 1996 Input-Output Use Table, Bureau of Economic Analysis
This model can be used to quantitatively evaluate the impact of B2Bgain. We shall illustrate this with an example. Note that the matrix y in theΠy appendix describes how B2B gain to an industry affects other industriesthrough input-output linkages. Each column represents the percentagechanges in output of different industries as a result of 1 percent productivitygain that a particular industry experiences as a result of B2B e-commerce.For example, the first column represents the percentage changes in output of35 industries when the 'Agriculture' industry experiences a 1 percentproductivity gain due to B2B e-commerce. In order to calculate overalleffects in terms of change in total output as a result of 1 percent increase inproductivity in each of the 35 industries we follow the following steps:
1) First we calculate changes in output of individualindustries by applying the percentage changes along thecorresponding column of the y to respective gross output.ΠyFor example, when the agriculture industry experience 1percent productivity growth, we apply the percentage changesalong the first column to the gross output of 35 industries in1996.

69
Journal of Strategic E-Commerce, Volume 2, Number 2, 2004
2) We then add up the changes in individualindustries to obtain the overall effect of B2B gain in theagriculture industry. However, this total effect can be dividedinto 'direct effect' and 'indirect effect'. Note that the diagonalelements of y represent direct effects of B2B gain. OnceΠy we calculate total effects and direct effects, we can obtainindirect effects by subtracting the direct effects from the totaleffects.
We use 1996 GPO data obtained from the Bureau of Economic Analysis toillustrate how we use the model to calculate the effects. The results arereported in Table 2. As we can see, B2B e-commerce in 'Services', 'Finance,insurance and real estate' and 'Wholesale and retail trade' industry has thelargest effects in terms of overall changes in output. These industries alsohave relatively large direct effects. B2B gain in the 'Construction' industry,on the other hand, has a large negative direct effect.
Table 2: Direct and Indirect Effects of B2B Gain: An Example(Values in billions of 1996 dollar)
Industry experiencing B2B gain Direct effect Indirecteffect
Total effect
1 Agriculture 3.48 5.57 9.05
2 Metal mining 0.05 0.62 0.68
3 Coal mining 0.14 0.98 1.12
4 Crude petroleum and naturalgas
1.10 7.15 8.25
5 Mineral mining 0.10 0.35 0.45
6 Construction -10.09 24.79 14.71
7 Food and kindred products 1.19 7.36 8.55

70
Table 2: Direct and Indirect Effects of B2B Gain: An Example(Values in billions of 1996 dollar)
Industry experiencing B2B gain Direct effect Indirecteffect
Total effect
Journal of Strategic E-Commerce, Volume 2, Number 2, 2004
8 Tobacco products 0.00 0.19 0.19
9 Textile 0.25 0.69 0.94
10 Apparel 0.01 1.15 1.16
11 Lumber and wood products 0.37 2.66 3.03
12 Furniture and fixtures 0.04 0.50 0.54
13 Paper 0.65 3.93 4.58
14 Printing 0.90 2.17 3.07
15 Chemicals 1.63 6.60 8.22
16 Petroleum refining and relatedproducts
0.28 4.64 4.91
17 Rubber 0.14 4.95 5.08
18 Footwear, leather, and leatherproducts
0.03 0.14 0.17
19 Stone 0.37 3.01 3.38
20 Primary metal 0.75 5.65 6.41
21 Fabricated metal 1.45 3.34 4.79
22 Machinery 0.35 6.78 7.13
23 Electrical machinery 1.85 8.27 10.11
24 Motor vehicle 0.59 4.00 4.58
25 Transportation equipment 0.08 0.40 0.48
26 Instruments 0.29 2.04 2.34
27 Miscellaneous manufacturing 0.11 0.95 1.06

71
Table 2: Direct and Indirect Effects of B2B Gain: An Example(Values in billions of 1996 dollar)
Industry experiencing B2B gain Direct effect Indirecteffect
Total effect
Journal of Strategic E-Commerce, Volume 2, Number 2, 2004
28 Transportation -1.09 19.30 18.21
29 Communications 0.06 8.39 8.45
30 Electric utility 1.76 5.78 7.54
31 Gas production anddistribution
5.34 2.83 8.16
32 Wholesale and retail trade 7.30 24.61 31.92
33 Finance, insurance and realestate (FIRE)
25.01 29.10 54.11
34 Services 40.14 42.06 82.20
35 Government enterprises 8.50 0.44 8.94
Note: The assumption is that there is 100 percent penetration of B2B.Source: Authors' calculations
How Much Does the Economy Gain if the Cost Savings are as High asEstimated?
In the study 'E-Commerce/Internet' conducted by Goldman Sachs, thepercentage savings made possible by adopting B2B throughout specificindustries have been estimated (see Table 2 in Goldman Sachs(1999)). At theend of the report they also provide the Internet penetration ratios for differentindustries. These are the estimated percentage shares of total sales that are orwould be Internet based between 1998 and 2004. These two sets of industriesthey have studied do not match exactly. However there are a few overlappingindustries. We take these overlapping or roughly matching industries fromthese two tables and match with the industrial categories we are considering

72
Journal of Strategic E-Commerce, Volume 2, Number 2, 2004
in this paper. We select seven of our thirty-five industries, which roughlymatch their industries. Table 3 presents the estimated cost savings andInternet penetration ratios for the years 2000, 2002 and 2004 for theseindustries. We multiply the cost saving figures with the Internet penetrationratios to arrive at total cost saving for each of these industries. Then wecalculate the total gain in terms of increase in real GPO for the economy asimplied by our model. We take one industry at a time and see the direct,indirect and total effects of introducing B2B e-commerce. The results arepresented in Table 4.
Table 3: Estimated savings and penetration of B2B in selected industries for 2000,2002 and 2004
Industry* with B2BEstimatedsavings@
Estimated penetration of B2B(% share of projected sale based
on Internet)
2000 2002 2004
Coal mining 2.0% 4.5 10.0 16.0
Crude petroleum and naturalgas
10.0% 4.5 10.0 16.0
Food and kindred products 4.50% 1.1 1.3 1.6
Paper 10.0% 1.2 6.7 12.2
Chemicals 10.0% 5.0 10.5 20.0
Transportation 15.0% 2.5 6.5 11.0
Communications 10.0% 1.5 5.5 11.0
Notes: * The specific industries studied by Goldman Sachs have roughly beenmatched with our classification of industries@ Wherever estimated savings are given by a range we have taken theaverage.
Source: Compiled from Table 2 and Table 8 of Goldman Sachs(1999)

73
Journal of Strategic E-Commerce, Volume 2, Number 2, 2004
Table 4: Estimated direct and indirect effects of B2B in selected industries for the years2000,2002 and 2004: Changes in real gross value added
(millions of 1996 constant dollars)
Industry2000 2002 2004
Directeffect
Indirecteffect
Totaleffect
Directeffect
Indirecteffect
Totaleffect
Directeffect
Indirecteffect
Totaleffect
Coal mining 16 112.8 128.8 39.2 285.6 324.8 68.8 532.1 600.9
Crudepetroleum and natural gas
328.8 3839.4 4168.2 577.3 8988.9 9566.2 721.8 14862.7 15584.5
Food andkindredproducts
41.5 420.6 462.1 42.3 579.4 621.7 44.5 860.5 905
Paper 95.8 559.7 655.5 574.8 3467 4041.8 1112.8 7258.7 8371.5
Chemicals 935.5 3635.7 4571.2 2039 7989.9 10028.9 3987.3 16232 20219.3
Transportation -467.1 8914.2 8447.1 -1256.6 26153 24896.4 -2176.7 51451.5 49274.8
Communication 7.7 1106.1 1113.8 28.9 4389.9 4418.8 58.8 9694.3 9753.1
Total 958.2 18588.5 19546.7 2044.9 51853.7 53898.6 3817.3 100892 104709
Total effect as% of real GDP
0.01 0.20 0.21 0.02 0.53 0.55 0.04 0.96 1.00
Share of these 7industries inrealGDP
10.00 9.42 8.81
Notes: Gross value-added at 1992 constant dollars by industries are available from BEA until 1997. In orderto be consistent with the 1996 I-O tables we converted them into 1996 constant dollars. Then weforecast GPO for the years 1998-2004 using growth rates for 1996.Note that we could have used theaverage growth rates for the decade of the 1990s. Since the beginning of the 1990s is characterizedby recession that would not yield good forecasts.
Source : Authors' calculations

74
Journal of Strategic E-Commerce, Volume 2, Number 2, 2004
We observe that B2B gain in the transportation industry would havethe largest impact in the economy. Interestingly enough, it has negativeimpact on its own real output. However, the indirect effects are substantial.'Transportation' is followed by 'chemicals' and 'crude petroleum and naturalgas' respectively. The gain from B2B in the 'transportation' industry wouldgrow by more than five times, those from the 'chemicals' industry and the'crude petroleum' industry by more than four times and more than three timesrespectively. In case of all industries that we have considered here, theindirect effects are several times higher than direct effects. It may be notedthat the increase in the total gain from introducing B2B in the 'paper' industrywould grow dramatically over the years. As for the overall impact, we see inlast two rows that the total increase in output due to B2B in these sevenindustries accounts for only 0.21 percent of the US real GDP in 2000whereas these seven industries together account for 10 percent. In 2004, thisincrease would account for 1 percent of real GDP whereas the projectedshare of these industries is only about 9 percent. However, one should keepin mind that these estimated numbers are not actual projection of the outputgain in the economy. Nevertheless, given the data limitations this is the bestwe can do. Moreover, they give a very good idea of potential gain from B2B.
CONCLUDING REMARKS
In this paper, we examine cross-industry effects of the productivitygain that emanates from B2B e-commerce in various sectors. Within thesimple framework of a multi-industry equilibrium model we introduce B2Be-commerce as an exogenously given productivity gain. Then we let thesectors interact among themselves to see how this exogenous productivitygain leads to change their input decisions, which eventually change price andoutput in each sector, by changing supply and demand. We observe that aB2B productivity rise in industries that mainly supply intermediate inputs orinvestment goods leads to fall in prices in a wider range of industries. In caseof consumption goods industries, on the other hand, the effects are industryspecific.
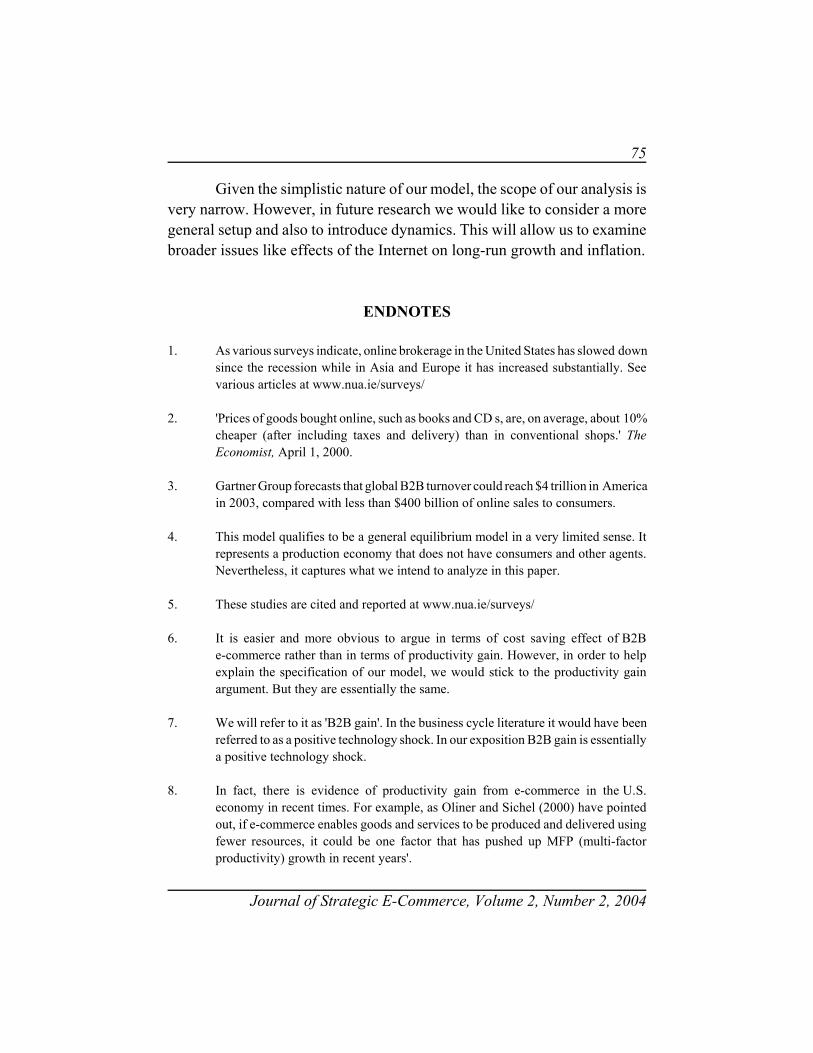
75
Journal of Strategic E-Commerce, Volume 2, Number 2, 2004
Given the simplistic nature of our model, the scope of our analysis isvery narrow. However, in future research we would like to consider a moregeneral setup and also to introduce dynamics. This will allow us to examinebroader issues like effects of the Internet on long-run growth and inflation.
ENDNOTES
1. As various surveys indicate, online brokerage in the United States has slowed downsince the recession while in Asia and Europe it has increased substantially. Seevarious articles at www.nua.ie/surveys/
2. 'Prices of goods bought online, such as books and CD s, are, on average, about 10%cheaper (after including taxes and delivery) than in conventional shops.' TheEconomist, April 1, 2000.
3. Gartner Group forecasts that global B2B turnover could reach $4 trillion in Americain 2003, compared with less than $400 billion of online sales to consumers.
4. This model qualifies to be a general equilibrium model in a very limited sense. Itrepresents a production economy that does not have consumers and other agents.Nevertheless, it captures what we intend to analyze in this paper.
5. These studies are cited and reported at www.nua.ie/surveys/
6. It is easier and more obvious to argue in terms of cost saving effect of B2Be-commerce rather than in terms of productivity gain. However, in order to helpexplain the specification of our model, we would stick to the productivity gainargument. But they are essentially the same.
7. We will refer to it as 'B2B gain'. In the business cycle literature it would have beenreferred to as a positive technology shock. In our exposition B2B gain is essentiallya positive technology shock.
8. In fact, there is evidence of productivity gain from e-commerce in the U.S.economy in recent times. For example, as Oliner and Sichel (2000) have pointedout, if e-commerce enables goods and services to be produced and delivered usingfewer resources, it could be one factor that has pushed up MFP (multi-factorproductivity) growth in recent years'.

76
Journal of Strategic E-Commerce, Volume 2, Number 2, 2004
9. The Cobb-Douglas production function is the most widely used production functionin economics. Its wider acceptance is rooted in the fact that one of its inventors PaulDouglas inferred its properties from empirical observations of the USmanufacturing during 1899-1922. Even now empirically, Cobb Douglas form wellrepresents the production technology. In addition to the empirical appeal it has niceproperties such as convexity, twice differentiability and homogeneity. For detaileddiscussion see Heathfield and Wibe (1987) and Johansen (1972). In recent times,most of the business cycle literature uses CD production function. For example, seeKing, Plosser and Rebelo (1988).
10. Actually this is the output of a typical firm in industry i. Since firms are identicalwe will use industry and firm interchangeably.
11. It could be any technological change that affects productivity.
12. A list of these thirty-five industries along with the uses of their output is providedin Table
13. I-O classification is slightly different from SIC classification.
REFERENCES
Center for Research in Electronic Commerce (2000). Measuring the Internet Economy.Austin, TX: University of Texas and Cisco Systems.
Goldman Sachs Investment Research (1999). E-commerce/ Internet.
Gordon, R. J. (2000). Does the "new economy" measure up to the great inventions of thepast? Forthcoming, Journal of Economic Perspective.
Heathfield, D. F. & S. Wibe (1987). An introduction to cost and production functions.Atlantic Highlands, NJ: Humanities Press International, Inc.
Internet, impact on business efficiency and economic growth: A thinkers guide. (2000). TheEconomist, April 1.
Johansen, L. (1972). Production functions. Amsterdam: North-Holland PublishingCompany.

77
Journal of Strategic E-Commerce, Volume 2, Number 2, 2004
Jorgenson, D. G., F. Gollop & B. Fraumeni (1987). Productivity and U.S. economic growth. Cambridge, MA: Harvard University Press.
Jorgenson, D.G. & K. J. Stiroh (2000). Raising the speed limit: U.S. economic growth in theinformation age. Manuscript.
Long, Jr., J. B. & C. Plosser (1983). Real business cycles. Journal of Political Economy,91, 39-69.
Oliner, S. D. & D. E. Sichel (2000). The resurgence of growth in the late 1990s: Isinformation technology the story? Manuscript.
Productivity on stilts. (2000). The Economist, June 10.
Shapiro, C. & H. R. Varian (1999). Information rules: A strategic guide to the networkeconomy. Boston: Harvard Business School Press.
U.S. Department of Commerce: Bureau of Economic Analysis (1994). Benchmarkinput-output accounts for the U.S. economy, 1987. Survey of Current Business 74.
APPENDIX: PROOF OF THEOREM 1
Firm i maximizes short-run profit given by
(A.1) ∑=
−=Πn
1jijjiii XPYP
subject to the constraint imposed by the technology
(A.2)∏=
=n
1j
ijaijii XZY
The resource constraint for each sector i is given by
(A.3)∑=
+=n
1jjiii XFY
Substituting (A.2) into (A.1) and taking first-order derivative of i with respect to Xij, weobtain the following first-order condition

78
Journal of Strategic E-Commerce, Volume 2, Number 2, 2004
(A.4)0PXXZPa jjk
ikaik
1ijaijiiij =−∏
≠
−
for all i, j = 1,2,….n
After algebraic manipulation and substitution of (A.2), we can rewrite (A.4) as
(A.5)ijjiiij XPYPa =
Note that (A.2), (A.3) and (A.5) provide a system of n2 + 2n non-linear equations in n2 + 2nunknowns. This system can be solved for X, Y and Ps as functions of Zs. Let iiij P&Y,Xbe the solutions of X, Y and P in terms of .ii ZZ =
However, in this model we are interested in the effects of displacements in totalfactor productivity from on the choices of variables X, Y and Ps. Let us defines'Zi
where lower case letters denotei
iii
i
iii
i
iii
ij
ijijij Z
ZZz&
PPP
p,Y
YYy,
X
XXx
−=
−=
−=
−=
percentage deviations from the equilibrium solutions. Now in order to obtain linear solutions of these transformed variables in terms of
z's we first take logarithmic transformation of (A.5)
(A.6))Xlog()Plog()Ylog()Plog()alog( ijjiiij +=++
Using first-order Taylor series expansion around on both sides we obtainiiij P&Y,X
)XX(X1)PP(
P1)Xlog()Plog(
)YY(Y1)PP(
P1)Ylog()Plog()alog(
ijijij
jjj
ijj
iii
iii
iiij
−+−++=
−+−+++
Using (A.6) and notations we have already introduced we can rewrite this as
(A.7)ijjii xpyp +=+

79
Journal of Strategic E-Commerce, Volume 2, Number 2, 2004
Similarly, logarithmic transformation of the production function (A.2) first-order Taylorseries expansion yield,
(A.8)∑=
+=n
1jijijii xazy
Taking logarithm of the resource constraint, we obtain
(A.9)∑=
+=n
1jjiii )XFlog()Ylog(
Using first-order Taylor series expansion around and we now obtainiY jiX
)XX(X
)XF(.
XF
1.......................
......)XX(X
)XF(.
XF
1)YY(Y1
nini
jiXjiX
ni
n
1jjii
n
1jjii
i1i1
jiXjiX
i1
n
1jjii
n
1jjii
iii
−∂
+∂
+++
+−∂
+∂
+=−
=
=
=
=
=
=
∑
∑
∑
∑
After algebraic manipulation, we can rewrite the above equation as
ni
nini
i
ni
i1
i1i1
i
i1
i
ii
X)XX(
YX...
X)XX(
YX
Y)YY( −
++−
=−
or,
(A.10)∑=
=n
1jjijii xsy
where . Now substituting for y from (A.8) into (A.7) and (A.10), we obtaini
jiji Y
Xs =
(A.11)ijj
n
1jijijii xpxazp +=++ ∑
=
and

80
Journal of Strategic E-Commerce, Volume 2, Number 2, 2004
(A.12)∑∑==
=+n
1jjiji
n
1jijiji xsxaz
for all i, j = 1,2, ……,n
In matrix form we can write equations (A.11) and (A.12) as follows
Mv = Ez (A.13)
where M is a (n2+n)x (n2+n) matrix containing parameters a's, s's, 1's and 0's; v is a (n2+n)x1vector of x's and p's; E is a (n2+n)xn matrix of 1's and 0's and z is an nx1 vector of exogenousproductivity displacements. Rewriting (A.13), v = M-1 Ez
or, v = z (A.14)Π We can partition the vectors and matrix to derive the explicit solutions as follows:
(A.15)z p
x
p
x
Π−Π
=
−
where x is an (n2 x 1) vector of intermediate inputs (in percentage deviation form) and p isan (n x 1) vector of prices. is an (n2 x n) matrix that describes how B2B gain affectsΠx intermediate inputs and p is an (n x n) matrix that describes how B2B gain affects prices. Π
Thus, (A.16)zp pΠ=and from (A.8) we obtain
(A.17)( ) zz AIy yx Π=Π+=
where is an (n x n) matrix. Note that A is an (n x n2) matrix of aijs and 0s.xy AI Π+=Π

81
Journal of Strategic E-Commerce, Volume 2, Number 2, 2004
A HYBRID WEB-CENTRIC ANDPEER-TO-PEER
ARCHITECTURE FORCONSUMER-TO-CONSUMER
E-COMMERCE
James Otto, Towson UniversityWilliam Wagner, Villanova University
Vik Pant, Ixos Software, AG.
ABSTRACT
An exciting area of growth in the world of E-Commerce has been therapid rise of the Peer-to-Peer (P2P) architecture. While popular, aswitnessed by the widespread use of file sharing programs such as KaZaa andMorpheus, this architecture has not yet been leveraged into a profitablebusiness model. This paper proposes a new architecture forConsumer-to-Consumer E-Commerce that combines the flexibility of the P2Parchitecture, with the more stable web-centric architecture. These twoarchitectures are analyzed from the perspectives of their relative informationusefulness and mercantile activities they will support. After a discussion ofthe tradeoffs of each architecture, a C2C business model that takesadvantage of the relative strengths of a hybrid P2P and Web-Centricarchitecture is presented.
INTRODUCTION
This paper analyzes the tradeoffs between a distributed peer-to-peer(P2P) architecture and a web-centric architecture (the dominant e-commerce

82
Journal of Strategic E-Commerce, Volume 2, Number 2, 2004
architecture) for consumer-to-consumer (C2C) online market makers. Theanalysis is used to compare the relative utility of both P2P and Web-centricarchitectures to support C2C transactions from information usefulness andmercantile activities perspectives. The paper then suggests a potential C2Cbusiness model based on a hybrid P2P and Web-Centric architecture.
The analysis of architecture and its fit to business processes isimportant because the alignment of architecture with user processes isrelevant to the success of organizational goals (Carleton, 2002; Eisenmann2002). Since C2C mercantile interactions are fundamentally the transfer ofinformation, goods and services, and payments between consumer peers, itmakes sense that P2P based information architectures be considered for C2Cinteractions and business models.
This paper addresses online market makers - electronic intermediariesthat provide market services to participants by providing an infrastructureand place to trade along with rules to govern trading. Specifically, weaddress the online market maker business model for P2P C2C.
There are numerous business models supporting online marketmakers that can be categorized by product focus, transaction type, andaffiliation as outlined in Table 1 (Eisenmann, 2002). The last column ofTable 1 categorizes the scope of this paper.
Table 1. Online Market Maker Business Models
Category Characteristics Scope of this paper
Participants Consumers (C): Consumers represents oneor more of the transaction participants (e.g.,B2C, C2C, G2C, etc.)
Consumer-to-Consumer Participants
Business (B): A business entity representsone or more of the transaction participants(e.g., B2B, B2C, B2G, etc.)
Government (G): A governmental entityrepresents one or more of the transactionparticipants (e.g., G2B, G2C, G2G, etc.)

83
Table 1. Online Market Maker Business Models
Category Characteristics Scope of this paper
Journal of Strategic E-Commerce, Volume 2, Number 2, 2004
ProductFocus
Customized: Nonstandard products thatrequire a significant amount ofcommunication to satisfy buyer Standardized Products
Standardized: Well understood productsthat do not require extensive discussions
MarketParadigm
Horizontal: Diverse customer base purchasethe products Horizontal Markets
Vertical: products restricted to a specificbuyer pool
ProductKind
Direct: Items incorporated into a productIndirect Products
Indirect: Items used to support activities
TransactionType
Catalog: Lists of standardized productsfrom multiple sources
Catalog TransactionsAuctions: Buyers (or sellers) bid forproducts
Exchanges: Continuous auctions forstandardized products with fluctuatingsupply, demand, and price
Affiliation Buyer: Biased exchange terms towardsbuyers.
Neutral AffiliationSeller: Biased exchange terms towardssellers
Neutral: Unbiased exchange terms.
As shown in Table 1, this paper addresses the market for C2Cparticipants, standardized, horizontal, and indirect products, catalogtransactions, with a neutral affiliation. A good example of this type of

84
Journal of Strategic E-Commerce, Volume 2, Number 2, 2004
market is the traditional newspaper classified consumer advertisements forwell understood products such as cars or appliances. The classified sectionof the newspaper provides a forum for catalog information for sellers for afee. This same type of consumer classified market is available online forweb-centric architectures. For example, see Figure 1.
Figure 1. Cars.Com Provides A Web-Centric C2C (and B2C) Classified CarMarketplace
We chose this market segment because it is less complex than manyother markets and it is essentially P2P once the buyer and seller find oneanother. In other markets, a variety of complex services may be necessaryto accompany the transactions. For example, in auction markets, biddingmust be tracked over time using relatively complex rules. In B2B markets,a variety of more exotic business support services can be required, such asrequest for information (RFI) document generation, requisition and routingapproval, financial settlement of orders, controls over who can seeinformation, assurance that transactions are in accordance with regulations,laws, and pre-negotiated contracts, etc. (Katerattanakul, 2002; Smaros,2001).
For our tradeoff analysis, we assume that the P2P architecture is notcentrally controlled or managed whereas the Web-centric architecture

85
Journal of Strategic E-Commerce, Volume 2, Number 2, 2004
institutes centralized control over user information and activities. We alsoassume that C2C sellers have an always-on connection (such as DigitalSubscriber Line (DSL) or cable modem), as opposed to a dial-up connection.If the user does not possess an always-on connection, then the analysisbecomes trivial because the 24/7 availability of a Web server dominates anytradeoffs.
OVERVIEW OF P2P AND WEB CENTRIC ARCHITECTURES
According to WhatIs.com, "…peer-to-peer is a communicationsmodel in which each party has the same capabilities and either party caninitiate a communication session." (TechTarget, 2003). This means that thereis no intermediary between the parties (except for their internet serviceproviders). For P2P connectivity to function on the Internet, users connectto each other via the other party's IP address. Since every device (computer,PDA, etc.) or service (routing, bridging, etc.) connected to the Internet hasa unique IP address, it (IP address) is very helpful in identifying and locatingthese devices/services. As displayed in Figure 2, since both parties in a P2Pconnection have the capability of being clients and servers, they are termed"hosts" or "nodes".
Figure 2. Sample of Direct Peer-to-Peer Connectivity
P2P Host (sample IP: a.b.c.d)
Key: (1) Connecting to IP: w.x.y.z (2) Connecting to IP: a.b.c.d
(1)
(2)
P2P Host (sample IP: w.x.y.z)

86
Journal of Strategic E-Commerce, Volume 2, Number 2, 2004
It is the decision of the user to provide services or consume them.If the user chooses to be a provider then he or she can determine limits onservices/resources that can be used. These limits can be based on a varietyof factors such as security privilege and usage history of connected peer, andalso on system load, bandwidth usage, network throughput, time of day, etc.
A Web-Centric Architecture is a type of client/server architecture.In such an architecture, one (or many) machine(s) produce and provide theservices and one (or many) machine(s) acquire and consume these services.According to Webopedia.com, client/server architecture is, "a networkarchitecture in which each computer or process on the network is either aclient or a server. Servers are powerful computers or processes dedicated tomanaging disk drives (file servers), printers (print servers), or network traffic(network servers). Clients are PCs or workstations on which users runapplications. Clients rely on servers for resources, such as files, devices, andeven processing power" (Webopedia.com, 2003). A Web-Centricarchitecture is the architecture that defines the World Wide Web. In such anarchitecture, there is a clear demarcation between the producer and theconsumer of the services that interact with each other over the Internet. Ina Web-Centric architecture, some computers are dedicated to providingservices to others. In most cases, applications implemented over theclient/server architecture, such as WWW websites, are meant to serve manyclients at the same time.
ANALYSIS OF PEER-TO-PEER AND WEB-CENTRICARCHITECTURE TRADEOFFS
Our framework contrasts the general architectural tradeoffs of P2Pand Web-centric (client-server) architectures. We recognize that thesetradeoffs will vary depending upon the specific application context, so weprovide an explanation of how these tradeoffs apply. Using this information,the reader can adjust the analysis to fit their specific context.
Alter (2002) has proposed a series of criteria for evaluatingE-Commerce models using an information perspective. These are

87
Journal of Strategic E-Commerce, Volume 2, Number 2, 2004
summarized in Table 2 and are used as a basis for comparing the relativeadvantages of the P2P and Web-centric architectures from an e-commerceconsumer perspective. This evaluation also assumes that the user interfacecriteria (such as usability, user friendliness, responsiveness - etc.) can bemade equivalent between the two architectures by proper design of the userinterface layer. Since the transactions between buyer and seller over theInternet largely involve information exchange, the criteria are discussed ininformation terms.
Table 2. Evaluation Criteria from an Information Perspective
Web-Centric P2P
Information Quality
Accuracy +
Precision +
Age +
Completeness +
Timeliness +
Source +
Information Availability
Availability +
Admissibility +
Information Expense +
Information Security +
InformationPresentation
+
InformationStandardization
+
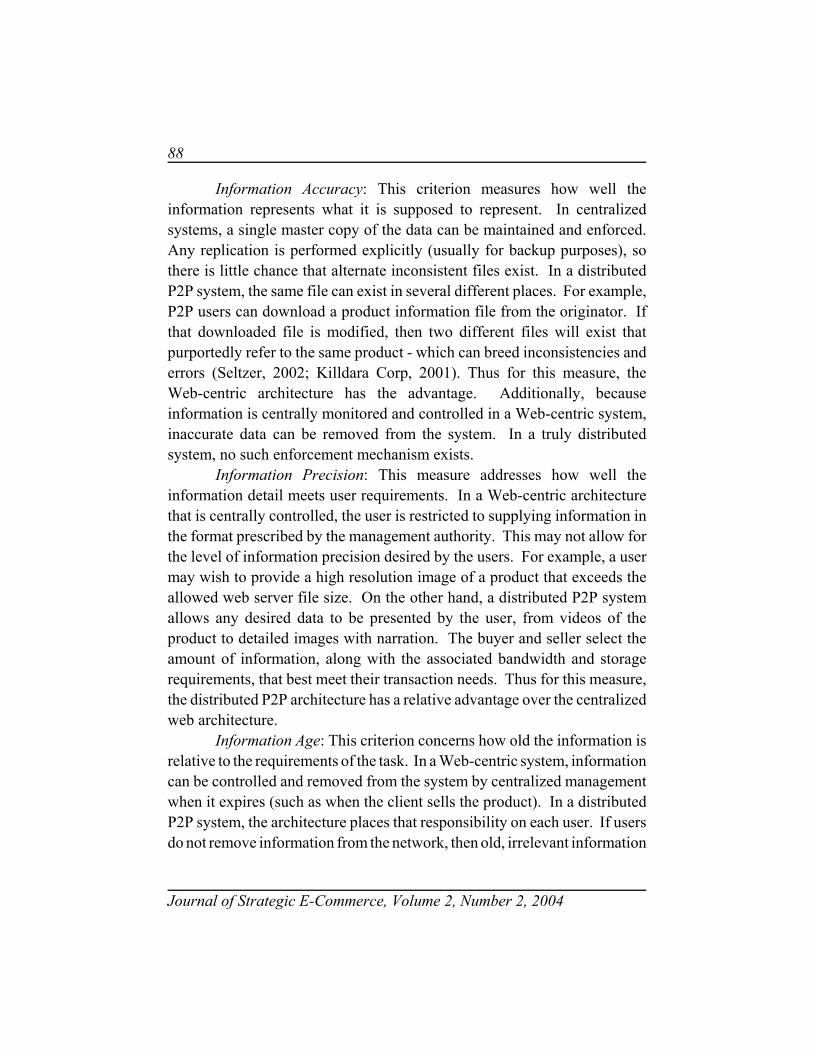
88
Journal of Strategic E-Commerce, Volume 2, Number 2, 2004
Information Accuracy: This criterion measures how well theinformation represents what it is supposed to represent. In centralizedsystems, a single master copy of the data can be maintained and enforced.Any replication is performed explicitly (usually for backup purposes), sothere is little chance that alternate inconsistent files exist. In a distributedP2P system, the same file can exist in several different places. For example,P2P users can download a product information file from the originator. Ifthat downloaded file is modified, then two different files will exist thatpurportedly refer to the same product - which can breed inconsistencies anderrors (Seltzer, 2002; Killdara Corp, 2001). Thus for this measure, theWeb-centric architecture has the advantage. Additionally, becauseinformation is centrally monitored and controlled in a Web-centric system,inaccurate data can be removed from the system. In a truly distributedsystem, no such enforcement mechanism exists.
Information Precision: This measure addresses how well theinformation detail meets user requirements. In a Web-centric architecturethat is centrally controlled, the user is restricted to supplying information inthe format prescribed by the management authority. This may not allow forthe level of information precision desired by the users. For example, a usermay wish to provide a high resolution image of a product that exceeds theallowed web server file size. On the other hand, a distributed P2P systemallows any desired data to be presented by the user, from videos of theproduct to detailed images with narration. The buyer and seller select theamount of information, along with the associated bandwidth and storagerequirements, that best meet their transaction needs. Thus for this measure,the distributed P2P architecture has a relative advantage over the centralizedweb architecture.
Information Age: This criterion concerns how old the information isrelative to the requirements of the task. In a Web-centric system, informationcan be controlled and removed from the system by centralized managementwhen it expires (such as when the client sells the product). In a distributedP2P system, the architecture places that responsibility on each user. If usersdo not remove information from the network, then old, irrelevant information

89
Journal of Strategic E-Commerce, Volume 2, Number 2, 2004
may still be available to users. Thus, the Web-centric architecture has anadvantage for this measure.
Information Completeness: This criterion addresses how adequate theamount of information is for the task at hand. The Web-centric architecture,which is centrally managed, can limit the amount and format of informationprovided by the seller or buyer. The P2P architecture only limits informationto that which can be handled by the bandwidth, storage, and formatconstraints of the buyers and sellers. Thus, the P2P architecture can providebetter information completeness due to its scalability (Smaros & Framling,2001). As an example, the amount of information stored and available tousers of KaZaA, a popular P2P application is huge. For example, at 8pm on16 March, 2004 the following statistics applied to Kazaa:
Over 2.5 million users online
Over 1.4 billion files
Over 4 petabytes (4 million gigabytes) of information
Information formats included audio, video, images, documents, software, and musicplaylists
Information Timeliness: This measures whether the information isprovided quickly enough to meet user needs. In the P2P architecture, theinformation is available immediately (Merkow, 2000) as soon as the usermoves the files into the shared folder. For the Web-centric system, the usermust explicitly communicate information to the administrators (Smaros &Framling, 2001) and may need to wait until the user and/or information isapproved for posting, which may reduce the timeliness of the data.Therefore, the P2P architecture has an advantage for information timeliness.
Information Source: This measure addresses the credentials of thesupplier of the information. Is the source credible, trustworthy, and free frombias? Web-centric systems, with their centralized control, can institute trustmechanisms to verify system users. For example, Ebay provides variousutilities for providing feedback on sellers and also for filing more formalcomplaints. These same types of verification methods are not as robust in a

90
Journal of Strategic E-Commerce, Volume 2, Number 2, 2004
distributed P2P system. Thus, the Web-centric architecture has an advantagefor this measure.
Information Availability: This measure addresses the extent to whichthe necessary information is available to the people that need it when it isrequired. In practical e-commerce terms, it is expected that data will beavailable 24 hours per day, 7 days per week (24/7). Web-centric systems canexplicitly manage the replication of data and system redundancies to copewith a failure or error. In a P2P system, redundancy can, but does notnecessarily, occur. For example files may be copied by prospective buyers,but this may not necessarily happen. Thus, if the file is copied by manyusers, it is possible that redundancy could be quite good (at the possibleexpense of information consistency). However, since there is no centralizedmanagement, replication of files is not explicitly required. Thus, it is alsopossible that redundant files may not exist in a P2P system. In a centrallycontrolled system, redundancy can be enforced. Additionally, 24/7availability requires that the information source be continuously operating.A centralized web server has people dedicated to keeping the web serveroperating. This level of reliability may not be available to your average P2Puser (Note that this analysis assumes that the P2P users have an always-oninternet connection). For these reasons, the Web-centric approach has anadvantage over P2P when it comes to information availability.
Information Admissibility: This criterion focuses on whether theinformation provided is socially, culturally, or legally appropriate. In aWeb-centric system, management can remove objectionable information,whereas this does not occur in a distributed P2P system. For example, Ebaymanagement removed items by individuals attempting to sell debris from theSpace Shuttle accident. This problem with P2P has also been heightened bythe wide press coverage of P2P sites such as Napster, which may be involvedin intellectual property thefts (Carleton, 2002). Thus, the Web-centricsystem has an advantage for this criterion (unless the seller or buyer arespecifically interested in exchanging inappropriate information).
Information Expense: This measure deals with the cost of executingtransactions. In the P2P architecture, client software interacts directly withother client software. The expenses associated with data storage and

91
Journal of Strategic E-Commerce, Volume 2, Number 2, 2004
bandwidth are borne by the client. With a Web-centric architecture, theseexpenses are borne by the manager of the Website. It is assumed that thesebandwidth and storage costs, plus any profit, are then passed on to the usersas fees (Smaros & Framling, 2001). If one assumes that a significant portionof user bandwidth and storage stands unused and idle, then the marginal costsof adding the P2P functionality will be small. Thus, from a user perspectivethe P2P architecture has an advantage.
Information Security: This measure addresses the level of protectionagainst unauthorized information access or alteration. Centrally managedsecurity can be more attentive and sophisticated than security that relies oneach user. It is well recognized that security is the Achilles heel of P2Papplications because of the average user's limited awareness of securityissues (Kalakota, Susarla, & Parameswaran, 2001). The Web-centricapproach has an advantage over P2P which has more places where securitycan be breached (Killdara Corp, 2001).
Information Presentation: This measure addresses how theinformation is presented and how appropriate it is for the desired application.Since P2P allows users to provide information in any format desired(Framling & Holstrom, 2000), it has an advantage of the centrally controlledWeb-centric architecture.
Information Standardization: This criterion measures how consistentinformation is across similar files. Standardization can help users becauseit supports a consistent view of information and easier information exchange.Since the Web-centric architecture supports the centralized management ofstandardization and can also provide translation services between differentinformation formats (Smaros & Framling, 2001), it has an advantage over theP2P architecture.
C2C TRANSACTIONS AND SUPPORTING E-COMMERCESERVICES
In this section we compare the P2P and Web-centric architecturesfrom the perspective of a consumer mercantile model. In C2C e-commerce,

92
Journal of Strategic E-Commerce, Volume 2, Number 2, 2004
the mercantile activities of the buyer and seller are listed below (Kalakota &Whinston, 1996).
‚ Product/service search‚ Comparison shopping and selection‚ Negotiation of terms‚ Placement of order‚ Authorization of payment‚ Receipt of product‚ Customer service and support
Table 3 compares the ability of the P2P and Web-centric architecturesto support e-commerce implementations of each of the consumer mercantileactivities. For each mercantile activity, Table 3 lists the activities from boththe buyer and seller perspectives and the electronic implementations ofservices that support those mercantile activities.
Table 3. Mercantile Activities Electronic Services
C2C Transaction
Buyer Seller EC ServicesProvided
Web-Centric Peer-to-Peer Other InternetTools
Product Search
Provide Info ElectronicProduct Search
WebsiteSearchEngines
P2P Search Engines
Web SearchEngines
ElectronicProductAdvertising (Push, Pull)
Websitecatalog
Peer catalogs Email(solicited andunsolicited)Newsgroups
Compare Alternatives
ProvideComparison Information
Online Reviews and ratingsComparisonChartsSeller Database
Website usergroupsWebsitereviewsSellerratingsdatabase
UsenetNewsgroupreviewsWeb periodicalreviews

93
Table 3. Mercantile Activities Electronic Services
C2C Transaction
Buyer Seller EC ServicesProvided
Web-Centric Peer-to-Peer Other InternetTools
Journal of Strategic E-Commerce, Volume 2, Number 2, 2004
Negotiation Negotiation Communication Channels (email, voicechat, text chat)TermsInformationTax/feeCalculation
TermsinformationTax/Fee CalculatorsInformationWeb chat
TermsInformationTax/Fee InformationP2P Chat
ProvidePayment
AcceptPayment
Electronic Credit Online creditcards
Electronic Debit Onlinepaymentsystem (e.g., paypal)
Onlinepaymentsystem(e.g., paypal)
Escrow Services ElectronicEscrow
AcceptShipment
Fulfillment ShippingInformation
RequestService and Support
ProvideServiceand Support
Knowledge BaseElectronicCommunication
OnlineKnowledge Base, FAQ Web PageEmail, Chat
Email, Chat
For example, during the negotiation phase, Table 3 shows that duringthe product search phase, the buyer can search web pages and web catalogsin a Web-Centric architecture or specialized P2P search engines in the P2Penvironment. Additionally, the buyer can review all the offerings providedby a specific peer site by reviewing all the files in the seller's shared folder.

94
Journal of Strategic E-Commerce, Volume 2, Number 2, 2004
A PROPOSED HYBRID ARCHITECTURE
If one examines the relative advantages and disadvantages ofWeb-centric and P2P architectures in Table 2, and their respective servicesin Table 3, it is evident that the architectures have different strengths andweaknesses. Given this, we propose that a hybrid architecture can best meetthe needs of the C2C buyers and sellers. Figure 3 diagrams such anarchitecture. This hybrid architecture allows one to place C2C services ateither the peer clients or the web server depending upon the nature of theservice.
Figure 3. Hybrid Web-centric and P2P Architecture for C2C Applications
P2P Client
P2P Client P2P Client
P2P Client
Web Server
P2P Client
P2P Client P2P Client
P2P Client
Web Server

95
Journal of Strategic E-Commerce, Volume 2, Number 2, 2004
To show the relative utility of this hybrid model we can apply thesame information-centric perspective suggested by Alter (Alter, 2002) thatwas discussed earlier. Table 4 summarizes the various services that could beprovided by the two parts of the hybrid model.
Table 4. Services provided by Hybrid Model
Web Server Services P2P Services
Information Quality
Accuracy Provide summaryinformation and refer tomore accurate peerclient information
Provide accurate information
Precision Provide summaryinformation and refer tomore precise peer clientinformation
Provide precise information
Age Provide valid timeframeof peer information
Provide valid timeframe ofpeer information
Completeness Provide summaryinformation and refer tomore complete peer client information
Provide complete information
Timeliness Provide summaryinformation and refer tomore timely peer client information
Provide timely information
Source Provide ratings/reviewsof seller
Provide ratings/reviews ofseller
Information Availability
Availability Provide 24/7 summaryinformation
Provide 24/7 detailedinformation

96
Table 4. Services provided by Hybrid Model
Web Server Services P2P Services
Journal of Strategic E-Commerce, Volume 2, Number 2, 2004
Admissibility Verify that informationis admissible
Provide admissible information
Information Expense Provide summaryinformation andreference to peer clientsfor free; charge foradditional value-added services
Provide detailed informationand refer to Web server foradditional value-added services
Information Security Provide security patchesand tips to users
Refer to Web-Server forsecurity patches and tips tousers
InformationPresentation
Provide summaryinformation and refer topeer client information
Present information in varietyof appropriate formats
InformationStandardization
Provide summaryinformation in standardformat and refer toadditional peer clientinformation
Provide information instandard and other appropriateformats
Kwok, et. al. provide a three layer framework for P2P business andservice models (Kwok, Lang, & Tam, 2002) as diagrammed in Figure 4. Thebottom two layers define the technology and community service applicationlayers. These bottom layers provide the infrastructure to support the businessmodel of the top layer. It could be argued that the first two layers of theKwok model are being successfully addressed by some current P2Papplications given the large user participation levels. For example, a surveyof Cornell student usage of bandwidth found that on average 55% of thebandwidth was used by Kazaa inbound and outbound traffic (Cornell

97
Journal of Strategic E-Commerce, Volume 2, Number 2, 2004
University, 2001). This is far more than any other type of activity oncampus.
Figure 4. Summary of the P2P Business and Service Model (Kwok, et.al.)
Assuming that the infrastructure and first two layers are beingadequately addressed by current P2P communities, then it may be possibleto develop the revenue to support a business model layer by providing acombination of free and paid value-added services. For example, one couldplace those services that require unbiased third party and/or centralizedcontrol at the web server. Bandwidth intensive, storage intensive, andrapidly changing information could be placed at the P2P client locations.Basic services such as search and referral services could be provided free ofcharge, while premium support such as escrow services could be provided fora fee. Table 5 summarizes ideas about how free and charged services couldbe split between the P2P and Web-Centric portions of the architecture.

98
Journal of Strategic E-Commerce, Volume 2, Number 2, 2004
Table 5. Consumer-to-Consumer Services on the Hybrid Architecture
P2P Client Web-Server
Basic FreeServices
Information search and presentation capabilityReferrals to value-added
P2P Chat capability
Web-Server servicesSummary information with aginginformation and searchReferrals to P2P site informationSeller ratings
Value-AddedPay Services
Advertising Electronic credit/debit paymentacceptanceEscrow servicesKnowledge baseComparison chartsAdvertising
SUMMARY AND CONCLUSIONS
This paper has examined the relative advantages and disadvantagesof the P2P and Web-Centric architectures for C2C transactions. Based onthis analysis, a hybrid architecture was proposed along with suggestions onhow the hybrid P2P and Web-Centric architecture might be leveraged tosupport a profitable business model.
REFERENCES
Alter, S. (2002). Information Systems: The Foundation of E-Business. Upper Saddle River,NJ: Prentice Hall.
Carleton, J. (2002, May). Fast growth forecast for enterprise P2P. Tech Update. RetrievedAugust 17, 2004, from http://techupdate.zdnet.com/techupdate/stories/main/0,14179,2863979,00.html

99
Journal of Strategic E-Commerce, Volume 2, Number 2, 2004
Cornell University (2002). Cornell Internet Usage Statistics for 2001. Retrieved August 15,2004, from http://www.cit.cornell.edu/computer/students/bandwidth/charts.html
Eisenmann, T. (2002). Internet Business Models: Text and Cases. New York, NY:McGraw-Hill.
Framling, K. & J. Holmstrom (2000). A distributed software for collaborative salesforecasting. Second Conference on Management and Control of Production andLogistics, July 2000.
Kalakota, R. & A. Whinston (1996). Electronic Commerce-A Managers Guide. Reading,MA: Addison-Wesley.
Katerattanakul, P. (2002). Framework of effective web site design for business-to-consumerInternet commerce. INFOR, 40(1), 57-70.
Kazaa (2004). Statistics accessed from Kazaa peer-to-peer network on August 16, 2004using the Kazaa client P2P software.
Killdara Corporation (2001). Peer-to-peer: Good, bad and in-between. Retrieved August 11,2003, from http://www.killdara.com/whitepapers.htm
Kwok, S., Lang, K. & K. Tam. (2002). Peer-to-peer technology business and servicemodels: risks and opportunities. Electronic Markets, 12(3), 175-183.
Merkow, M. (2000, October). What can P2P do for B2B. Insights - EC Outlook. RetrievedAug 17, 2004 from http://ecommerce.internet.com/news/insights/outlook/article/0,,10535_486031,00.html
Parameswaran, M., A. Susarla, & A. Whinston (2001). P2P networking: Aninformation-sharing alternative. IEEE Computer, 34(7), 31-38.
Seltzer, L. (2002, January). Peer-to-peer: My favorite stupid fad of 2001. Retrieved August15, 2004, from http://techupdate.zdnet.com/techupdate/stories/main/0,14179,2837666,00.html
Smaros, J. & K. Framling (2001). Peer-to-peer information systems - an enabler ofcollaborative planning, forecasting and replenishment. Logistics Research Network6th Annual Conference, Cardiff, September, 2001.

100
Journal of Strategic E-Commerce, Volume 2, Number 2, 2004
TechTarget (2004, February). WhatIs: Peer-to-peer. Retrieved August 15, 2004, fromhttp://searchnetworking.techtarget.com/sDefinition/0,,sid7_gci212769,00.html
Webopedia.com (2004, May). Webopedia: Client/server architecture. Retrieved August 17,2004, from http://www.webopedia.com/TERM/C/client_server_architecture.html

101
Journal of Strategic E-Commerce, Volume 2, Number 2, 2004
A LONGITUDINAL ANALYSIS OF THEPRIVACY POLICIES OF THE FORTUNE
E-50 FIRMS
Harlan L. Etheridge, University of Louisiana at LafayetteKathy H. Y. Hsu, University of Louisiana at Lafayette
ABSTRACT
We examine the online privacy policies of the Fortune e50 firms todetermine the extent to which online firms are committed to protect onlineconsumer privacy. In addition, to determine the extent that the "dot.combust", increasing consumer awareness of online privacy issues, andgovernment regulations related to consumer privacy have impacted theprivacy policies of U.S. firms engaged in ebusiness, we re-examine theprivacy policies of the Fortune e50 firms two and one-half years after ourinitial investigation.
Our results suggest that most e50 firms provide basic informationabout online consumer privacy and that the disclosure of such informationseems to be increasing. However, certain important aspects of onlineconsumer privacy are lacking in the privacy policies of the e50 firms,particularly those related to the ability of online consumers to control howtheir data is used, how data collected via email is used, and how the onlineprivacy of children is ensured. Given the sensitive nature of much of thisinformation and the rise in computer crimes, unless online firms increase theability of consumers of direct how their personal information can be used,the Federal Government may introduce more legislation to further protectonline consumer privacy by forcing online firms to offer consumers thisoption.

102
Journal of Strategic E-Commerce, Volume 2, Number 2, 2004
INTRODUCTION
Online privacy is an important issue in today's digital economy. Ofthe many challenges facing the Internet, privacy has risen above them all asthe number one concern (and barrier) voiced by web users when goingonline. Privacy advocates and consumer groups caution online consumersthat personal information may be collected by web sites and used in waysthat may compromise their privacy. Numerous events involving violationsof consumers' privacy also have served as a catalyst to increase interest inonline privacy (Stellin 2000; Electronic Frontier Foundation 2001; Gill 2001;Guernsey 2001). The Federal Trade Commission has targeted traditionalfirms such as Microsoft, The Ohio Art Company, and Eli Lilly, online firmssuch as Toysmart.com, Worlwidemedicine.com, Focusmedical.com,ReverseAuction.com, and GeoCities, as well as other firms with consumerprivacy violations. As a result of the publicity generated from these cases,attention directed toward online privacy has increased dramatically, andseveral online privacy groups have emerged, e.g., the Center for Democracyand Technology; the Online Privacy Alliance; the PersonalizationConsortium; and the Privacy Foundation; independent privacy policyverification programs that attest to the quality of online privacy policies andpractices have been formed, e.g., TRUSTe; BBB Online; WebTrust; andeSure; and the federal government has become involved in the protection ofconsumer privacy through the implementation of various laws andregulations, e.g., Gramm-Leach-Bliley Act, and The Children's OnlinePrivacy Protection Act.
A question that must be asked, however, is "Are online companieslistening to the issues surrounding online consumer privacy andimplementing and enforcing appropriate privacy policies?" One way todetermine if online companies view online consumer privacy as an importantissue is to examine their online privacy policies. A privacy notice is awritten statement advising the public of the collection and use of personallyidentifiable information and security practices of a firm. A good privacynotice is easy to find, easy to read, and comprehensively explains all of thefirm's online information practices. This notice provides online visitors an

103
Journal of Strategic E-Commerce, Volume 2, Number 2, 2004
opportunity to make informed decisions about the collection and use of theirinformation. In this study, we examine the online privacy policies of theFortune e-50 firms, fifty firms that are representative of the Interneteconomy, to determine the extent to which online firms are committed toprotect online consumer privacy.
Due to the significance of the on-line components of these companies,online privacy issues should be very important to the Fortune e-50 firms.Companies that want to be successful in conducting business on the Internetmust be responsive in promoting the trust and confidence of on-linecommerce. A privacy policy allows consumers to know that the businessfollows ethical practices in the treatment of their personally identifiableinformation, and helps increase consumer confidence in the Web as a safeplace to shop.
The terms of a privacy notice are very important because theysubstantially determine an individual's understanding of how information willbe used and what steps the individual may take to protect his or her privacy.A good privacy notice is tailored to the specific information practices of anorganization and should not be merely copied from another source. Whendeveloping a privacy policy, it is necessary for a company to take an in depthlook at what information their web site collects, how the informationcollected is being used, and its internal protocols and policies as they relateto information collection and use.
Although privacy issues relate to consumers, employees, suppliers,distributors, etc., our study focuses on consumer online privacy becauseindividual consumers have little influence on the privacy policies andpractices of the online firms with which they do business. Consequently,consumers must rely on online firms to develop, implement and maintainadequate policies and practices to protect their privacy online.
Currently, the government has relied on self-regulation by onlinefirms to protect online consumer privacy. However, if online firms do nottake steps to adequately safeguard online consumer privacy, then thegovernment may intervene and pass additional legislation designed to protectonline consumer privacy. In fact, the federal government already hasdetermined a need to protect the privacy of consumers using financial

104
Journal of Strategic E-Commerce, Volume 2, Number 2, 2004
institutions (the Gramm-Leach-Bliley Act and the Fair Credit Reporting Act)and the online privacy of children under the age of 13 (The Children's OnlinePrivacy Protection Act). Online firms should have incentives to adequatelyprotect online consumer privacy because violations of government privacylegislation can result in:
1. Government fines: Violations can result in fines of up to $11,000 for eachinfraction. Infractions can range from not applying a customer preferencefor the use of their personally identifiable information throughout theenterprise to the accidental sharing of a single customer record.
2. Litigation costs: Firms that are defendants in lawsuits alleging unfair anddeceptive practices relating to online consumer privacy face potentiallyhuge litigation costs and legal fees.
3. Marketing sanctions: Firms found to be in violation of privacy regulationscan be issued with cease-and-desist orders, which can paralyze theirconsumer marketing operations.
4. Brand damage: Negative publicity from consumer privacy violations coulderode customer loyalty and shareholder confidence (Acxiom.com 2000b).
Although these government sanctions exist, they have been appliedonly in extreme cases. As a result, the government has relied primarily onself-regulation by online firms to protect online consumer privacy. However,if online firms do not take steps to adequately safeguard online consumerprivacy, then the government may intervene and pass additional legislationdesigned to protect online consumer privacy. Our longitudinal examinationof the privacy policies of the Fortune e50 firms should provide an indicationof the level of and any shifts in the commitment of online firms to protectonline consumer privacy.
ISSUES SURROUNDING ONLINE CONSUMER PRIVACY
Many issues are related to online consumer privacy, including thetype of information that is collected, how that information is used, and if thatinformation should be shared with others. The Online Privacy Alliance, anorganization of online firms that is committed to the protection of online

105
Journal of Strategic E-Commerce, Volume 2, Number 2, 2004
consumer privacy, has issued a document that outlines five issues that onlinefirms must address to protect the online privacy of their users. CreatingConsumer Confidence Online: Five Essential Elements to Online Privacy(Online Privacy Alliance 2000) asserts that the following five items areissues with which online firms must contend in order to adequately protectonline consumer privacy:
1. the adoption and implementation of a privacy policy,2. the notice and disclosure of significant privacy policies,3. the choice and consent of online consumers as to how online consumer
data is used,4. the security of online consumer data, and 5. the quality and access of online consumer data
Our study investigates these five issues to determine the extent towhich online firms are committed to protect online consumer privacy and theextent to which they have modified their online privacy policies to achievethis objective. Specifically, we examine the web sites of the Fortune e50firms for the following items:
1. disclosure and listing of an online privacy policy, 2. disclosure of information regarding the independent certification of the
online privacy policy, including what online privacy policy certificationservice is used,
3. disclosure of what consumer information is collected online (Please seeAppendix A for a listing of the general types of consumer information thatare gathered online.),
4. disclosure of how consumer information collected online is used (Pleasesee Appendix B for a description of how online consumer informationmay be used.),
5. disclosure of whether consumer information collected online is shared,with other companies,
6. disclosure of whether consumers have a choice as to how their online datais used,
7. disclosure of information regarding the privacy policies of linked websites,
8. disclosure of whether consumer information collected online is sharedwith affiliated companies,

106
Journal of Strategic E-Commerce, Volume 2, Number 2, 2004
9. disclosure of whether information collected via email is retained for use,10. disclosure of whether "cookies" are used,11. disclosure of information about the security of consumer information
collected online,12. disclosure of separate information regarding the online privacy of
children,13. disclosure of whether consumers can review, change or correct
information gathered online,14. disclosure of whether consumers can "opt out" of online or email
programs,15. disclosure of information about the revision of online policies, and16. disclosure of contact information regarding online policies.
We think that these 16 items allow us to adequately assess how wellthe privacy policies of the Fortune e50 firms incorporate the five elementsessential to online consumer privacy as delineated by the Online PrivacyAlliance.
DATA
The data used in this study was gathered from the online privacypolicies of the Fortune e50 firms in 2000 and 2003. The Fortune e50 firmsare fifty firms that are representative of the Internet economy and, in thisstudy, proxy for online firms in general. The Fortune e50 firms are selectedfrom the following subsectors:
1. E-Company Firms,2. Net Communications Companies,3. Net Hardware Companies, and4. Net Software and Services Companies.
Our initial sample of firms consists of 18 e-company firms, 12 nethardware companies, 15 net software and service companies, and 5 netcommunication companies. Privacy policy data on these firms was gatheredin December 2000. See Table 1 for a list of firms in our initial sample.

107
Journal of Strategic E-Commerce, Volume 2, Number 2, 2004
Table 1 - Samples of Firms Used in Study
Initial Sample Follow-Up Sample
ECOMPANY FIRMS ECOMPANY FIRMS
Amazon.com Inc Amazon.com Inc
Ameritrade AOL Time Warner Inc
America Online Charles Schwab Corporation
Charles Schwab Corporation CheckFree Corporation
CMGI DoubleClick Inc
CNET E Trade Group Inc
DoubleClick Inc EarthLink Inc
EarthLink Inc eBay Inc
E*Trade FreeMarkets
EBay Inc InterActiveCorp
FreeMarkets Knight Trading Group Inc
Healtheon Monster Worldwide Inc
InfoSpace Overture Services Inc
Knight Trading Group Inc RealNetworks Inc
Priceline.com Sabre Holdings Corporation
RealNetworks Inc United Parcel Services
VerticalNet Yahoo! Inc
Yahoo! Inc NET COMMUNICATION COMPANIES
NET COMMUNICATION COMPANIES AT&T Corporation
AT&T Corporation Bell South Corporation
Global Crossing Comcast Corporation
Qwest SBC Communications Inc
SBC Communications Inc Verizon Communications
WorldCom NET HARDWARE COMPANIES
NET HARDWARE COMPANIES Broadcom Corporation
Broadcom Corporation Cisco Systems Inc
Cisco Systems Inc Dell Inc.
Dell Inc EMC Corporation
EMC Corporation Intel Corporation
International Business Machines International Business Machines
Intel Juniper Networks

108
Table 1 - Samples of Firms Used in Study
Initial Sample Follow-Up Sample
Journal of Strategic E-Commerce, Volume 2, Number 2, 2004
JDS Uniphase Network Appliance Corporation
Juniper Networks Qualcomm Inc
Lucent Technologies Sun Microsystems Inc
Network Appliance Corporation Tellabs Inc
Qualcomm Inc Texas Instruments Inc
Sun Microsystems Inc NET SOFTWARE & SERVICE COMPANIES
NET SOFTWARE & SERVICE COMPANIES BEA Systems Inc
Ariba Check Point Software Technologies
BroadVision Citrix Systems Inc
Cambridge Technology Partners Intuit Inc
Citrix Systems Inc Macromedia Inc
Exodus Microsoft Corporation
Inktomi Network Associates
Intuit Inc Oracle Corporation
Macromedia Inc PeopleSoft Inc
Microsoft Corporation S1 Corporation
Network Associates Siebel Systems
Oracle Corporation Symantec Corporation
Razorfish TIBCO Software Inc
Security First Technologies Verisign Inc
TMP Worldwide Veritas Software Corporation
VeriSign Inc
In August 2003, we gathered the same privacy policy data for theFortune e50 firms. Because the composition of the Fortune e50 is not static,our follow up sample of firms differs from our initial sample. Our follow upsample contains 16 e-company firms, 12 net hardware companies, 16 netsoftware and service companies, and 6 net communication companies. SeeTable 1 for a list of firms in our follow-up sample.
Because a change in composition of the Fortune e50 could bias ourresults when comparing privacy policy disclosures over time, we also

109
Journal of Strategic E-Commerce, Volume 2, Number 2, 2004
examine changes in the online privacy policies of the surviving e50 firms.See Table 2 for a list of firms included in both our initial and follow-upsamples.
The web site of each of the firms in the study was examined for anonline privacy policy. Most firms had privacy policies listed online.However, if no privacy policy was found on a firm's web site, an email wassent to the firm stating that we were conducting research on online privacypolicies and were unable to find a privacy policy on their web site. Theemail then requested that any information regarding their firm's onlineprivacy policy be emailed to us.
RESULTS
Results from Initial Sample
The results from our initial sample show that 84% of the Fortune e50firms have online privacy policies with all of the ECF and NCC havingprivacy policies, 73% of the NSSC providing privacy policies, and 67 % ofthe NHC listing privacy policies. Most e50 firms opt not to use privacypolicy verification services, e.g., TRUSTe, with certification ranging from44% (ECF) to 25% (NHC). The most prevalent verification service isTRUSTe (used by 30% of e50 firms), while the least used are WebTrust andeSure (each used by 2% of the e50 firms). The only other privacy policyverification service used by the e50 firms is BBB Online which is used by8% of e50 firms. Very few firms use multiple certification services (4%).
The majority of e50 firms disclose what information is collected bytheir websites (68%), how collected information is used (80%), howinformation is shared (76%), whether or not cookies are used (68%), howcollected information is secured (68%), how consumers can opt out of onlineprograms (64%), how consumers can review, change or correct theirinformation (60%), and how the company may be contacted with questionsabout their privacy policy (60%). However, most of the e50 firms do notdisclose information about consumer choices regarding data use (18%), a
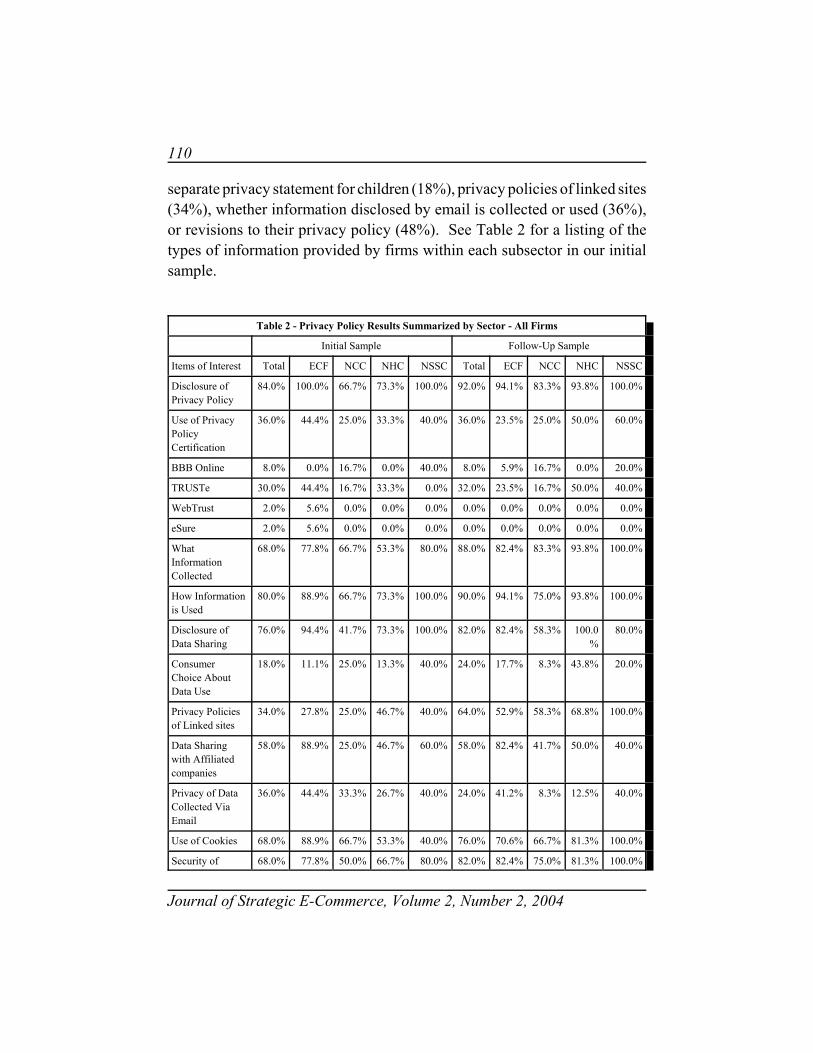
110
Journal of Strategic E-Commerce, Volume 2, Number 2, 2004
separate privacy statement for children (18%), privacy policies of linked sites(34%), whether information disclosed by email is collected or used (36%),or revisions to their privacy policy (48%). See Table 2 for a listing of thetypes of information provided by firms within each subsector in our initialsample.
Table 2 - Privacy Policy Results Summarized by Sector - All Firms
Initial Sample Follow-Up Sample
Items of Interest Total ECF NCC NHC NSSC Total ECF NCC NHC NSSC
Disclosure ofPrivacy Policy
84.0% 100.0% 66.7% 73.3% 100.0% 92.0% 94.1% 83.3% 93.8% 100.0%
Use of PrivacyPolicyCertification
36.0% 44.4% 25.0% 33.3% 40.0% 36.0% 23.5% 25.0% 50.0% 60.0%
BBB Online 8.0% 0.0% 16.7% 0.0% 40.0% 8.0% 5.9% 16.7% 0.0% 20.0%
TRUSTe 30.0% 44.4% 16.7% 33.3% 0.0% 32.0% 23.5% 16.7% 50.0% 40.0%
WebTrust 2.0% 5.6% 0.0% 0.0% 0.0% 0.0% 0.0% 0.0% 0.0% 0.0%
eSure 2.0% 5.6% 0.0% 0.0% 0.0% 0.0% 0.0% 0.0% 0.0% 0.0%
WhatInformationCollected
68.0% 77.8% 66.7% 53.3% 80.0% 88.0% 82.4% 83.3% 93.8% 100.0%
How Informationis Used
80.0% 88.9% 66.7% 73.3% 100.0% 90.0% 94.1% 75.0% 93.8% 100.0%
Disclosure ofData Sharing
76.0% 94.4% 41.7% 73.3% 100.0% 82.0% 82.4% 58.3% 100.0%
80.0%
ConsumerChoice AboutData Use
18.0% 11.1% 25.0% 13.3% 40.0% 24.0% 17.7% 8.3% 43.8% 20.0%
Privacy Policiesof Linked sites
34.0% 27.8% 25.0% 46.7% 40.0% 64.0% 52.9% 58.3% 68.8% 100.0%
Data Sharingwith Affiliatedcompanies
58.0% 88.9% 25.0% 46.7% 60.0% 58.0% 82.4% 41.7% 50.0% 40.0%
Privacy of DataCollected ViaEmail
36.0% 44.4% 33.3% 26.7% 40.0% 24.0% 41.2% 8.3% 12.5% 40.0%
Use of Cookies 68.0% 88.9% 66.7% 53.3% 40.0% 76.0% 70.6% 66.7% 81.3% 100.0%
Security of 68.0% 77.8% 50.0% 66.7% 80.0% 82.0% 82.4% 75.0% 81.3% 100.0%

111
Table 2 - Privacy Policy Results Summarized by Sector - All Firms
Initial Sample Follow-Up Sample
Items of Interest Total ECF NCC NHC NSSC Total ECF NCC NHC NSSC
Journal of Strategic E-Commerce, Volume 2, Number 2, 2004
information
Children'sPrivacy
34.0% 44.4% 16.7% 20.0% 80.0% 42.0% 47.1% 41.7% 25.0% 80.0%
Review, Changeor CorrectInformation
60.0% 66.7% 58.3% 46.7% 80.0% 64.0% 76.5% 66.7% 62.5% 20.0%
Ability to OptOut
64.0% 61.1% 58.3% 66.7% 80.0% 70.0% 70.6% 50.0% 87.5% 60.0%
Revisions of thePrivacy Policy
48.0% 61.1% 33.3% 40.0% 60.0% 66.0% 58.8% 50.0% 75.0% 100.0%
How to ContactUs
60.0% 66.7% 50.0% 60.0% 60.0% 68.0% 70.6% 66.7% 68.8% 60.0%
Results from Follow-Up Sample
The results of our follow up sample indicate that more firms haveonline privacy policies than in our initial sample (92% vs. 84%); however,fewer of the firms chose to utilize a third-party, privacy certification service(34% vs 36%). Significantly more firms chose to disclose importantinformation about online consumer privacy. Some of the more importantincreases in privacy disclosures are related to what information is collected(88% vs 68%), how information is used (90% vs 80%), the privacy policiesof linked web sites (64% vs 34%), how consumer information is secured(82% vs 68%), and how to determine if the company's privacy policy haschanged (66% vs 48%). The only area where disclosure declined is relatedto how information collected via email is used (24% vs 36%). Also it isnotable that less that the majority of firms in the follow-up sample disclosedinformation related to consumer choice of information use (24%), onlineprivacy and children (42%), and how information collected via email is used(24%). See Table 2 for a listing of the types of information provided byfirms within each subsector in our follow-up sample.

112
Journal of Strategic E-Commerce, Volume 2, Number 2, 2004
Results from Surviving Firm Sample
Because the composition of firms in the initial sample and follow-upsample differ, results from comparing the contents of the online privacypolicies of these two samples may be partially driven by the differences insample composition. Consequently, in order to better understand howebusiness firms have modified their online privacy policies in response toconsumer and government pressure, we examine the temporal differences inthe online privacy policies of firms in both the original and follow-upsamples (surviving firms). See table 3 for a listing of the surviving firms andtable 4 for data related to the surviving firms' information.
TABLE 3 - SURVIVING FIRMS
ECOMPANY FIRMS NET COMMUNICATION COMPANIES
Amazon.com Inc AT and T Corporation
AOL Time Warner Inc SBC Communications Inc
Charles Schwab Corporation NET HARDWARE COMPANIES
DoubleClick Inc Broadcom Corporation
E Trade Group Inc Cisco Systems Inc
EarthLink Inc Dell Inc.
eBay Inc EMC Corporation
FreeMarkets Intel Corporation
Knight Trading Group Inc International Business Machines
RealNetworks Inc Juniper Networks
Yahoo! Inc Network Appliance Corporation
NET SOFTWARE COMPANIES Qualcomm Inc
Citrix Systems Inc Sun Microsystems Inc
Intuit Inc
Macromedia Inc
Microsoft Corp
Network Associates
Oracle Corporation
Verisign Inc

113
Journal of Strategic E-Commerce, Volume 2, Number 2, 2004
Table 4 - Privacy Policy Results Summarized by Sector
Initial Sample - Surviving Firms Follow-Up Sample - Surviving Firms
Items ofInterest
Total ECF NCC NHC NSSC Total ECF NCC NHC NSSC
Disclosureof PrivacyPolicy
86.7% 90.9% 100.0% 70.0% 100.0% 90.0% 90.9% 100.0% 80.0% 100.0%
Use ofPrivacyPolicyCertification
46.7% 45.5% 50.0% 30.0% 71.4% 43.3% 27.3% 100.0% 20.0% 85.7%
BBB Online 10.0% 0.0% 50.0% 20.0% 0.0% 10.0% 0.0% 50.0% 20.0% 0.0%
TRUSTe 40.0% 45.5% 0.0% 20.0% 71.4% 40.0% 27.3% 50.0% 20.0% 85.7%
WebTrust 3.3% 9.1% 0.0% 0.0% 0.0% 0.0% 0.0% 0.0% 0.0% 0.0%
eSure 3.3% 9.1% 0.0% 0.0% 0.0% 0.0% 0.0% 0.0% 0.0% 0.0%
WhatInformationis Collected
70.0% 63.6% 100.0% 70.0% 71.4% 86.7% 81.8% 100.0% 80.0% 100.0%
HowInformationis Used
83.3% 81.8% 100.0% 70.0% 100.0% 86.7% 90.9% 100.0% 70.0% 100.0%
Disclosureof DataSharing
76.7% 90.9% 100.0% 40.0% 100.0% 80.0% 81.8% 100.0% 60.0% 100.0%
ConsumerChoiceAbout DataUse
26.7% 18.2% 50.0% 30.0% 28.6% 23.3% 9.1% 50.0% 10.0% 57.1%
PrivacyPolicies ofLinked sites
30.0% 18.2% 50.0% 30.0% 42.9% 53.3% 36.4% 100.0% 60.0% 57.1%
DataSharingw/Affiliatedcompanies
60.0% 81.8% 100.0% 20.0% 71.4% 53.3% 72.7% 0.0% 30.0% 71.4%
Privacy ofDataCollectedVia Email
50.0% 54.6% 50.0% 40.0% 57.1% 33.3% 63.6% 0.0% 10.0% 28.6%
Use ofCookies
76.7% 81.8% 0.0% 70.0% 100.0% 76.7% 72.7% 100.0% 60.0% 100.0%
Security of 76.7% 81.8% 100.0% 60.0% 85.7% 76.7% 72.7% 100.0% 70.0% 85.7%

114
Table 4 - Privacy Policy Results Summarized by Sector
Initial Sample - Surviving Firms Follow-Up Sample - Surviving Firms
Items ofInterest
Total ECF NCC NHC NSSC Total ECF NCC NHC NSSC
Journal of Strategic E-Commerce, Volume 2, Number 2, 2004
information
Children'sPrivacy
36.7% 36.4% 100.0% 20.0% 42.9% 53.3% 54.6% 100.0% 40.0% 57.1%
Review,Change,CorrectInformation
70.0% 63.6% 100.0% 70.0% 71.4% 63.3% 63.6% 0.0% 60.0% 85.7%
Ability toOpt Out
76.7% 63.6% 100.0% 70.0% 100.0% 73.3% 72.7% 100.0% 50.0% 100.0%
Revisions ofthe PrivacyPolicy
53.3% 63.6% 100.0% 30.0% 57.1% 70.0% 72.7% 100.0% 50.0% 85.7%
How toContact Us
73.3% 72.7% 100.0% 60.0% 85.7% 73.3% 63.6% 100.0% 70.0% 85.7%
Performing a temporal comparison of the online privacy policies ofthe surviving firms yields the following results. Slightly more firms have anonline privacy policy in the follow-up sample of surviving firms (91%)compared to the original sample of surviving firms (87%). This is due to anincrease of online privacy policies among the NHC firms (80% vs 70%). The percentage of surviving firms using privacy policy certification servicesexperienced a slight decline across time (47% vs 43%). However, it isinteresting to note that a decline in privacy policy certification services wasexperienced in the ECF (27% vs 45%) and NHC (20% vs 30% firms whilean increase was experienced among the NCC (100% vs 50%) and NSSCfirms (86% vs 71%). Additional investigation is required to explain thisphenomenon. Also, no surviving e50 firms use the WebTrust or eSureservices in the follow-up sample. This is partially due to the fact that eSurewas a service of Arthur Andersen whose business and reputation weredevastated as a result of the Enron scandal. The reason for a drop in thepercentage of firms using WebTrust is unknown; however, since only one

115
Journal of Strategic E-Commerce, Volume 2, Number 2, 2004
firm used WebTrust in the initial sample, further investigation is needed toclarify this issue.
Significantly more firms in the follow-up sample disclose whatinformation is collected (87% vs 70%) compared to the initial sample;however, only slightly more firms in the follow-up sample disclose howcollected information is used (87% vs 83%) compared to the initial sample.Although significantly more NSSC firms disclosed information regardingconsumer choice about data use (57% vs 29%), the overall percentage offirms disclosing such information declined (23% vs 27%). This is due todeclines in disclosures of this information in the ECF (9% vs 18%) and NHC(10% vs 30%) sectors. The decline in overall disclosure of consumer choiceinformation is counter to the results from the samples composed of all e50firms.
Many more firms in all four sectors disclosed information about theprivacy policies of linked sites (53% vs 30%) while a slight decrease in firmsdisclosing information regarding data sharing with related companies wasnoted (53% vs 60%). The latter result is driven by the fact that fewer firmsin the ECF (73% vs 82%) and NCC (0% vs 100%) sectors and is counter tothe result obtained using the samples composed of all Fortune e50 firms. Alarge decline was noted in the number of firms disclosing information relatedto the privacy of data collected via email (33% vs 50%). All of the sectorsexcept ECF experienced declines in the disclosure of this information.
Significantly more firms disclosed information related to children'sprivacy in the follow-up sample compared to the initial sample (53% vs37%). However, a decline was experienced in the percentage of firmsdisclosing information regarding the ability of consumers to review, changeor correct their personally identifiable information (63% vs 70%). This resultis counter to the result obtained from the full samples of firms and is due toa large decline in the reporting of this information in the NCC sector (0% vs100%) a small decrease in the NHC sector (60% vs 70%) and an increase inthe NSSC sector (86% vs 71%). Finally, slightly fewer firms reportedinformation about consumer ability to opt out of specified programs(generally email) (73% vs 77%), which is counter to the result from the full

116
Journal of Strategic E-Commerce, Volume 2, Number 2, 2004
samples of firms, while significantly more firms disclosed information aboutchanges in their privacy policies (70% vs 53%).
CONCLUSIONS
Online privacy is a major concern of individuals spending time on theInternet. Most Fortune e50 firms provide basic information about onlineconsumer privacy. However, certain important aspects of online consumerprivacy are lacking in the privacy policies of the Fortune e50 firms.Surprisingly, most of the Fortune e50 firms do not have independentcertifications of their online privacy policies. Our results also indicate thatthe percentage of overall firms disclosing information regarding whatinformation is collected and how it is used. We also find that the reportingof information related to data sharing and consumer choice about data usehas increased in the overall samples of firms; however, the number ofsurviving firms that disclosed information about consumer choice about datause declined, as did disclosure of information about data sharing withaffiliated companies.
Significantly more firms report information about the privacy policiesof linked sites but the disclosure of information about the privacy of datacollected via email declined. More firms report information regarding theuse of cookies, the security of consumer information, and online privacy ofchildren. And although more firms overall report information related toconsumer ability to review, change or correct their personally identifiableinformation and the ability of consumers to opt out of online or emailprograms, fewer surviving firms do so. Finally, significantly more firmsdisclose information about changes in their privacy policies.
In summary, it appears that disclosures in the online privacy policiesof the Fortune e50 increased from 2000 to 2003. However, several areas ofdisclosure are still in need of improvement, particularly information relatedto consumer choice about data use, the privacy of data collected via email,and children's online privacy. Also, declines in the disclosure of certaininformation among the surviving firms were noted. If online firms fail to

117
Journal of Strategic E-Commerce, Volume 2, Number 2, 2004
continue to adopt more comprehensive online privacy policies, possibleimplications are that more consumers may elect not to shop online, and thatthe Federal Government may introduce more legislation to protect onlineconsumer privacy. Either of these situations will exacerbate the difficultiesmany online firms currently are experiencing and may result in furtherdisillusionment with and capital flight away from online companies. Also,the fact that identity theft and online fraud continue to grow is puttingadditional pressure on online firms to disclose more information regardingonline consumer privacy.
Difficulties that online firms may experience in developing privacypolicies are that consumer expectations regarding privacy policies may shift,requiring online firms to modify their privacy policies accordingly. Anotherdifficulty of developing and maintaining an online privacy policy is relatedto the number of countries that have enacted laws to protect consumerprivacy. Because online firms engage in transactions around the world,ideally their privacy policies would address the concerns of the consumerprivacy laws of the countries in which they have customers. However,hundreds of consumer privacy laws have been enacted in numerous countriesacross the world and, consequently, it would be virtually impossible toincorporate the requirements of all of these laws into a single online privacypolicy. A possible solution to this dilemma is to have multiple online privacypolicies for different regions of the world; however, ensuring compliancewith all of these privacy policies would be very time consuming andexpensive.
118
Journal of Strategic E-Commerce, Volume 2, Number 2, 2004
REFERENCES
Acxiom.com (2000a). What Every Consumer Should Know. Retrieved July, 10, 2001, fromhttp://www.acxiom.com.au/DisplayMain/0,1494,USA~en~777~3144~0~0,00.html
Acxiom.com (2000b). Penalties for Non-Compliance: What Happens if a Company Doesn'tHonor Privacy Preferences? Retrieved July 10, 2001, fromhttp://www.acxiom.com.au/DisplayMain/0,1494,USA~en~580~3193~0~0,00
Electronic Frontier Foundation (2001). Judge Rules Alleged DoubleClick Privacy ViolationsSufficient to Go to Trial-Electronic Frontier Foundation Urges DoubleClick toAdopt Opt-In Privacy Protections. Media Release, June 6, 2001. Retrieved August21, 2001, from http://www.eff.org/legal/cases/DoubleClick_cases/20010606_eff_doubleclick_pr.html
Gill, Lisa (2001). Protesters Blast Macy's Online Privacy Policies. NewsFactor.com. June13, 2001. Retrieved August 21, 2001, from http://www.newsfactor.com/story.xhtml?story_id=11222
Guernsey, Lisa (2001). When It Came to Privacy on EBay: No Became Yes. The New YorkTimes Online Edition. January 11, 2001. Retrieved July 10, 2001, fromh t t p : / / t e c h 2 . n y t i m e s . c o m / m e m / t e c h n o l o g y /techreview.html?res=980DE4D8113AF932A25752C0A9679C8B63&oref=login
Online Privacy Alliance (2000). Creating Consumer Confidence Online: Five EssentialElements to Online Privacy. Retrieved July 10, 2001, fromhttp://www.privacyalliance.org/resources/OPA_brochure.pdf
Stellin, Susan (2000). Sale of Data Raises Privacy Worries. The New York Times. December4, 2000.

119
Journal of Strategic E-Commerce, Volume 2, Number 2, 2004
Allied Academies
invites you to check our website at
www.alliedacademies.orgfor information concerning
conferences and submission instructions

120
Journal of Strategic E-Commerce, Volume 2, Number 2, 2004
Allied Academies
invites you to check our website at
www.alliedacademies.orgfor information concerning
conferences and submission instructions