16 Ion-Exchange Membranes- Preparative Methods for Electrodialysis and Fuel Cell Applications
Effect of ambient carbon dioxide on salt permeability and sorptionmeasurements in ion-exchange membranes
Jovan Kamcev, Eui-Soung Jang, Ni Yan, Donald R. Paul, Benny D. Freeman n
McKetta Department of Chemical Engineering, Center for Energy and Environmental Resources, and Texas Materials Institute,The University of Texas at Austin, 10100 Burnet Road, Building 133 (CEER), Austin, TX 78758, USA
a r t i c l e i n f o
Article history:Received 23 October 2014Received in revised form4 December 2014Accepted 7 December 2014Available online 1 January 2015
Keywords:Carbon dioxideSalt transportSalt sorptionSolution–diffusionIon-exchange membrane
a b s t r a c t
Characterizing ion sorption and transport properties in charged polymers is critical for developingfundamental understanding necessary to prepare high performance membranes. The presence ofdissolved CO2 from the atmosphere in aqueous solutions can interfere with measurements of saltpermeability and sorption in ion-exchange membranes, frustrating characterization of ion transportproperties. In water or aqueous saline solutions, CO2 speciates to form ions such as Hþ and HCO3
� . NaClor other salt permeability experiments are often performed by exposing a membrane to two saltsolutions of different concentrations in a conventional diffusion cell and monitoring the conductivity risewith time in the receiving chamber (i.e., the chamber containing the lower salt concentration). Hþ andHCO3
� ions in the external solutions on either side of the membrane undergo ion exchange withcounter-ions in cation- and anion-exchange membranes, respectively. This CO2-induced ion exchangeinterferes with conductivity measurements designed to measure receiver salt concentration change withtime due to ion permeation through the polymer from the higher salt concentration chamber (i.e., thedonor chamber). This phenomenon results in non-linear changes in downstream conductivity with time,which is most pronounced at low donor cell NaCl concentrations, especially for anion-exchangemembranes. Furthermore, this effect is absent when an anion-exchange membrane in the HCO3
� formis tested using NaHCO3 rather than NaCl for permeability measurements. The effect of CO2 on NaClpermeability measurements can be significantly reduced when ultra-high purity N2 gas is bubbledthrough the donor and receiver solutions in the diffusion cell during the experiment, making it possibleto obtain true NaCl permeability values. During NaCl sorption experiments, when an ion-exchangemembrane was equilibrated with a NaCl solution of 0.1 M or lower, the amount of desorbed mobilecounter-ions was significantly greater than the amount of desorbed mobile co-ions. The desorption ofunequal amounts of ions can also be attributed to ion exchange between the membrane and solutionphase and has implications for determining the mobile NaCl sorption coefficient. Procedures foraddressing these issues are described.
& 2014 Elsevier B.V. All rights reserved.
1. Introduction
Ion-exchange membranes (IEMs) play key roles in a variety ofmembrane-based technologies. IEMs are typically made from poly-mers containing ionizable functional groups covalently bound to apolymer backbone (i.e., fixed ions) [1–3]. Bound (i.e., fixed) groupsin cation exchange membranes (CEMs) are negatively charged (e.g.,sulfonic acid), and they are positively charged (e.g., quaternaryamines) in anion-exchange membranes (AEMs). The fixed chargegroups in IEMs allow selective permeation of cations in CEMs, or
anions in AEMs, across the membrane, a property necessary fortechnologies such as electrodialysis and reverse electrodialysis[4–12]. This behavior stems largely from Donnan exclusion of co-ions, which are ions having the same charge as the fixed ions. Inaddition, IEMs have relatively high electrical conductivity, makingthem attractive for use in batteries and fuel cells [13–18]. Mem-branes with fixed charge groups are often hydrophilic and are waterpermeable. Thus, they have been explored for processes that do notnecessarily require charged membranes, such as reverse osmosis,forward osmosis, dialysis, etc. but where ion selectivity is anadvantage [1,19–25].
Technologies such as those described above rely on controllingthe rate of water and/or ion transport across the membra-nes. Improvement of membrane performance is one avenue for
Contents lists available at ScienceDirect
journal homepage: www.elsevier.com/locate/memsci
Journal of Membrane Science
http://dx.doi.org/10.1016/j.memsci.2014.12.0310376-7388/& 2014 Elsevier B.V. All rights reserved.
n Corresponding author. Tel.: þ1 512 232 2803; fax: þ1 512 232 2807.E-mail address: [email protected] (B.D. Freeman).
Journal of Membrane Science 479 (2015) 55–66
increasing process efficiencies and decreasing operating costs.Improving membranes ultimately requires a deep understandingof the influence of membrane structure (chemical and physical) onwater and ion transport properties [26]. To make useful connec-tions between membrane structure and performance, fundamen-tal structure/property relations must be developed by system-atically characterizing water and ion transport properties in avariety of membranes having different structures.
Atmospheric CO2 can substantially impact the performance ofanion-exchange membrane fuel cells (AEMFCs) [27–31]. WhenCO2 gas dissolves in water, it forms carbonic acid, which dis-sociates into Hþ , HCO3
� , and CO32� ions [32]. The HCO3
� andCO3
2� ions can displace at least some of the OH� counter-ions inan AEM, resulting in a sharp decrease in membrane conductivitydue to the much lower mobility of HCO3
� and CO32� ions
compared to that of OH� ions [27,29]. Several studies haveinvestigated the effect of dissolved CO2 from the ambient atmo-sphere (currently �400 ppm) on AEMFC fuel cell performance[27,29–31]. However, the effect of dissolved CO2 on salt perme-ability and sorption measurements in ion-exchange membraneshas not been reported. In this study, the effect of atmosphericCO2 on NaCl permeability and ion sorption measurements incation and anion exchange membranes is explored, and sugges-tions are provided to mitigate these effects, so that reliablesorption and transport results may be obtained.
2. Background
Mass transfer across dense (i.e., nonporous) membranes isdescribed by the solution–diffusion model [33–35]. According to thismodel, penetrants molecularly dissolve into the upstream (i.e., highconcentration) face of the membrane, diffuse across the membranedue to a concentration (i.e., thermodynamic activity) gradient, anddesorb from the downstream face of the membrane. At pseudo-steady state, the integral permeability coefficient of penetrant i, Pih i,defined as the steady state flux of i normalized by the membranethickness and driving force, can be written in terms of a sorptioncoefficient, Ki, and an effective, concentration averaged diffusioncoefficient, Dih i, as follows [33,34]:
Pih i ¼ Ki Dih i ð1Þ
Experimentally determining steady state salt (e.g., NaCl) per-meability and equilibrium ion sorption coefficients is importantfor developing fundamental structure/property relations in densemembranes for concentration gradient driven salt transport[36,37]. Once these values are determined, salt diffusion coeffi-cients may be obtained within the framework of the solution–diffusion model, allowing for complete characterization of con-centration gradient driven transport in membranes [26,37].
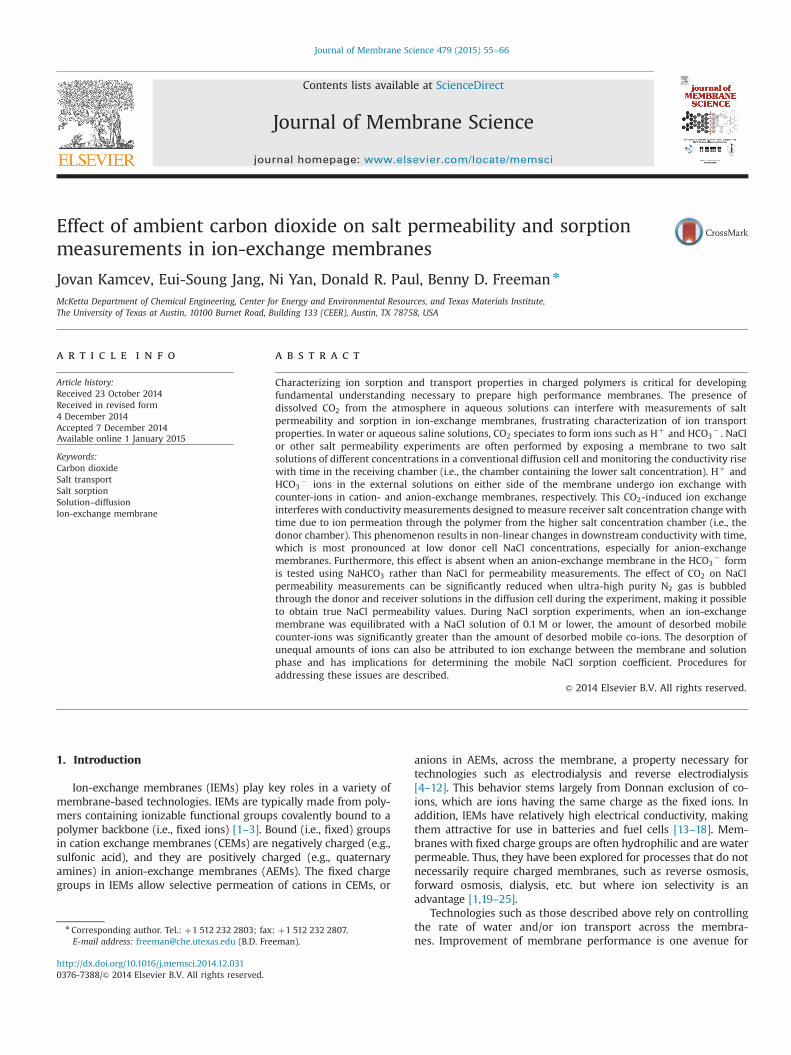
Typically, NaCl permeability coefficients are obtained using adiffusion cell. A simple schematic of such a device is shown inFig. 1a. The membrane is placed between two chambers, wherethe upstream (i.e., donor) chamber contains a NaCl or othersalt solution of known concentration, and the downstream(i.e., receiver) chamber initially contains DI water. As NaCl perme-ates across the membrane from the upstream chamber to thedownstream chamber, the change in NaCl concentration in thedownstream chamber with respect to time is recorded using aconductivity meter. The conductivity of the downstream chambersolution is converted to NaCl concentration via a calibration curve,and the NaCl permeability coefficient can be obtained from thesedata using well-known methods [25,35,37].
When NaCl transport across the membrane reaches pseudo-steady state and over timescales typically used in such experiments,
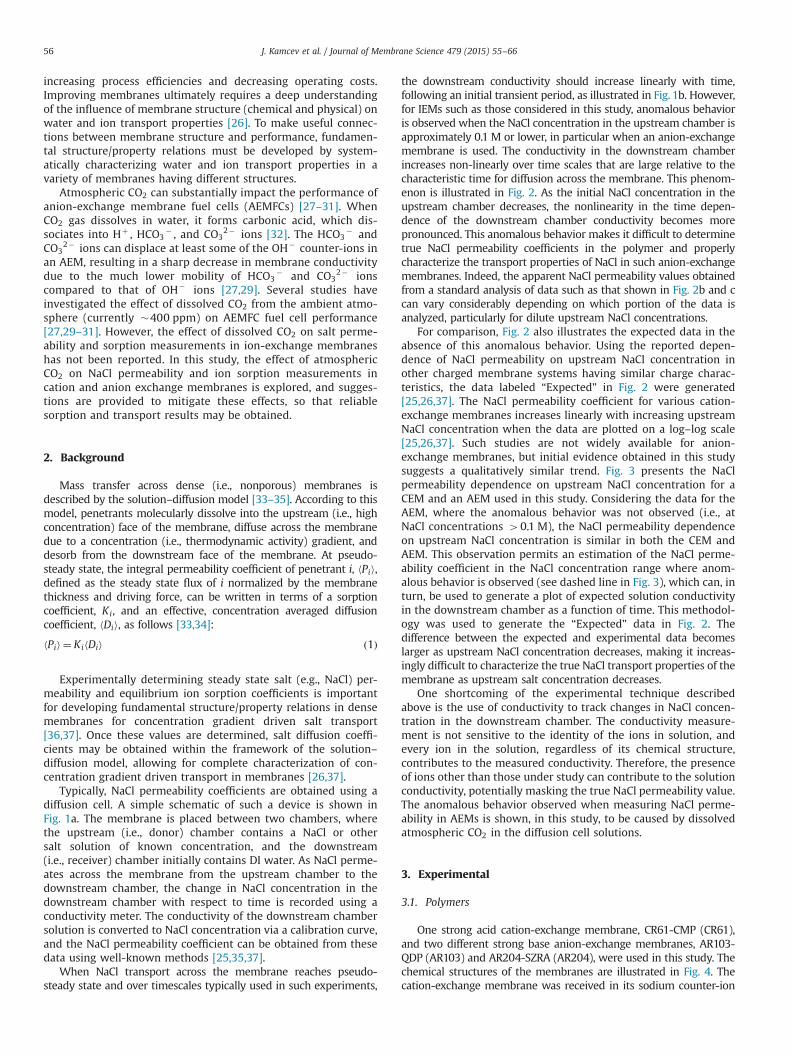
the downstream conductivity should increase linearly with time,following an initial transient period, as illustrated in Fig. 1b. However,for IEMs such as those considered in this study, anomalous behavioris observed when the NaCl concentration in the upstream chamber isapproximately 0.1 M or lower, in particular when an anion-exchangemembrane is used. The conductivity in the downstream chamberincreases non-linearly over time scales that are large relative to thecharacteristic time for diffusion across the membrane. This phenom-enon is illustrated in Fig. 2. As the initial NaCl concentration in theupstream chamber decreases, the nonlinearity in the time depen-dence of the downstream chamber conductivity becomes morepronounced. This anomalous behavior makes it difficult to determinetrue NaCl permeability coefficients in the polymer and properlycharacterize the transport properties of NaCl in such anion-exchangemembranes. Indeed, the apparent NaCl permeability values obtainedfrom a standard analysis of data such as that shown in Fig. 2b and ccan vary considerably depending on which portion of the data isanalyzed, particularly for dilute upstream NaCl concentrations.
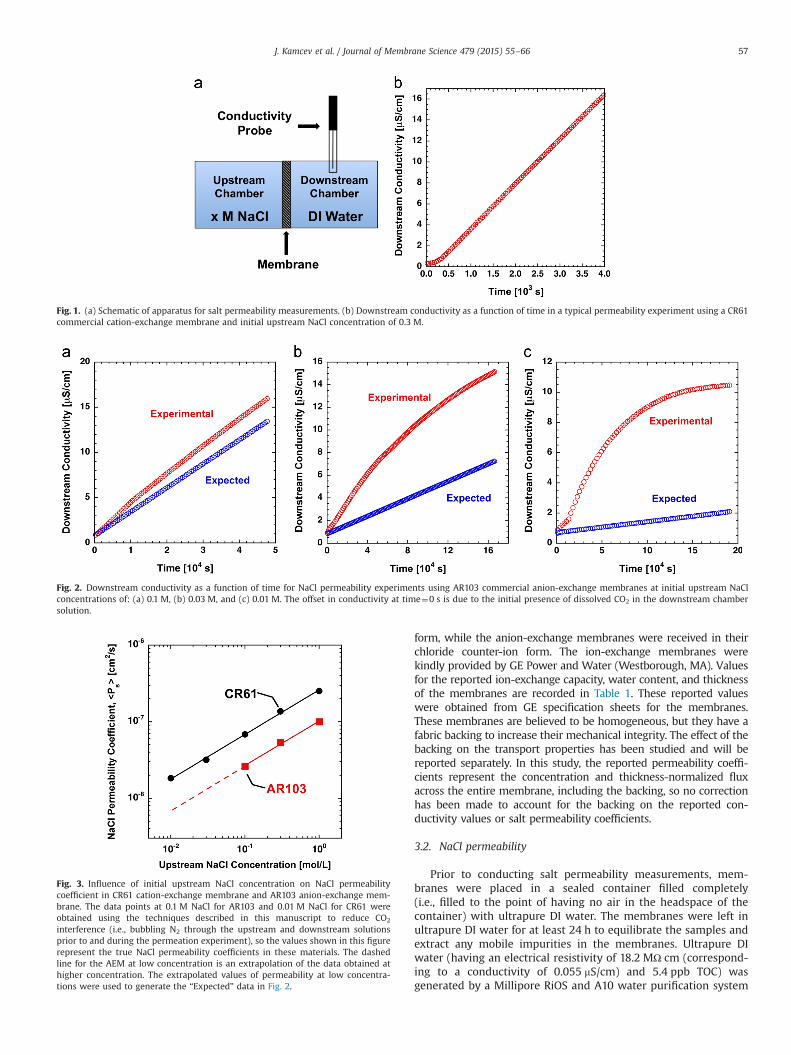
For comparison, Fig. 2 also illustrates the expected data in theabsence of this anomalous behavior. Using the reported depen-dence of NaCl permeability on upstream NaCl concentration inother charged membrane systems having similar charge charac-teristics, the data labeled “Expected” in Fig. 2 were generated[25,26,37]. The NaCl permeability coefficient for various cation-exchange membranes increases linearly with increasing upstreamNaCl concentration when the data are plotted on a log–log scale[25,26,37]. Such studies are not widely available for anion-exchange membranes, but initial evidence obtained in this studysuggests a qualitatively similar trend. Fig. 3 presents the NaClpermeability dependence on upstream NaCl concentration for aCEM and an AEM used in this study. Considering the data for theAEM, where the anomalous behavior was not observed (i.e., atNaCl concentrations 40.1 M), the NaCl permeability dependenceon upstream NaCl concentration is similar in both the CEM andAEM. This observation permits an estimation of the NaCl perme-ability coefficient in the NaCl concentration range where anom-alous behavior is observed (see dashed line in Fig. 3), which can, inturn, be used to generate a plot of expected solution conductivityin the downstream chamber as a function of time. This methodol-ogy was used to generate the “Expected” data in Fig. 2. Thedifference between the expected and experimental data becomeslarger as upstream NaCl concentration decreases, making it increas-ingly difficult to characterize the true NaCl transport properties of themembrane as upstream salt concentration decreases.
One shortcoming of the experimental technique describedabove is the use of conductivity to track changes in NaCl concen-tration in the downstream chamber. The conductivity measure-ment is not sensitive to the identity of the ions in solution, andevery ion in the solution, regardless of its chemical structure,contributes to the measured conductivity. Therefore, the presenceof ions other than those under study can contribute to the solutionconductivity, potentially masking the true NaCl permeability value.The anomalous behavior observed when measuring NaCl perme-ability in AEMs is shown, in this study, to be caused by dissolvedatmospheric CO2 in the diffusion cell solutions.
3. Experimental
3.1. Polymers
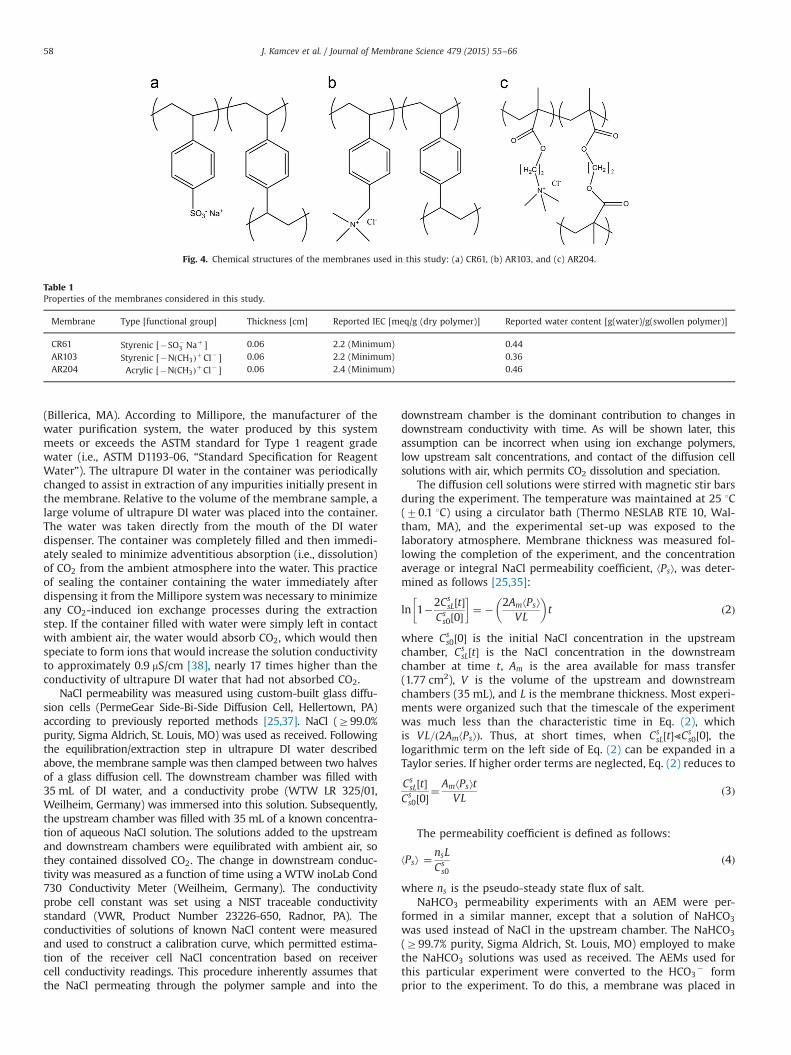
One strong acid cation-exchange membrane, CR61-CMP (CR61),and two different strong base anion-exchange membranes, AR103-QDP (AR103) and AR204-SZRA (AR204), were used in this study. Thechemical structures of the membranes are illustrated in Fig. 4. Thecation-exchange membrane was received in its sodium counter-ion
J. Kamcev et al. / Journal of Membrane Science 479 (2015) 55–6656
form, while the anion-exchange membranes were received in theirchloride counter-ion form. The ion-exchange membranes werekindly provided by GE Power and Water (Westborough, MA). Valuesfor the reported ion-exchange capacity, water content, and thicknessof the membranes are recorded in Table 1. These reported valueswere obtained from GE specification sheets for the membranes.These membranes are believed to be homogeneous, but they have afabric backing to increase their mechanical integrity. The effect of thebacking on the transport properties has been studied and will bereported separately. In this study, the reported permeability coeffi-cients represent the concentration and thickness-normalized fluxacross the entire membrane, including the backing, so no correctionhas been made to account for the backing on the reported con-ductivity values or salt permeability coefficients.
3.2. NaCl permeability
Prior to conducting salt permeability measurements, mem-branes were placed in a sealed container filled completely(i.e., filled to the point of having no air in the headspace of thecontainer) with ultrapure DI water. The membranes were left inultrapure DI water for at least 24 h to equilibrate the samples andextract any mobile impurities in the membranes. Ultrapure DIwater (having an electrical resistivity of 18.2 MΩ cm (correspond-ing to a conductivity of 0.055 mS/cm) and 5.4 ppb TOC) wasgenerated by a Millipore RiOS and A10 water purification system
Fig. 1. (a) Schematic of apparatus for salt permeability measurements. (b) Downstream conductivity as a function of time in a typical permeability experiment using a CR61commercial cation-exchange membrane and initial upstream NaCl concentration of 0.3 M.
Fig. 2. Downstream conductivity as a function of time for NaCl permeability experiments using AR103 commercial anion-exchange membranes at initial upstream NaClconcentrations of: (a) 0.1 M, (b) 0.03 M, and (c) 0.01 M. The offset in conductivity at time¼0 s is due to the initial presence of dissolved CO2 in the downstream chambersolution.
Fig. 3. Influence of initial upstream NaCl concentration on NaCl permeabilitycoefficient in CR61 cation-exchange membrane and AR103 anion-exchange mem-brane. The data points at 0.1 M NaCl for AR103 and 0.01 M NaCl for CR61 wereobtained using the techniques described in this manuscript to reduce CO2
interference (i.e., bubbling N2 through the upstream and downstream solutionsprior to and during the permeation experiment), so the values shown in this figurerepresent the true NaCl permeability coefficients in these materials. The dashedline for the AEM at low concentration is an extrapolation of the data obtained athigher concentration. The extrapolated values of permeability at low concentra-tions were used to generate the “Expected” data in Fig. 2.
J. Kamcev et al. / Journal of Membrane Science 479 (2015) 55–66 57
(Billerica, MA). According to Millipore, the manufacturer of thewater purification system, the water produced by this systemmeets or exceeds the ASTM standard for Type 1 reagent gradewater (i.e., ASTM D1193-06, “Standard Specification for ReagentWater”). The ultrapure DI water in the container was periodicallychanged to assist in extraction of any impurities initially present inthe membrane. Relative to the volume of the membrane sample, alarge volume of ultrapure DI water was placed into the container.The water was taken directly from the mouth of the DI waterdispenser. The container was completely filled and then immedi-ately sealed to minimize adventitious absorption (i.e., dissolution)of CO2 from the ambient atmosphere into the water. This practiceof sealing the container containing the water immediately afterdispensing it from the Millipore systemwas necessary to minimizeany CO2-induced ion exchange processes during the extractionstep. If the container filled with water were simply left in contactwith ambient air, the water would absorb CO2, which would thenspeciate to form ions that would increase the solution conductivityto approximately 0.9 mS/cm [38], nearly 17 times higher than theconductivity of ultrapure DI water that had not absorbed CO2.
NaCl permeability was measured using custom-built glass diffu-sion cells (PermeGear Side-Bi-Side Diffusion Cell, Hellertown, PA)according to previously reported methods [25,37]. NaCl (Z99.0%purity, Sigma Aldrich, St. Louis, MO) was used as received. Followingthe equilibration/extraction step in ultrapure DI water describedabove, the membrane sample was then clamped between two halvesof a glass diffusion cell. The downstream chamber was filled with35 mL of DI water, and a conductivity probe (WTW LR 325/01,Weilheim, Germany) was immersed into this solution. Subsequently,the upstream chamber was filled with 35 mL of a known concentra-tion of aqueous NaCl solution. The solutions added to the upstreamand downstream chambers were equilibrated with ambient air, sothey contained dissolved CO2. The change in downstream conduc-tivity was measured as a function of time using a WTW inoLab Cond730 Conductivity Meter (Weilheim, Germany). The conductivityprobe cell constant was set using a NIST traceable conductivitystandard (VWR, Product Number 23226-650, Radnor, PA). Theconductivities of solutions of known NaCl content were measuredand used to construct a calibration curve, which permitted estima-tion of the receiver cell NaCl concentration based on receivercell conductivity readings. This procedure inherently assumes thatthe NaCl permeating through the polymer sample and into the
downstream chamber is the dominant contribution to changes indownstream conductivity with time. As will be shown later, thisassumption can be incorrect when using ion exchange polymers,low upstream salt concentrations, and contact of the diffusion cellsolutions with air, which permits CO2 dissolution and speciation.
The diffusion cell solutions were stirred with magnetic stir barsduring the experiment. The temperature was maintained at 25 1C(70.1 1C) using a circulator bath (Thermo NESLAB RTE 10, Wal-tham, MA), and the experimental set-up was exposed to thelaboratory atmosphere. Membrane thickness was measured fol-lowing the completion of the experiment, and the concentrationaverage or integral NaCl permeability coefficient, ⟨Ps⟩, was deter-mined as follows [25,35]:
ln 1�2CssL t½ �
Css0 0½ �
� �¼ � 2Am⟨Ps⟩
VL
� �t ð2Þ
where Css0½0� is the initial NaCl concentration in the upstream
chamber, CssL½t� is the NaCl concentration in the downstream
chamber at time t, Am is the area available for mass transfer(1.77 cm2), V is the volume of the upstream and downstreamchambers (35 mL), and L is the membrane thickness. Most experi-ments were organized such that the timescale of the experimentwas much less than the characteristic time in Eq. (2), whichis VL=ð2Am⟨Ps⟩Þ. Thus, at short times, when Cs
sL t½ �⪡Css0 0½ �, the
logarithmic term on the left side of Eq. (2) can be expanded in aTaylor series. If higher order terms are neglected, Eq. (2) reduces to
CssL t½ �
Css0 0½ � ¼
Am⟨Ps⟩tVL
ð3Þ
The permeability coefficient is defined as follows:
⟨Ps⟩ ¼ nsLCss0
ð4Þ
where ns is the pseudo-steady state flux of salt.NaHCO3 permeability experiments with an AEM were per-
formed in a similar manner, except that a solution of NaHCO3
was used instead of NaCl in the upstream chamber. The NaHCO3
(Z99.7% purity, Sigma Aldrich, St. Louis, MO) employed to makethe NaHCO3 solutions was used as received. The AEMs used forthis particular experiment were converted to the HCO3
� formprior to the experiment. To do this, a membrane was placed in
Fig. 4. Chemical structures of the membranes used in this study: (a) CR61, (b) AR103, and (c) AR204.
Table 1Properties of the membranes considered in this study.
Membrane Type [functional group] Thickness [cm] Reported IEC [meq/g (dry polymer)] Reported water content [g(water)/g(swollen polymer)]
CR61 Styrenic [�SO�3 Naþ ] 0.06 2.2 (Minimum) 0.44
AR103 Styrenic [�N CH3ð Þþ Cl� ] 0.06 2.2 (Minimum) 0.36AR204 Acrylic [�N CH3ð Þþ Cl� ] 0.06 2.4 (Minimum) 0.46
J. Kamcev et al. / Journal of Membrane Science 479 (2015) 55–6658
a 0.3 M solution of NaHCO3 for at least 24 h, and the NaHCO3
solution was periodically replaced to facilitate replacement of Cl�
ions in the membrane by HCO3� ions via ion exchange. When an
IEM is placed in a solution containing a different counter-ionspecies from the one present in the membrane, ion exchangeequilibrium is attained where, at equilibrium, the membrane andsolution contain both types of counter-ions [2]. The ion exchangeprocess is reversible, so it does not matter from which sideequilibrium is approached [2]. According to Le Chatelier’s principle[39], immersing an AEM initially in the Cl� form into a concen-trated NaHCO3 solution will drive Cl� ions from the membraneinto the solution and HCO3
� ions from the solution into themembrane. The experiment was repeated by holding the mem-brane in the 0.3 M NaHCO3 solution for 48 h, and the finalpermeability results were not affected. Thus, soaking the mem-brane in 0.3 M NaHCO3 for 24 h was apparently sufficient to bringthe ion-exchange process to equilibrium. Following this step, themembranes were placed in DI water to extract sorbed mobileNaHCO3. The DI water was replaced often, and the conductivity ofthe water was measured to ensure that all mobile NaHCO3 hadbeen extracted from the membrane. The sorbed mobile NaHCO3
had to be completely removed so that the permeability experi-ments would not be influenced by desorption of this salt. Thesolutions in the chambers of the diffusion cell were exposed tothe ambient atmosphere throughout the NaHCO3 permeabilityexperiments.
Modification of the experimental procedure to minimize theamount of dissolved CO2 in the solutions involved bubbling ultra-high purity N2 gas (AirGas, Austin, TX) through the diffusion cellsduring the experiment. The nitrogen gas was first passed througha cold trap containing DI water to humidify the stream prior toentering the solutions in the diffusion cells. This step minimizedevaporation of solution from the cells during the experiment.Nitrogen was bubbled through the solutions in the cells via syringeneedles that reached the bottom of the cells and were connectedto a N2 gas cylinder via PVC tubing. After inserting the syringeneedles in the cells, the openings of the cells were sealed withParafilm. Nitrogenwas also bubbled through the NaCl solution thatwould be placed in the upstream chamber and the DI water thatwould be placed in the downstream compartment, by insertingthe needles in the graduated cylinders used for measuring thesolution volume for at least 30 min prior to beginning the experi-ment. This step ensured the removal of much of the dissolved CO2
from the solutions to be used in the diffusion cell experiments.
3.3. Desorption
Desorption experiments were performed using jacketed glassbeakers (100 mL Ace Glass Inc., Vineland, NJ). Circular membranecoupons (4.3 cm in diameter) were equilibrated/extracted inultrapure DI water prior to beginning the desorption experiment.This equilibration/extraction step was performed as describedabove for the permeability experiments, with care taken tominimize adventitious CO2-induced ion exchange processes. Fol-lowing this equilibration step, a membrane sample was placed in ajacketed glass beaker containing 75 mL of DI water that had beenpreviously equilibrated with the atmosphere, and the conductivityof this solution was recorded as a function of time. The tempera-ture was held at 25 1C using a circulator bath. After the experimentwas completed, the conductivity meter was turned off, and asample was immediately withdrawn from the solution for furtheranalysis. The concentration of Naþ ions in the desorption solutionof the experiment for the CEM was determined using flameatomic absorption (flame AA) spectrophotometry (Clayton SouthVarian AA240), and the concentration of Cl� ions in the deso-rption solution of the experiment for the AEM was determined
using ion chromatography (IC) (Dionex Corp. ICS-2100,Sunnyvale, CA).
3.4. Mobile ion concentration in membranes
The concentration of mobile ions in the membranes wasdetermined according to a previously reported desorption proce-dure [36]. A circular membrane sample was first washed andequilibrated in DI water. Typical diameters of membrane sampleswere 3.5–4.3 cm. The membranes were removed from the DIwater and, after wiping excess surface water off, were placed inan aqueous solution of NaCl at a known concentration, rangingfrom 0.01 M to 1 M. The NaCl solution was periodically replacedover a period of at least 24 h to ensure attainment of equilibrium.The volume of the hydrated membrane was determined geome-trically by carefully measuring its thickness and diameter follow-ing the NaCl equilibration step.
The membrane was removed from the NaCl solution, and itssurface was quickly and carefully wiped to remove excess solution.The membrane was then placed in a known volume(50–100 mL) of DI water for at least 24 h to allow desorption ofmobile ions. Following desorption, a sample was withdrawn fromthe desorption solution for further analysis. The Cl� ion concen-tration in the desorption solution was determined using IC, andthe Naþ ion concentration was determined using flame AA. Toensure that all mobile ions were desorbed, a second desorptionstep was performed following the same procedure, where themembrane was placed in a new aliquot of DI water for at least 24 hfollowed by IC and flame AA analysis. The concentration of mobileion i in the membrane, Cm
i , was calculated as follows:
Cmi ¼ Cd
i Vd
Vpð5Þ
where Cdi is the concentration of ion i in the desorption solution,
Vd is the desorption solution volume, and Vp is the swollenmembrane volume. If the second desorption solution containedmeasureable amounts of ions, they were also included in thecalculation of the total mobile ion concentration in the membraneusing the approach embodied in Eq. (5).
4. Results and discussion
4.1. NaCl permeability measurements
Carbon dioxide is present in the atmosphere at levels of about400 ppm [40], and it dissolves in water to form carbonic acid [32].Carbonic acid is diprotic and dissociates to form Hþ , HCO3
� , andCO3
2� ions [32]. The relevant equations for these processes, aswell as the equilibrium constants at ambient conditions, are [32]
CO2 gð Þþ H2O lð Þ⇌HCO3n lð Þ KH ¼ 10�1:5 ð6Þ
HCO3n lð Þ⇌Hþ lð ÞþHCO3
� ðlÞ Ka;1 ¼ 10�6:35 ð7Þ
HCO3� ðlÞ⇌Hþ lð ÞþCO3
2� ðlÞ Ka;2 ¼ 10�10:33 ð8ÞHCO3
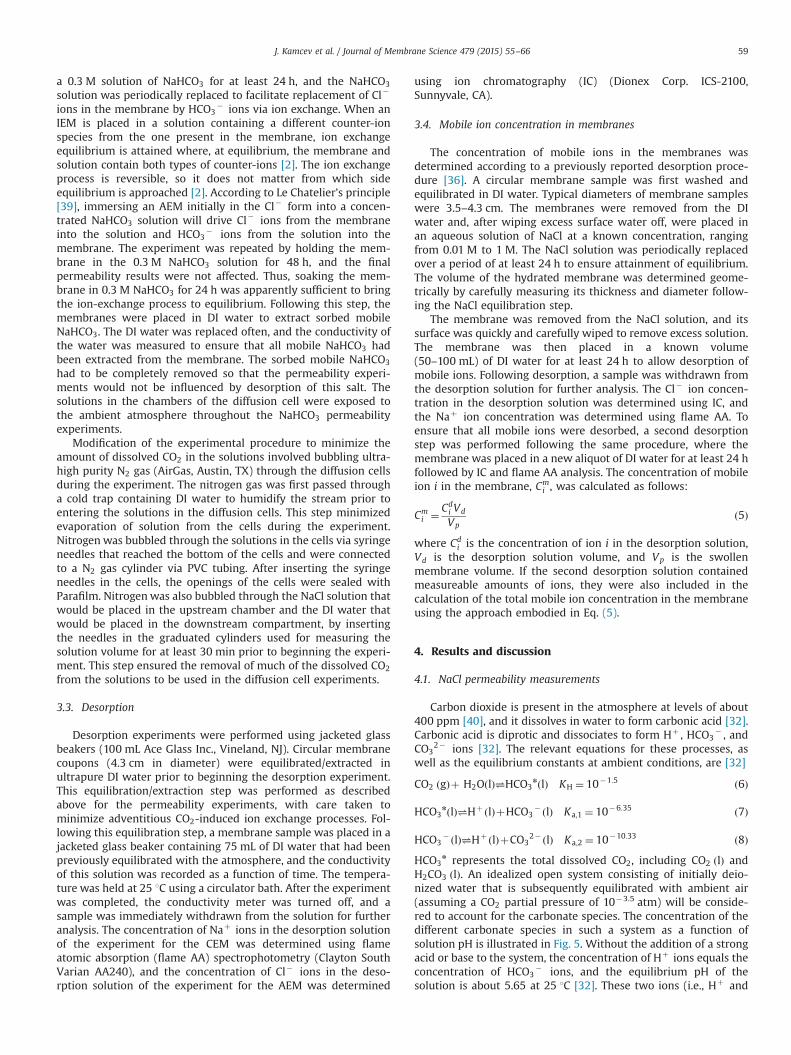
n represents the total dissolved CO2, including CO2 lð Þ andH2CO3 ðlÞ. An idealized open system consisting of initially deio-nized water that is subsequently equilibrated with ambient air(assuming a CO2 partial pressure of 10�3.5 atm) will be conside-red to account for the carbonate species. The concentration of thedifferent carbonate species in such a system as a function ofsolution pH is illustrated in Fig. 5. Without the addition of a strongacid or base to the system, the concentration of Hþ ions equals theconcentration of HCO3
� ions, and the equilibrium pH of thesolution is about 5.65 at 25 1C [32]. These two ions (i.e., Hþ and
J. Kamcev et al. / Journal of Membrane Science 479 (2015) 55–66 59
HCO3� ) constitute the majority of the ions in the solution at
equilibrium. As shown in Fig. 5, the concentrations OH� andCO3
2� ions at this pH are orders of magnitude less than theconcentrations of Hþ and HCO3
� ions. For our purposes, theconcentrations of OH� and CO3
2� ions are negligible compared tothose of Hþ and HCO3
� ions.To explain the anomalous behavior observed in the NaCl perme-
ability measurements, we consider initially deionized water equili-brated with the atmosphere (pH�5.6–5.7), which is a situation similarto that used in the experiments described earlier. When an anion-exchange membrane is placed between two aqueous solutions in adiffusion cell for a salt permeability measurement, HCO3
� ions in thesolutions ion exchange with Cl� ions in the membrane based on LeChatelier’s principle [39]. The aqueous solutions are in communicationwith ambient air, so there is an essentially infinite supply of HCO3
�
ions in the aqueous solutions due to the ability of these solutions to re-equilibrate with CO2 in the atmosphere anytime the HCO3
� ionconcentration deviates from its equilibrium value (cf., Fig. 5). Incontrast, there is a finite supply of Cl� counter-ions in the AEM. AsHCO3
� ions sorb into the membrane, the equilibrium in the externalsolution is disturbed, and the sorbed HCO3
� ions from the solution arereplenished by additional dissolution of CO2 from the atmosphere intothe solution, followed by dissociation of HCO3
� to Hþ and HCO3� .
Thus, during the permeability experiment, Hþ and Cl� ions, unrelatedto the permeation of the salt of interest (i.e., NaCl) through themembrane, appear in the downstream chamber as a result ofHCO3
� undergoing ion-exchange with the Cl� ions initially presentas counter-ions for the quaternary ammonium groups in the AEM.These Hþ and Cl� ions, like the Naþ and Cl� ions arriving in thedownstream compartment due to permeation of NaCl through themembrane, contribute to the downstream solution conductivity. Thenon-linear increase in downstream conductivity with time is a super-position of the conductivity increase due to permeation of NaCl acrossthemembrane and the conductivity increase due to introduction of Hþ
and Cl� ions from the ion exchange process between the membraneand the downstream solution phase. As discussed later, Hþ ions have aparticularly high mobility compared to other ions, so they contribute tothe solution conductivity in a manner that is far greater than onewould anticipate based simply on their concentration.
In the membranes considered in this study, the effect ofambient CO2 on NaCl permeability measurements is not observedwhen the NaCl concentration in the upstream chamber is higherthan about 0.1 M. In these cases, conductivity in the downstreamchamber increases linearly with time once the NaCl transport has
reached pseudo-steady state, as expected. As the upstream NaClconcentration increases, the flux of NaCl across the ion-exchangemembrane increases (cf., Eq. (4)), and the downstream chamberconductivity increase due to ion exchange between the membraneand solution becomes negligible relative to the conductivityincrease from transport of NaCl across the membrane. Thus, theanomalous behavior due to dissolved atmospheric CO2 is notobserved for higher upstream NaCl concentrations, and the result-ing conductivity versus time plots are linear (cf., Fig. 1b). Essen-tially, at high enough upstream NaCl concentrations, the transportof NaCl through the membrane overwhelms the ion exchangephenomena due to atmospheric CO2.
To further examine the role of HCO3� ions on the non-linear
conductivity vs. time behavior, permeability experiments wereperformed with an AEM (AR204) using NaHCO3 rather than NaClas the salt in the upstream chamber. The AEM was received in theCl� counter-ion form, and the Cl� counter-ions were exchangedto the largest extent possible with HCO3
� ions prior to beginningthe salt permeability experiment, as described in the experimentalsection. Upstream initial NaHCO3 concentrations of 0.01 M and0.03 M were used. Using NaCl at these concentrations withanother AEM (AR103) gave highly nonlinear conductivity versustime responses (cf., Fig. 2b and c). Nitrogen bubbling was not usedin these experiments; the experiments were conducted inambient air.
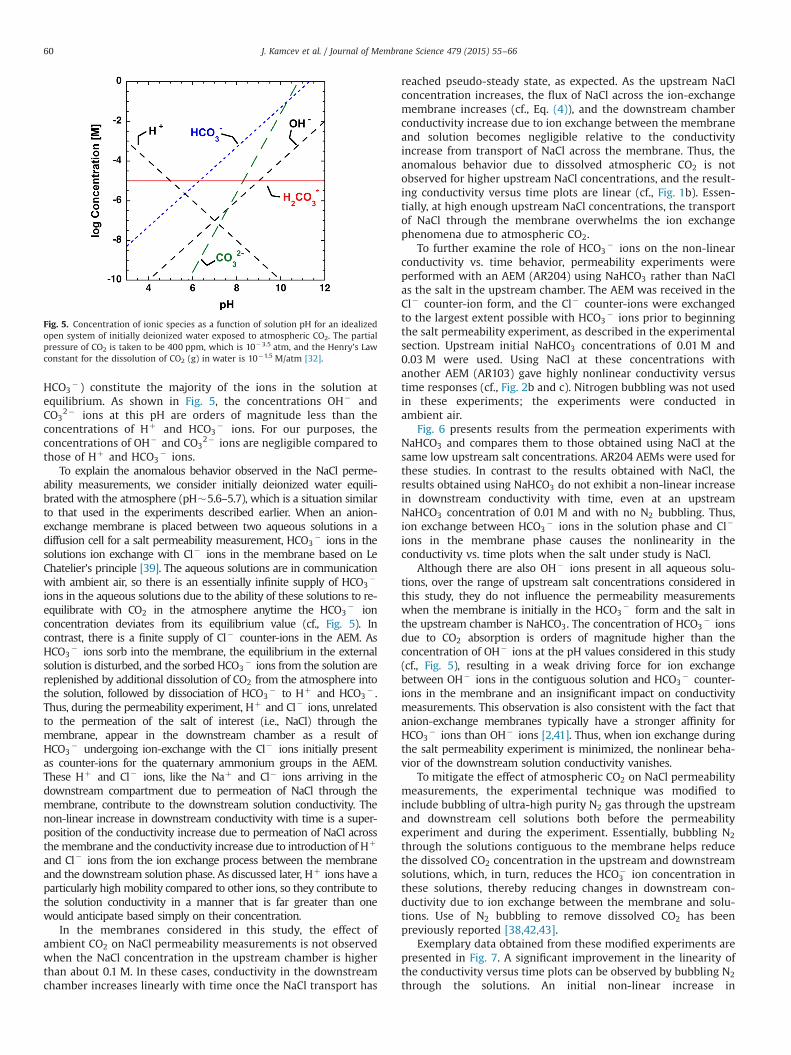
Fig. 6 presents results from the permeation experiments withNaHCO3 and compares them to those obtained using NaCl at thesame low upstream salt concentrations. AR204 AEMs were used forthese studies. In contrast to the results obtained with NaCl, theresults obtained using NaHCO3 do not exhibit a non-linear increasein downstream conductivity with time, even at an upstreamNaHCO3 concentration of 0.01 M and with no N2 bubbling. Thus,ion exchange between HCO3
� ions in the solution phase and Cl�
ions in the membrane phase causes the nonlinearity in theconductivity vs. time plots when the salt under study is NaCl.
Although there are also OH� ions present in all aqueous solu-tions, over the range of upstream salt concentrations considered inthis study, they do not influence the permeability measurementswhen the membrane is initially in the HCO3
� form and the salt inthe upstream chamber is NaHCO3. The concentration of HCO3
� ionsdue to CO2 absorption is orders of magnitude higher than theconcentration of OH� ions at the pH values considered in this study(cf., Fig. 5), resulting in a weak driving force for ion exchangebetween OH� ions in the contiguous solution and HCO3
� counter-ions in the membrane and an insignificant impact on conductivitymeasurements. This observation is also consistent with the fact thatanion-exchange membranes typically have a stronger affinity forHCO3
� ions than OH� ions [2,41]. Thus, when ion exchange duringthe salt permeability experiment is minimized, the nonlinear beha-vior of the downstream solution conductivity vanishes.
To mitigate the effect of atmospheric CO2 on NaCl permeabilitymeasurements, the experimental technique was modified toinclude bubbling of ultra-high purity N2 gas through the upstreamand downstream cell solutions both before the permeabilityexperiment and during the experiment. Essentially, bubbling N2
through the solutions contiguous to the membrane helps reducethe dissolved CO2 concentration in the upstream and downstreamsolutions, which, in turn, reduces the HCO�
3 ion concentration inthese solutions, thereby reducing changes in downstream con-ductivity due to ion exchange between the membrane and solu-tions. Use of N2 bubbling to remove dissolved CO2 has beenpreviously reported [38,42,43].
Exemplary data obtained from these modified experiments arepresented in Fig. 7. A significant improvement in the linearity ofthe conductivity versus time plots can be observed by bubbling N2
through the solutions. An initial non-linear increase in
Fig. 5. Concentration of ionic species as a function of solution pH for an idealizedopen system of initially deionized water exposed to atmospheric CO2. The partialpressure of CO2 is taken to be 400 ppm, which is 10�3.5 atm, and the Henry’s Lawconstant for the dissolution of CO2 (g) in water is 10�1.5 M/atm [32].
J. Kamcev et al. / Journal of Membrane Science 479 (2015) 55–6660
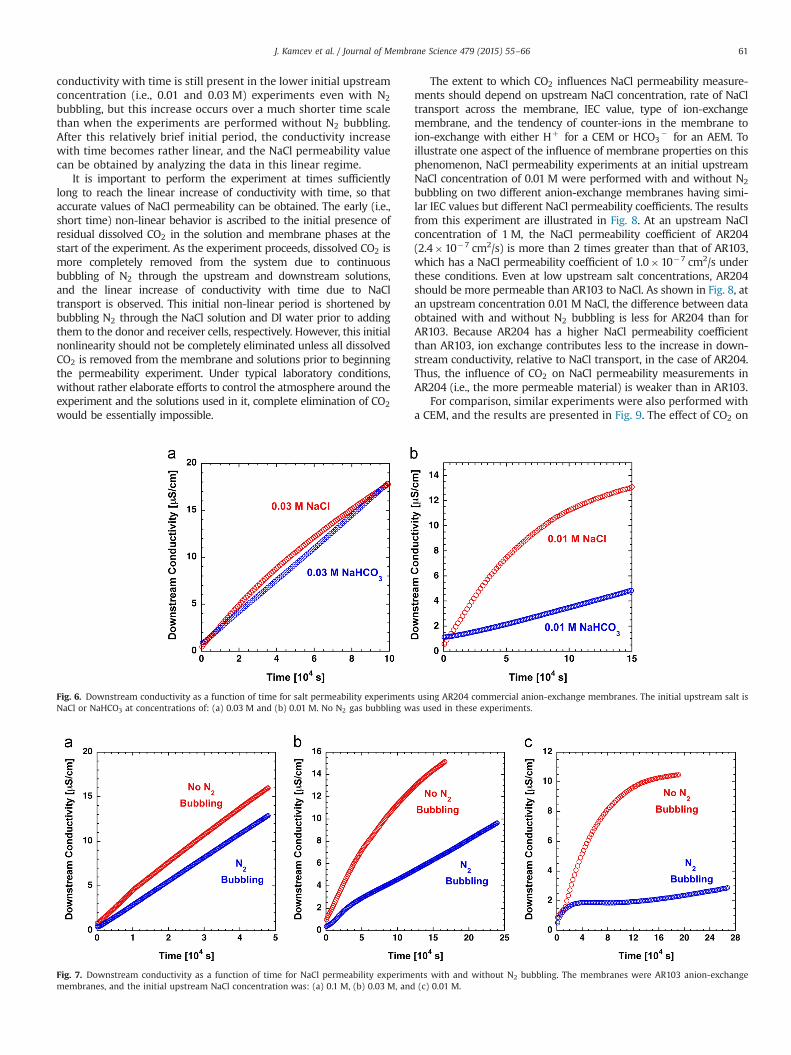
conductivity with time is still present in the lower initial upstreamconcentration (i.e., 0.01 and 0.03 M) experiments even with N2
bubbling, but this increase occurs over a much shorter time scalethan when the experiments are performed without N2 bubbling.After this relatively brief initial period, the conductivity increasewith time becomes rather linear, and the NaCl permeability valuecan be obtained by analyzing the data in this linear regime.
It is important to perform the experiment at times sufficientlylong to reach the linear increase of conductivity with time, so thataccurate values of NaCl permeability can be obtained. The early (i.e.,short time) non-linear behavior is ascribed to the initial presence ofresidual dissolved CO2 in the solution and membrane phases at thestart of the experiment. As the experiment proceeds, dissolved CO2 ismore completely removed from the system due to continuousbubbling of N2 through the upstream and downstream solutions,and the linear increase of conductivity with time due to NaCltransport is observed. This initial non-linear period is shortened bybubbling N2 through the NaCl solution and DI water prior to addingthem to the donor and receiver cells, respectively. However, this initialnonlinearity should not be completely eliminated unless all dissolvedCO2 is removed from the membrane and solutions prior to beginningthe permeability experiment. Under typical laboratory conditions,without rather elaborate efforts to control the atmosphere around theexperiment and the solutions used in it, complete elimination of CO2
would be essentially impossible.
The extent to which CO2 influences NaCl permeability measure-ments should depend on upstream NaCl concentration, rate of NaCltransport across the membrane, IEC value, type of ion-exchangemembrane, and the tendency of counter-ions in the membrane toion-exchange with either Hþ for a CEM or HCO3
� for an AEM. Toillustrate one aspect of the influence of membrane properties on thisphenomenon, NaCl permeability experiments at an initial upstreamNaCl concentration of 0.01 M were performed with and without N2
bubbling on two different anion-exchange membranes having simi-lar IEC values but different NaCl permeability coefficients. The resultsfrom this experiment are illustrated in Fig. 8. At an upstream NaClconcentration of 1 M, the NaCl permeability coefficient of AR204(2.4�10�7 cm2/s) is more than 2 times greater than that of AR103,which has a NaCl permeability coefficient of 1.0�10�7 cm2/s underthese conditions. Even at low upstream salt concentrations, AR204should be more permeable than AR103 to NaCl. As shown in Fig. 8, atan upstream concentration 0.01 M NaCl, the difference between dataobtained with and without N2 bubbling is less for AR204 than forAR103. Because AR204 has a higher NaCl permeability coefficientthan AR103, ion exchange contributes less to the increase in down-stream conductivity, relative to NaCl transport, in the case of AR204.Thus, the influence of CO2 on NaCl permeability measurements inAR204 (i.e., the more permeable material) is weaker than in AR103.
For comparison, similar experiments were also performed witha CEM, and the results are presented in Fig. 9. The effect of CO2 on
Fig. 6. Downstream conductivity as a function of time for salt permeability experiments using AR204 commercial anion-exchange membranes. The initial upstream salt isNaCl or NaHCO3 at concentrations of: (a) 0.03 M and (b) 0.01 M. No N2 gas bubbling was used in these experiments.
Fig. 7. Downstream conductivity as a function of time for NaCl permeability experiments with and without N2 bubbling. The membranes were AR103 anion-exchangemembranes, and the initial upstream NaCl concentration was: (a) 0.1 M, (b) 0.03 M, and (c) 0.01 M.
J. Kamcev et al. / Journal of Membrane Science 479 (2015) 55–66 61
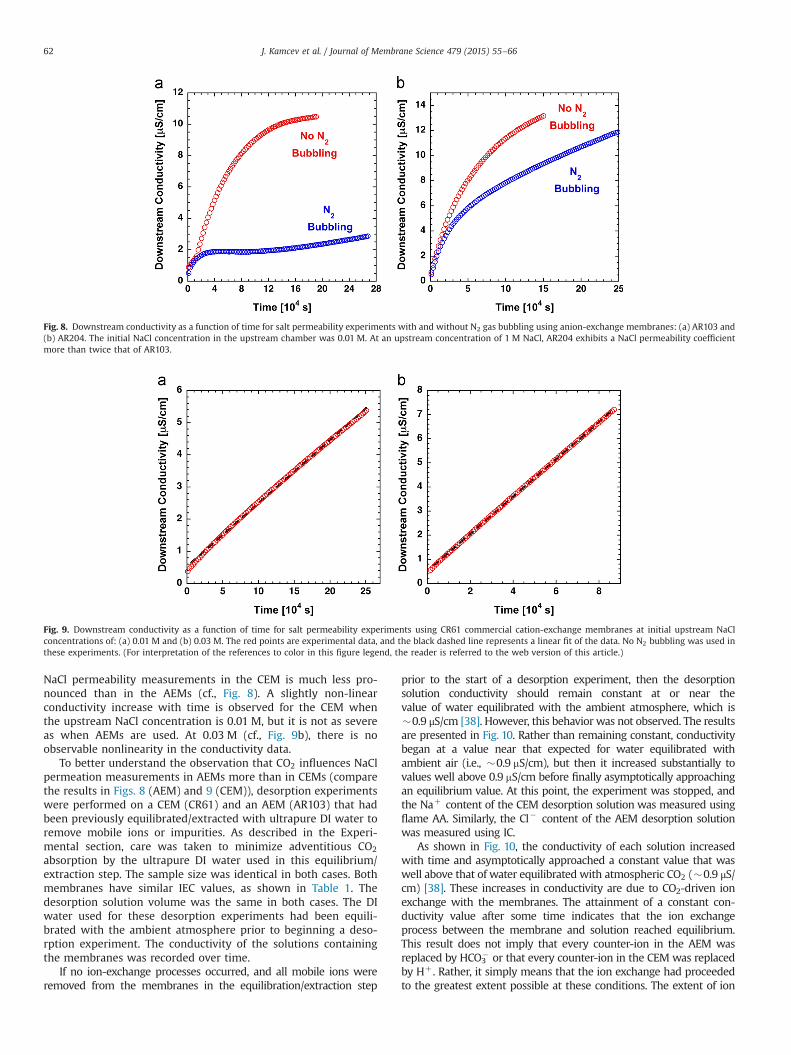
NaCl permeability measurements in the CEM is much less pro-nounced than in the AEMs (cf., Fig. 8). A slightly non-linearconductivity increase with time is observed for the CEM whenthe upstream NaCl concentration is 0.01 M, but it is not as severeas when AEMs are used. At 0.03 M (cf., Fig. 9b), there is noobservable nonlinearity in the conductivity data.
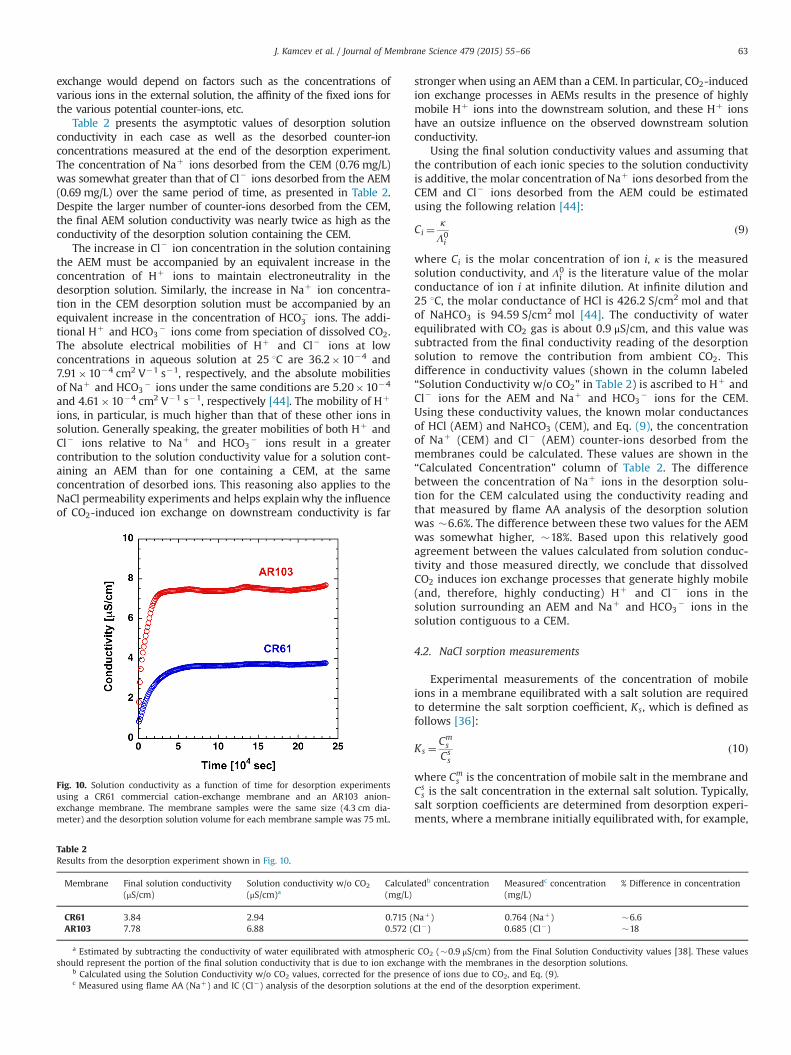
To better understand the observation that CO2 influences NaClpermeation measurements in AEMs more than in CEMs (comparethe results in Figs. 8 (AEM) and 9 (CEM)), desorption experimentswere performed on a CEM (CR61) and an AEM (AR103) that hadbeen previously equilibrated/extracted with ultrapure DI water toremove mobile ions or impurities. As described in the Experi-mental section, care was taken to minimize adventitious CO2
absorption by the ultrapure DI water used in this equilibrium/extraction step. The sample size was identical in both cases. Bothmembranes have similar IEC values, as shown in Table 1. Thedesorption solution volume was the same in both cases. The DIwater used for these desorption experiments had been equili-brated with the ambient atmosphere prior to beginning a deso-rption experiment. The conductivity of the solutions containingthe membranes was recorded over time.
If no ion-exchange processes occurred, and all mobile ions wereremoved from the membranes in the equilibration/extraction step
prior to the start of a desorption experiment, then the desorptionsolution conductivity should remain constant at or near thevalue of water equilibrated with the ambient atmosphere, which is�0.9 μS/cm [38]. However, this behavior was not observed. The resultsare presented in Fig. 10. Rather than remaining constant, conductivitybegan at a value near that expected for water equilibrated withambient air (i.e., �0.9 mS/cm), but then it increased substantially tovalues well above 0.9 mS/cm before finally asymptotically approachingan equilibrium value. At this point, the experiment was stopped, andthe Naþ content of the CEM desorption solution was measured usingflame AA. Similarly, the Cl� content of the AEM desorption solutionwas measured using IC.
As shown in Fig. 10, the conductivity of each solution increasedwith time and asymptotically approached a constant value that waswell above that of water equilibrated with atmospheric CO2 (�0.9 μS/cm) [38]. These increases in conductivity are due to CO2-driven ionexchange with the membranes. The attainment of a constant con-ductivity value after some time indicates that the ion exchangeprocess between the membrane and solution reached equilibrium.This result does not imply that every counter-ion in the AEM wasreplaced by HCO3
� or that every counter-ion in the CEM was replacedby Hþ . Rather, it simply means that the ion exchange had proceededto the greatest extent possible at these conditions. The extent of ion
Fig. 8. Downstream conductivity as a function of time for salt permeability experiments with and without N2 gas bubbling using anion-exchange membranes: (a) AR103 and(b) AR204. The initial NaCl concentration in the upstream chamber was 0.01 M. At an upstream concentration of 1 M NaCl, AR204 exhibits a NaCl permeability coefficientmore than twice that of AR103.
Fig. 9. Downstream conductivity as a function of time for salt permeability experiments using CR61 commercial cation-exchange membranes at initial upstream NaClconcentrations of: (a) 0.01 M and (b) 0.03 M. The red points are experimental data, and the black dashed line represents a linear fit of the data. No N2 bubbling was used inthese experiments. (For interpretation of the references to color in this figure legend, the reader is referred to the web version of this article.)
J. Kamcev et al. / Journal of Membrane Science 479 (2015) 55–6662
exchange would depend on factors such as the concentrations ofvarious ions in the external solution, the affinity of the fixed ions forthe various potential counter-ions, etc.
Table 2 presents the asymptotic values of desorption solutionconductivity in each case as well as the desorbed counter-ionconcentrations measured at the end of the desorption experiment.The concentration of Naþ ions desorbed from the CEM (0.76 mg/L)was somewhat greater than that of Cl� ions desorbed from the AEM(0.69 mg/L) over the same period of time, as presented in Table 2.Despite the larger number of counter-ions desorbed from the CEM,the final AEM solution conductivity was nearly twice as high as theconductivity of the desorption solution containing the CEM.
The increase in Cl� ion concentration in the solution containingthe AEM must be accompanied by an equivalent increase in theconcentration of Hþ ions to maintain electroneutrality in thedesorption solution. Similarly, the increase in Naþ ion concentra-tion in the CEM desorption solution must be accompanied by anequivalent increase in the concentration of HCO�
3 ions. The addi-tional Hþ and HCO3
� ions come from speciation of dissolved CO2.The absolute electrical mobilities of Hþ and Cl� ions at lowconcentrations in aqueous solution at 25 1C are 36.2�10�4 and7.91�10�4 cm2 V�1 s�1, respectively, and the absolute mobilitiesof Naþ and HCO3
� ions under the same conditions are 5.20�10�4
and 4.61�10�4 cm2 V�1 s�1, respectively [44]. The mobility of Hþ
ions, in particular, is much higher than that of these other ions insolution. Generally speaking, the greater mobilities of both Hþ andCl� ions relative to Naþ and HCO3
� ions result in a greatercontribution to the solution conductivity value for a solution cont-aining an AEM than for one containing a CEM, at the sameconcentration of desorbed ions. This reasoning also applies to theNaCl permeability experiments and helps explain why the influenceof CO2-induced ion exchange on downstream conductivity is far
stronger when using an AEM than a CEM. In particular, CO2-inducedion exchange processes in AEMs results in the presence of highlymobile Hþ ions into the downstream solution, and these Hþ ionshave an outsize influence on the observed downstream solutionconductivity.
Using the final solution conductivity values and assuming thatthe contribution of each ionic species to the solution conductivityis additive, the molar concentration of Naþ ions desorbed from theCEM and Cl� ions desorbed from the AEM could be estimatedusing the following relation [44]:
Ci ¼κ
Λ0i
ð9Þ
where Ci is the molar concentration of ion i, κ is the measuredsolution conductivity, and Λ0
i is the literature value of the molarconductance of ion i at infinite dilution. At infinite dilution and25 1C, the molar conductance of HCl is 426.2 S/cm2 mol and thatof NaHCO3 is 94.59 S/cm2 mol [44]. The conductivity of waterequilibrated with CO2 gas is about 0.9 μS/cm, and this value wassubtracted from the final conductivity reading of the desorptionsolution to remove the contribution from ambient CO2. Thisdifference in conductivity values (shown in the column labeled“Solution Conductivity w/o CO2” in Table 2) is ascribed to Hþ andCl� ions for the AEM and Naþ and HCO3
� ions for the CEM.Using these conductivity values, the known molar conductancesof HCl (AEM) and NaHCO3 (CEM), and Eq. (9), the concentrationof Naþ (CEM) and Cl� (AEM) counter-ions desorbed from themembranes could be calculated. These values are shown in the“Calculated Concentration” column of Table 2. The differencebetween the concentration of Naþ ions in the desorption solu-tion for the CEM calculated using the conductivity reading andthat measured by flame AA analysis of the desorption solutionwas �6.6%. The difference between these two values for the AEMwas somewhat higher, �18%. Based upon this relatively goodagreement between the values calculated from solution conduc-tivity and those measured directly, we conclude that dissolvedCO2 induces ion exchange processes that generate highly mobile(and, therefore, highly conducting) Hþ and Cl� ions in thesolution surrounding an AEM and Naþ and HCO3
� ions in thesolution contiguous to a CEM.
4.2. NaCl sorption measurements
Experimental measurements of the concentration of mobileions in a membrane equilibrated with a salt solution are requiredto determine the salt sorption coefficient, Ks, which is defined asfollows [36]:
Ks ¼Cms
Css
ð10Þ
where Cms is the concentration of mobile salt in the membrane and
Css is the salt concentration in the external salt solution. Typically,
salt sorption coefficients are determined from desorption experi-ments, where a membrane initially equilibrated with, for example,
Fig. 10. Solution conductivity as a function of time for desorption experimentsusing a CR61 commercial cation-exchange membrane and an AR103 anion-exchange membrane. The membrane samples were the same size (4.3 cm dia-meter) and the desorption solution volume for each membrane sample was 75 mL.
Table 2Results from the desorption experiment shown in Fig. 10.
Membrane Final solution conductivity(μS/cm)
Solution conductivity w/o CO2
(μS/cm)aCalculatedb concentration(mg/L)
Measuredc concentration(mg/L)
% Difference in concentration
CR61 3.84 2.94 0.715 (Naþ) 0.764 (Naþ) �6.6AR103 7.78 6.88 0.572 (Cl�) 0.685 (Cl�) �18
a Estimated by subtracting the conductivity of water equilibrated with atmospheric CO2 (�0.9 μS/cm) from the Final Solution Conductivity values [38]. These valuesshould represent the portion of the final solution conductivity that is due to ion exchange with the membranes in the desorption solutions.
b Calculated using the Solution Conductivity w/o CO2 values, corrected for the presence of ions due to CO2, and Eq. (9).c Measured using flame AA (Naþ) and IC (Cl�) analysis of the desorption solutions at the end of the desorption experiment.
J. Kamcev et al. / Journal of Membrane Science 479 (2015) 55–66 63
NaCl is placed in DI water, and the mobile ions desorb from themembrane into the surrounding solution [36]. The concentrationof desorbed ions in the solution can be measured, and theconcentration of ions in the membrane can be inferred from theconcentration of desorbed ions, the desorption solution volume,and the membrane volume (cf., Eq. (5)) [36]. For NaCl sorption inan uncharged membrane, the concentration of sorbed Naþ ionsmust be equal to the concentration of sorbed Cl� ions to maintainelectroneutrality. Therefore, the desorption solution may be ana-lyzed for the concentration of either ion to obtain the NaClsorption coefficient. This result has been demonstrated experi-mentally [36].
However, the situation is more complex when considering IEMsbecause of the fixed charge groups. For example, when a CEM isequilibrated in a NaCl solution, electroneutrality requires that anequivalent amount of Naþ ions balance the fixed charges on thepolymer backbone. Some Cl� ions also sorb into the membrane, andthey must be accompanied by an equivalent number of Naþ ions.These ions constitute the mobile ions that largely govern saltpermeability in such materials. At the NaCl concentrations and IECvalues considered in this study, the membrane concentration of Naþ
ions (counter-ions) is enormously greater than the concentration ofCl� ions (co-ions). The sorbed co-ions are mobile ions, meaning thatthey will enter and leave the membrane phase in the absence of anexternally applied electric field. However, the counter-ions may onlyleave the membrane if they are accompanied by co-ions or whendifferent counter-ions simultaneously sorb into the membrane(i.e., ion-exchange).
In the ideal case where the desorption solution contains onlyHþ and OH� ions at very low concentrations, the concentrations ofNaþ and Cl� ions desorbing from an IEM equilibrated with a NaClsolution should be equal to one another, similar to the case of anuncharged membrane. However, the presence of dissolved CO2
supplies the desorption solution with Hþ and HCO3� ions at
relatively high concentrations (cf., Fig. 5), and these additional ionscan ion exchange with the counter-ions in the membrane.Thus, the concentrations of Naþ and Cl� ions desorbing fromthe membrane may be quite different from each other, whichfrustrates a precise determination of the mobile NaCl sorptioncoefficient by this method.
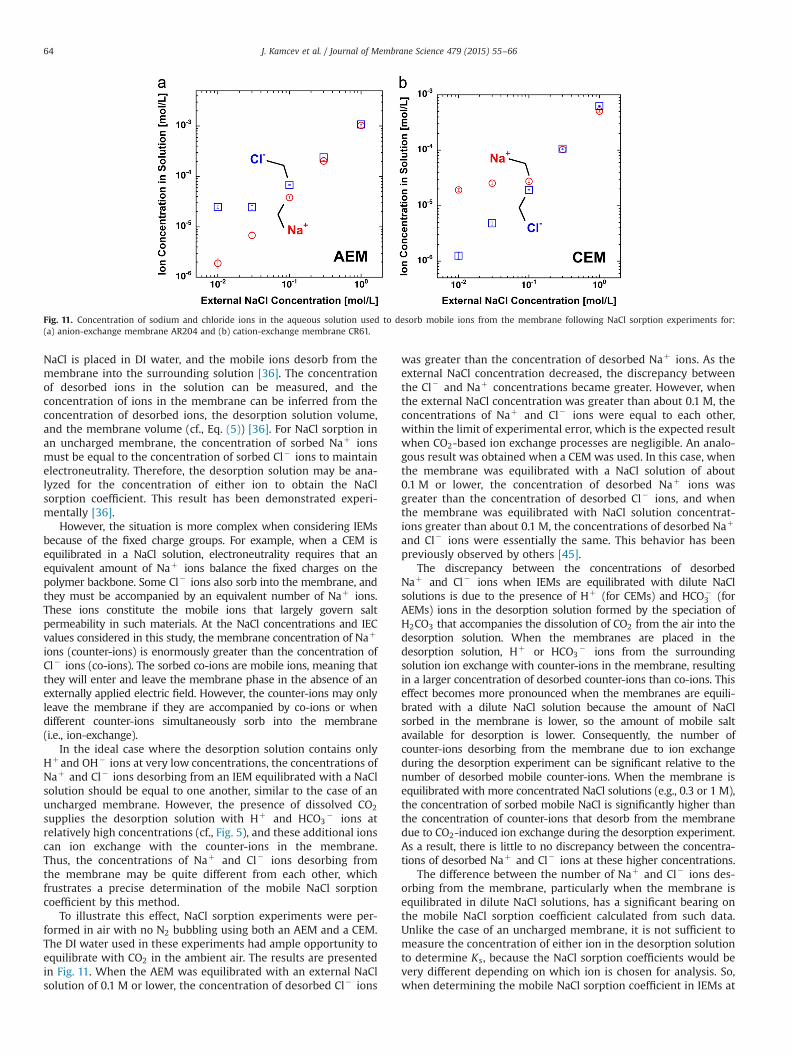
To illustrate this effect, NaCl sorption experiments were per-formed in air with no N2 bubbling using both an AEM and a CEM.The DI water used in these experiments had ample opportunity toequilibrate with CO2 in the ambient air. The results are presentedin Fig. 11. When the AEM was equilibrated with an external NaClsolution of 0.1 M or lower, the concentration of desorbed Cl� ions
was greater than the concentration of desorbed Naþ ions. As theexternal NaCl concentration decreased, the discrepancy betweenthe Cl� and Naþ concentrations became greater. However, whenthe external NaCl concentration was greater than about 0.1 M, theconcentrations of Naþ and Cl� ions were equal to each other,within the limit of experimental error, which is the expected resultwhen CO2-based ion exchange processes are negligible. An analo-gous result was obtained when a CEM was used. In this case, whenthe membrane was equilibrated with a NaCl solution of about0.1 M or lower, the concentration of desorbed Naþ ions wasgreater than the concentration of desorbed Cl� ions, and whenthe membrane was equilibrated with NaCl solution concentrat-ions greater than about 0.1 M, the concentrations of desorbed Naþ
and Cl� ions were essentially the same. This behavior has beenpreviously observed by others [45].
The discrepancy between the concentrations of desorbedNaþ and Cl� ions when IEMs are equilibrated with dilute NaClsolutions is due to the presence of Hþ (for CEMs) and HCO�
3 (forAEMs) ions in the desorption solution formed by the speciation ofH2CO3 that accompanies the dissolution of CO2 from the air into thedesorption solution. When the membranes are placed in thedesorption solution, Hþ or HCO3
� ions from the surroundingsolution ion exchange with counter-ions in the membrane, resultingin a larger concentration of desorbed counter-ions than co-ions. Thiseffect becomes more pronounced when the membranes are equili-brated with a dilute NaCl solution because the amount of NaClsorbed in the membrane is lower, so the amount of mobile saltavailable for desorption is lower. Consequently, the number ofcounter-ions desorbing from the membrane due to ion exchangeduring the desorption experiment can be significant relative to thenumber of desorbed mobile counter-ions. When the membrane isequilibrated with more concentrated NaCl solutions (e.g., 0.3 or 1 M),the concentration of sorbed mobile NaCl is significantly higher thanthe concentration of counter-ions that desorb from the membranedue to CO2-induced ion exchange during the desorption experiment.As a result, there is little to no discrepancy between the concentra-tions of desorbed Naþ and Cl� ions at these higher concentrations.
The difference between the number of Naþ and Cl� ions des-orbing from the membrane, particularly when the membrane isequilibrated in dilute NaCl solutions, has a significant bearing onthe mobile NaCl sorption coefficient calculated from such data.Unlike the case of an uncharged membrane, it is not sufficient tomeasure the concentration of either ion in the desorption solutionto determine Ks, because the NaCl sorption coefficients would bevery different depending on which ion is chosen for analysis. So,when determining the mobile NaCl sorption coefficient in IEMs at
Fig. 11. Concentration of sodium and chloride ions in the aqueous solution used to desorb mobile ions from the membrane following NaCl sorption experiments for:(a) anion-exchange membrane AR204 and (b) cation-exchange membrane CR61.
J. Kamcev et al. / Journal of Membrane Science 479 (2015) 55–6664
various external NaCl concentrations, it is imperative to measurethe concentration of desorbed co-ions (i.e., Naþ for AEM and Cl�
for CEM) in the desorption solution. If the concentration ofdesorbed counter-ions (i.e., Cl� for AEM and Naþ for CEM) ismeasured instead, the results can be significantly affected by ionexchange due to dissolved ambient CO2, and the true NaClsorption coefficient cannot be determined, particularly at diluteexternal NaCl concentrations.
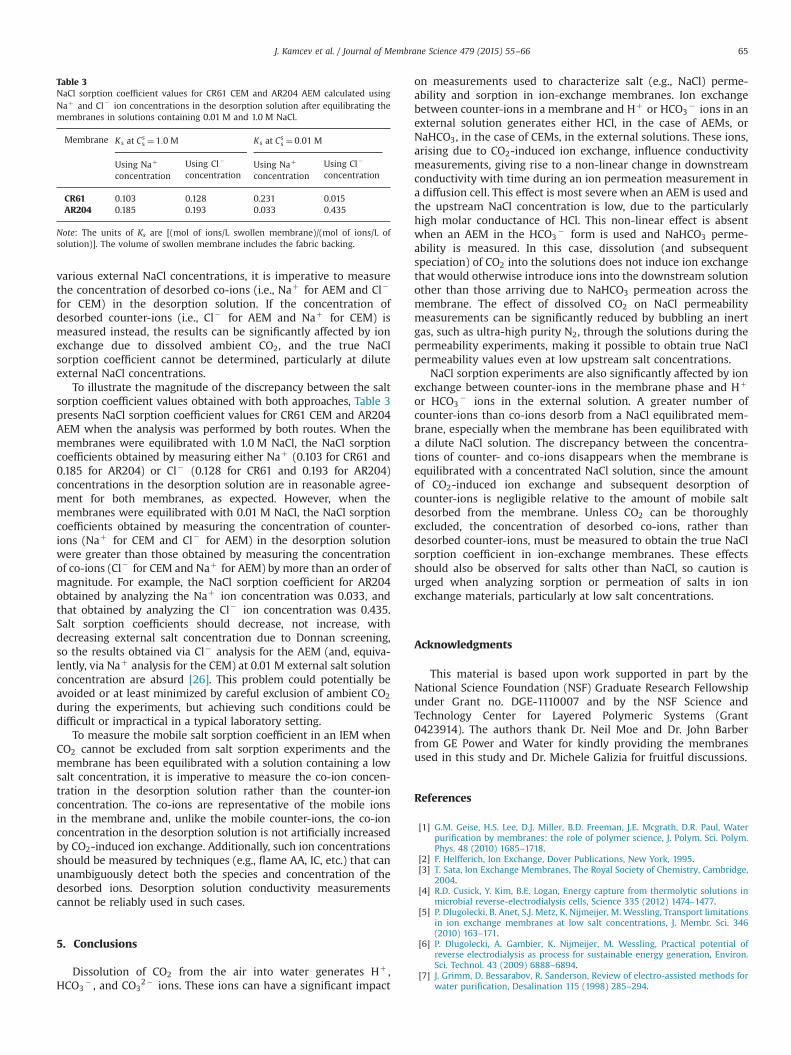
To illustrate the magnitude of the discrepancy between the saltsorption coefficient values obtained with both approaches, Table 3presents NaCl sorption coefficient values for CR61 CEM and AR204AEM when the analysis was performed by both routes. When themembranes were equilibrated with 1.0 M NaCl, the NaCl sorptioncoefficients obtained by measuring either Naþ (0.103 for CR61 and0.185 for AR204) or Cl� (0.128 for CR61 and 0.193 for AR204)concentrations in the desorption solution are in reasonable agree-ment for both membranes, as expected. However, when themembranes were equilibrated with 0.01 M NaCl, the NaCl sorptioncoefficients obtained by measuring the concentration of counter-ions (Naþ for CEM and Cl� for AEM) in the desorption solutionwere greater than those obtained by measuring the concentrationof co-ions (Cl� for CEM and Naþ for AEM) by more than an order ofmagnitude. For example, the NaCl sorption coefficient for AR204obtained by analyzing the Naþ ion concentration was 0.033, andthat obtained by analyzing the Cl� ion concentration was 0.435.Salt sorption coefficients should decrease, not increase, withdecreasing external salt concentration due to Donnan screening,so the results obtained via Cl� analysis for the AEM (and, equiva-lently, via Naþ analysis for the CEM) at 0.01 M external salt solutionconcentration are absurd [26]. This problem could potentially beavoided or at least minimized by careful exclusion of ambient CO2
during the experiments, but achieving such conditions could bedifficult or impractical in a typical laboratory setting.
To measure the mobile salt sorption coefficient in an IEM whenCO2 cannot be excluded from salt sorption experiments and themembrane has been equilibrated with a solution containing a lowsalt concentration, it is imperative to measure the co-ion concen-tration in the desorption solution rather than the counter-ionconcentration. The co-ions are representative of the mobile ionsin the membrane and, unlike the mobile counter-ions, the co-ionconcentration in the desorption solution is not artificially increasedby CO2-induced ion exchange. Additionally, such ion concentrationsshould be measured by techniques (e.g., flame AA, IC, etc.) that canunambiguously detect both the species and concentration of thedesorbed ions. Desorption solution conductivity measurementscannot be reliably used in such cases.
5. Conclusions
Dissolution of CO2 from the air into water generates Hþ ,HCO3
� , and CO32� ions. These ions can have a significant impact
on measurements used to characterize salt (e.g., NaCl) perme-ability and sorption in ion-exchange membranes. Ion exchangebetween counter-ions in a membrane and Hþ or HCO3
� ions in anexternal solution generates either HCl, in the case of AEMs, orNaHCO3, in the case of CEMs, in the external solutions. These ions,arising due to CO2-induced ion exchange, influence conductivitymeasurements, giving rise to a non-linear change in downstreamconductivity with time during an ion permeation measurement ina diffusion cell. This effect is most severe when an AEM is used andthe upstream NaCl concentration is low, due to the particularlyhigh molar conductance of HCl. This non-linear effect is absentwhen an AEM in the HCO3
� form is used and NaHCO3 perme-ability is measured. In this case, dissolution (and subsequentspeciation) of CO2 into the solutions does not induce ion exchangethat would otherwise introduce ions into the downstream solutionother than those arriving due to NaHCO3 permeation across themembrane. The effect of dissolved CO2 on NaCl permeabilitymeasurements can be significantly reduced by bubbling an inertgas, such as ultra-high purity N2, through the solutions during thepermeability experiments, making it possible to obtain true NaClpermeability values even at low upstream salt concentrations.
NaCl sorption experiments are also significantly affected by ionexchange between counter-ions in the membrane phase and Hþ
or HCO3� ions in the external solution. A greater number of
counter-ions than co-ions desorb from a NaCl equilibrated mem-brane, especially when the membrane has been equilibrated witha dilute NaCl solution. The discrepancy between the concentra-tions of counter- and co-ions disappears when the membrane isequilibrated with a concentrated NaCl solution, since the amountof CO2-induced ion exchange and subsequent desorption ofcounter-ions is negligible relative to the amount of mobile saltdesorbed from the membrane. Unless CO2 can be thoroughlyexcluded, the concentration of desorbed co-ions, rather thandesorbed counter-ions, must be measured to obtain the true NaClsorption coefficient in ion-exchange membranes. These effectsshould also be observed for salts other than NaCl, so caution isurged when analyzing sorption or permeation of salts in ionexchange materials, particularly at low salt concentrations.
Acknowledgments
This material is based upon work supported in part by theNational Science Foundation (NSF) Graduate Research Fellowshipunder Grant no. DGE-1110007 and by the NSF Science andTechnology Center for Layered Polymeric Systems (Grant0423914). The authors thank Dr. Neil Moe and Dr. John Barberfrom GE Power and Water for kindly providing the membranesused in this study and Dr. Michele Galizia for fruitful discussions.
References
[1] G.M. Geise, H.S. Lee, D.J. Miller, B.D. Freeman, J.E. Mcgrath, D.R. Paul, Waterpurification by membranes: the role of polymer science, J. Polym. Sci. Polym.Phys. 48 (2010) 1685–1718.
[2] F. Helfferich, Ion Exchange, Dover Publications, New York, 1995.[3] T. Sata, Ion Exchange Membranes, The Royal Society of Chemistry, Cambridge,
2004.[4] R.D. Cusick, Y. Kim, B.E. Logan, Energy capture from thermolytic solutions in
microbial reverse-electrodialysis cells, Science 335 (2012) 1474–1477.[5] P. Dlugolecki, B. Anet, S.J. Metz, K. Nijmeijer, M. Wessling, Transport limitations
in ion exchange membranes at low salt concentrations, J. Membr. Sci. 346(2010) 163–171.
[6] P. Dlugolecki, A. Gambier, K. Nijmeijer, M. Wessling, Practical potential ofreverse electrodialysis as process for sustainable energy generation, Environ.Sci. Technol. 43 (2009) 6888–6894.
[7] J. Grimm, D. Bessarabov, R. Sanderson, Review of electro-assisted methods forwater purification, Desalination 115 (1998) 285–294.
Table 3NaCl sorption coefficient values for CR61 CEM and AR204 AEM calculated usingNaþ and Cl� ion concentrations in the desorption solution after equilibrating themembranes in solutions containing 0.01 M and 1.0 M NaCl.
Membrane Ks at Css ¼ 1:0 M Ks at C
ss ¼ 0:01 M
Using Naþ
concentrationUsing Cl�
concentrationUsing Naþ
concentrationUsing Cl�
concentration
CR61 0.103 0.128 0.231 0.015AR204 0.185 0.193 0.033 0.435
Note: The units of Ks are [(mol of ions/L swollen membrane)/(mol of ions/L ofsolution)]. The volume of swollen membrane includes the fabric backing.
J. Kamcev et al. / Journal of Membrane Science 479 (2015) 55–66 65

[8] R.K. Nagarale, G.S. Gohil, V.K. Shahi, Recent developments on ion-exchangemembranes and electro-membrane processes, Adv. Colloid Interface Sci. 119(2006) 97–130.
[9] J.W. Post, J. Veerman, H.V.M. Hamelers, G.J.W. Euverink, S.J. Metz, K. Nymeijer,C.J.N. Buisman, Salinity-gradient power: evaluation of pressure-retardedosmosis and reverse electrodialysis, J. Membr. Sci. 288 (2007) 218–230.
[10] M. Turek, B. Bandura, Renewable energy by reverse electrodialysis, Desalina-tion 205 (2007) 67–74.
[11] J. Veerman, R.M. de Jong, M. Saakes, S.J. Metz, G.J. Harmsen, Reverse electro-dialysis: comparison of six commercial membrane pairs on the thermody-namic efficiency and power density, J. Membr. Sci. 343 (2009) 7–15.
[12] T.W. Xu, C.H. Huang, Electrodialysis-based separation technologies: a criticalreview, AIChE J. 54 (2008) 3147–3159.
[13] M.A. Hickner, Ion-containing polymers: new energy & clean water, MaterToday 13 (2010) 34–41.
[14] M.A. Hickner, C.H. Fujimoto, C.J. Cornelius, Transport in sulfonated poly(phenylene)s: proton conductivity, permeability, and the state of water,Polymer 47 (2006) 4238–4244.
[15] M.A. Hickner, H. Ghassemi, Y.S. Kim, B.R. Einsla, J.E. McGrath, Alternativepolymer systems for proton exchange membranes (PEMs), Chem. Rev. 104(2004) 4587–4611.
[16] K.D. Kreuer, On the development of proton conducting polymer membranesfor hydrogen and methanol fuel cells, J. Membr. Sci. 185 (2001) 29–39.
[17] X.F. Li, H.M. Zhang, Z.S. Mai, H.Z. Zhang, I. Vankelecom, Ion exchangemembranes for vanadium redox flow battery (VRB) applications, EnergyEnviron. Sci. 4 (2011) 1147–1160.
[18] T. Mohammadi, M. Skyllas-Kazacos, Characterization of novel compositemembrane for redox flow battery applications, J. Membr. Sci. 98 (1995) 77–87.
[19] T.Y. Cath, A.E. Childress, M. Elimelech, Forward osmosis: principles, applica-tions, and recent developments, J. Membr. Sci. 281 (2006) 70–87.
[20] K.P. Lee, T.C. Arnot, D. Mattia, A review of reverse osmosis membranematerials for desalination-development to date and future potential, J. Membr.Sci. 370 (2011) 1–22.
[21] J.R. McCutcheon, R.L. McGinnis, M. Elimelech, A novel ammonia–carbondioxide forward (direct) osmosis desalination process, Desalination 174(2005) 1–11.
[22] R.L. McGinnis, J.R. McCutcheon, M. Elimelech, A novel ammonia–carbondioxide osmotic heat engine for power generation, J. Membr. Sci. 305 (2007)13–19.
[23] T.W. Xu, Ion exchange membranes: state of their development and perspec-tive, J. Membr. Sci. 263 (2005) 1–29.
[24] S.F. Zhao, L. Zou, C.Y.Y. Tang, D. Mulcahy, Recent developments in forwardosmosis: opportunities and challenges, J. Membr. Sci. 396 (2012) 1–21.
[25] G.M. Geise, B.D. Freeman, D.R. Paul, Characterization of a novel sulfonatedpentablock copolymer for desalination applications, Polymer 51 (2010)5815–5822.
[26] G.M. Geise, D.R. Paul, B.D. Freeman, Fundamental water and salt transportproperties of polymeric materials, Prog. Polym. Sci. 39 (2014) 1–42.
[27] T. Kimura, Y. Yamazaki, Effects of CO2 concentration and electric current on theionic conductivity of anion exchange membranes for fuel cells, Electrochem-istry 79 (2011) 94–97.
[28] A.M. Kiss, T.D. Myles, K.N. Grew, A.A. Peracchio, G.J. Nelson, W.K.S. Chiu,Carbonate and bicarbonate ion transport in alkaline anion exchange mem-branes, J. Electrochem. Soc. 160 (2013) F994–F999.
[29] S. Suzuki, H. Muroyama, T. Matsui, K. Eguchi, Influence of CO2 dissolution intoanion exchange membrane on fuel cell performance, Electrochim. Acta 88(2013) 552–558.
[30] A. Tewari, V. Sambhy, M.U. Macdonald, A. Sen, Quantification of carbondioxide poisoning in air breathing alkaline fuel cells, J. Power Sources 153(2006) 1–10.
[31] J.A. Vega, W.E. Mustain, Effect of CO2, HCO3� and CO3
�2 on oxygen reductionin anion exchange membrane fuel cells, Electrochim. Acta 55 (2010)1638–1644.
[32] W. Stumm, J.J. Morgan, Aquatic Chemistry Chemical Equilibria and Rates inNatural Waters, Wiley, New York, 1996.
[33] D.R. Paul, Reformulation of the solution–diffusion theory of reverse osmosis,J. Membr. Sci. 241 (2004) 371–386.
[34] J.G. Wijmans, R.W. Baker, The solution–diffusion model – a review, J. Membr.Sci. 107 (1995) 1–21.
[35] H. Yasuda, C.E. Lamaze, L.D. Ikenberry, Permeability of solutes throughhydrated polymer membranes I. Diffusion of sodium chloride, Makromol.Chem. 118 (1968) 19–35.
[36] G.M. Geise, L.P. Falcon, B.D. Freeman, D.R. Paul, Sodium chloride sorption insulfonated polymers for membrane applications, J. Membr. Sci. 423 (2012)195–208.
[37] G.M. Geise, B.D. Freeman, D.R. Paul, Sodium chloride diffusion in sulfonatedpolymers for membrane applications, J. Membr. Sci. 427 (2013) 186–196.
[38] M.J. Francis, Effect of degassing on the electrical conductivity of pure waterand potassium chloride solutions, J. Phys. Chem. C 112 (2008) 14563–14569.
[39] L. Pauling, College Chemistry; An Introductory Textbook Of General Chemistry,3rd ed., W.H. Freeman & Company, San Francisco, 1964.
[40] J.R. Ehleringer, T.E. Cerling, M.D. Dearing, A History of Atmospheric CO2 and itsEffects on Plants, Animals, and Ecosystems, Springer, New York, 2005.
[41] J.L. Yan, M.A. Hickner, Anion exchange membranes by bromination ofbenzylmethyl-containing poly(sulfone)s, Macromolecules 43 (2010)2349–2356.
[42] H.T. Chang, W.E. Loomis, Effect of carbon dioxide on absorption of water andnutrients by roots, Plant Physiol. 20 (1945) 221–232.
[43] X.Y. Li, M.Q. Hou, Z.F. Zhang, B.X. Han, G.Y. Yang, X.L. Wang, L.Z. Zou,Absorption of CO2 by ionic liquid/polyethylene glycol mixture and thethermodynamic parameters, Green Chem. 10 (2008) 879–884.
[44] C.F. Prutton, S.H. Maron, Principles of Physical Chemistry, 4th ed., Macmillan,New York, 1965.
[45] A.H. Galama, J.W. Post, M.A.C. Stuart, P.M. Biesheuvel, Validity of the Boltzmannequation to describe donnan equilibrium at the membrane–solution interface, J.Membr. Sci. 442 (2013) 131–139.
J. Kamcev et al. / Journal of Membrane Science 479 (2015) 55–6666