Journal of Membrane Science - water21.korea.ac.krwater21.korea.ac.kr/DATA/(2016.06.15) Fertilise...
10
Fertiliser drawn forward osmosis process: Pilot-scale desalination of mine impaired water for fertigation Sherub Phuntsho a , Jung Eun Kim a , Mohammad A.H. Johir a , Seungkwan Hong b , Zhenyu Li c,d , Noreddine Ghaffour c , TorOve Leiknes c , Ho Kyong Shon a,n a Centre for Technology in Water and Wastewater, School of Civil and Environmental Engineering, University of Technology, Sydney (UTS), Broadway, NSW 2007, Australia b School of Civil, Environmental & Architectural Engineering, Korea University,1, 5-ka, Anam-Dong, Sungbuk-Gu, Seoul 136-713, Republic of Korea c King Abdullah University of Science and Technology (KAUST), Water Desalination and Reuse Center (WDRC), Biological and Environmental Sciences & Engineering Division (BESE), Thuwal 23955-6900, Saudi Arabia d Belfer Center for Science and International Affairs, John F. Kennedy School of Government, Harvard University, Cambridge, MA 02138, USA article info Article history: Received 8 September 2015 Received in revised form 6 February 2016 Accepted 10 February 2016 Available online 20 February 2016 Keywords: Forward osmosis (FO) Pilot-scale operation Desalination Fertigation Irrigation abstract The pilot-scale fertiliser driven forward osmosis (FDFO) and nanofiltration (NF) system was operated in the field for about six months for the desalination of saline groundwater from the coal mining activities. Long-term operation of the FDFO-NF system indicates that simple hydraulic cleaning could effectively restore the water flux with minimal chemical cleaning frequency. No fouling/scaling issues were en- countered with the NF post-treatment process. The study indicates that, FDFO-NF desalination system can produce water quality that meets fertigation standard. This study also however shows that, the diffusion of solutes (both feed and draw) through the cellulose triacetate (CTA) FO membrane could be one of the major issues. The FO feed brine failed to meet the effluent discharge standard for NH 4 þ and SO 4 2 þ (reverse diffusion) and their concentrations are expected to further increase at higher feed re- covery rates. Low rejection of feed salts (Na þ , Cl ) by FO membrane may result in their gradual build-up in the fertiliser draw solution (DS) in a closed FDFO-NF system eventually affecting the final water quality unless it is balanced by adequate bleeding from the system through NF and re-reverse diffusion towards the FO feed brine. Therefore, FO membrane with higher reverse flux selectivity than the CTA-FO mem- brane used in this study is necessary for the application of the FDFO desalination process. & 2016 Elsevier B.V. All rights reserved. 1. Background Water stress is increasingly felt all over the world [1,2] and the impact of climate change is expected to further worsen the fresh water scarcity issues [3,4]. Effective water management strategies to alleviate this include supplementing existing water resources using impaired water such as through wastewater recycling and reuse, and desalination [5,6]. Nowadays, about 63% of the estab- lished desalination plant capacity around the world is based on using membrane technology, mainly using reverse osmosis (RO) process [7]. Despite significant progress in the technologies, de- salination still remains a capital and energy intensive process making the technology affordable only to few privileged societies in the world [8]. Desalination has a high carbon footprint and also remains uneconomical for irrigation where a large amount of water is required. Irrigation alone constitutes about 70% of world’s total water consumption [8,9] and water scarcity could have a devastating impact on agriculture production and food security as the limited fresh water resources are prioritised for other uses. Therefore, more cost-effective desalination technologies are nee- ded to make irrigation affordable to meet the increasing food demand for the world’s growing population and the world’s in- creasing affluent society. New and emerging technologies are being investigated, and forward osmosis (FO) process has emerged as one of the most promising candidates for low-pressure, low-energy and low-cost desalination [10–13]. FO is an innovative membrane-based process that uses concentration difference between the two solutions as the main driving force to separate water from the saline water sources instead of hydraulic pressure as in the RO process. How- ever the energy consumption depends on the types of draw solute used and its end use applications. When a highly concentrated draw solution (DS) and a saline feed solution (FS) are separated by a special osmotic or FO membrane, the water moves from the lower concentrated FS towards the higher concentrated DS by natural osmosis due to osmotic pressure difference without the Contents lists available at ScienceDirect journal homepage: www.elsevier.com/locate/memsci Journal of Membrane Science http://dx.doi.org/10.1016/j.memsci.2016.02.024 0376-7388/& 2016 Elsevier B.V. All rights reserved. n Corresponding author. E-mail address: [email protected] (H.K. Shon). Journal of Membrane Science 508 (2016) 22–31
Transcript of Journal of Membrane Science - water21.korea.ac.krwater21.korea.ac.kr/DATA/(2016.06.15) Fertilise...

Journal of Membrane Science 508 (2016) 22–31
Contents lists available at ScienceDirect
Journal of Membrane Science
http://d0376-73
n CorrE-m
journal homepage: www.elsevier.com/locate/memsci
Fertiliser drawn forward osmosis process: Pilot-scale desalination ofmine impaired water for fertigation
Sherub Phuntsho a, Jung Eun Kim a, Mohammad A.H. Johir a, Seungkwan Hong b,Zhenyu Li c,d, Noreddine Ghaffour c, TorOve Leiknes c, Ho Kyong Shon a,n
a Centre for Technology in Water and Wastewater, School of Civil and Environmental Engineering, University of Technology, Sydney (UTS), Broadway, NSW2007, Australiab School of Civil, Environmental & Architectural Engineering, Korea University, 1, 5-ka, Anam-Dong, Sungbuk-Gu, Seoul 136-713, Republic of Koreac King Abdullah University of Science and Technology (KAUST), Water Desalination and Reuse Center (WDRC), Biological and Environmental Sciences &Engineering Division (BESE), Thuwal 23955-6900, Saudi Arabiad Belfer Center for Science and International Affairs, John F. Kennedy School of Government, Harvard University, Cambridge, MA 02138, USA
a r t i c l e i n f o
Article history:Received 8 September 2015Received in revised form6 February 2016Accepted 10 February 2016Available online 20 February 2016
Keywords:Forward osmosis (FO)Pilot-scale operationDesalinationFertigationIrrigation
x.doi.org/10.1016/j.memsci.2016.02.02488/& 2016 Elsevier B.V. All rights reserved.
esponding author.ail address: [email protected] (H.K
a b s t r a c t
The pilot-scale fertiliser driven forward osmosis (FDFO) and nanofiltration (NF) system was operated inthe field for about six months for the desalination of saline groundwater from the coal mining activities.Long-term operation of the FDFO-NF system indicates that simple hydraulic cleaning could effectivelyrestore the water flux with minimal chemical cleaning frequency. No fouling/scaling issues were en-countered with the NF post-treatment process. The study indicates that, FDFO-NF desalination systemcan produce water quality that meets fertigation standard. This study also however shows that, thediffusion of solutes (both feed and draw) through the cellulose triacetate (CTA) FO membrane could beone of the major issues. The FO feed brine failed to meet the effluent discharge standard for NH4
þ andSO4
2þ (reverse diffusion) and their concentrations are expected to further increase at higher feed re-covery rates. Low rejection of feed salts (Naþ , Cl�) by FO membrane may result in their gradual build-upin the fertiliser draw solution (DS) in a closed FDFO-NF system eventually affecting the final water qualityunless it is balanced by adequate bleeding from the system through NF and re-reverse diffusion towardsthe FO feed brine. Therefore, FO membrane with higher reverse flux selectivity than the CTA-FO mem-brane used in this study is necessary for the application of the FDFO desalination process.
& 2016 Elsevier B.V. All rights reserved.
1. Background
Water stress is increasingly felt all over the world [1,2] and theimpact of climate change is expected to further worsen the freshwater scarcity issues [3,4]. Effective water management strategiesto alleviate this include supplementing existing water resourcesusing impaired water such as through wastewater recycling andreuse, and desalination [5,6]. Nowadays, about 63% of the estab-lished desalination plant capacity around the world is based onusing membrane technology, mainly using reverse osmosis (RO)process [7]. Despite significant progress in the technologies, de-salination still remains a capital and energy intensive processmaking the technology affordable only to few privileged societiesin the world [8]. Desalination has a high carbon footprint and alsoremains uneconomical for irrigation where a large amount ofwater is required. Irrigation alone constitutes about 70% of world’s
. Shon).
total water consumption [8,9] and water scarcity could have adevastating impact on agriculture production and food security asthe limited fresh water resources are prioritised for other uses.Therefore, more cost-effective desalination technologies are nee-ded to make irrigation affordable to meet the increasing fooddemand for the world’s growing population and the world’s in-creasing affluent society.
New and emerging technologies are being investigated, andforward osmosis (FO) process has emerged as one of the mostpromising candidates for low-pressure, low-energy and low-costdesalination [10–13]. FO is an innovative membrane-based processthat uses concentration difference between the two solutions asthe main driving force to separate water from the saline watersources instead of hydraulic pressure as in the RO process. How-ever the energy consumption depends on the types of draw soluteused and its end use applications. When a highly concentrateddraw solution (DS) and a saline feed solution (FS) are separated bya special osmotic or FO membrane, the water moves from thelower concentrated FS towards the higher concentrated DS bynatural osmosis due to osmotic pressure difference without the

S. Phuntsho et al. / Journal of Membrane Science 508 (2016) 22–31 23
need of an external energy source. The DS finally becomes dilutedbut it cannot be used directly for potable purpose. Finding suitabledraw solutes that can be easily separated from the diluted DS istherefore still a big challenge for potable water applications [10–12,14].
The concept of fertiliser driven FO (FDFO) desalination, inwhich saltwater is converted into nutrient rich water for irrigationusing a fertiliser solution as DS and this FO process intends toavoid the issue of DS separation and recovery system [15–17].Fertiliser is needed for the growth of crops/plants and the dilutedfertiliser DS can thus be directly used for irrigation (referred to asfertigation) [15,16]. The diluted fertiliser concentration must meetthe nutrition standards for direct fertigation and this has howeverbeen found challenging. The final fertiliser concentrations of thediluted DS are limited by the total dissolved solid (TDS) or osmoticpressure of the feed water based on the principle of osmoticequilibrium between the DS and the FS [18]. Some of the optionsto reduce fertiliser concentrations include direct dilution by mix-ing with the existing fresh water sources or other treated impairedwater sources, using blended fertiliser DS to reduce the con-centration of individual nutrients [19] and using nanofiltration(NF) as post-treatment process to remove the excess fertiliserconcentrations [20]. Lately, pressure assisted osmosis (PAO) has
Fig. 1. Location of the pilot-scale FDFO-NF desalination testing site at
also been investigated as an innovative and more practical way ofreducing the fertiliser concentration without NF as a separatepost-treatment process [21,22].
The FDFO process has so far mostly studied through lab-scaleexperiments except for a recent process optimisation study using8040 FO membrane module [23,24]. This paper reports a six-month field study of the FDFO-NF process at a pilot-scale level forthe desalination of saline water produced during coal mining ac-tivities at one of the coal mining sites in New South Wales,Australia.
2. Materials and methods
2.1. Location and source of saline water
The FDFO-NF pilot desalination system was operated atNewstan Colliery (Centennial Coal Pty. Ltd), State of New SouthWales (NSW), Australia (Fig. 1). The saline water used for the pilot-scale FDFO-NF study was obtained directly from a newly builtwater treatment plant (WTP of 15 ML/day capacity), which treatsmine impaired groundwater. The WTP process consists of a screenmesh, coagulation/flocculation process followed by a lamella
the Centennial Coalmine site under the State of NSW, Australia.

Table 1Characteristics of the saline water from a water treatment plant for the 1st longterm operation cycle shown a typical sample. (the data in the bracket refers to thestandard deviation of twelve collected samples presented in the brackets).
Composition Normal saline waterfrom the WTP
Feed water used for theFDFO operations
pH 7.50(70.26) 7.8(70.30)EC (mS/cm) 2.37(70.07) 5.4(70.50)TDS (mg/L) 1277(745) 2491(785)Dissolved organic carbon 1.2(70.2) 2.1(70.53)Turbidity (NTU) 0.85(70.15) 1.0(70.15)Orthophosphate (mg/L P) o0.006 o0.009Nitrate (mg/L N) o0.005 o0.005Nitrite (mg/L N) N/D N/DAmmonia (mg/L N) 12.3(71.7) 12.0(74.0)Sodium (mg/L) 470(718.4) 812(767)Potassium (mg/L) 4.0(70.3) 7.0(71.1)Calcium (mg/L) 30.1(71.9) 48.0(73.8)Magnesium (mg/L) 9.0(70.82) 22.0(72.1)SAR 19.5(74.0) 24.5(73.4)Chloride (mg/L) 510(7154) 983(726)Sulphate (mg/L SO4
2�) 241(742) 607(727)Aluminium (mg/L) o0.2 0.023Arsenic (mg/L) o0.002 0.001Cadmium (mg/L) o0.001 0.000Chromium (mg/L) 0.002 0.000Copper (mg/L) 0.001 0.043Iron (mg/L) 0.069 0.014Manganese (mg/L) 0.002 0.010Nickel (mg/L) 0.008 0.022Lead (mg/L) o0.001 0.001Zinc (mg/L) 0.035 0.189
S. Phuntsho et al. / Journal of Membrane Science 508 (2016) 22–3124
clarifier and multi-media filter, before finally being discharged tothe LT Creek.
Typical characteristic of the treated coalmine water from theWTP are presented in Table 1. Water samples from the WTP werecollected at the start (12 samples for all short and long-term ex-periments) and end (six samples for only long-term experiments)of each test operational cycle. The composition of the watersamples analysed as per the APHA standards [25] are presented inTable 1. The TDS of the saline groundwater was 1277(745) mg/Lwith electrical conductivity (EC) of 2.37 (70.07) mS/cm. This isacceptable for irrigation water as much higher salinity has beenused for some plants, e.g. strawberry tree (3–4 mS/cm), cherryplum (4–8 mS/cm) and brush cherry (48 mS/cm) [26]. Althoughalready at a lower feed salinity, the FDFO operation is able toproduce a diluted DS with lower fertiliser concentrations, how-ever, using a low salinity feed water does not justify using twodifferent processes (i.e. FDFO and NF) and hence the pilot-scaleFDFO-NF system was tested in the field with a higher or enhancedsalinity. The normal saline water from the WTP was therefore firstconcentrated using a FO process with 1.5 M MgSO4 as DS at about50% total recovery rate to raise the saline feed water to about EC5.4(70.5) mS/cm or TDS 2491(785) mg/L for subsequent pilot
Fig. 2. Schematic diagram of the FDFO-NF desalinatio
testing. The characteristics of the concentrated feed water used forthe FDFO process is presented in Table 1 along with the normalsaline water from the WTP.
2.2. Fertiliser draw solution
In this pilot-scale study, sulphate of ammonia (SOA) or(NH4)2SO4 was selected as the fertiliser DS for two main reasons.Firstly, SOA being a divalent compound, its rejection by the NFmembrane is much higher than a monovalent DS [20] while itsperformances under the FO process is comparable with other DSbased on previous studies [15,19].
The fertiliser DS was prepared by dissolving a technical grade(NH4)2SO4 (supplied in 25 kg bag from Chem-Supply, Australia) intap water at ambient temperature using a variable speed mixeruntil all the salts were completely dissolved. The SOA solutionappeared slightly murky in colour indicating the presence of im-purities. In order to prevent membrane fouling on the supportlayer side of the FO membrane, the concentrated DS was first pre-filtered using a microfiltration (MF of 0.45 mm pore size) beforeuse. Four different SOA DS concentrations were used in this study:0.5 M for baseline flux and 0.95 M, 1.89 M and 2.84 M for FDFOperformance testing. All long term FDFO operations were con-ducted using a SOA DS concentration of 1.89 M (i.e. 2 bags SOA for200 L DS). The resulting osmotic pressure as a function of SOAconcentration are presented elsewhere [15,16]. The SOA generatesosmotic pressure of 23.6, 43.9, 87.0 and 131.5 atm at 0.5 M, 0.95 M,1.89 M and 2.84 M, respectively calculated using the thermo-dynamic modelling software OLI Stream Analyser (Version 9.1 OLISystem Inc. Morris Plains, NJ).
2.3. Operation of pilot-scale FDFO-NF desalination system
A schematic layout of the pilot-scale FDFO-NF system is pre-sented in Fig. 2. The pilot system was made up of the FO processcontaining two numbers of spiral wound 8040 cellulose triacetate(CTA) FO membrane modules (each module containing 1 element)connected in parallel with a total membrane area of 20.2 m2
(Hydration Technology Innovations, Albany, OR). The intrinsicproperties of the CTA FO membrane used in this study are widelyreported and based on our earlier study, the pure water perme-ability of the CTA FO membrane was observed to be1.02 Lm�2 h�1 bar�1 and salt rejection of 93% (5 g/L NaCl) [27].The NF process consisted of one 4040 spiral wound polyamide thinfilm composite (TFC) NF membrane module with a membrane areaof 7.9 m2 (NE90 CSM membranes, Woongjin Chemicals, now TorayChemicals, Korea). According to our earlier study, the 4040 NE90membrane used in this study had a pure water permeabilitycoefficient of 3.82 Lm�2 h�1 bar�1 and salt rejection of 97% (2 g/LNaCl) [28]. The system was not fully optimised in terms of its ca-pacity, consequently each process had to be operated as a batch
n system used for pilot-scale testing in the field.

S. Phuntsho et al. / Journal of Membrane Science 508 (2016) 22–31 25
process and not as a continuous process. Both the diluted DS andfeed concentrate from their respective outlets were therefore re-cycled back to their respective tanks during the batch operationmode. The volumes of the DS in the DS tank therefore graduallyincreased while its concentration, and hence the driving force,gradually decreased with operation time during each batch cycle.The feed concentrate from the FO module outlet was also recycledback to the FS tank. The volume of the FS tank, however wasmaintained the same (5000 L) by filling the FS tank with incomingnormal saline water from the WTP using a float valve installed atthe inlet of the FS tank. In this way, the concentration of the FS alsoincreased slightly with operation time. The long-term batch op-eration of the FDFO process continued on till the DS tank (5000 L)was full with the diluted DS, taking about 7 days. During theprocess optimisation study, however, each batch of the FDFOprocess was operated for only about 6 h duration.
The final diluted fertiliser DS, after the FDFO batch process, wasthen processed by the NF membrane, (operated in the batchmode) at a constant operating pressure of 25 bar. The reject/con-centrate from the NF was recycled back to the NF feed tank whilethe NF permeate was stored in a separate tanks. In this mode ofoperation, the fertiliser solution in the NF feed tank (earlier dilutedDS tank) increased with the NF operation time.
Flow metres, pressure gauges and electrical conductivity (EC)metres were installed at both the inlet and outlet points of theFDFO and NF processes, with all devices connected to a PC foronline data acquisition. EC was used as a surrogate for the FS or DSconcentrations at the module inlet/outlet points. The pilot systemwas not built with a full SCADA system for remote monitoring andcontrol, however, the FO process was operated continuously forseveral days with visual monitoring conducted through live videofeed while the NF was operated during the daytime only. Thewater flux for the FDFO process was calculated based on the flowmetre reading between the DS outlet and inlet while for the NFprocess, the flux for the NF process was obtained directly from theNF permeate flow metre readings. All the pilot plant operationswere conducted at ambient temperature, without any externalcontrol on the environment, between March and August 2014. Theambient air temperature varied considerably with the averagedaily minimum and maximum temperatures of 15.8 °C and 26.5 °C(March), 13.0 °C and 24.0 °C (April), 9.0 °C and 22.6 °C (May), 7.7 °Cand 19.5 °C (June), 4.2 °C and 18.8 °C (July) and 6.1 °C and 18.3 °C(August), respectively, [29]. The temperatures of the DS and FS intheir respective tanks however remained fairly constant at around23 to 24 °C. This is probably due to heating from the pumps. Afresh SOA DS was used for each operational cycle.
2.4. Water quality monitoring and the test fertigation
Water quality was analysed according to the APHA standards[25]. A Perkin Elmer Elan DRC-e Inductively Coupled Plasma MassSpectrometer was used for element analysis, similar to our earlierstudies [20,27]. Water quality was also assessed in terms of so-dium absorption ratio (SAR) values, measuring the relative con-centrations of Naþ to Ca2þ and Mg2þ ions in the water [26]. Thecalculation of SAR values are described elsewhere [26,30]. Irriga-tion water with high SAR values is known to cause sodicity (orsodium toxicity) and loss of soil structure thereby contributing tosoil degrading and poor yield of the crops [26].
3. Results and discussion
3.1. Process optimisation study
For the FDFO process optimisation, only two major operating
parameters were considered: initial DS concentrations and thefeed flow rates. Data in Fig. 3 show the variations of the water flux,cumulative volume of water extracted (ΣV), DS and FS con-ductivity with operation time during (i.e. batch mode operationwhere both the DS and FS were recycled back to their respectivetanks). The gradual decrease in the water flux with operation time(shown in Fig. 3(a)) is because of the increase in the cumulativevolume of the water extracted (ΣV) which in turn dilutes the DS inthe DS tank thereby gradually losing the driving force with time.The initial water fluxes with 0.95 M, 1.89 M and 2.84 M SOA DSconcentrations were 5.9, 7.5 and 8.8 Lm�2 h�1, respectively. Thesewater fluxes are slightly non-linear with the DS concentrationsconsistent with many previous lab-scale studies because of theenhanced dilutive internal concentration polarisation (ICP) effectswhen operated at higher water fluxes [24,27,31,32].
Fig. 3(b) shows the EC variations of the DS at the inlet and theoutlet of the FO module with operating time. The DS concentrationdifference (driving force) between the inlet and outlet is muchhigher at the beginning, indicating the higher DS dilution factor(i.e. ratio of DS concentrations at the inlet to the outlet) achievedwithin the module during the initial stages of operation. However,the DS dilution factor at the module outlet decreases graduallywith operation time due to cumulative loss of the driving force(cumulative DS dilution in the batch process) and hence the waterflux with time. Although the DS dilution factor at the moduleoutlet increases at higher inlet DS concentration, this correspondsto higher diluted DS concentration level at the outlet, as evidentfrom the EC of the diluted DS between 1.89 M and 2.85 M. Thisindicates that when higher DS concentrations are used, it mayrequire more membrane area (or membrane elements) in series toreach the desirable DS dilution (up to osmotic equilibrium con-centration) within a single stage FO process [18].
Fig. 3(c) shows the variations of the FS EC at the inlet/outlet andthe feed recovery rates with operation time for the FO module. Thefeed recovery rates of a single 8040 FO module were 4.2% at2.84 M SOA DS concentration, reducing to 2.6% at 0.95 M SOA DSconcentration. The feed recovery rate also decreased with timedue to the loss of driving force and hence the water flux. The feedrecovery rates are comparatively lower than the rated feed re-covery rates of a single 8040 RO element (BW30-440i, membranearea of 41 m2, recovery rates of 15% at applied pressure of 15 bar)using a feed water of 2000 mg/L NaCl [33]. Feed recovery rates forthe FO module could be increased by using higher initial DS con-centration (driving force), however, this also results in higherconcentration level of the diluted DS that comes out of the module(ref Fig. 3b) as discussed earlier, which is not desirable. Severalfactors might contribute towards the lower feed recovery rates ofthe CTA 8040 FO element. One of the reasons could be due to thecomparatively higher cross flow rate differences between the FS(6.0 m3 h�1) and FS (0.6 m3 h�1) as recommended by the manu-facturer for the module operation to maintain a suitable pressuredifferential between the inlet and out of the module. The otherreason could be due to the low packing density of the CTA 8040 FOelement (10.1 m2) compared to RO membranes of similar size(41 m2, Filmtec DOWTM Chemicals) and lower permeability, andhence lower water flux of the CTA FO membrane compared to TFCRO membrane.
The influence of feed flow rates on the performance of theFDFO process is presented in Fig. 3(d) at different flow rates of 3.0,4.2 and 6.0 m3 h�1. It is evident from these results that, no sig-nificant increase in the water flux was observed when the FDFOpilot-scale unit was operated at higher feed flow rates. This ispossibly due to the very low feed recovery rates (2.6–4.2%) atwhich the FO modules were operated and hence the differences inthe fluxes are not noticeable. Therefore, all the subsequent long-term experiments were conducted at a feed flow rate of

Fig. 3. Variations of the performance parameters during the FDFO pilot unit process optimisation process. (a) Cumulative volume of water extracted and the water flux withtime, (b) DS concentrations or EC at the inlet/outlet and the dilution factor with time, (c) feed TDS or EC and feed recovery rates with time and (d) water flux under differentfeed flow rates. Initial DS and FS volumes are 200 L and 5000 L respectively.
S. Phuntsho et al. / Journal of Membrane Science 508 (2016) 22–3126
4.2 m3 h�1 as it provided a reasonable pressure differential be-tween the different inlets and outlets of the module, as re-commended by the manufacturer.
3.2. Long-term operation of the FDFO process
Based on the results in Fig. 3, 1.89 M was selected for all thesubsequent long-term operation of the pilot-plant system. Eachbatch of long-term FDFO operation initially started with 200 L of1.89 M SOA as DS and at a constant volume (5000 L) of saline feedwater. At the end when the DS tank was full to 5000 L, its final SOADS concentration reached to around 0.075 M (4.0 atm), which iscloser to the final FS TDS of 4000 mg/L (3.0 atm). The minimuminitial DS volume of 200 L was necessary to accommodate the DSwithin the dead volume of the pipes, fittings and pump. For thelong-term performance, the pilot-scale FDFO process was operatedfor a total of six cycles under a batch mode until the 5000 L DStank was fully filled, results presented in Fig. 4.
The variations in water flux with operation time appear quitesimilar for all the six cycles, indicating a consistent performance ofthe FDFO process under each batch trial. A closer observationbetween each batch cycle in Fig. 4(a), however, shows that thewater flux in the fourth cycle is significantly lower than waterfluxes in the other cycles (i.e. the sharper flux decline). Fig. 4(b) presents the water flux as a function of cumulative volume,representing water flux under similar DS concentrations (driving
force) with the change of the cumulative volume. The baselinewater flux presented as a subset plot within Fig. 4(b) and con-ducted using 0.5 M SOA as DS and tap water as FS immediatelyafter Cycle 4 (before cleaning) is much lower than the originalbaseline water flux, indicating that the CTA FO membrane wasindeed fouled during the 4th cycle of operation. The reduction inthe water flux observed in the 4th cycle was unexpected since thefeed water used for the FDFO process had similar turbidity ofaround 1.3 NTU (data not presented). However, it was observedthat the turbidity of the feed water in the feed tank at the end ofthe 4th cycle had significantly increased from the initial 1.3 NTU to6.5 NTU (data not presented). On investigation, it was observedthat algae had grown inside the feed tank, which is assumed tohave been the main contributing factor for this sharp flux decline.The continuous recycling of feed water along with the reversediffusion of ammonia nitrogen towards the feed tank from the SOADS is assumed to have enhanced algal growth in the feed tank.Opening of the tank and exposure to the sun might also havepromoted algae to grow in the tank. Algal growth is evident fromthe pictures of the water samples taken out from the tank, shownwithin Fig. 4(b). Since there was no cartridge pre-filter betweenthe feed water tank and the FO membrane module, the algaeparticles could have contributed to the FO membrane flux decline.Although algae presence was evident in this cycle, flux decline dueto biofouling cannot be ruled out entirely as the FDFO process hadrun for about 4 cycles without any cleaning. It is also therefore

Fig. 4. Performance of the FDFO desalination process on longer run cycles.(a) Variation of water flux with operation time and (b) the variation of water fluxwith the cumulative volume of water extracted during the batch operation processshowing together the baseline fluxes before and after cleaning of the FO membraneand the picture showing algae growth in the feed water tank during the cycle 4 ofthe operation. Baseline fluxes were conducted using 0.5 M SOA as DS and tap wateras FS at a feed crossflow rate of 4.2 m3 h�1.
Table 2Characteristics of the feed water and diluted DS before and after the FDFO ex-periments. The average feed rejection rates (R) for each ion were determined basedon the average concentrations of each ion in the initial and final DS. The standarddeviation of all the six samples is provided in the brackets. (FSF: final feed solution,DSF¼ final draw solution, R: feed rejection rate, SRSF: specific reverse solute flux).The osmotic pressure of the two types of saline feed water presented in Table 1 wascalculated using the ROSA software (Version 9.1, Filmtec DOWTM Chemicals, USA).
Parameters FSF DSF R (%) SRSF (mg/L)
pH 8.0(70.20) 7.7(70.06)EC (mS/cm) 7.5(70.8) 13.49(71.5)Turbidity (NTU) 1.9(70.2) 0.25(70.05)NH4 (mg/L N) 113(714) 1897(7143) 105(776)Na (mg/L) 1425(7202) 231(740) 72%(73.5%)K (mg/L) 19(77) 1.2(70.3) 83%(73.6%)Ca (mg/L) 58(719) 1.5(70.5) 97%(71.0%)Mg (mg/L) 31(73) 0.5(70.3) 98%(71.3%)Cl (mg/L) 1897(7595) 185(78.7) 81%(70.7%)SO4 (mg/L SO4
2-) 992(7167) 5288(7233) 401(785)SAR 37.8 42.0(75.5)TDS (mg/L) 4535(7220) 7604(7845)Osmotic pressure(bar)
2.85(70.14) 3.70(70.41)
S. Phuntsho et al. / Journal of Membrane Science 508 (2016) 22–31 27
possible that biofouling may partly contributed towards the fluxdecline given the presence of dissolved organic matter in the FDFOfeed of about 2.1(70.53) mg/L (refer Table 1).
Before the subsequent cycles of FDFO operations, the FOmembranes were subjected to hydraulic cleaning using clean tapwater at feed flow rates of 6.0 m3 h�1 for about 60 minutes andthe baseline flux was then determined again. The baseline fluxespresented within Fig. 4(b) indicate that hydraulic cleaning wasalmost able to fully recover the water flux and hence no chemicalcleaning was required before the next cycle of operation. Even atthe end of the 6th cycle, the water flux and also the baseline fluxwas still comparable to the earlier cycles, indicating that the FOmembrane performed quite well without any significant fouling orscaling issues during the long-term operations. For the subsequentbatches (cycles 5 and 6), the feed water in the tank containingalgae was filtered by MF before the next cycle of long-term op-eration. In order to prevent the regrowth of algae in the feed tank,the feed tank was completely closed and housed inside the shed.
Table 2 shows the typical composition of the final diluted SOAfertiliser DS (cycle 1) along with their respective initial and final FScompositions. The final diluted fertiliser DS with an EC of 13.49(71.5) mS/cm or a TDS of 7604(7845) mg/L and NH4
þ of 1897(7143) mg/L is too high for direct fertigation to the plants [34].Fertigation with high salinity water could decrease the biomassproduction of the plants due to lowering of plant water potentialsand also cause specific ion toxicities and ion imbalances [35]. As-suming a TN of 200 mg/L [16,19,34] for certain plants as themaximum concentration limit, this diluted fertiliser DS wouldrequire additional dilution by a factor of about 10 which is a sig-nificant volume of additional fertigation water required. The ex-cess fertiliser draw solutes would therefore require reduction or
dilution before use and the NF process was therefore used as post-treatment for further reducing (or diluting) the fertiliserconcentration.
The osmotic pressure of the final diluted fertiliser DS (esti-mated using ROSA) was 3.7(70.41) bar against the initial feedosmotic pressure of 1.52(0.05) bar. The osmotic pressure of thefinal diluted DS is expected to be higher than the initial feed os-motic pressure used in this study since the FDFO process wasoperated in a batch mode in which the TDS or the osmotic pres-sure of the feed continued to increase with time from 1.52(70.05) bar (initially) to 2.85(70.14) bar by the end of each batchoperation. The osmotic pressure of the final diluted DS is stillhigher than the osmotic pressure of the final FS, indicating that thediluted DS concentration has not yet reached osmotic equilibriumwith the feed osmotic pressure, and hence further dilution couldhave been possible if the FDFO process had been operated further.This osmotic pressure of the final diluted DS is 10–30% higher thanthe osmotic pressure of the final feed concentrate.
From Table 2, it is clear that the CTA FO membrane used in thisstudy led to significant transfer of ions across the membrane inboth directions. Rejection of the individual feed ions were ob-served to be only between 80 and 98%, except for Na at 72%, in-dicating that the rest of the feed ions have diffused through themembrane towards the DS. This low rejection of the CTA FOmembrane, especially monovalent ions such as Naþ and Cl� , couldbe a cause of concern, as these unwanted feed solutes are expectedto eventually accumulate in the DS during the NF post-treatmentprocess after repetitive cycles of recycling and reuse operations. Adetailed discussion on this implication is included later underSection 3.4.
Table 2 also presents the specific reverse solute flux (SRSF) ofthe SOA DS in terms of +NH4 and −SO4
2 concentrations. Although theterm reverse solute flux or RSF (in gm�2 h�1) is also commonlyused to measure the rate of reverse diffusion [36–38] of drawsolutes in this study, SRSF has been used as this parameter relatesto the quantitative measurement of the reverse diffusion of drawsolutes towards the FS per unit volume of water extracted in theFO process [27,39,40]. The RSF increases with the increase in theDS concentration, however, it has been observed that the SRSF (orthe ratio of RSF (gm�2 h�1) to the water flux (Lm�2 h�1)) is fairlyconstant for a particular draw solute [40] and hence SRSF is usedas one of the performance parameters in this study instead of RSF.The SRSF of the SOA DS were 105(776) mg/L for NH4
þ and 401

S. Phuntsho et al. / Journal of Membrane Science 508 (2016) 22–3128
(785) mg/L for SO42� as shown in Table 2. These SRSF values are
slightly lower than the SRSF usually observed during lab-scaleexperiments in our earlier study [19]. These results indicate thatsome amount of fertiliser DS could be lost towards the FS andcannot be recovered. Mass balance analysis of the NH4
þ andSO4
2� in the feed tank indicates that about 504 g of NH4þ and
1925 g of SO42� (total DS of 2429 g) are lost by reverse diffusion
towards the feed, which translates to 3.7% and 5.3% (total DS lossof 4.9%) of their initial mass in the fertiliser DS, respectively, dur-ing each cycle of batch operation. This also shows that, for everymole of SO4
2� that reverse diffuse through the FO membrane,about 1.4 mol of NH4 reverse diffuse instead of expected 2 mol ofNH4 based on their equimolar molar ratios in the (NH4)SO4 DSsolution. To maintain ion balance on the DS side, ions such as Naþ
or Cl� may cross the FO membrane towards the DS as indicated bythe presence of Naþ or Cl� in the DS. This therefore likely en-hances the feed solute flux through the membrane resulting inslightly lower rejection rates of Naþ (72%) or Cl� (81%) comparedto reported rejection of between 94–99% [41,42].
The SAR values of the diluted DS in Table 2 increased to 42.0(75.5) compared to 24.5(73.4) in the initial feed water due tothe high rejection of Ca2þ and Mg2þ ions compared to Naþ ionsby the FO membrane. The recommended SAR value is less than6 although SAR values greater than 5 are considered as at the riskof adverse structural impacts associated with sodicity [26]. Hence,based on the SAR values from Table 2, it is clear that, the dilutedfertiliser DS is not suitable for irrigation.
3.3. Operation of the nanofiltration process
With a single 4040 NF element in the module, the maximumrecovery rate for the NF module was only 20–25% when operatedat a constant transmembrane pressure of 25 bar. Hence, the NFprocess was operated in a batch mode where the NF concentratewas recycled back to the NF feed tank. In this way, the con-centration of the NF feed tank containing fertiliser solution in-creased constantly with time. Variations of the water flux and thepermeate EC has therefore been plotted as a function of the feedconcentration or EC at the module inlet instead of operation time.
Fig. 5 shows the variations of the performance parameters suchas specific permeate water flux, NF permeate EC and NF rejectionrate as a function of the cumulative EC of the diluted fertiliser DSor the NF feed. The initial NF feed EC was 13.49(71.5) mS/cm as
Fig. 5. Performance of the NF process as post-treatment using the diluted fertiliser DS frpermeate flux and (b) NF permeate electrical conductivity and NF rejection rate with theNF operation process.
per the composition presented in Table 2. The lowest desirablefinal diluted DS concentration from the FDFO process should havean osmotic pressure of 1.52 atm, equal to the osmotic pressure ofthe initial saline feed water at the inlet. This equivalent con-centration for the DS has been estimated to be ∼7000 mg/L of SOA(EC of 11.9 mS/cm). Since the maximum volume of the DS tank was5000 L and the feed water TDS also slightly increased with timeduring the operation, the minimum final diluted DS concentrationwas 7604 (7845) mg/L with an osmotic pressure of 3.7(70.41) bar, which is higher than the desirable concentration.Hence, it must be understood here that the feed water for the NFpost-treatment has an osmotic pressure twice as high as the salinefeed water and will increase the energy requirement for the NFprocess post-treatment.
For each cycle, NF was operated until such time that the waterflux was so low at 25 bar to be accurately measured by thepermeate flow metre and this happened when the final dilutedfertiliser DS or NF feed reached an EC of around 39–42 mS/cm,translating to a total or overall NF feed recovery rate of around 65–70%. The results in Fig. 5(a) show that the water fluxes for the NFprocess did not vary significantly, even after six cycles of batchoperations, indicating that the NF process performed quite con-sistently without having any membrane scaling and fouling. This isbecause the diluted fertiliser DS used as the NF feed is a highquality water, similar to RO treated water, except for the presenceof SOA fertiliser solutes. The use of high quality FO treated feedwater with very low or no fouling potential could be one of themajor advantages since NF is the most energy intensive process inthe FDFO-NF desalination system. Any organics and colloids orscaling ions such as Ca2þ and Mg2þ present in the saline feedwater are expected to be almost fully removed during the FOprocess, as indicated by the water characteristics of the final di-luted DS in Table 2. It is worth noting here that, during the entireNF operation, the membrane was never cleaned, indicating thatcleaning costs of the NF process will also be significantly lowerwhen used as post-treatment process in FDFO desalination.
Fig. 5(b) shows the variations of the permeate EC and NF re-jection rate with the bulk cumulative EC of the NF feed water. Thepermeate EC is important as it is directly related to the quality ofthe product water for fertigation. The permeate EC increases withthe increase in the bulk EC of the diluted fertiliser DS in the NFfeed tank since the NF was operated in a batch mode, however, theNF rejection rate did not change significantly even at higher NF
om the FDFO desalination process as NF feed water. Variations of the (a) specific NFcumulative increase in the NF feed concentration (diluted fertiliser) during the batch

Table 3Characteristics of NF permeate using diluted fertiliser DS as the NF feed. The standard deviation of all the six samples is provided in the brackets.
Parameters Initial NF Feed (DSF) P(ave) NF Con. RNF (%)
pH 7.7(70.06) 8.15(70.15) 8.1(70.17)EC (mS/cm) 13.49(71.5) 0.81(70.03) 42.9(73.23) 94.0%(70.2%)Turbidity (NTU) 0.25(70.05) 0.1(70.1) 0.8(70.1)Ammonia (mg/L N) 1897(7143) 75(715) 6140(7562) 96.0%(70.8%)Sodium (mg/L) 231(740) 10(71.1) 752(763) 95.7%(73.5%)Potassium (mg/L) 1.2(70.3) 0.2(70.1) 8.5(70.9) 83.3%(76.9%)Calcium (mg/L) 1.5(70.5) 0.15(70.05) 5.0(71.4) 90.0%(73.0%)Magnesium (mg/L) 0.5(70.3) 0.2(70.07) 2.0(70.9) 60.0%(78.4%)Chloride (mg/L) 185(78.7) 15(72.1) 540.0(752.0) 91.9%(71.0%)SO4
2� 5288(7233) 165(744) 17,250(72019) 96.9%(70.8%)TDS 7604 (7845) ∼266(710.5) ∼ 24,700(78000) 96.5%(71.5%)SAR 42.0(75.5) 4.0(70.57) 72.4(76.2)
S. Phuntsho et al. / Journal of Membrane Science 508 (2016) 22–31 29
feed concentration with rejections rates above 96%. There was nosignificant difference or trend observed in the permeate EC be-tween each NF cycle in Fig. 5(b), which is also supported by thesimilar fertiliser rejection rate of the NF membrane after severalcycles of operations. A typical composition of the NF permeatealong with the STD are presented in Table 3 and this in fact re-presents a typical quality of the fertigation water produced fromthe FDFO-NF desalination system. The average EC of the finalproduct water from the FDFO-NF system was about 810(730) mS/cm, which is suitable for irrigation purpose. Table 3 provides thedetail composition of the final product water from the FDFO-NFdesalination system. The average NH4-N concentrations were ob-served to be 75(715) mg/L, which is lower than the acceptableupper limit of 200 mg/L [19,26]. The average SO4
2� concentrationobserved was 165(744) mg/L, which is also and deemed suitablefor irrigation. SO4
2� has no reported adverse impact on the soil orplants except for its contribution towards the salinity content, al-though too high concentration could reduce nitrate, phosphorousand molybdenum absorptivity of the plants [43].
In fact, all other ion concentrations were much lower than themaximum allowable limit for fertigation. Although a higher levelof the essential ions such as Ca2þ and Mg2þ would be preferred,their concentrations dipped below 1.0 g/L (because of the highrejection of these divalent cations by the NF membrane). The lowNaþ concentrations in the final product water (average SAR value4.0(70.57)) was still lower and within the acceptable values of
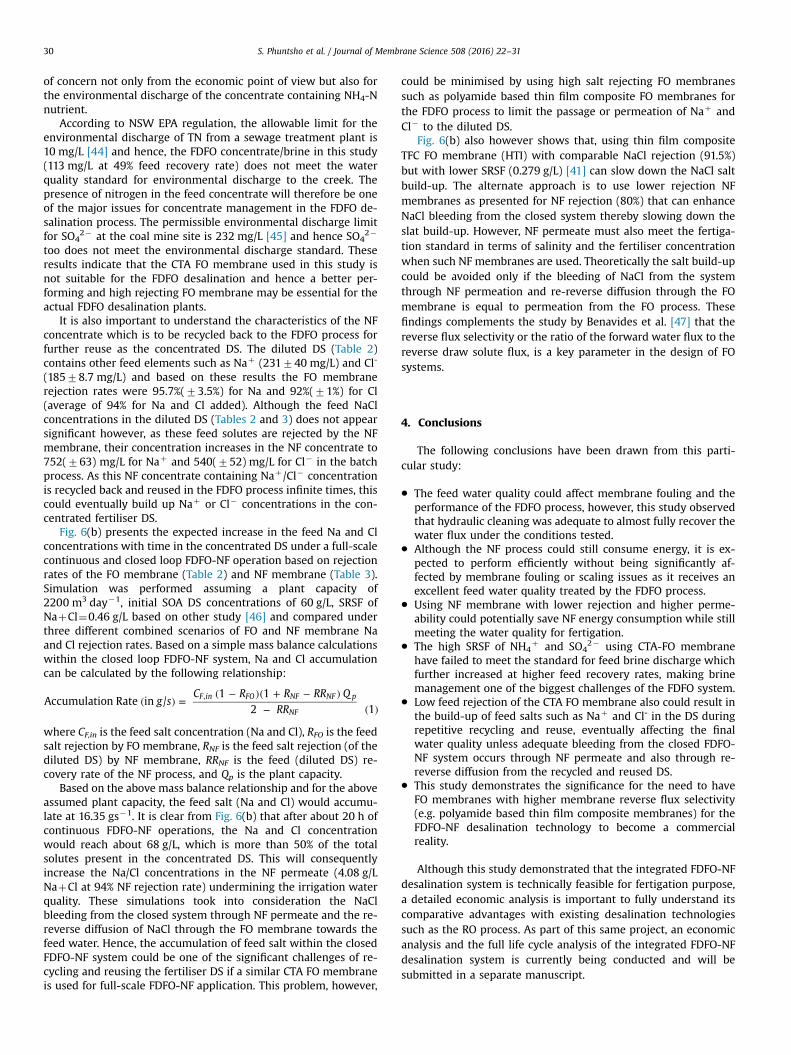
Fig. 6. Implications of solutes transfer through the FO and NF membranes assessed baseconcentrate/brine at different FDFO feed recovery rates where the NH4
þ and SO42� conc
is the feed recovery rate) and (b) expected variations of the feed solute (NaCl) concentsimulation, NaCl feed rejection of CTA FO membrane at RFO¼87.6%, SRSF of NaCl was assfeed recovery rate was assumed about 84%.
less than 6 for irrigation [26]. Given the low permeate EC (Table 3)with the NE90 module it appears that even NF membranes as withlower rejection (such as NE70) could also be potentially used aspost-treatment in the process, thereby reducing the energy costsas NF70 is expected to have much higher water flux than NE90given its slightly larger pore size and higher water permeability.
3.4. Implications of solute fluxes in a closed loop FDFO-NF system
Each long-term cycle for the FDFO desalination was operated ata total overall feed recovery rate of about 49% (4800 L of waterpermeated from the FS towards the 5000 L DS tank with the finalconcentrate volume of 5000 L). For this overall feed recovery rate,the FDFO concentrate resulted in a NH4
þ of 105(776) mg/L andSO4
2� of 401(785) mg/L, which is expected to increase at higherrecovery rates. Mass balance analysis of the feed and the reversedraw solutes indicate that, the concentration of the lost draw so-lutes in the FO feed brine in a full-scale continuous FDFO operationwould increase exponentially as [ ¯SRSF � R̄R/(1� R̄R)] with the feedrecovery rates (RR) as precented in Fig. 6(a). This is because, asfeed recovery rate increases, brine flow rate decreases but containthe same mass of the draw solutes that reverse diffuse through themembrane and this mass depends on the permeate flow rate andthe SRSF. Therefore, a higher feed recovery rate in the FDFO pro-cess would likely mean higher concentrations of NH4
þ and SO42�
draw solutes in the feed concentrate/brine, which could be a cause
d on the (a) expected variations of the draw solute concentrations in the FDFO feedentrations in the brine was calculated using the relationship [ ¯SRSF x R̄R/(1-R̄R)] (RRrations in the concentrated SOA DS under different FO and NF rejection rates. Forumed at 0.46 g/L [46], for RFO¼90%, SRSF was assumed at 0.327 g/L [41] and the NF
S. Phuntsho et al. / Journal of Membrane Science 508 (2016) 22–3130
of concern not only from the economic point of view but also forthe environmental discharge of the concentrate containing NH4-Nnutrient.
According to NSW EPA regulation, the allowable limit for theenvironmental discharge of TN from a sewage treatment plant is10 mg/L [44] and hence, the FDFO concentrate/brine in this study(113 mg/L at 49% feed recovery rate) does not meet the waterquality standard for environmental discharge to the creek. Thepresence of nitrogen in the feed concentrate will therefore be oneof the major issues for concentrate management in the FDFO de-salination process. The permissible environmental discharge limitfor SO4
2� at the coal mine site is 232 mg/L [45] and hence SO42�
too does not meet the environmental discharge standard. Theseresults indicate that the CTA FO membrane used in this study isnot suitable for the FDFO desalination and hence a better per-forming and high rejecting FO membrane may be essential for theactual FDFO desalination plants.
It is also important to understand the characteristics of the NFconcentrate which is to be recycled back to the FDFO process forfurther reuse as the concentrated DS. The diluted DS (Table 2)contains other feed elements such as Naþ (231740 mg/L) and Cl-
(18578.7 mg/L) and based on these results the FO membranerejection rates were 95.7%(73.5%) for Na and 92%(71%) for Cl(average of 94% for Na and Cl added). Although the feed NaClconcentrations in the diluted DS (Tables 2 and 3) does not appearsignificant however, as these feed solutes are rejected by the NFmembrane, their concentration increases in the NF concentrate to752(763) mg/L for Naþ and 540(752) mg/L for Cl� in the batchprocess. As this NF concentrate containing Naþ/Cl� concentrationis recycled back and reused in the FDFO process infinite times, thiscould eventually build up Naþ or Cl� concentrations in the con-centrated fertiliser DS.
Fig. 6(b) presents the expected increase in the feed Na and Clconcentrations with time in the concentrated DS under a full-scalecontinuous and closed loop FDFO-NF operation based on rejectionrates of the FO membrane (Table 2) and NF membrane (Table 3).Simulation was performed assuming a plant capacity of2200 m3 day�1, initial SOA DS concentrations of 60 g/L, SRSF ofNaþCl¼0.46 g/L based on other study [46] and compared underthree different combined scenarios of FO and NF membrane Naand Cl rejection rates. Based on a simple mass balance calculationswithin the closed loop FDFO-NF system, Na and Cl accumulationcan be calculated by the following relationship:
( ) =( − )( + − )
− ( )g s
C R R RR QRR
Accumulation Rate in /1 1
2 1F in FO NF NF p
NF
,
where CF,in is the feed salt concentration (Na and Cl), RFO is the feedsalt rejection by FO membrane, RNF is the feed salt rejection (of thediluted DS) by NF membrane, RRNF is the feed (diluted DS) re-covery rate of the NF process, and Qp is the plant capacity.
Based on the above mass balance relationship and for the aboveassumed plant capacity, the feed salt (Na and Cl) would accumu-late at 16.35 gs�1. It is clear from Fig. 6(b) that after about 20 h ofcontinuous FDFO-NF operations, the Na and Cl concentrationwould reach about 68 g/L, which is more than 50% of the totalsolutes present in the concentrated DS. This will consequentlyincrease the Na/Cl concentrations in the NF permeate (4.08 g/LNaþCl at 94% NF rejection rate) undermining the irrigation waterquality. These simulations took into consideration the NaClbleeding from the closed system through NF permeate and the re-reverse diffusion of NaCl through the FO membrane towards thefeed water. Hence, the accumulation of feed salt within the closedFDFO-NF system could be one of the significant challenges of re-cycling and reusing the fertiliser DS if a similar CTA FO membraneis used for full-scale FDFO-NF application. This problem, however,
could be minimised by using high salt rejecting FO membranessuch as polyamide based thin film composite FO membranes forthe FDFO process to limit the passage or permeation of Naþ andCl� to the diluted DS.
Fig. 6(b) also however shows that, using thin film compositeTFC FO membrane (HTI) with comparable NaCl rejection (91.5%)but with lower SRSF (0.279 g/L) [41] can slow down the NaCl saltbuild-up. The alternate approach is to use lower rejection NFmembranes as presented for NF rejection (80%) that can enhanceNaCl bleeding from the closed system thereby slowing down theslat build-up. However, NF permeate must also meet the fertiga-tion standard in terms of salinity and the fertiliser concentrationwhen such NF membranes are used. Theoretically the salt build-upcould be avoided only if the bleeding of NaCl from the systemthrough NF permeation and re-reverse diffusion through the FOmembrane is equal to permeation from the FO process. Thesefindings complements the study by Benavides et al. [47] that thereverse flux selectivity or the ratio of the forward water flux to thereverse draw solute flux, is a key parameter in the design of FOsystems.
4. Conclusions
The following conclusions have been drawn from this parti-cular study:
� The feed water quality could affect membrane fouling and theperformance of the FDFO process, however, this study observedthat hydraulic cleaning was adequate to almost fully recover thewater flux under the conditions tested.
� Although the NF process could still consume energy, it is ex-pected to perform efficiently without being significantly af-fected by membrane fouling or scaling issues as it receives anexcellent feed water quality treated by the FDFO process.
� Using NF membrane with lower rejection and higher perme-ability could potentially save NF energy consumption while stillmeeting the water quality for fertigation.
� The high SRSF of NH4þ and SO4
2� using CTA-FO membranehave failed to meet the standard for feed brine discharge whichfurther increased at higher feed recovery rates, making brinemanagement one of the biggest challenges of the FDFO system.
� Low feed rejection of the CTA FO membrane also could result inthe build-up of feed salts such as Naþ and Cl- in the DS duringrepetitive recycling and reuse, eventually affecting the finalwater quality unless adequate bleeding from the closed FDFO-NF system occurs through NF permeate and also through re-reverse diffusion from the recycled and reused DS.
� This study demonstrates the significance for the need to haveFO membranes with higher membrane reverse flux selectivity(e.g. polyamide based thin film composite membranes) for theFDFO-NF desalination technology to become a commercialreality.
Although this study demonstrated that the integrated FDFO-NFdesalination system is technically feasible for fertigation purpose,a detailed economic analysis is important to fully understand itscomparative advantages with existing desalination technologiessuch as the RO process. As part of this same project, an economicanalysis and the full life cycle analysis of the integrated FDFO-NFdesalination system is currently being conducted and will besubmitted in a separate manuscript.

S. Phuntsho et al. / Journal of Membrane Science 508 (2016) 22–31 31
Acknowledgements
The authors acknowledge the financial support of the NationalCentre of Excellence in Desalination Australia which is funded bythe Australian Government through the National Urban Water andDesalination Plan. The authors also acknowledge the partial sup-port received for this study from ARC discovery grant(DP140100835), ARC Future Fellowship (FT140101208) and Uni-versity of Technology, Sydney chancellor's postdoctoral researchfellowship. Funding for this research was also provided by theWater Desalination and Reuse Center (WDRC) at the King AbdullahUniversity of Science and Technology (KAUST), Saudi Arabia and byIndustrial Facilities & Infrastructure Research Program (14IFIP-B087385-01) by Ministry of Land, Infrastructure and Transport ofKorean Government.
References
[1] F.R. Rijsberman, Water scarcity: fact or fiction? Agric. Water Manag. 80 (2006)5–22.
[2] J.E. Kharraz, A. El-Sadek, N. Ghaffour, E. Mino, Water scarcity and drought inWANA countries, Procedia Eng. 33 (2012) 14–29.
[3] C.J. Vörösmarty, P. Green, J. Salisbury, R.B. Lammers, Global water resources:vulnerability from climate change and population growth, Science 289 (2000)284–288.
[4] I. Haddeland, J. Heinke, H. Biemans, S. Eisner, M. Flörke, N. Hanasaki,M. Konzmann, F. Ludwig, Y. Masaki, J. Schewe, T. Stacke, Z.D. Tessler, Y. Wada,D. Wisser, Global water resources affected by human interventions and cli-mate change, Proc. Natl. Acad. Sci. 111 (2014) 3251–3256.
[5] E. Lopez-Gunn, M. Ramón Llamas, Re-thinking water scarcity: Can science andtechnology solve the global water crisis? Nat. Resour. Forum 32 (2008)228–238.
[6]UN, Role of desalination in addressing water scarcity/Economic and SocialCommission for Western Asia. ESCWA water development report; 3 ed., E.United Nations and A. Social Commission for Western United Nations. NewYork, 2009.
[7] N. Ghaffour, T.M. Missimer, G.L. Amy, Technical review and evaluation of theeconomics of water desalination: Current and future challenges for betterwater supply sustainability, Desalination 309 (2013) 197–207.
[8] J.M. Beltrán, S. Koo-Oshima. Water desalination for agricultural applicationsin: Food and Agriculture Organization of the Nations, in: Proceedings of theFAO Expert Consultation on Water Desalination for Agricultural Applications,FAO, Rome, Italy, 2006.
[9] D.L. Shaffer, N. Yin Yip, J. Gilron, M. Elimelech, Seawater desalination foragriculture by integrated forward and reverse osmosis: improved productwater quality for potentially less energy, J. Membr. Sci. 415–416 (2012) 1–8.
[10] Q. Ge, M. Ling, T.-S. Chung, Draw solutions for forward osmosis processes:Developments, challenges, and prospects for the future, J. Membr. Sci. 442(2013) 225–237.
[11] J.-J. Qin, W.C.L. Lay, K.A. Kekre, Recent developments and future challenges offorward osmosis for desalination: a review, Desalination Water Treat. 39(2012) 123–136.
[12] S. Zhao, L. Zou, C.Y. Tang, D. Mulcahy, Recent developments in forward os-mosis: Opportunities and challenges, J. Membr. Sci. 396 (2012) 1–21.
[13] T.Y. Cath, J.E. drewes, C.D. Lundin, A novel hybrid forward osmosis process fordrinking water augmentation using impaired water and saline water sources,WERC Water Res. Found. (2009).
[14] L. Chekli, S. Phuntsho, H.K. Shon, S. Vigneswaran, J. Kandasamy, A. Chanan, Areview of draw solutes in forward osmosis process and their use in modernapplications, Desalination Water Treat. 43 (2012) 167–184.
[15] S. Phuntsho, H.K. Shon, S. Hong, S. Lee, S. Vigneswaran, A novel low energyfertilizer driven forward osmosis desalination for direct fertigation: evaluatingthe performance of fertilizer draw solutions, J. Membr. Sci. 375 (2011)172–181.
[16] S. Phuntsho, H.K. Shon, S. Hong, S. Lee, S. Vigneswaran, J. Kandasamy, Fertiliserdrawn forward osmosis desalination: the concept, performance and limita-tions for fertigation, Rev. Environ. Sci. Bio/Technol. 11 (2012) 147–168.
[17] C.D. Moody, J.O. Kessler, Forward osmosis extractors, Desalination 18 (1976)283–295.
[18] S. Phuntsho, S. Hong, M. Elimelech, H.K. Shon, Osmotic equilibrium in theforward osmosis process: modelling, experiments and implications for processperformance, J. Membr. Sci. 453 (2014) 240–252.
[19] S. Phuntsho, H.K. Shon, T. Majeed, I. El Saliby, S. Vigneswaran, J. Kandasamy,
S. Hong, S. Lee, Blended fertilizers as draw solutions for fertilizer-drawn for-ward osmosis desalination, Environ. Sci. Technol. 46 (2012) 4567–4575.
[20] S. Phuntsho, S. Hong, M. Elimelech, H.K. Shon, Forward osmosis desalinationof brackish groundwater: meeting water quality requirements for fertigationby integrating nanofiltration, J. Membr. Sci. 436 (2013) 1–15.
[21] S. Sahebi, S. Phuntsho, J.E. Kim, S.K. Hong, H.K. Shon, Pressure assisted ferti-liser drawn osmosis process to enhance final dilution of the fertiliser drawsolution beyond osmotic equilibrium, J. Membr. Sci. 481 (2015) 63–72.
[22] G. Blandin, A.R.D. Verliefde, C.Y. Tang, A.E. Childress, P. Le-Clech, Validation ofassisted forward osmosis (AFO) process: Impact of hydraulic pressure, J.Membr. Sci. 447 (2013) 1–11.
[23] J.E. Kim, S. Phuntsho, F. Lotfi, H.K. Shon, Investigation of pilot-scale 8040 FOmembrane module under different operating conditions for brackish waterdesalination, Desalination Water Treat. (2014), http://dx.doi.org/10.1080/19443994.2014.931528.
[24] Y.C. Kim, S.-J. Park, Experimental Study of a 4040 Spiral-Wound Forward-Os-mosis Membrane Module, Environ. Sci. Technol. 45 (2011) 7737–7745.
[25]APHA, Standard methods for the examination of water and wastewater-American Public Health Association, 2005.
[26] A. Phocaides, Handbook on pressurized irrigation techniques, Food and Agri-culture Organization, UN: Rome, 2007.
[27] S. Phuntsho, S. Sahebi, T. Majeed, F. Lotfi, J.E. Kim, H.K. Shon, Assessing themajor factors affecting the performances of forward osmosis and its im-plications on the desalination process, Chem. Eng. J. 231 (2013) 484–496.
[28] J.E. Kim, S. Phuntsho, H.K. Shon, Pilot-scale nanofiltration system as post-treatment for fertilizer-drawn forward osmosis desalination for direct ferti-gation, Desalination Water Treat. 51 (2013) 6265–6273.
[29]BOM, Climate data online. Bureau of Metreology, Australian Government.,2015, (accessed: 02.01.15).
[30]ANZ-ECC and ARMCANZ, National water quality management strategy: anintroduction to Australian and New Zealand Guidelines for Fresh and MarineWater Quality-4A, 2000, Australian and New Zealand Environment and Con-servation Council (ANZ-ECC) and Agriculture and Resource ManagementCouncil of Australia and New Zealand (ARMCANZ).
[31] E.M. Garcia-Castello, J.R. McCutcheon, M. Elimelech, Performance evaluationof sucrose concentration using forward osmosis, J. Membr. Sci. 338 (2009)61–66.
[32] W.C.L. Lay, J. Zhang, C. Tang, R. Wang, Y. Liu, A.G. Fane, Factors affecting fluxperformance of forward osmosis systems, J. Membr. Sci. 394–395 (2012)151–168.
[33] C. DOW, Product Information for DOWTM Filmtec BW30-440i, 2014, DOWTM
Filmtec Membranes, DOW Chemicals.[34] I. Papadopoulos, Fertigation-chemigation in protected agriculture, Cah. Op-
tions Mediterr. 31 (1999) 275–291.[35] R. Munns, Comparative physiology of salt and water stress, Plant Cell Environ.
25 (2002) 239–250.[36] Y. Wang, R. Ou, H. Wang, T. Xu, Graphene oxide modified graphitic carbon
nitride as a modifier for thin film composite forward osmosis membrane, J.Membr. Sci. 475 (2015) 281–289.
[37] J. Wei, C. Qiu, C.Y. Tang, R. Wang, A.G. Fane, Synthesis and characterization offlat-sheet thin film composite forward osmosis membranes, J. Membr. Sci. 372(2011) 292–302.
[38] K.Y. Wang, R.C. Ong, T.-S. Chung, Double-skinned forward osmosis membranesfor reducing internal concentration polarization within the porous sublayer,Ind. Eng. Chem. Res. 49 (2010) 4824–4831.
[39] N.T. Hancock, W.A. Phillip, M. Elimelech, T.Y. Cath, Bidirectional Permeation ofElectrolytes in Osmotically Driven Membrane Processes, Environ. Sci. Technol.45 (2011) 10642–10651.
[40] W.A. Phillip, J.S. Yong, M. Elimelech, Reverse draw solute permeation in for-ward osmosis: modeling and experiments, Environ. Sci. Technol. 44 (2010)5170–5176.
[41] J. Ren, J.R. McCutcheon, A new commercial thin film composite membrane forforward osmosis, Desalination 343 (2014) 187–193.
[42] J.R. McCutcheon, R.L. McGinnis, M. Elimelech, Desalination by ammonia-car-bon dioxide forward osmosis: influence of draw and feed solution con-centrations on process performance, J. Membr. Sci. 278 (2006) 114–123.
[43] R.S. Ayers, D.W. Westcot, Water Quality for Agriculture, Food and AgricultureOrganization, United Nations: Rome, 1985.
[44]NSW-EPA, Protection of the Environment Operations (General) Regulation2009, Version in 2009 No 2112009, New South Wales State, Australia.
[45] V. Howat, Annual environmental management report 2013, Newstan Colliery,2013.
[46] Q. She, X. Jin, Q. Li, C.Y. Tang, Relating reverse and forward solute diffusion tomembrane fouling in osmotically driven membrane processes, Water Res. 46(2012) 2478–2486.
[47] S. Benavides, A.S. Oloriz, W.A. Phillip, Forward osmosis processes in the limitof osmotic equilibrium, Ind. Eng. Chem. Res. (2014).


![Review Articledownloads.hindawi.com/archive/2011/314829.pdf · aim for a 30–80% survival rate [21, 22]. After mutagenesis, the seeds (M 1) are planted and allowed to self-fertilise](https://static.fdocuments.in/doc/165x107/5e6df9479884a7183738ef03/review-aim-for-a-30a80-survival-rate-21-22-after-mutagenesis-the-seeds-m.jpg)