JOURNAL OF MARITIME TRANSPORT AND ENGINEERING · JOURNAL OF MARITIME TRANSPORT AND ENGINEERING...
55
ESTONIAN MARITIME ACADEMY LATVIAN MARITIME ACADEMY RESEARCH INSTITUTE LITHUANIAN MARITIME ACADEMY JOURNAL OF MARITIME TRANSPORT AND ENGINEERING Volume 1, No 1 ISSN 2255-758X 2012
Transcript of JOURNAL OF MARITIME TRANSPORT AND ENGINEERING · JOURNAL OF MARITIME TRANSPORT AND ENGINEERING...

ESTONIAN MARITIME ACADEMY
LATVIAN MARITIME ACADEMYRESEARCH INSTITUTE
LITHUANIAN MARITIME ACADEMY
JOURNAL OFMARITIME TRANSPORT
AND ENGINEERING
Volume 1, No 1
ISSN 2255-758X
2012

2
EDITORIAL BOARD:
Editor-in-ChiefProf. Dr. sc. ing. Jānis Bērziņš, Latvian Maritime Academy (Latvia)
MembersAssoc. prof. Ph.D. Taner Albayrak, Piri Reis University (Turkey)Prof. Ph.D. Anatoli Alop, Estonian Maritime Academy (Estonia)Prof. Dr. sc. ing. Rüdiger Böhlhoff, Hochschule Emden/Leer (Germany)Prof. Dr. habil. sc. ing. Juris Cimanskis, Latvian Maritime Academy (Latvia)Prof. Dr. sc. ing. Aleksandrs Gasparjans, Latvian Maritime Academy (Latvia)MBA Maurice Jansen, STC-Group, Shipping and Transport College (Netherlands)Prof. Ph.D. Heiki Lindpere, Estonian Maritime Academy (Estonia)Prof. Dr. sc. ing. Viktoras Senčila, Lithuanian Maritime Academy (Lithuania)Prof. Dr. habil. sc. ing. Wiesław Tarełko, Gdynia Maritime University (Poland)Prof. Dr. habil. sc. Alexander Yalovenko, Admiral Makarov State Maritime Academy(Russia)Assoc. prof. Dr. sc. ing. Arnis Zāģeris, Latvian Maritime Academy (Latvia)
Host organizations:Estonian Maritime AcademyLatvian Maritime AcademyLithuanian Maritime Academy
EDITORIAL CORRESPONDENCELatvian Maritime AcademyResearch Institutewww.latja.lv5B Flotes Street, Riga, LV-1016, LatviaPhone: (+371)67161111; fax (+371)67830138E-mail: [email protected]
Each article submitted to the journal is subject to double blind-peer review.
Copyright © Latvian Maritime Academy, 2012

3
CONTENTS
Taner Albayrak, Reza ZiaratiENCOURAGING RESEARCH IN MARITIME EDUCATION & TRAINING........4
Jānis Bērziņš, Ilmārs Lešinskis, Artūrs PrauliņšANALYSIS OF STRUCTURE OF CARGO TURNOVER AT LATVIA’S PORTS .10
Viesturs Bērziņš, Ilmārs Lešinskis, Aleksandrs PavlovičsGLOBAL WARMING IMPACT ON THE TEMPERATURE AND SEA LEVEL ATTHE LATVIAN COASTAL AREAS DURING LAST CENTURIES .......................20
Juris Cimanskis, Rihards Indriksons, Vasilijs KovaļovsEXPERIMENTAL PROPELLER SHAFT CONVEYED POWER METERING.......27
Rihards Indriksons, Jānis Kokars, Igors KurjanovičsTHE METHOD OF STARTING AIR SYSTEM ROUGH CALCULATION ............35
Edgars Kasalis, Ivars Kassalis, Jānis KasalisCLUSTER BASED APPROACH AS TOOL FOR INCREASINGCOMPETITIVENESS OF FREEPORT OF RIGA......................................................41
Gunārs ŠteinertsMARITIME DELIMITATION OF LATVIAN WATERS, HISTORY ANDFUTURE PROSPECTS................................................................................................47
REQUIREMENTS FOR MANUSCRIPTS .................................................................54

4
ENCOURAGING RESEARCH INMARITIME EDUCATION & TRAINING
Taner AlbayrakPiri Reis University, Maritime Faculty, Tuzla, 34940 Istanbul, Turkey,
E-mail: [email protected], phone: 90 533 746 77 57Reza Ziarati
Piri Reis University, Maritime Faculty, Tuzla, 34940 Istanbul, Turkey,E-mail: [email protected], phone: 90 533 746 77 57
AbstractEducation and training are vital to the development and success of today's knowledge society andeconomy. The EU's strategy emphasizes countries working together and learning from each other whilethe EU education and training policy underlines that knowledge, and the innovation it sparks, are theEU's most valuable assets. Innovation projects aim to improve the quality of training systems through thedevelopment and transfer of innovative policies, contents, methods and procedures within vocationaleducation and training. This paper intends to discuss innovative MET (Maritime Education and Training)projects to encourage future research collaboration which might be of interest to other higher educationand training institutions.Keywords: higher education, innovation, MET Programmes, research projects
Introduction
Shipping is perhaps the most international of the entire world’s great industries and one of the mostdangerous. World transport and shipping are a derived demand of world economic development [13].There are very large volumes of goods and materials, as well as people, which are transported daily fromone geographical location to another. Considering the types and volumes involved, the demand forshipping becomes clear. Over 90% of total world cargo is transported by ships and volume of maritimetrade is increasing every year [8]. Shipping therefore, is an overwhelming means of allowing economicresources to be transported, and hence a major facilitator for economic development worldwide. Theglobal economy is built on integrated supply chains that feed components and other materials to users justbefore they are required, and just in the right amounts. If the supply chains are disrupted, it will haverepercussions around the world, profoundly affecting business confidence [1].
Safety of life at sea, the marine environment and over 90% of the world’s trade depends on theprofessionalism and competence of seafarers [15, 7]. It has been reported that over 80% of accidents andincidents are due to human error [10]. A close investigation of casualty analyses considered approved byIMO1 (sub-committee minutes, 12th session, 2004), particularly focusing on the causes of accidentsclearly indicates that standards are not applied correctly and when human factor issues are studiedcarefully, there are omissions in the education and training programmes received by the seafarersinvolved in accidents [7, 17]. IMO has passed the responsibility for delivery and assessment of theseprogrammes to member countries and does not take part, in any shape or form, in the inspection,evaluation or delivery of these programmes. It is a welcome development that EMSA2 has been involvedin visiting MET providers in many EU and candidate countries to audit the education and trainingpractice against STCW requirements.
Today the development of a Maritime Education and Training (MET) system is a dynamic processunder the pressure of rapidly improving maritime technology. Technological developments will almostcertainly continue to create the potential for innovation in international shipping, but creating theconditions required to capitalize on that potential is likely to demand new ways of thinking, new ways ofworking, and a new framework for understanding reality [12].
An ideal development cannot be achieved by considering the existing practice and internal processesand procedures only, and needs to have a wider perspective by reviewing best practices to establish thenecessary benchmark. Rapid introduction of IT (Information Technology) into navigational equipmentand ship operation supporting systems such as AIS (Automated Identification System), ECDIS
1 IMO (International Maritime Organization)2 EMSA ( European Maritime Safety Agency)

5
(Electronic Chart Display Information System), IBS (Integrated Bridge System) or introduction of an e-Navigation system requires inclusion of marine-related IT technologies in respective MET (MaritimeEducation and Training) Programmes [6]. However, there is no doubt that this shall increase the numberof dedicated hours of respective units, not only for the classroom theoretical training, but also for theextensive use of simulators for the familiarization and skill enhancement. On the other hand, sea trainingonboard a ship is a must for all seafarers of various types and ranks and plays a very key role in theeducation and training of cadets. However, the training opportunities aboard ships offered by shippingcompanies have been significantly reduced, and due to commercial pressures in recent years resulting inminimum manning levels together with increasing level of automation, the nature and the quality oftraining on board have significantly changed for the worse. These have not been good signs for a cadettrainee as training onboard also plays a vital role for related research issues. The socialization processexperienced on the ship would probably affect one’s recognition as to whether one fits the environmentand further affect one’s intentions to remain in the profession after graduation, as it is considered that thefit between one’s character and work environment is the basis for one to choose a career [9].
Aim and Objectives
Research is an effective means of underpinning further and higher education programmes,developing and motivating staff, establishing working relationship with industry and commerce anddeveloping independent and self learning while preparing students for the future. Recent research hasshown that the response of International Bodies to address identified deficiencies on STCW content,language competence, automation, emergency situations and environment are generally slow, sluggishand/or lacks resources [5].
To overcome these deficiencies, TUDEV (Turkish Maritime Education Foundation) established apartnership with well-known and well-respected international maritime institutions and universities inUK and in other European Union member states and through working with organisations such asBTEC/Edexcel (Business and Technology Education Council), MNTB (Merchant Navy Training Board),NVQ/SVQ (National Vocational Qualification) authorities and professional institutions such as IMarEST(Institute of Marine Engineering, Science and Technology) developed a set of most up to dateprogrammes for Deck officers as well as Senior Deck officers and similar programmes for MarineEngineers and senior Engineer officers [2]. These co-operations and partnerships, including staff andstudent exchanges, not only provided opportunities for collaboration and joint programme and unit designand developments, but also initiation of a number of funded European Union projects. These EuropeanUnion funded projects, which TUDEV is either leading or is a partner in, have been used as catalyst forprogramme and unit development. The outcomes of such projects are reflected in the programmedevelopment process of which onboard training and use of advance simulators forms the focal part of [5].
European Strategies for Vocational Training and EU Projects
European integration and the creation of a united economic area has resulted in convergence oflegislation of EU countries as well as the candidate countries as a first step towards the harmonization ofdifferent national conditions and standards that now have to be incorporated into a single environment.Safety at work constitutes one of the EU’s most important social policies. The European council stressedthat Europe was going through a transition to a knowledge based economy, marked by profound changeseffecting society, employment and safety at work. The European Commission’s recent adaptation of“investment in people” and the Commission’s “investment in quality” are two policies that the proposedprogrammes are supporting. The EU strategy relating to both policies is based on consolidating a cultureof risk prevention, and ‘on right first time’ philosophy, as well as on combining a variety of tools, withtraining and awareness, being the most important ones.
The recent decisions made by the European Council requires EU membership countries to completealignment with EU maritime legislation in safety and non-safety areas and to improve maritime safety, inparticular improve the performance of maritime safety administrative institutions, firstly as a flag state,and then as a port state, and guarantee their independence. The EU also expects countries to implement aprogramme of adaptation of the transport fleet particular in maritime transport to Community technicalnorms. The candidate countries have to ensure effective implementation and enforcement of transportlegislation, particularly as regards to maritime safety.

6
The achievement of harmonising the education and training programmes [13] with specific emphasison improvement of training relating to safety topics as well as accredited and internationally acceptedprogrammes for assessors and verifiers (the teacher/trainers and those who verify compliance, bothinternal and external), and finally the provision of transnational multilayer pathways for transfer ofstudents/cadets as well as teacher/trainers are the main innovative aspects of the all new projects. Theprovision of integrated diplomas and degrees incorporating vocational and ancillary skills, which arerecognised worldwide, are also considered innovative. For this reason a new EU Funded project wasinitiated by TUDEV named UniMET [18]. UniMET (www.unimet.pro) intends to harmonize the MET,go beyond the IMO STCW minimum standards, and in the process identify good practices for futureimplementation.
Methodology
Safety at sea is an international issue and safety is as strong as its weakest link. Many countriesoften due to lack of resources, have not been able to improve their safety records. The quality of theeducation and training programmes of seafarers from these countries should be on the national agenda ofall flag countries and those operating ports worldwide. The weakness in one flag state could have, andoften does, an adverse impact in another geographical location.
To resolve the identified deficiencies [15,16,17,18] in education and training of merchant navypersonnel a partnership was established between TUDEV and C4FF (www.c4ff.co.uk), called as MarEdu(www.maredu.co.uk). To understand the problems in detail, a pilot project SOS (Safety On Sea, 2005-07), funded by the EU Leonardo programme, was launched. A partnership initially consisting of Turkey,Scotland, England and Norway was formed to identify major problems and good practices in the partnercountries by using Pareto analysis and cross-referencing techniques. The partnership developed integratedworld-class programmes of education and training both for navigation engineering and marineengineering cadets wishing to acquire internationally recognised qualifications as officer of watch [18].The Project also developed pathways to progress onto higher qualifications viz., chief mates and chiefengineers as well as becoming a master and captain of ocean going vessels. Several other EU projectswere also instigated in parallel to SOS. A summary of SOS and other related projects are presented in thefollowing paragraphs.
Projects
SOS (Safety On Sea) Project
The first task of SOS Project (www.surpass.pro) was to review existing programmes in the partnercountries to identify the differences and discover a methodology for harmonising education and trainingsystems and practices in collaboration with the relevant authorities in each of the member countries [3].The review of the programmes led to many productive discussions and adaptation of cross-referencingmethods developed as part of an earlier EU programme, EUROTECNET. The cross-referencing tablesprovided a means of comparing programmes in different countries in the partnership. In doing so, withno disrespect to organisations involved with validation and accreditation of these programmes, it wasrealised that there are serious differences in standards being applied, and even in the pathways chosen tosatisfy the requirements of the same awarding body or even the same licensing authority. The content andstandard of the sea service record books were also very different.
The unifying factor was the IMO syllabuses which are the basis of all MET programmes in theworld. The partner countries’ programmes have integrated these syllabuses to varying degrees ofcomplexities into their own national programmes. To harmonise and at the same time to improve thestandard, for instance, the Turkish project team using the syllabuses developed by northern Europeancountries, which in turn are based on IMO’s, revised programmes and at the same time, applying cross-referencing techniques also satisfied the requirements of the national authorities as well as those of amajor international awarding body (BTEC/Edexcel) for the award of a higher national diploma (HND).HND graduates, who also carry out their sea training according to recognised standards, for instance,Merchant Navy Training Board (MNTB) as part of the National/Scottish Vocational Qualification(N/SVQ) programme, provided they successfully conclude the required ancillary courses are exempt fromany written examination when applying for their certificate of competency.

7
Project MarTEL (Maritime Test of English Language)
This project makes an attempt to overcome the problem of not having international or Europeanstandards for Maritime English (www.martel-tests.org, and www.martel.pro). The project [15] intends to
establish a set of standards by transfer of innovation from existing English language standards andmaritime English model courses such as International Maritime Organisation’s (IMO) SMCP (StandardMaritime Communication Phrases, 2001). Review of the arguments from the recent IMO meetings (IMOMSC, 2006) considering MSC 82/15/2 and MSC 82/15/3 had identified that ‘there is a compelling needto promote a high level of working maritime English language skills’. Several EU member states haveinvited STW sub-committee to consider how the requirements in the STCW-Code can be strengthened inthis connection. It was noted that deficiencies in maritime English causes accidents and therefore needsto be seriously taught in the basic and the main training of all Chapters of the STCW Code of practice.This Project therefore is a maritime language competency assessment project for the languagecertification with the main aim of developing a series of maritime English language standardsincorporating also the IMO’s SMCP.
GMDSS (Global Maritime Distress and Safety System) I and II Projects
The GMDSS I Project (www.egmdss.com) focused on provision of vocational education andcontinuing vocational training for Short Range Certificate (SRC) which is mandatory for seafarersoperating vessels of up to 300 GRT within 30 NM from coast. To obtain the SRC award a candidate mustbe able to competently operate four different GMDSS communication devices (VHF DSC, NAVTEX,EPIRB and SART). These devices are only used for emergencies at sea which occur rarely. Therefore, theknowledge of operation of these devices tends to fade over time and should be regularly refreshed toensure safety of crew, passengers and freight (even though this is not a legal requirement). After thesuccessfully conclusion of GMDSS I, GMDSS II Project was launched for the LRC (Long RangeCommunications). The intention is to cover all aspects of GMDSS Communications in the future projects.
TRAIN 4Cs I and II Mobility Projects
To try and test the pathways developed in the SOS project a Leonardo Mobility programme wasdeveloped in conjunction with MarEdu. The project aimed to improve safety at sea through a mobilityprogramme (TRAIN 4Cs I) involving the transfer of cadets from TUDEV in Turkey to Glasgow Collegeof Nautical Studies (GCNS) in Scotland, on a pilot basis. The period of placement is for 14 weeks. Someof TUDEV Cadets were also transferred onto the final year of the Plymouth University’s BSc (Hons)Degree in Nautical Science and all were successful and received their degrees.
M’AIDER Maritime Aids Development
M’AIDER project (www.maider.pro) was developed as a follow-up to the former SOS Project incoordination with several partner countries in Europe. This project proposal concerns transfer ofinnovation from existing reports concerning accidents and incidents for creation of a range of scenariosfor applications in simulators relating to emergency situation. It is acknowledged that emergencysituations and use of simulators have not been fully taken into consideration and that industry wouldimmensely benefit from a user-friendly and accessible training tool and programme for its sea-goingpersonnel focusing on emergency situations; the causes for this situation arising and how they arehandled.
An existing software and internet platform will be used to transport these simulation trainings forgreater access throughout the partnership as well as outside of it. The platforms have got facilities for e-learning as well as e-assessment for self assessment.
Project SURPASS (Short Courses Programme for Automated Systems in Shipping)
The main aim of this project [17] is to fill the gap created as the result of the emergence andapplication of the automated systems in the education and training of seafarers by provision of a trainingcourse enabling them to have a full understanding of automated systems, and these systems’ weaknessesand limitations. This aim will only be achieved if a well-planned literature review of, on the one hand, the

8
automated system and components, and on the other hand, the accidents and incidents, such as that bySavannah Express (2005) [17] or the very recent sinking of Glorious (2007) in the Istanbul Strait, arecarefully and meticulously carried out. The former accident was due to engine failure and the latter dueto navigation (steering, rudder) failure.
Conclusions
The development of the integrated and unified programme for the education and training ofmerchant navy personnel under the SOS programme has led to a set of programmes which include allgood practices both for Deck and Marine Engineering. The programmes were developed with supportfrom major awarding bodies such as BTEC and several universities, accrediting bodies such as IMarESTand licensing authorities including the UK’s MCA. The programmes have now been reviewed by EMSAand are now completely in compliance with EMSA requirements [4].
All projects summarised above are in line with the EU's policy and strategy (IMP and Knowledge2020) which emphasizes countries working together and learning from each other and the EU’s educationand training policy which underlines that knowledge and the innovation it sparks as the EU's mostvaluable assets. An attempt was made to ensure that there is an e-learning and assessment platforms forall projects for wider dissemination purposes.
The development of newly revised programmes, within the European Qualification Framework(EQF) addressing the overall problems concerning safety at the source viz., education and training ofcadets and the existing officers working in industry [18] is expected to make a major impact. The successof the MarEdu initiative has led to other projects being instigated and thus helping industry to update itsskills and hence maintain the current efforts in improving safety at sea and in ports.
Developments are on-going and it is expected that many other organisations involved with educationand training of merchant navy officers including awarding, accrediting and licensing bodies would jointhe partnership. There are now over 30 major centres working with TUDEV supporting various EuropeanProjects.
The Turkish Chamber of Shipping has been investing on Maritime Education and Training for along time not only for own interests but also to become a major seafarer supplier of the worldwideshipping. As a result of these initiatives, Piri Reis University was established by TUDEV as acontinuation of a former Maritime Institute for higher degree programs in maritime related issues. In thesecond half of the next decade, world maritime will witness the rising quality of the Turkish seafarerswho are poised to carry world shipping to highest standards. TUDEV’s experience on researchprogrammes are also transferred to Piri Reis University along with staff transfers, and they will alsocontinue full speed ahead to bring innovative solutions to the most critical issues of the maritime industry.At the end of the next decade we can foresee more unified MET Programmes, enhanced communicationslevels and hence better understanding and cooperation among those working in the water transportationsector which will reduce all losses significantly. Piri Reis University will be looking forward to any co-operation with and/or partnership invitation to any innovative MET related research project.
Acknowledgement: Authors would wish to thank Mr Sualp Urkmez (Furtrans), Mrs Sadan Kaptanoglu(Kaptanoglu Shiping) and Dr Basak Akdemir (Makro shiping) for their permission given for summariesof their EU funded projects they have been implementing in collaborations with TUDEV.
References
1. Albayrak, T. Tudev and Maritime Training Strategies. Turkish Shipping World Magazine,December 2007, pp. 20-26.
2. Albayrak, T. Tudev Full Speed Ahead on the EU Route. Turkish Shipping World Magazine,January 2008, pp. 34-37.
3. Albayrak, T. New Horizons – The Imarest Accreditation Visit. Turkish Shipping WorldMagazine, May 2008, pp. 18-21.
4. Albayrak, T., Ziarati, R. New Methodologies and Technologies in Maritime Education andTraining (MET). In: Proceedings of the 16th IMLA (International Maritime Lecturers Association)Conference (İzmir, Türkiye, October 14-17, 2008, Dokuz Eylül University), pp. 63-75.

9
5. Albayrak, T., Ziarati, R. Training: Onboard and Simulation Based Familiarisation and SkillEnhancement to Improve the Performance of Seagoing Crew. In: Human Performance At Sea.Proceedings of Conference (Glasgow, UK, June 16-18, 2010, Strathclyde University).
6. Barsan, E., Hanzu, P., Arsenie, R. New Navigation Competencies. Pomorstvo, god. 21, br. 2,2007, pp. 151-161.
7. Brady, P. Rear Admiral. The Timeliness of the STCW Convention/Code Revision – STWChairman Update. In: Proceedings of the 16th IMLA (International Maritime Lecturers Association)Conference (İzmir, Türkiye, October 14-17, 2008, Dokuz Eylül University).
8. Fuazudeen, M. Seafarers’ Training and the Comprehensive Review of the STCW Convention andSTCW Code. In: Proceedings of the 16th IMLA (International Maritime Lecturers Association)Conference (İzmir, Türkiye, October 14-17, 2008, Dokuz Eylül University).
9. Holland, J.L. Making Vocational Choices: A Theory of Vocational Personalities and WorkEnvironments. Odessa (Floride): Psychological Assessment Resources Inc., 1997.
10. IMO, ‘sub-committee minutes’, 12th session, 2004 (and 13.01.2005, www.imo.org/humanelement)
11. IMO MSC82 82/15/2 and 82/15/3, 2006 IMO, Assembly A 26/INF.426th Session 22 October2009, Young Seafarer’s Focus Group 2009
12. Robinson, J. E. Waves of Change-Inspiring Maritime Innovation in the Information Age. TheNautical Institute Press Modern Colour Solutions, Middlesex, England, 2007.
13. Sag, O.K., Ziarati, R., Özkaynak, S., Yıldırımalp, M. An Innovative MET Model in GlobalHigher Education. In: Proceedings of the 16th IMLA (International Maritime Lecturers Association)Conference (İzmir, Türkiye, October 14-17, 2008, Dokuz Eylül University), pp. 1-14.
14. Zachcial, M. The Present and Future Developments of World Shipping and Ports. In:Proceedings of the 16th IMLA (International Maritime Lecturers Association) Conference (İzmir, Türkiye,October 14-17, 2008, Dokuz Eylül University).
15. Ziarati, R. Safety At Sea – Applying Pareto Analysis. In: Proceedings of World MaritimeTechnology Conference (WMTC), Queen Elizabeth Conference Centre, February, 2006.
16. Ziarati, R., Ziarati, M. Review of Accidents with and on Board of Vessels with AutomatedSystems – A Way Forward, AES07, Sponsored by Engineering and Physical Science Research Council inthe UK (EPSRC), Institute of Engineering and Technology (IET, Previously IEE), Institute of MechanicalEngineers (IMechE), IMarEST, 2007
17. Ziarati, R., Ziarati M. Surpass - Short Course Programme in Automated Systems in Shipping. In:Human Performance At Sea. Proceedings of Conference (Glasgow, UK, June 16-18, 2010, StrathclydeUniversity).
18. Ziarati, R. A Cooperation Project in Education: UniMET. Turkish Shipping World MagazineMonthly, September 2010, pp.76.

10
ANALYSIS OF STRUCTURE OF CARGO TURNOVERAT LATVIA’S PORTS
Jānis BērziņšLatvian Maritime Academy, 5B Flotes Street, Riga, LV-1016, Latvia,
E-mail: [email protected], phone: +371 67161110Ilmārs Lešinskis
Latvian Maritime Academy, 5B Flotes Street, Riga, LV-1016, Latvia,E-mail: [email protected], phone: +371 67161122
Artūrs PrauliņšLatvian Maritime Academy, 5B Flotes Street, Riga, LV-1016, Latvia,
E-mail: [email protected], phone: +371 67161111
AbstractPorts play a crucially important role in the development of national economy as they generate stable taxflows and duties, providing direct positive effects on GDP, Balance of Payments and Balance of Trade.Sometimes their impact on regional economy may be significant also. The analysis of the structure ofcargo volumes (annual throughput) transshipped by the port and changes in commodity mix can providean invaluable insight in the trend of port development. The comparative analysis of the structure of cargovolumes at Latvia’s ports has been done in the paper and the degree of its dissimilarity was statisticallyevaluated.Keywords: cargo, Latvia, ports, structure
Introduction
Transport is of fundamental importance to human society, providing mobility and facilitatingindustry and trade. The essential economic and social benefits, which are so difficult to balance againstthe high social and environmental costs, make transport a crucial sector for sustainable development, asrecognized in the EU sustainable development strategy. [22]
Actually, transport is one of the most important and dynamic sectors of economy in the Baltic States.Increasing volumes of export explicitly demonstrate the role of the transport sector in the economicgrowth of those countries. It is acknowledged that high quality of transport services provides the nationaleconomy with various benefits, inter alia improved logistics (reduced level of inventories, more reliablesupply of goods, higher delivery quality etc.) and better mobility that leads to the higher profitability ofbusiness [14] However, in spite of the optimal location of transport infrastructure in Latvia, its lowquality still influences the competitiveness of the provided transport services. [12; 15] In addition, notonly the total volume of throughput determines the effectiveness of port activities and impact on nationalor regional economy but also the change in the commodity mix as different types of cargo requiredifferent handling methods, use of labour, material and service input.
The paper aims to do a quantitative analyze of and to draw conclusions about dissimilarity andchanges in the structure of cargo turnover at Latvia’s posts. The tasks of the research are:
1) to study literature on the impact of ports on regional economy;2) to analyze changes in cargo turnover and its most important components as well as statistically
assess their significance at Latvia’s ports in 2000 – 2010;3) to forecast the future changes in cargo turnover in total as well as at both Latvia’s freeports and
small ports.To achieve the aim of the paper several research methods were used, namely, deduction, induction,
synthesis and analysis, statistical and monographic methods. The research object is the changes in thestructure of cargo turnover at Latvia’s ports; the research period is from 2000 to 2010. All the calculationsare made by the authors of the paper and based on statistical data obtained from Central Statistical Bureauof Latvia as well as reports of Tallinn and Klaipeda ports.
Impact of ports on regional economy
About 90 % of world trade is transported by ship. The recent growth in trading commodities volumetransported by sea – a 4.8 per cent increase year-on-year – was higher than recorded in the last decades.

11
Thus maritime transport has strong position in global supply chains, determining to great extent theireffectiveness and elasticity. [10] It is argued that maritime transport will continue to be the mostimportant transport mode in developing EU trade for the foreseeable future. [18] Demand for transportcan be viewed as deriving from the changing nature of international trade relations. With the growth inworld trade, international shipping is expanding. [11; 16] It is pointed out [20] that since internationaltrade is carried predominantly by sea transport major container ports play a crucial role in regionaleconomies. In the past the presence of a port meant not only traffic and transport activities, but alsoeconomic activities, ranging from industries that use mainly raw materials imported by sea and whoseland transportation costs would have been too high, to those producing goods to be exported by sea and/orthose whose optimal location was where the break of bulk took place. Nowadays it is not longer the caseas many of these industries, no technologically restricted to port areas any more, and suffering from therelative scarcity and/or high prices of space and other inputs, have moved to regions where these inputsare available at better conditions. [1]
Therefore the general guidelines for conducting analysis of port's economic impact provided byG. R. Yochum and V. B. Agarwal [23; 24] are worth mentioning. The guidelines are based on differentlinkages between the port and the region's economy and depicture clearly the interdependence degreebetween above mentioned economic subjects.
1) Port required industry - employment in companies providing services for the movement ofwaterborne commerce. There are transportation services (e.g. freight forwarding, transport of cargo byrail and road) and port services (e.g. terminal operations, stevedoring, vessel supply, pilotage, towage,ship repair, diving services, insurance, legal services).
2) Port attracted industry - employment in companies attracted to the region because of the presenceof the port and its facilities. If the port facilities were closed down, the companies would leave region.Usually these companies export commodities or import products or raw materials for assembly anddistribution (e.g. steelworks, chemicals, refineries).
3) Port induced industry - employment in companies that have expanded their markets by exportingthrough the port due to reduced transportation costs. Such industries are typically located at a substantialdistance from port facilities (because theoretically they could be located in the region regardless of theavailability of port facilities) and can not be identified on the basis of a mere geographical criterion.
Some researchers have tried to discover the factors the impact of port on local economy depends on.After performance of empirical studies based on the port of Tampa (USA), J. S. DeSalvo and D. Fuller[2; 3] concluded that the impact of ports depends on the cargo volumes transshipped by the port and onthe price elasticity of the demand for imports and exports channeled through that port. AlthoughM. Benacchio et. al. [1] did not reveal an apparent relation between the estimated impact and the totalvolume of ports throughput, vital importance to distinguish between changes in cargo volumes, andchanges in the commodity mix was stressed in their study. Different commodities require differenthandling methods and thus different use of labour, material and service inputs for their loading andunloading. It means that a rise in the share of containerized traffic would decrease aggregate direct labourinputs (stevedoring services), increase indirect effects due to logistic activities performed on high valuegoods, increase capital investments and expenditures on items such as fuel oil, in turn indirectly alteringthe structure of local economy. [18; 19]
It is acknowledged [1] also that the employment structure (workers, professionals, engineers etc.) isan important indicator of the quality of the impact in terms of its added value. At the same time thegrowth in tons does not definitely lead to a comparable growth in terms of employment because theintroduction of containerization and standardization of cargo could induce the transformation of portsfrom main service centres to simple transit points. Containerisation granted to shipping lines morefreedom to serve markets from a wider choice of ports. They ignore the specific merits of a particular portand take into account just the economies of scale and conditions of the entire logistic chain. [18] Thusports face the challenge to enhance the economic benefits from port operations as the transfer functionalone is producing diminishing returns for the regional economy due to growing automation. The possiblesolution to this problem could be extended involvement in logistics. For instance, inventory control, datamanagement, packing and processing are considered to be the modern value-added elements of physicaldistribution. [19]
According to R. O. Goss [6] there are at least four clear reasons for which port expansion orimprovement is likely to be an inefficient tool of economic development strategy:
Port benefits are likely to "leak" to users in inland locations;

12
Assisting and investing public money in a port will probably mean assisting foreign exporters,some of whom will be able to compete more effectively with home producers;
Any public assistance to a port is likely to lead to higher local taxes (local share of infrastructurefinancing), running the risk to make the area less attractive to residents and possible businessestoo;
Since the aggregate demand for labour within any given economy is determined bymacroeconomics factors, ports are competing among themselves for a share of a reasonablyfixed level of business (e.g. the expansion of a port belonging to a range could also be at theexpense of lost trade in other regional or national ports belonging to the same range).
According to studies [1; 17] several monetary and non-monetary costs of the port impact on localeconomy can be mentioned:
The local share of investments in maritime and port infrastructures, transport infrastructures; Opportunity costs of port industry inputs: capital, labor, space (coast and landscape); Negative "sunk" externalities: environmental aspects (air, water, acoustic pollution), landscape
decay, irrecoverable investments in facilities, traffic congestion, costs for "conciliating" thepresence of the port in a urban context, the risk of hazardous material handling (chemicals,petrochemicals);
Eventually loss of managerial and leadership functions for local port economies that are quite nolonger among the location selection criteria of holdings, corporations and administrativedepartments of the firms located within the port region.
P. Gripaios and R. Gripaios (1995, 1999) [8; 9] draw similar conclusions for UK ports and providedempirical evidence that nowadays the existing and potential role of ports in the regional developmentprocess is often exaggerated. However, ports still play a crucially important role in national economygenerating taxes and duties as well as they often constitute growth centres for national industries (e.g.manufacturing, transport, logistics) and services.
Structure of cargo turnover at Latvia’s ports
There are 10 ports in Latvia. Ports of Riga, Liepaja and Ventspils are mostly focused on transitcargo which accounts for almost 70 % of their total turnover. It can be assumed that the role of ports inlogistic cluster is important. [5] Ports of Riga and Ventspils have been granted the status of freeports, butport of Liepaja is an integral part of Liepaja special economic zone. Small ports (Engure, Lielupe,Mersrags, Pavilosta, Roja, Salacgriva and Skulte) primarily service local clients who transport timber andfishing products. All the ports are engaged in various projects and reconstruction works with the aim toexpand their activities, improve the quality of service and strengthen their competitiveness. Although co-operation between different ports in Latvia may increase their competitiveness in the Baltic region and theglobal market, ports demonstrate their reluctance and lack of interest in co-operation. [13] Inter-portcompetition is getting much stiffer on the international level as well. [19] Usually it is explained bystandardization of port services. That means that ports cannot rely on specialization to maintain marketshare and generate revenues as much as they used to. Due to containerization, ports in the same regionbecome closer substitutes, and hence are more exposed to competition from other ports and other routes.[17]
Ports are usually characterized by their annual throughput (i.e. port traffic in TEU, tons). [25] Otheraspects analysts pay special attention to are changes in the commodity mix (for instance, the increase incontainerized traffic, the decrease in liquid bulk, etc.) and future forecasts. However, as M. Benacchio et.al. [1] noted, the increase in port throughput does not necessarily mean that the port is creating “value” toremunerate inputs. It just means that port is either more effectively managed in comparison with others orit is more strategically located close to important hinterlands and/or maritime routes.
Analysis of base increment and chain increment in different types of loaded and unloaded cargoprovides the opportunity to trace chronologically the changes in cargo turnover at Latvia’s ports. [7] AtLatvia’s ports over the last ten years the volume of loaded cargo reached its peak in the year 2008,whereas the amount of unloaded cargo peaked in the 2007 (Table 1). The total increase in unloaded cargowas much more considerable compared to the one in loaded cargo – by 212 % and 113 % accordingly.However, the volume of loaded cargo demonstrated more stable trend of development since the annualfluctuations were less notable. The volume of the most significant components of loaded cargo decreasedduring the period in question except for oil products whose gradual growth compensated for the largestdrop in crude oil as well as metal and metal manufactures. The components of unloaded cargo

13
demonstrated the trend diametrically opposed to the mentioned previously. All but the volume ofunloaded sugar grew during the period from 2000 to 2010 providing the remarkable change in thestructure of cargo turnover. If at the beginning of the period the volume of unloaded sugar accounted foralmost 20 % of the total unloaded cargo, in 2010 just for 2.5 %. It means that there was a shift in priorities.It resulted in oil products making up 20 % as well as grain and grain products together with mineralconstruction materials making up other 20 % of the total turnover of unloaded cargo in 2010.
Table 1. Changes in cargo turnover and some of its components at Latvia’s ports in 2000 – 2010 (Ktons, incrementrate in percent)
2000 2001 2002 2003 2004 2005 2006 2007 2008 2009 2010
Loaded cargo49276
54372
48735
50918
54101
55890
53069
55178
57654
57565
55724
Base increment 110 99 103 110 113 108 112 117 117 113
Chain increment 110 90 104 106 103 95 104 104 100 97
# Oil products15822
17609
18237
19586
19438
20094
19662
21061
20346
21957
19252
Base increment 111 115 124 123 127 124 133 129 139 122
Chain increment 111 104 107 99 103 98 107 97 108 88
# Crude oil13631
14986
7566 3579 2196 423 1192 1233 1016 380 204
Base increment 110 56 26 16 3 9 9 7 3 1
Chain increment 110 50 47 61 19 282 103 82 37 54
# Dry chemicals 6554 6446 6430 6817 5967 6537 5123 5173 4562 3059 3750
Base increment 98 98 104 91 100 78 79 70 47 57
Chain increment 98 100 106 88 110 78 101 88 67 123
# Timber 6098 6121 6238 6471 6340 5664 4575 4644 3654 3444 5413
Base increment 100 102 106 104 93 75 76 60 56 89
Chain increment 100 102 104 98 89 81 102 79 94 157# Metals and metalmanufactures
3439 2619 1926 1293 859 1076 1065 1043 1079 904 839
Base increment 76 56 38 25 31 31 30 31 26 24
Chain increment 76 74 67 66 125 99 98 103 84 93
# Liquid chemicals 976 878 546 972 976 1114 994 1187 1430 964 686
Base increment 90 56 100 100 114 102 122 147 99 70
Chain increment 90 62 178 100 114 89 119 120 67 71
Unloaded cargo 2567 2546 3420 3837 3299 4152 6428 7256 5995 4415 5436
Base increment 99 133 149 129 162 250 283 234 172 212
Chain increment 99 134 112 86 126 155 113 83 74 123
# Sugar 500 701 988 1107 429 304 473 286 289 73 131
Base increment 140 198 221 86 61 95 57 58 15 26
Chain increment 140 141 112 39 71 156 60 101 25 179# Mineralconstruct.materials
280 171 178 141 135 646 861 970 918 358 574
Base increment 61 64 50 48 231 308 346 328 128 205
Chain increment 61 104 79 96 479 133 113 95 39 160# Grain and grainproducts
170 135 254 215 196 288 412 416 382 322 437
Base increment 79 149 126 115 169 242 245 225 189 257
Chain increment 79 188 85 91 147 143 101 92 84 136
# Oil products 145 71 223 255 194 503 1076 1126 565 982 1031
Base increment 49 154 176 134 347 742 777 390 677 711
Chain increment 49 314 114 76 259 214 105 50 174 105

14
Source: authors’ calculations based on data obtained from Central Statistical Bureau of Latvia3
Over the last decade the proportion of different cargo in cargo total turnover at Riga port underwentchanges (Table 2). The proportion of coal increased notably and accounted for almost 40 – 50 % of thecargo flow at the end of the analyzed period. On the contrary, the proportion of mineral fertilizers andtimber declined gradually from 12 % to 5 % and from 31 % to 10 % accordingly. The most constantproportion fluctuating at the level of 6 – 8 % (coefficient of variation Vσ = 12 %) was demonstrated bycargo containers. Compared to the year 2000 when the proportion of other cargo made up a fifth of theturnover it was just a tenth in the last years. Thus it indicates that the concentration of cargo assortmenthas been taking place since the beginning of the century.
Table 2. Structure of cargo turnover at the port of Riga in 2000 – 2010, percent20
00
2001
2002
2003
2004
2005
2006
2007
2008
2009
2010 Vσ
Coal 0 8 14 24 39 44 42 40 47 47 38 54
Oil products 21 23 29 23 18 14 19 18 18 22 21 19
Mineral fertilizers 12 10 10 9 6 6 5 8 7 7 5 31
Timber 31 29 23 21 18 16 12 11 7 6 10 51
Cargo containers 6 7 6 6 6 6 6 7 6 6 8 12
Woodchip 3 3 5 5 5 5 5 3 3 2 4 26
Roll-on, roll-off cargo 1 1 2 3 2 3 1 2 2 2 2 34
Construction materials 4 2 1 1 1 2 3 3 2 1 1 51
Other 22 16 11 8 5 5 7 8 9 7 11 53
Source: authors’ calculations based on data obtained from Central Statistical Bureau of Latvia4
Significant changes were observed at Liepaja port also (Table 3). The proportion of grain and grainproducts reached a peak of 41 % in 2009 compared to just 2 % in 2000. However, the proportion of othermost important cargo groups decreased more or less notably. For instance, since 2004 the proportion ofroll-on and roll-off cargo demonstrated a downward trend and resulted in a total drop of 10 percent points(from 15 percent in 2000 to 5 percent in 2010). The proportion of metals and metal manufactures wentdown by 8 percent points, timber – by 5 percent points, but oil products – by 4 percent points.
Table 3. Structure of cargo turnover at the port of Liepaja in 2000 – 2010, percent
2000
2001
2002
2003
2004
2005
2006
2007
2008
2009
2010 Vσ
Grain and grain products 2 6 11 11 11 22 24 30 34 41 32 64Metals and metalmanufactures
20 18 22 17 19 18 20 19 14 14 12 18
Timber 25 22 18 18 18 16 14 13 11 13 20 25
Oil products 13 16 17 15 13 10 19 14 13 9 9 25
Roll-on, roll-off cargo 15 17 15 17 16 10 0 0 0 8 5 75
Scrap metal 2 0 0 0 2 4 5 5 9 4 6 79
Crude oil 0 0 2 6 5 5 5 5 7 4 3 58
Chemicals 3 1 1 1 1 1 1 1 2 3 2 60
Construction materials 2 2 1 0 1 2 2 4 3 1 6 81
Other 17 19 13 15 16 12 11 10 8 5 5 40Source: authors’ calculations based on data obtained from Central Statistical Bureau of Latvia
3 Available (accessed on 15.03.2012):http://data.csb.gov.lv/Dialog/varval.asp?ma=TR0220&ti=TRG22%2E+AR+J%DBRAS+TRANSPORTU+NOS%DBT%CETAS%2C+SA%D2EMTAS+KRAVAS+PA+KRAVU+VEIDIEM+%28t%FBkst%2E++tonnu%29&path=../DATABASE/transp/Ikgad%E7jie%20statistikas%20dati/Transports/&lang=164 Available (accessed on 15.03.2012):http://data.csb.gov.lv/DATABASE/transp/Ikgad%C4%93jie%20statistikas%20dati/Transports/Transports.asp

15
At the beginning of the analyzed period just two equally important cargo groups accounted foralmost 70 % of the turnover at Ventspils port, namely, oil products and crude oil (Table 4). However,within 10 years the situation changed dramatically. The upward trend in proportion of oil products wasaccompanied by gradual decrease in proportion of crude oil. In result, the latter plummeted and was nil in2010. At the same time the proportion of other cargo either increased or remained almost the same (withthe exception of potassium salt which after wild fluctuations and subsequent insignificant decreaseleveled off at 10 % in 2010). The proportion of coal demonstrated the most considerable increase of 15percent points. It was followed by roll-on, roll-off cargo (5 percent points). The conclusion can be drawnthat unlike the concentration of cargo assortment which could be clearly observed at the port of Riga, thestructure of cargo turnover has become more diversified at the port of Ventspils.
Table 4. Structure of cargo turnover at the port of Ventspils in 2000 – 2010, percent
2000
2001
2002
2003
2004
2005
2006
2007
2008
2009
2010 Vσ
Oil products 37 36 44 52 53 56 52 54 53 60 54 16
Coal 1 4 5 6 14 15 14 13 16 20 15 53
Potassium salt 14 13 16 18 16 17 13 10 9 4 10 33
Roll-on, roll-off cargo 0 0 0 1 1 2 6 6 5 3 5 89
Liquefied gas 2 2 1 3 3 3 3 3 4 3 2 30
Grain and grain products 0 0 1 0 0 0 0 1 3 2 3 110
Woodchip 0 0 0 1 1 2 2 1 1 2 1 64
Crude oil 39 40 26 12 8 1 7 7 5 2 0 111
Other 6 5 7 7 4 3 4 4 5 4 11 39Source: authors’ calculations based on data obtained from Central Statistical Bureau of Latvia
In comparison with 2000 the structure of cargo turnover at small ports was more balanced in 2010(Table 5). Although timber continued to dominate as the most important cargo its proportion was not solarge as it used to be at the beginning of the century (91 % and 66 % accordingly). The gradual decreasein proportion of timber occurred at the expense of the rise in woodchip which formed almost a fifth of thecargo transported through small ports at the end of decade. Likewise, the proportion of constructionmaterials climbed from 1 percent to 8 percent.
Table 5. Structure of cargo turnover at small ports in Latvia in 2000-2010, percent
2000
2001
2002
2003
2004
2005
2006
2007
2008
2009
2010 Vσ
Timber 91 88 88 72 72 60 58 65 62 54 66 18
Woodchip 3 7 8 11 16 16 17 19 25 25 19 47
Construction materials 1 0 1 9 4 15 17 8 6 8 8 81
Peat 1 0 0 5 5 5 5 5 3 6 5 61
Other 5 4 3 3 3 3 2 2 5 6 3 35Source: authors’ calculations based on data obtained from Central Statistical Bureau of Latvia
The significance of changes in the structure of cargo turnover at Latvia’s ports can be revealed in theresult of special quantitative analysis and application of statistical technique. Nowadays severaldissimilarity indexes have been proposed. [26] A dissimilarity coefficient is a function that measures thedifference between two objects. [4] One of the most commonly used measures is the one (Formula 1)invented by Hungarian statistician Sandor Alexander Szalay (1912-1983), who did research on quality oflife and spending of leisure time.

16
2
1 12
12
S n=I
n
i dddd
(1)
n - number of groups in comparable structuresd - proportion of a group in total amount
Initially the Szalay index was invented to analyze the difference in use of time budget amongvarious groups of people [21]. At present it is vastly applied as an aggregated ratio for quantitativecomparative analysis of different structures. Another one is an integral coefficient of structure changeswhich is known as K. Gatev coefficient (Formula 2) [27].
2
2
2
2
1
21
G=I
dd
dd(2)
d – proportion of a group in total amount
The values of both Szalay index and Gatev coefficient lay in the interval from 0 to 1 where thelower bound represents dissimilarity and the upper bound complete identity. Gatev coefficient measuresabsolute and relative changes of structures in their mutual conjunction. It means that, unlike Szalay index,Gatev coefficient not only takes into account the intensity of changes in a group but also the proportion ofthat group in comparable periods.
The analysis revealed (Table 6) that changes in structure of cargo turnover at Latvia’s ports weremuch more significant during the period from 2000 to 2005 than from 2005 to 2010. The degrees ofdissimilarity assessed by both Szalay index and Gatev coefficient were almost equal with the exception ofVentspils port. At this port Szalay index indicated an extremely high degree of dissimilarity betweenstructure of cargo turnover in 2005 and 2010 whereas according to Gatev coefficient the changes weremoderate and did not exceed the similar level in other ports. According to Szalay index the structure ofcargo transported though Latvia’s ports underwent the most important changes at Ventspils port.However, Gatev coefficients pointed at the most considerable transformation which occurred at Riga port.
Table 6. Szalay index and Gatev coefficient of dissimilarity calculated for structure of cargo turnover at Latvia’sports
Years forcomparison
Riga port Liepaja port Ventspils port Small portsSzalaiindex
Gatevcoefficient
Szalaiindex
Gatevcoefficient
Szalaiindex
Gatevcoefficient
Szalaiindex
Gatevcoefficient
2000 & 2005 0,4799 0,7429 0,4683 0,4258 0,6558 0,5460 0,5971 0,32902005 & 2010 0,2189 0,1866 0,2887 0,2790 0,5506 0,1396 0,1430 0,10262000 & 2010 0,4778 0,6932 0,5453 0,6062 0,7390 0,5647 0,5773 0,2690
Source: authors’ calculations
Ports still keep their importance even from a national perspective as they generate stable tax flowsand duties, providing direct positive effects on GDP, Balance of Payments and Balance of Trade. Forexample, according to provisional calculations operation of the port of Riga provides approximately 3 to3.3 % of the GDP in Latvia. [13] Usually ports are significant growth poles for national industries (e.g.manufacturing, transport, logistics) and services, effective macro-economic tools for development ofeconomically depressed areas as well as a channel to international markets and foreign investments. Portindustry plays an irreplaceable role as central links in the logistic chains of the global economy.
Therefore it is vitally important to forecast the future changes in cargo turnover in total as well as atboth Latvia’s freeports and small ports. For this reason the trend estimation for cargo turnover (Table 7)was made using Microsoft Excel tools. Trend estimation for Klaipeda and Tallinn port was made just forthe purpose of comparison. The criterion for the choice from the list of possible trends was the goodnessof fit measured by the coefficient of determination R2. Time series included data on cargo turnover atLatvia’s ports from 1993 to 20105, at Klaipeda port from 1991 to 20106 and at Tallinn port from 1999 to2011.7
5 Available (accessed on 15.03.2012):http://data.csb.gov.lv/DATABASE/transp/Ikgad%C4%93jie%20statistikas%20dati/Transports/Transports.asp

17
Table 7. Trend estimation for loaded and unloaded cargo at Latvia’s ports, Klaipeda and Tallinn ports
Loaded cargoTotal at all Latvia’s ports y = 10908ln(x) + 26285 R2 = 0,952
Rigay = 2,5509x2 + 1512,5x + 733,3y = 1561x + 571,75
R2 = 0,975R2 = 0,9749
Liepaja y = 509,45x 0,7504 R2 = 0,9383Ventspils y = 21,153x3 - 719,31x2 + 6582x + 16898 R2 = 0,7753Small ports y = -1,3164x2 + 97,553x - 19,956 R2 = 0,9329Klaipeda y = 38,529x2 - 154,11x + 10985 R2 = 0,9316
Unloaded cargoTotal at all Latvia’s ports y = 21,158x2 - 102,51x + 3045,6 R2 = 0,848Riga y = 3,527x2 - 8,4951x + 2139,9 R2 = 0,5321Liepaja y = -3,6085x2 + 102,94x - 71,387 R2 = 0,882Ventspils y = 249,73e 0,1158x R2 = 0,7097Small ports y = -0,302x3 + 7,6619x2 - 44,842x + 98,718 R2 = 0,8077Klaipeda y = 23,893x2 - 264,33x + 4084,5 R2 = 0,8558
Total loaded and unloaded cargoTotal at all Latvia’s ports y = 12328ln(x) + 27314 R2 = 0,9608Klaipeda y = 61,889x2 - 411,32x + 15051 R2 = 0,9401Tallinn y = 50,91x3 - 1210,1x2 + 8163x + 21680 R2 = 0,8736
Source: authors’ calculations
According to the coefficient of determination R2 the equations for loaded cargoes at Latvia’s ports(with exception of Ventspils port) demonstrate better goodness of fit compared to the ones for unloadedcargo. As initial data for total unloaded cargo at all Latvia’s ports, unloaded cargo at Riga port and smallports did not allow calculating the trends of acceptable goodness of fit some additional processing wasapplied. Therefore the calculation of trend was based on a simple moving average of the period of fouryears. A moving average is a set of numbers, each of which is the average of the corresponding subset ofa larger set of data points. It is commonly used with time series to smooth out short fluctuations andhighlight long-term cycle. The application of this method resulted in trend equations with the coefficientof determination R2 ranging from 0,5321 for unloaded cargo at Riga port to 0,882 for total unloaded cargoat all Latvia’s ports. Similar method of simple moving average of the period of three years was applied tothe calculation of trend for total cargo at Tallinn port.
Conclusions
Although the researchers are unanimous that ports contribute to the development of nationaleconomy, they have doubts about both their impact on regional economy and determinative factors ofimpact. It is argued that nowadays role of ports in regional development is often exaggerated. At the sametime the importance of analysis of cargo volumes (annual throughput) transshipped by the port andchanges in commodity mix are stressed. The analysis revealed that over the last 10 years the diametricallyopposed processes took place in the ports of Riga and Ventspils. If at the former the concentration ofcargo assortment occurred, at the latter the structure of cargo became more diversified. The structure ofcargo turnover at small ports became more balanced in 2010 compared to 2000. However, timber stillaccounted for two thirds of total turnover. The results of the analysis of structure dissimilarity for cargoturnover at Latvia’s ports demonstrated that it was much more significant during the period from 2000 to2005 than from 2005 to 2010. According to Szalay index the structure of cargo transported thoughLatvia’s ports underwent the most important changes at Ventspils port. Nevertheless, Gatev coefficientspointed at the most considerable transformation at Riga port. According to the coefficient ofdetermination R2 the equations for loaded cargoes at Latvia’s ports (with exception of Ventspils port)demonstrated better goodness of fit compared to the ones for unloaded cargo.
6 Report on cargo handling in Klaipeda State Seaport in the year 2010 Available at (accessed on 15.03.2012):http://www.portofklaipeda.lt/en.php/statistics/annual_reports/77467 Available (accessed on 15.03.2012): http://www.portoftallinn.com/key-figures

18
References
1. Benacchio, M. et. al. On the economic impact of ports: local vs. national costs and benefits. In:Special Interest Group on Maritime Transport and Ports. International Workshop (Genoa, Italy, June 8-10, 2000). Available (accessed on 15.03.2012):http://www.informare.it/news/forum/2000/sig2/genovaes.asp
2. DeSalvo, J. Measuring the direct impacts of a port. Transportation Journal, Vol. 33, No. 4, 1994,pp. 33-42.
3. DeSalvo, J., Fuller, D. The role of price elasticities of demand in the economic impact of a port.Review of Regional Studies, Vol. 25, No. 1, 1995, pp. 13-35.
4. Encyclopaedia of Measurement and Statistics (ed. by L. J. Salkind). Vol. 1. London: SagePublications, 2007.
5. Gailītis, R., Jansen, M. Development of the Latvian maritime policy – a maritime clusterapproach. In: Maritime Transport and Infrastructure – 2010. Proceedings of the 12th internationalconference (Riga, Latvia, April 29-30, 2010, Latvian Maritime Academy), 2010, pp. 15-21.
6. Goss, R. O. Economic policies and seaports. The economic functions of ports. Maritime Policyand Management, Vol. 17, No. 3, 1990, pp. 207-219.
7. Goša, Z. Statistika. Rīga: Izglītības soļi, 2007.8. Gripaios, P. Ports and their influence on local economies - a UK perspective. The Dock &
Harbour Authority, Vol. 79 (894), 1999, pp. 235-241.9. Gripaios, P., Gripaios, R. The impact of a port on its local economy: the case of Plymouth.
Maritime Policy and Management, Vol. 22, No. 1, 1995, pp. 13-23.10. Grzelakowski, A. S. Maritime Transport Development in the Global Scale – the Main Chances,
Threats and Challenges. International Journal on Marine Navigation and Safety of Sea Transportation,Vol. 3, No. 2, 2009, pp. 197-205.
11. Hunt, E. C., Butman, B. S. Marine Engineering Economics and Cost Analysis. Maryland:Cornell Maritime Press, 1995.
12. Kabashkin, I. Logistics centres development in Latvia. Transport, Vol. 22, No. 4, 2007, pp. 241-246.
13. Kasalis, E. , Kasalis, I., Kasalis, J. Clusters approach as one of determinants for increasingcompetitiveness of freeport Riga. In: Maritime Transport and Infrastructure – 2011. Proceedings of the13th international conference (Riga, Latvia, April 28-29, 2011, Latvian Maritime Academy), 2011, pp. 46-51.
14. Maciulis, A., Vasiliauskas, A. V., Jakubauskas, G. The impact of transport on thecompetitiveness of national economy. 2009. Available (accessed on 15.03.2012):http://www.thefreelibrary.com/The+impact+of+transport+on+the+competitiveness+of+national...-a0227461582
15. Meirane, E. Research on the structure of cargo flow in Latvia. Transport, Vol. 22, No. 3, 2007,pp. 195-199.
16. Michaelowa, A., Krause, K. International Maritime Transport and Climate Policy.Intereconomics. Vol. 35, No. 3, 2000, pp. 127-136.
17. Port Competition and Hinterland Connections. Summary and Conclusions. Discussion Paper No.2008-19. Paris: Joint Transport Research Centre, 2008.
18. Przybyłowski, A. International Journal on Marine Navigation and Safety of Sea Transportation,Vol. 3, No. 4, 2009, pp. 457-462.
19. Slack B. Globalisation in Maritime Transportation: Competition, uncertainty and implicationsfor port development strategy. The Fondazione Eni Enrico Mattei Note di Lavoro Series. Paper No.8.2001. 2001.
20. Song, D. W. Regional container port competition and co-operation: the case of Hong Kong andSouth China. Journal of Transport Geography, Vol. 10, 2002, pp. 99-110.
21. Stewart, J. Assessing alternative dissimilarity indexes for comparing activity profiles. Electronicinternational Journal of Time Use Research, Vol. 3, No. 1, 2006, pp. 49–59.
22. Vasiliauskas, A. V., Kabashkin, I. Comparative analysis of the actions towards sustainabletransport system development in Latvia and Lithuania. In: Transbaltica. Proceedings of the 6th
international scientific conference (Vilnius, Lithuania, April 22-23, 2009, Vilnius Gediminas Technicaluniversity), 2009, pp. 237-241.
23. Yochum, G. R., Agarwal, V. B. Economic impact of a port on a regional economy. Growth andChange, Vol. 18, No. 3, 1987, pp. 74-87.

19
24. Yochum, G. R., Agarwal, V. B. Static and changing port economic impact. Maritime Policy andManagement, Vol. 15, No. 2, 1988, pp. 157-171.
25. Морской энциклопедический справочник в 2 томах (под ред. Н.Н. Исанина). Том 2.Ленинград: Судостроение, 1986.
26. Практикум по социальной статистике (под ред. И. И. Елисеевой). Москва: Финансы истатистика, 2002.
27. Сивелькин, В. А., Кузнецова, В. Е. Статистический анализ структуры социально-экономических процессов и явлений. Оренбург: Оренбургский Государственный университет,2002.

20
GLOBAL WARMING IMPACT ON THE TEMPERATUREAND SEA LEVEL AT THE LATVIAN COASTAL AREAS
DURING LAST CENTURIES
Viesturs BērziņšBIOR Fishery Department, Marine laboratory, 8 Daugavgrīvas Street, Riga, LV-1048, Latvia
e-mail: [email protected]ārs Lešinskis
Riga Technical University, 1 Kaļķu Street, Riga, LV-1058, Latvia, e-mail: [email protected] Pavlovičs
Latvian Maritime Academy, 5B Flotes Street, Riga, LV-1016, Latvia, e-mail: [email protected]
AbstractThis title scrutinizes dynamical changes of several hydrometeoroligal parameters in relation withnotorious ‘global warming’ process, these changes in Latvian coastal areas within last centuries, namely,water temperature changes in Riga Bay (1963-2011), average air temperature changes in Riga andvicinity (1795-2011), as well as seawater level changes in Ventspils and Daugava river basin (1873-1968). The analysis of data reveals some trends and findings: 1) Air temperature and water temperaturefluctuations and trends in Riga bay are mutually correlated, so, statistical data on changes of airtemperature might be used for overall hydrometeorological analysis. 2) last centuries dynamic of the airtemperature fluctuations is being expressed as the cyclic process, however, there is not considerablemajor temperature growth monitored. 3) The average tempo of water level growth in the area isconsiderably less than as compared with the records from last Glacial Era’s final phase. The globalwarming process is being continuing after the end of last Glacial Era up to now, and there is no solidground for assumption, that this process has been facilitated nowadays.Keywords: global warming, temperature, levels of water.
Introduction
The attribution „global warming” usually is associated with atmospheric and lithospheric averagetemperature growth, this is a hot issue within last decades, and object of stipulations for scientists(researchers), politicians and public mass media. Quite frequently the process of global warming isattributed to be caused and intensified by human industrial activities and civilization. The perceived orreal consequences of the global warming process could be described as follows:
1) Carbon dioxide (CO2) content increase in the atmosphere, causing the growth of air andlithospheric temperature due to impact on Earth thermal balance, by ways of absorbing secondaryterrestrial infrared emitting.
2) Carbon dioxide content augmentation causes as air, as water temperature growth at seas andoceans
3) Temperature growth causes and facilitates de-glaciation (glaciers melting) at continental, oceanicand mountainous regions,
4) Glaciers melting, in turn, cause water temperature growth in global oceans and seas, so the cycleis self-supporting process;
5) Also, global warming facilitates various climatic, hydrographical and other related phenomenonand processes, such as Ozone (O3) layer depletion, rapid desertification advance, tropical cyclones andextreme weather phenomenon escalation etc.
The information and data about water levels changes and those causing factors are of extremeactuality, in order to derivate the forecasts for future. The data on water levels fluctuations could be veryimportant for coastal construction and building industry, as well as for planning and designating themaritime coastal-traffic routes and hydrography works.
This research analyses some hydrometeorology parameters of Latvian coastal area in direct relationwith the global warming; namely, temperature changes in Bay of Riga, air temperature changes in theCity of Riga and in vicinity, as well as water levels alterations in the Ventspils and Daugavgriva(Daugava river basin).

21
Research’s methodology and processed data
The fluctuation of sea water temperature in Riga bay at time period from 1963 to 1970 is beingevaluated by statistical data from Latvian Hydrometeorology Administration [1]. More extended timeperiod for such evaluation of Riga Bay temperature is covered by data from fishery department: registryfrom 1971 to 1991 is taken from BaltNIIRH (Baltijskij Naučno Issledovateļskij Institut RibnogoHozjaistva) records; 2004 thru 2010 data are derivate from Fish Recourses department (LZRA-LatvijasZivju resursu aģentūra) records, as well as all data since 2011 are retrieved from Fishery Department’sMarine laboratory (BIOR) sources.
Average water temperature in the Bay of Riga is being calculated using the observations, which areequalized in adherence to average seasonal calendar datum (February 10, May 10, August 10, October25) and in pro-rata to layers volumes adhered to ice-cover thickness at particular winter season[2, 3].
Air temperature data series for the City of Riga are erratic due to changing methods of observationsin the Riga and vicinity, as well as there are some time-gaps in observations. Since 1795 up to 1813observations were conducted in the University of Riga; series are continued in years 1824 thru 1830;1840; 1851 thru year 1950. In city of Jelgava air temperature observations have been conducted from1831 thru 1876, from 1890 thru 1892, as well as from 1894 thru 1904; than from 1925 thru 1950; all thesedata are processed from literary sources [4].
At time period from 1942 to 1973, observations have been conducted in Riga Observatory. RigaAirport has executed air temperature observations since 1974 thru 2009 and all these data also processedfrom literary sources [5,6,7].
The period 1992- 2009 is covered by dynamic observation data from Website FOBOS, weatherstation at Riga Airport, http://www.gismeteo.ru/catalog/latvia/; further observations after 2009 have beenextracted from Webiste WINDGURU, from location in Riga (Kisezers DA), Web:http://www.windguru.cz/.
This research implements data from Riga Airport as the basic source of air temperature records(hereinafter-Riga), and all other air temperature observations are adhered to these by means of conversionfactor by particular months, in cases when there are correlated by time observations (see Table 1).Observations without time correlating are being assumed to be substituted by other ones from differentlocations.
Table 1. Monthly air temperature conversion factor for the City of Riga (oC)
Convertions (ºC)Month
Jan Feb Mar Apr May Jun Jul Aug Sep Oct Nov DecJelgava - Riga 0.1 -0.1 -0.2 -0.6 -0.5 -0.5 -0.3 0 0.2 0 0 0.1
Riga Univesity -Riga 0.1 -0.2 -0.1 -0.5 -0.7 -0.8 -0.9 -0.5 -0.1 -0.1 -0.1 0.1
Observations on the water levels alterations in Ventspils and Daugava river basin at time periodfrom 1873 up to nearly 1978 are retrieved from the publications of Latvian HydrometeorologyAdministration [8].
This research implements calculations and parameters-related average indicators and values in theprofile of perennial dynamic. The changes of the parameters per 100 years have been calculated; forinstance, temperature changes ºC/100 years, or water level changes cm/100 years.
In some cases the analysis is being conducted by deploying correlation factors between, for instance,air temperature in Riga and average water temperature in Riga bay.
Air and sea water temperature dynamic at time period 1963-2011
The analysis of water and air temperature data for time period from 1963 to 2011 deliversimpression, that Global Warming process is ultimately in force, because average air temperature hasgrown up by 4.1 ºC/100 years, and, accordingly, water temperature by 2.3 ºC/100 year. The correlationfactor between these two parameters is 0.8, meaning tight mutual alignment of data (Figure 1).

22
y = 0.0234x - 40.219
y = 0.0411x - 75.066
0
1
2
3
4
5
6
7
8
9
1962 1967 1972 1977 1982 1987 1992 1997 2002 2007 2012
Years
Air
tem
pera
ture
, deg
C
4
5
6
7
8
9
10
11
12
13
Wat
er te
mpe
ratu
re, d
eg C
Air Water Linear (Water) Linear (Air)
Figure 1. Annual average air temperature measurements in Riga and water temperature in Bay of Riga at time period1963-2011
Air temperature dynamic at time period 1795-2011
Using above mentioned revealing on tight mutual correlation of air and water temperature indicators,we can analyse the temperature fluctuation dynamic within more extended time period, approximately fortwo centuries. Looking at air temperature changes within this time span, we can derivate severaldistinctive features as follows:
1) Temperature grows at rate 0.31 ºC/100 years at time span two hundred years, however thisgrowth is at least 13 times less compared with the data for last 50 years (see Figure 2)
2) Widening up Extending the calculation time period demonstrates, that average air temperaturegrowth rate consequently decreases (see Table 2).
3) At time period 1795 thru 1960 air temperature decreases with the rate -0.22 ºC/100 years , andthis rate is more profound for time period 1795-1910, achieving -0.62 ºC/100 years (see Figure 3 andTable 2).
y = 0.0031x + 0.2145
3
4
5
6
7
8
9
1780 1810 1840 1870 1900 1930 1960 1990 2020
Years
Air
tem
pera
ture
, deg
C
Figure 2. Average air temperature changes in Riga at time period from 1795 to 2011

23
Table 2. The general tendency of air temperature changes in Riga, at value of oC/100 years for different periods
Time period years1963 -2011
1900 -2011
1840 -2011
1795 -2011
1795 -1960
1795 -1910
Tendency of airtemperature
changes, oC/100 years4.11 1.37 0.69 0.31 -0.22 -0.62
In general, the purpose of current research is to estimate air and water temperatures, as well as waterlevels fluctuations and tendencies; however, the major analysis reveals the cyclic (or periodical) dynamicof parameters changes. For instance, the estimation of air temperature changes within last centuriesdelivers at least two temperature maximums-at the end of 18th century and at the beginning of 19th century,as well as at the end of 20th century and currently and, consequently at the initial time period of 21th
century. Also several time periods, where decreased air temperature is observable (see Figure 2).
Figure 3. Average annual air temperature changes in Riga at time period from 1795 to 1960
The dynamic and fluctuations of water levels changes at time period from 1873 to 1968
Levels of water are being influenced by astronomical conditions, fresh water balance, unevenatmospheric pressure, and wind /water density mutual rates. Water level changes in Baltic Sea are beingunder direct impact from endogenous fresh water flow fluctuations, changes of atmospheric pressure andwinds; there are some direct relations of such changes with melting of ice cover and Earth crust’s verticalshifts.
This title covers annual average changes of the levels of water in Ventspils and Daugavgriva at timeperiod from 1873 to 1968. Both locations are characterized by clear tendency of water level growth – inthe Daugava river the level of water has grown by 20.5 cm per 100 years, in Ventspils water level growthrate is 4.45 cm/100 years. Therefore, water level growth in Daugavgrivas basin is at least 4 times morethan in Ventspils (see Figure 4).
The interest sparking finding is that the average speed (rate) of water level growth in both locationsis quite different. This difference could be explained by Earth crust’s lithospheric vertical shifts in Balticregion. There are no significant vertical lithospheric shifts in Daugavgriva, but average verticallithospheric movement rate in Ventspils is about 0.6-1.0 mm/year , providing water level augmentation atrate 6-10 cm/100 years [9]. The assumption is, that water level fluctuations in Daugavgriva are in directrelation with the common trends of Ocean water level; in turn, Ventspils parameters are under impactfrom Earth crust’s lithospheric vertical shifts, being more significant in Northern areas of Baltic region(see Figure 5).
y = -0.0022x + 10.157
3
4
5
6
7
8
9
1790 1820 1850 1880 1910 1940 1970
Years
Air
tem
pera
ture
, deg
C

24
-30
-20
-10
0
10
20
1870 1880 1890 1900 1910 1920 1930 1940 1950 1960 1970
Years
Wat
er le
vel
(+/-)
, cen
timet
re
Ventspils Daugavgriva Vent.-Daug. Linear (Vent.-Daug.)
Figure 4. The changes of water level in Ventspils (sea) and Daugavgriva (river basin) at centenary time period
Figure 5. The intensity of current Earth crust’s lithospheric vertical shifts in Baltic Sea area: а – locations ofwater level monitoring spots, б – intensity of vertical shifts, mm/year, в – isobases of vertical shifts as derivate fromwater levels measurements, г – isobases of vertical shifts as derivate from geodetic field-levelling, д – areas of most
consistent measurements [9, pp. 93].

25
Discussion
The analysis of air and water temperatures statistical data reveals common trend of last 50 years,when assumption about global warming caused by human industrial activities is quite plausible. Thetendencies of air and water temperatures growth directly lead to such an assumption. The analysis of airtemperature fluctuations at time period approximately of two centuries: those are being profoundlycorrelated with water temperature fluctuations, reveals quite doubtful systematic and incrementaltemperature growth, at least in Baltic Sea region, because there are as temperature increasing astemperature decreasing time periods [10, 11].
The analysis of available data from publications and literary works on common trends within muchmore extended time periods (approximately 12 000 years) reveals, that fluctuations and changes are beingprofoundly expressed in broader time-continuum. For instance, the book by Ojars Aboltins about naturalenvironmental processes in Baltic sea region at time period since the last Glacial era up to modern times,ostensibly concludes the occurrence of cyclic temperature changes: there were five temperature‘’troughs’’(including final stage of Glacial era) and at least four temperature ‘’peaks” [12, p. 96 ].
The graphs provided by Aboltins indicate the occurrence of so called ‘’climatic optimum” 6500years ago, when average temperature was approximately by 2.4oC higher than nowadays. Elevatedmeanings of temperature was 4100 and 1800 years ago, being, accordingly, 2.1 ºC and 1.2 ºC higher thannowadays. Lower temperature indications could be found 5300, 2800 and 300 years ago, when it was 0.4ºC, 1.3 ºC and 1.2 ºC less than modern meanings accordingly.
The above mentioned temperature data quite apparently demonstrate, that assumption about globalwarming and its direct correlation with human industrial activities is quite dubious. The elaborated dataanalysis just leads to conclusion, that natural processes are associated with shorter or longer cycles ofclimatic changes with all related consequences. The features of climatic changes since last glacial era areobviously supported by modern paleontological researches of fossil farina and spore, when thermophileor psychrophilic plants-breed distribution across the geographical areas and epochs obviously amplifiesthe data on average temperature meanings.
Cyclic changes of climate with all related factors are also backed up by various researches:dendrology researches (tree-ring chronology of temperature), investigations of deep ice-sample drilling inGreenland and Antarctica with revealing of carbon dioxide (CO2) specific content, as well as ‘’light’’ and‘’heavy’’ oxygen particular content rates. All these biological and naturalistic researches allow to derivateconclusions about average temperature dynamic in historical perspective [12].
The climate impacting factors and their cyclic changes are thoroughly described in fundaments bookby Monin and Šiskov about the history of the Earth climate since the existence of our planer. The bookstipulates in a detailed way all the basic climate changes upon the last glacial era and nowadays, with thegeographical coverage of Europe and, particularly Baltic Sea region. There are attributed tectonic,glaciological, geomorphological, biological, paleontological, dendrology and other nature andenvironmental changing-in-dynamic parameters for different time periods and centennial profiles. Forinstance, the aforementioned book states, that within so called ‘’climatic optimum’’ time period between5000 thru 7000 B.C., the air temperature in Europe was being at least by 2 ºC higher compared withnowadays, whereas the summer seasonal air temperature in Siberia was being ~ 4 ºC higher than now.There are not mentioned 8 thru 11. Century so called ‘’Viking era” air temperature dynamic, however,considering glaciers and trees-breeds penetration geography, supported by other data, there areindications of air temperature to be higher than at modern times. So called ‘’Minor Glacial Era”, whichhas covered time period between 17 to 19 centuries, the average air temperatures was by 1-2 ºC lower,than nowadays [13].
All the aforementioned findings and many other researches just prove the facts, that in matters ofclimate changes, a time period after last glacial era could be described as the cyclic process of climaticparameters changes (especially air and water temperatures fluctuations), where some spikes and troughscould be observed. Therefore, quite intensive temperature growth, being observed at the last centennialtiming profile, as well as being generally attributed to human industrial activities, could be, in reality, tobe just a segment of on-going global climatic natural process on the ascending phase, whereas humanindustrial influence and impact on the process are quite doubtful.
Summarizing all above mentioned available researches data, we can conclude, that there is no clearand profound ground for predication on intensive and incremental temperature growth. Such a growth isbeing observed just within the time period of several centennials.
The level of world ocean was by 60 meters lower than nowadays approximately 12000 years before,and average water level growth rate is at least 50 centimetres per 100 years nowadays [12, 14]. The

26
comparison of water level growth rates within last centuries with the average same indicators of the lastglacial era’s final stage, reveals the fact, that modern water level growth rate is at least three times slower;it means, that ice-melting overall process is much slower either, so there is none any solid ground forpredication on intensive water level growth during last centennials. However, water level growth is veryconsiderable, and this process can impact the construction and building industry in coastal area (dumbs,wave -breakers, piers and quays, as well as hydrography installations) in matters of projecting, design andbuilding works.
Conclusions
The research and analysis of air and water temperatures, as well as water levels fluctuations inLatvian coastal areas during time periods of last centennials, supported by other related researches onparameters deducted shortly thereafter the last Glacial era, draw the conclusions as follows:
1) The growth of temperature within time period of the last 50 years might be the sort ofconfirmation about global warming process caused by human industrial activities.
2) The dynamic of temperature fluctuations at time period within last two centennials is notchanging substantially.
3) The dynamic of temperature fluctuations at time period since the final stage of last Glacial erademonstrates average decrease of the temperature, at least within last 6500 years, and there are shorter orlonger cycles of climatic changes.
4) The water level growth rate at time period within last centennials is at least three times slowerthan it was at time just after last glacial era’s final stage.
In general we can draw a conclusion, that so called ‘’Global Warming” process has commencedthereafter last glacial era; it is in active phase up to nowadays, however associated with some parameters’fluctuations, and there are no any solid ground for a statement, that this process has become moreintensive during last centennials.
References
1. Таблицы глубоководных гидрологических и гидрохимических наблюдений (ТГМ-3М,1963-1970), УГМС Латв. ССР. [The tables of the hydrological and hydrochemical deepwaterobservations.].
2. Берзиньш, В., Лине, Р. Я. Межгодовые изменения зимнего теплозапаса воды и его влияниена численность ракообразных Рижского залива весной., Fischerei - Forschung. Rostock, Jg. 25, H. 4,1987, S. 63 - 65. [Bersinsch V., Line R.J. Zwischenjährliche Veränderungen des winterlichenWasserwarmvorrats der Gewässer und sein Einfluß auf die Abundanz der Crustazeen in der Rigaer Buchtim Frühling , Fischerei - Forschung. Rostock, Jg. 25, H.4, 1987, S. 63 - 65.]
3. Berzinsh, V. Hydrology. Ecosystem of the Gulf of Riga between 1920 and 1990. Ed. by E.Ojaveer, Estonian Academy Publishers, Tallinn, 1995, pp. 7-31.
4. Месячные выводы метеорологических данных за отдельные годы. Латвийская ССР, Частъ I,Температура воздуха. Ред. Я. Скрастинъш, Рига, 1952.
5. Метеорологический ежемесячник. Bыпуск 5, часть 2, Рига, Обнинск, 1952 – 1992.6. Meteorological Bulletins of the Latvian Hydrometeorological Agency. Tables TMS, Technical
report, LHMA, 1992-1995.7. Ikdienas laika biļetens. Latvijas Republikas Vides aizsardzības un reģionālās attīstības ministrijas
Valsts Hidrometeoroloģijas Pārvaldes Hidrometcentrs, Nr. 1 - 192., Rīga, 1996.8. Water level, currents, water temperature, ice, water salinity. Basic hydrological characteristics. Ed.
by N. Arsenyeva. Vol. 1, Issue. 3. Riga, 1972 (in Russian).9. Гуделис, В. К., Емельянова, Е. М. Геология Балтийского моря. Вильнюс, 1975.10. Bērziņš, V. Dažas okeanogrāfisko parametru dinamikas īpatnības Latvijas jurisdikcijas ārējos
ūdeņos mūsdienās. LU 68. zinātniskā conference (Rīga, Latvija, 2010. gada 19. februārī). Klimatamainība un ūdeņi. KALME. Rakstu krājums, 2010., 16-24. lpp.
11. Bērziņš, V., Pavlovičs, A., Lešinskis, I. The Global Warming Impact on Temperature and WaterLevel Changes in Latvia. In: Maritime Transport and Infrastructure. Proceedings of the 14th InternationalConference (Riga, Latvia, April 26-27, 2012, Latvian Maritime Academy), 2012, pp. 122-125.
12. Āboltiņš, O. No ledus laikmeta līdz globālajai sasilšanai. Dabas vides pagātne un tagadne Latvijā.Rīga: LU Akadēmiskais apgāds, 2010.
13. Монин, А. С., Шишков, Ю. А. История климата. Ленинград: Гидрометеоиздат, 1979.14. Mälkki, P., Tamsalu, R. Physical features of the Baltic Sea. Finnish Marine Research, No. 252.
Helsinki, 1985. - 110 pp.

27
EXPERIMENTAL PROPELLER SHAFT CONVEYED POWERMETERING
Juris CimanskisLatvian Maritime Academy, 5B Flotes Street, Riga, LV-1016, Latvia,
E-mail: [email protected], phone: +371 67432091Rihards Indriksons
Latvian Maritime Academy, 5B Flotes Street, Riga, LV-1016, Latvia,E-mail: [email protected], phone: +371 67432091
Vasilijs KovalovsLatvian Maritime Academy, 5B Flotes Street, Riga, LV-1016, Latvia,
E-mail: [email protected]
AbstractA method of experimentally exterminating the propeller transferred power of the shore moored vessel,using non-contact adapters and without using any dismantling operations is described in this work. Themethod of the power measurement results the indirect of the confidence interval calculation using onlydirectly measured parameters of the partial errors is determinate in this paper. The vessel’s propellertransferred power, the experiment data and processing results, including the error estimates are treatedusing an example vessel. It is shown how to make the rational calculations in order to narrow theconfidence interval by analyzing the experimental data. Certain calculating methodology isproposed for the capacity limits of applicability to the given permissible relative errors, as wellas adapters and signal recording equipment parameters.Keywords: impulse signal, torsion moment, absolute and relative error, credibility range.
Introduction
In many cases, the small vessels performance is determined not only with the engine’s power. Notalways characteristics of the propeller are fully consistent with the engine described speed. In this case, atthe very "light" propeller, engine power is not fully used, but at too "heavy" - the engine can notreach nominal revolutions and, therefore, develop the full power. The performanceof direct propeller transferred power more objectively is being characterized. This power can becalculated using the vessels theory, found in the relationship (e.g., work [1]). However, the obtainedresults will not accentuate with the high precision by means of calculation, a series of rates informulas are derived empirically, and any failure to comply with the propeller and enginecondition, which during operating time can vary widely. Therefore, it is target experimentally to measurepropeller’s transferred power at different engine revolutions directly to the moored vessels.
The power could be determined directly on ship board with the power measuring method, which isprotected by the Latvian Patent Nr.14004 [2]. However, the difficulties caused by the fact that in manycases it is difficult to tare the equipment without load, because usually there is no such shaft stagebetween the propeller and the engine, which could be disconnected from the propeller withoutdismantling work. On the other hand the moment of rotation of the propeller impedance in the water,even at the minimum revolutions of the main engine is too large to be ignored. The method tocircumvent these difficulties is described in this paper.
The description of the method
The proposed methodology includes the following. Marks 1 and 2 are glued at the shaft (Fig.1) and opposite the adapters 3 and 4 are fixed. At intervals t1 (from 1st mark, moving along the sensorend till 2nd mark moving along the sensor end) and t2 (from 2nd mark, moving along the sensor end till 1st
mark moving along the sensor end) optical sensor generated pulse type signals are recorded and stored inthe database (Fig 2).
To determine transmitted power of the shaft, the ship is moored at the pier and measurements weremade at two different propeller revolutions speed ω1 and ω2, where ω2 > ω1. At ω = ω1 opticalsensor generated pulse type signals in a time span t1 is marked as i1, but the amount of time t2 -as i2. And at ω = ω2 are marked with the number of pulses j1 and j2. The mark 1 nearest to the

28
engine, turning angle φ growth anent to marks 2 turning angle angular velocity increasing from ω1 to ω2
can be calculated as
φ = 2π – , where j∑ = j1 + j2 , i∑ = i1 + i2 ( 1 )
The increment of this turning angle is proportional to the increment of torque MM = φ ∙ c ,
where c - shaft spinning rigidity between the marks 1 and 2.
ω
Figure.1 The scheme of the shaft transferred power measurement equipment
mark 1 is moving along the sensor 3
The movement direction of the markin relation to the transducers
t1 t2mark 2 is moving along the sensor 4
Figure 2. Optical sensor generated signals
From ships theory it is known (e.g., [1]) that for the propeller turning, torque proportional tothe square of the speed rotation is required.
Analog signal converter to digitalform (ASC)
3 4
shaft
2
1
Computer
j1
j∑
i1
i∑

29
Then2 2
= = ( 2 )
Here M1 , M2 - torque at ω1 and ω2: M2 = M1 + M ( 3 )
From the expressions (2) and (3) we find
M1 = , M2 = . ( 4 )
Here the rotational speed ratio is indicated with k:k = =
Angular velocity and rotary frequency (revolutions / minute), are calculated with the formulas:
ω1 = , , n1 = , , ω2 = , , n2 =( 5 )
where f – the frequency of sensor generated pulse signal .
Knowing the torque, engine power P1 and P2 at the angular rotation of ω1 and ω2 is calculated with theformulas:
P1 = M1 ∙ ω1 = ,
P2 = M2 ∙ ω2 = . ( 6 )
Estimate of the accuracy of the results obtained
In formulas (1) - (6) the values of i1 , i2 , j1 , j2 , f and c parameters are not known with theabsolute precision. Registered number of impulsive signals i1 , i2 , j1 and j2 in each shaft revolutionfluctuates an average value - this can be explained by the reading error, as well as the angular velocityfluctuations Experimental studies have shown that recording the number of pulse counts over 100 duringthe shaft rotation, the average relative error of values of i1∑, j∑ , k , i1/ i∑ and j1/ j∑ does not exceed afew hundredths of a percentage.
Signal generation frequency f depends on the AC mains frequency, which may vary during theexperiment within 0.5%. Shaft torsion rigidity c depends on the shaft material shear modulus, which canbe found in the literature with only a 5% precision for a steel shafts and 15% precision for castiron shafts. Therefore, the reduction of the deviation from the calculated average values of the results, isbetter to be measured stiffness spinning of the shaft between marks 1 and 2 directly on-board static loading of an existing stationary shaft with known torsional moments and directly measuringthe torsion angles.
Equating function and argument mistakes to differentials:
1) by the formula (1) the error Δφ of the calculated φ angle is determined by the formula:
Δφ = 2π √ (Δ(j1/j∑ ))2 + (Δ(i1/i∑ ))2 , ( 7 )
where Δ(j1/j∑ ) and Δ(i1/i∑ ) is , ratio and average value of the error.
2) the rotational speed ratio squared k2 relative error δk2 :
Mk2 – 1
k2 ∙ Mk2 – 1
2π ∙ fi∑
2π ∙ fj∑
i∑
j∑
60 ∙ fi∑
60 ∙ fj∑
ω2
ω1
2π ∙ φ ∙ c ∙ fi∑ ∙ (k2 – 1)
i1
i∑
j1
j∑
2π ∙ φ ∙ c ∙ f ∙ k2
j∑ ∙ (k2 – 1)
M2
M1
ω2
ω1
i∑
j∑

30
δk2 = 2 √ (δi∑ )2 +(δj∑ )2 , ( 8 )
where δi∑ and δj∑ are i∑ and j∑ are average relative errors.
3) the calculated power P1 andP2 relative errors are δP1 and δP2 :
δP1 = √ (δc)2 +(δφ)2 +(δf)2 +(δi∑)2 +(δk2)2 , δP2 = √ (δc)2 +(δφ)2 +(δf)2 +(δj∑)2 +2(δk2)2 , ( 9 )
where δc , δφ , δf are c , φ and f are average values relative errors.
The example of the method application
The proposed methodology is approbated by carrying out the measurements on the ship PIRITAengine propeller power. The ship propulsion plants scheme is shown in Figure 3.
3 4
1 2
5 6 7 8
Figure 3. Propulsion plant on board ship PIRITA1, 2 – marks, 3, 4 – optical sensors, 5 – engine, 6 – gearbox, 7 – flexible rubber clutch, 8 – propeller
2 (1) 1 2F0
195 510
Figure 4. Clutch torsional stiffness measurement scheme1, 2 - indicators
For determining propeller’s drive shaft transferred power the marks 1 and 2 were glued at clutchhubs on both sides of the elastic element, because clutch torsional stiffness is approximately 15 times

31
lesser as shaft spinning rigidity between clutch and propeller, but decrease of stiffness increase precisionof metering as sensitiveness of measuring instrument is limited.
Since the clutch catalogues torsional stiffness is defined with an accuracy of ± 20% and it can varyduring operating time , the first, given clutch torsional stiffness c is measured experimentally.The coupling torsional stiffness coefficient of the average value c = 129,6 kN∙m/rad was experimentallyobtained, with a confidence interval of ± Δc = 1,0 kN∙m/rad (relative error δc= 0.0080).
The number of recorded optical sensors pulses was fixed at as slow shaft rotation (138 rpm)and at full shaft rotation speed (541 rpm). Pulse generation frequency f = 10 000± 50 pulses/s (relativeerror δf = 0.005). 100 measurements were recorded at slow rotation, but at the full speed rotation -139 measurements.
It was accepted, that both angular velocities of shaft are constant during metering (roughly 1 minute).Tables 1 and 2 show, that such concession was justified – slow revolutions range from 136 to 139, butfast revolutions range from 539 to 541.
The registered number of pulses for each revolution is given in Table 1 and Table 2.
Table 1. Slow revolutions of the shaft
i2 i1 i∑ i2 i1 i∑ i2 i1 i∑ i2 i1 i∑1288 3100 4388 136 APGRM 1287 3099 4386 136 APGRM 1289 3093 4382 136 APGRM 1288 3097 4385 136 APGRM1294 3094 4388 136 APGRM 1282 3096 4378 137 APGRM 1282 3097 4379 137 APGRM 1284 3093 4377 137 APGRM1284 3106 4390 136 APGRM 1285 3087 4372 137 APGRM 1288 3095 4383 136 APGRM 1283 3099 4382 136 APGRM1288 3088 4376 137 APGRM 1276 3078 4354 137 APGRM 1273 3075 4348 137 APGRM 1282 3085 4367 137 APGRM1272 3099 4371 137 APGRM 1289 3075 4364 137 APGRM 1279 3076 4355 137 APGRM 1283 3089 4372 137 APGRM1279 3091 4370 137 APGRM 1281 3092 4373 137 APGRM 1282 3085 4367 137 APGRM 1280 3095 4375 137 APGRM1281 3097 4378 137 APGRM 1279 3083 4362 137 APGRM 1277 3097 4374 137 APGRM 1284 3078 4362 137 APGRM1269 3089 4358 137 APGRM 1285 3096 4381 136 APGRM 1271 3085 4356 137 APGRM 1285 3099 4384 136 APGRM1272 3065 4337 138 APGRM
1273 3074 4347 138 APGRM 1272 3077 4349 137 APGRM 1270 3056 4326 138 APGRM 1257 3071 4328 138 APGRM1274 3052 4326 138 APGRM 1266 3063 4329 138 APGRM 1279 3073 4352 137 APGRM 1271 3055 4326 138 APGRM1266 3060 4326 138 APGRM 1268 3053 4321 138 APGRM 1266 3071 4337 138 APGRM 1276 3059 4335 138 APGRM1260 3042 4302 139 APGRM 1274 3078 4352 137 APGRM 1274 3051 4325 138 APGRM 1265 3055 4320 138 APGRM1269 3056 4325 138 APGRM 1267 3058 4325 138 APGRM 1267 3066 4333 138 APGRM 1272 3063 4335 138 APGRM1269 3049 4318 138 APGRM 1267 3051 4318 138 APGRM 1274 3074 4348 137 APGRM 1269 3060 4329 138 APGRM1274 3054 4328 138 APGRM 1269 3061 4330 138 APGRM 1263 3047 4310 139 APGRM 1263 3063 4326 138 APGRM1269 3065 4334 138 APGRM 1262 3037 4299 139 APGRM 1266 3068 4334 138 APGRM 1274 3057 4331 138 APGRM1263 3054 4317 138 APGRM
1271 3040 4311 139 APGRM 1265 3061 4326 138 APGRM 1270 3043 4313 139 APGRM 1267 3064 4331 138 APGRM1256 3042 4298 139 APGRM 1270 3052 4322 138 APGRM 1269 3055 4324 138 APGRM 1266 3045 4311 139 APGRM1262 3037 4299 139 APGRM 1265 3052 4317 138 APGRM 1266 3049 4315 139 APGRM 1267 3059 4326 138 APGRM1262 3055 4317 138 APGRM 1266 3048 4314 139 APGRM 1265 3058 4323 138 APGRM 1259 3033 4292 139 APGRM1259 3032 4291 139 APGRM 1269 3052 4321 138 APGRM 1263 3043 4306 139 APGRM 1263 3047 4310 139 APGRM1260 3036 4296 139 APGRM 1267 3039 4306 139 APGRM 1271 3065 4336 138 APGRM 1257 3048 4305 139 APGRM1256 3036 4292 139 APGRM 1262 3045 4307 139 APGRM 1265 3060 4325 138 APGRM 1257 3053 4310 139 APGRM1257 3036 4293 139 APGRM 1264 3051 4315 139 APGRM 1267 3051 4318 138 APGRM 1267 3052 4319 138 APGRM1253 3035 4288 139 APGRM 1266 3043 4309 139 APGRM
The obtained data is being mathematically processing is found:
i∑ = 4337 ± 3 , δi∑ = 0,00069 , j∑ = 1109,6 ± 0,1 , δj∑ = 0,00009 ,
= 0,70685 ± 0,00008 , δ(i1/i∑)= 0,00011, = = 0,71108 ± 0,00006 , δ(j1/j∑)= 0,00009 .Then
φ = 2π – = 2π (0,71108 – 0,70685) = 0,0266 rad ,
Δφ = 2π √ (Δ(j1/j∑ ))2 + (Δ(i1/i∑ ))2 = 2π √ 0,000062 + 0,000082 = 0,00063 ,
δφ = = = 0,024 .Δφφ
i1
i∑
j1
j∑
0,000630,0266
i1
i∑
j1
j∑

32
δk2 = 2 √ (δi∑ )2 +(δj∑ )2 = 2 √ 0,000692 +0,000092 = 0,0014 .Power at full shaft speed rotations
P2 = , = . = 209 kW
δP2 = √ (δc)2 +(δφ)2 +(δf)2 +(δj∑)2 +2(δk2)2 =
= √ 0,00802 + 0,0242 + 0,0052 + 0,000092 +2 ∙ 0,00142 = 0,026 ,
ΔP2 = P2 ∙ δP2 = 209 ∙ 0,026 = 6 kW .
This determinates, that the propeller transferred power at full engine speed is 209 ± 6 kW.
Table 2. Fast revolutions of the shaft
j2 j1 j∑ j2 j1 j∑ j2 j1 j∑ j2 j1 j∑
320 790 1110 540 APGRM 322 789 1111 540 APGRM 320 788 1108 541 APGRM 321 789 1110 540 APGRM319 791 1110 540 APGRM 319 789 1108 541 APGRM 321 789 1110 540 APGRM 321 787 1108 541 APGRM321 789 1110 540 APGRM 320 790 1110 540 APGRM 321 789 1110 540 APGRM 320 790 1110 540 APGRM319 789 1108 541 APGRM 321 789 1110 540 APGRM 322 787 1109 541 APGRM 322 789 1111 540 APGRM321 787 1108 541 APGRM 320 789 1109 541 APGRM 320 789 1109 541 APGRM 319 790 1109 541 APGRM320 790 1110 540 APGRM 321 789 1110 540 APGRM 321 789 1110 540 APGRM 320 789 1109 541 APGRM321 789 1110 540 APGRM 320 789 1109 541 APGRM 320 789 1109 541 APGRM 320 790 1110 540 APGRM321 789 1110 540 APGRM 322 790 1112 539 APGRM 321 789 1110 540 APGRM 323 789 1112 539 APGRM322 789 1111 540 APGRM 321 789 1110 540 APGRM 320 789 1109 541 APGRM 322 790 1112 539 APGRM320 792 1112 539 APGRM 320 791 1111 540 APGRM 320 791 1111 540 APGRM 321 788 1109 541 APGRM322 789 1111 540 APGRM 322 789 1111 540 APGRM 320 790 1110 540 APGRM 321 790 1111 540 APGRM321 790 1111 540 APGRM 321 790 1111 540 APGRM 321 790 1111 540 APGRM 321 788 1109 541 APGRM321 791 1112 539 APGRM 320 790 1110 540 APGRM 320 791 1111 540 APGRM 320 791 1111 540 APGRM321 790 1111 540 APGRM 320 790 1110 540 APGRM 322 789 1111 540 APGRM 320 790 1110 540 APGRM321 788 1109 541 APGRM 320 789 1109 541 APGRM 321 790 1111 540 APGRM 321 789 1110 540 APGRM319 791 1110 540 APGRM 320 789 1109 541 APGRM 322 790 1112 539 APGRM 321 790 1111 540 APGRM322 787 1109 541 APGRM 321 789 1110 540 APGRM 320 789 1109 541 APGRM 320 790 1110 540 APGRM321 790 1111 540 APGRM 319 791 1110 540 APGRM 321 789 1110 540 APGRM 321 790 1111 540 APGRM320 790 1110 540 APGRM 322 790 1112 539 APGRM 319 790 1109 541 APGRM 321 788 1109 541 APGRM321 789 1110 540 APGRM 322 789 1111 540 APGRM 321 790 1111 540 APGRM 322 788 1110 540 APGRM321 789 1110 540 APGRM 320 788 1108 541 APGRM 320 789 1109 541 APGRM 319 790 1109 541 APGRM319 791 1110 540 APGRM 320 788 1108 541 APGRM 323 788 1111 540 APGRM 321 788 1109 541 APGRM322 788 1110 540 APGRM 321 788 1109 541 APGRM 320 791 1111 540 APGRM 320 790 1110 540 APGRM320 790 1110 540 APGRM 320 789 1109 541 APGRM 321 790 1111 540 APGRM 320 789 1109 541 APGRM320 791 1111 540 APGRM 321 790 1111 540 APGRM 320 791 1111 540 APGRM 320 790 1110 540 APGRM322 789 1111 540 APGRM 321 792 1113 539 APGRM 321 790 1111 540 APGRM 321 790 1111 540 APGRM321 790 1111 540 APGRM 319 791 1110 540 APGRM 320 790 1110 540 APGRM 320 790 1110 540 APGRM320 790 1110 540 APGRM 321 791 1112 539 APGRM 321 789 1110 540 APGRM 321 790 1111 540 APGRM322 790 1112 539 APGRM 321 790 1111 540 APGRM 320 790 1110 540 APGRM 320 791 1111 540 APGRM321 791 1112 539 APGRM 322 790 1112 539 APGRM 320 790 1110 540 APGRM 321 790 1111 540 APGRM320 790 1110 540 APGRM 320 792 1112 539 APGRM 319 791 1110 540 APGRM 321 791 1112 539 APGRM320 790 1110 540 APGRM 322 788 1110 540 APGRM 322 790 1112 539 APGRM 321 790 1111 540 APGRM320 790 1110 540 APGRM 322 790 1112 539 APGRM 320 791 1111 540 APGRM 320 792 1112 539 APGRM320 790 1110 540 APGRM 321 791 1112 539 APGRM 321 789 1110 540 APGRM 322 789 1111 540 APGRM323 789 1112 539 APGRM 320 791 1111 540 APGRM 319 791 1110 540 APGRM
The limits of the method applicability
The proposed method of transferred power measuring is targeted to be used only if the relative errorof obtained results is sufficiently small. From formulas (9) error is calculated and it shows that in anycase, the estimated power relative error will be greater than the greatest relative errors in the square
2π ∙ φ ∙ c ∙ f ∙ k 2
j∑ ∙ (k2 – 1)2π ∙ 0,0266 ∙ 129,6 ∙ 10000 ∙ 15,28
1109,6 ∙ (15,28 – 1)

33
root. At sufficiently large number of measurements errors δj∑ and δk2 do not exceed a few tenths of apercentage, δf less than 0.5%.
Torsional stiffness relative error which is experimentally determined does not exceed onepercent. Thus, applicability of the proposed method boundaries are defined onlyby torsion angle detection error δφ.
To reduce the torsion angle calculation error it is target to calculate the torsion angle φ by theformula (1) and the rotational speed ratio k using rather separately calculated average values of i1 , i2 , j1
and j2, but each revolution-calculated average values i∑ and j∑, as well as i1/i∑ and j1/j∑. There byreducing the rotationalspeed fluctuations of any errors. The above mentioned is illustrated on board ship PIRITA obtained datain power measurements , using only separately calculated i1 , i2 , j1 and j2 average values:
i1 = 3066 ± 2 , δi1 = 0,00064 , i2 = 1271 ± 1 , δi2 = 0,0007 ,
j1 = 789,0 ± 0,1 , δj1 = 0,00010 , j2 = 320,6 ± 0,1 , δj2 = 0,0002 ,
ThenΔi∑ = √ (Δi1)
2 + (Δi2)2 = √ 22 + 12 = 2,24 , δi∑ = = = 0,00052
Δj∑ = √ (Δj1)2 + (Δj2)
2 = √ 0,12 + 0,12 = 0,141 , δj∑ = = = 0,00012
δ(i1/i∑) = √ (δi1)2 +(δi∑)2 = √ 0,000642 + 0,000522 = 0,00082
δ(j1/j∑) = √ (δj1)2 +(δj∑)2 = √ 0,000102 + 0,000122 = 0,00016
Δφ = 2π √ (Δ(j1/j∑ ))2 + (Δ(i1/i∑ ))2 = 2π √ 0,000162 + 0,000822 = 0,0052 ,
δφ = = = 0,196 .
δk2 = 2 √ (δi∑ )2 +(δj∑ )2 = 2 √ 0,000522 +0,000122 = 0,00106 .
δP2 = √ (δc)2 +(δφ)2 +(δf)2 +(δj∑)2 +2(δk2)2 =
= √ 0,00802 + 0,1962 + 0,0052 + 0,000122 +2 ∙ 0,001062 = 0,197 ,
ΔP2 = P2 ∙ δP2 = 209 ∙ 0,197 = 41 kW .Example of calculation this error shows that the irrational error calculation on the same output
data, the apparent error increases significantly – about 7 times at the given example.As calculations shows, the resulting accuracy is mainly determined by the torsion angle φ
calculation error. In order to obtain results with acceptable levels of relative error [δφ], thetorsion angle satisfy the inequality
φ > , where φ =
At a sufficiently large number of measurements that are made with the authors used equipment, it isnot difficult to ensure Δφ, which does not exceed 0.1%. So, if [δφ] = 5%,
c < 50 ∙ M ≈ , ( 10 )
where the rotational frequency n is expressed in revolutions per minute.If the marks 1 and 2 (Fig. 1). are glued at cylindrical shaft section with diameter d and length L, then
c = , ( 11 )
where G - shaft material shear modulus,
Jp = – inertial polar moment of the shaft cross-sectional area.
Δφφ
0,005220,0266
Δi∑
i∑
2,244337
Δj∑
j∑
0,1411109,6
Δφ[δφ]
Mc
500 Pn
G Jp
L
π d4
32

34
Shaft spinning provision is ≤ [τ] , ( 12 )
where [τ] - shaft material allowable tangential stress.
When you insert in disparities (10) c expression (11) and from inequalities (12)'s torque Mexpression, after truncation we find
>
Since the steel shaft G ≈ 8 ∙ 104 MPa and [τ] ≈ 40 MPa then we conclude that the distance L betweenthe marks 1 and 2 (Figure 1) must be at least 20 d. If the full strength of the shaft is not used,the distance should be greater between the marks.
Summary
The authors developed and tested propeller shaft transferred power measuring method allows to:• determine propeller shaft transferred power with a sufficient accuracy at various propeller speeds
on pier moored vessel without labour-intensive experiments to;• to determine the confidence interval of the obtained results;• assess compliance propeller with the engine.As the proposed method results are recognized in the Latvian Maritime Administration,
the method opens wide opportunities to be used for performance testing at small vessels. Results of thesetests may be eligible for a variety of relief in operation and the EU quotas.
References
1. Rawson, K.J., Tupper, E.C. Basic Ship Theory. Longman, 1994.2. Cimanskis, J., et. al. Patent of Republic of Latvia Nr.14004. Method of shaft transferred power
measuring Nr.14004, Riga, 2009.3. Cimanskis, J., Kovaljovs, V. Eksperimental metering of transferred power of ship many-stage
propeller shaft. In: Maritime Transport and Infrastructure. Proceedings of the 13th InternationalConference (Riga, Latvia, April 28-29, 2011, Latvian Maritime Academy), 2011, pp. 120 – 124.
4. Cimanskis, J., Kokars, J. Metering of transferred power of ship many-stage propeller shaft.Scientific Proceedings of Riga Technical University. Transport and Engineering, Vol. 34, 2010, pp. 23 –28.
16 Mπ d3
G100 [τ]
Ld

35
THE METHOD OF STARTING AIR SYSTEMROUGH CALCULATION
Rihards IndriksonsLatvian Maritime Academy, 5B Flotes Street, Riga, LV-1016, Latvia,
E-mail: [email protected], phone: +371 67432091Jānis Kokars
Latvian Maritime Academy, 5B Flotes Street, Riga, LV-1016, Latvia,E-mail: [email protected]
Igors KurjanovičsRiga Technical University, 1 Kalku Street, Riga, LV-1658, Latvia,
E-mail: [email protected]
AbstractThe paper deals with diesel compressed air starting system calculation method based on the comparisonbetween the compressed air efficient work and the work consumed by the air compression in the enginecylinder during the compression stroke. Approximate engine starting time duration depending onpressure in starting air receiver correlations were found, as well as compressed air consumption. Theapproximate correlations for calculating pressure drop in receivers depending on the receiver volumeand the volume of air consumption at engine starting were given. The calculation of starting processusing found out correlations was made for six cylinder slow speed engine as an example.Keywords: starting system, efficient work, air receiver.
Introduction
Over the past 20 years, the design of ships main engine has undergone radical changes. The notablechange of cylinder thermodynamic work cycle parameters (air compression pressure and combustionpressure) are observed. An increase of these parameters is associated with the need to increase the relativepower and the cylinder indicated power efficiency.
Significantly increasing the engine stroke to diameter ratio from 1.7 to 2.2 - 2.5 have increasedthermal and mechanical loads.
In the calculation on the basis of LPG tanker's "Kurzeme" [4] main engine MAN B & W 6S50 MC
parameters, it is evident that the ratio cz pp / , or so-called pressure increase ratio (Lambda), at significant
increase in the parameters has been reduced to 1.1 – 1.3 instead of previous 1.4-1.5. The compressed airpressure in cylinder is equal to 9.8-10.0 MPa and the maximum combustion pressure reaches 13.0 MPa.Such changes in construction and parameters are making a significant impact on engine starting andreversing processes. These processes are significant for main engines coupled directly to the ship'spropeller nevertheless they are operated shortly. Although the changes in parameters have been made thepressure in starting air vessel remains the same - maximum 3.0 MPa.
It is necessary to perform calculations to determine the possibility to ensure engine starting and
reversing processes in future due to zp and cp parameters continue to grow.
Starting duration and rotation speed of crankshaft at the end of starting
First, let's look at two-stroke engines, in which the compressed air is supplied to all cylinders duringstarting.
The work made by air during one revolution of crankshaft at starting of engine
W1 = W1*+ W1
** , ( 1 )
where W1* – the work made by compressed air during the air supply
W1** – the work made by compressed air after the air supply suspension [7]

36
W1* = A ∙ pg ∙ s2 ; W1
** =pg ∙ V2 1 – V2
n1 - 1
n1 – 1 V3
where A – the area of cylinder,pg – the pressure of compressed air in the system,s2 – piston displacement from TDC to the point at which compressed air supply suspendedn1 – the polytropic indexV2 – the volume of cylinder when air supply is suspended,V3 – the volume of cylinder when exhaust is commenced
The work consumed during the compression W2 is calculated as follows [7]:
W2 =pa ∙V4 – pc ∙Vc ( 2 )
n1 – 1
wherepa – atmospheric pressure, V4 – the volume of cylinder when exhaust is commenced,pc , Vc – the air pressure and the volume of cylinder at TDC
Assuming that the water resistance force to the rotation is proportional to the propeller's angular velocitysquared [3]
Mprop = k ∙2
and friction losses taken into account the efficiency at engine starting , the efficient work W achievedby engine with z cylinders during one revolution of the crankshaft could be approximately determined asfollows:
W = z( ∙W1 + W2 ) – 2∙ k ∙2 . ( 3 )
According to the theorem of kinetic energy change, crankshaft angular speed of one revolution in theengine at starting to be determined from the relationship:
0,5 Jred ∙ ω2 = W
or, taking in account expression, 0,5 Jred ∙ ω2 = z( ∙W1 + W2 ) – 2∙ k ∙2 ,
where Jred - simplified moment of inertia of the crankshaft with the pistons, connecting rods, flywheels,shaft and propeller.
After N revolutions:0,5 Jred ∙ ω2 = N [ z( ∙W1 + W2 ) – 2∙ k ∙2 ] ,
Whence we find:
N =0,5 Jred ∙ ω2
( 4 )z( ∙W1 + W2 ) – 2∙ k ∙2
Assuming that the crankshaft moves steadily accelerated at engine starting, starting time t determinedfrom the relationship:
t =4 π ∙ N
( 5 )ω
The calculation of work amount in four-stroke engines, in which the compressed air is supplied to allcylinders during starting, is made by equations (1) and (2). The work is done per 2 revolutions of thecrankshaft and whole volume of cylinder is V3 and V4. So the work per revolution is calculated by theformula

37
W = 0,5 z( ∙W1 + W2 ) – 2∙ k ∙2 ( 6 )
and number of the crankshaft revolutions till angular velocity achieve
N =Jred ∙ ω2
( 7 )z( ∙W1 + W2 ) – 4∙ k ∙2
For engines, in which during the starting period the air is supplied only to half of cylinders, z should bereplaced with z/2 in formulas (3), (4), (6) and (7).
The consumption of compressed air and necessary volume of starting air receiver
The consumption of compressed air for one cylinder during one revolution of the crankshaft isslightly less than V2 . So during N revolutions total air consumption is:
Q < N ∙ z∙V2 .
As the compressed air receivers must run at least n times, the total air consumption will be:n
Q∑ = z∙V2 ∙ ∑ Ni , ( 8 )i=1
where Ni – number of revolutions of the crankshaft at i-starting timeBased on the Clapeyron equation, the pressure drop Δpi in starting air receiver at i starting time
calculated as follows:
Δpi = poi – pi = poiQi , ( 9 )
Vrec
where poi , pi – the pressure in starting air receiver at i-starting time beginning and the endQi – the consumption of the air at i-starting time, Vrec – the volume of the starting air receiver.
For four-stroke engines, in which during the starting period the air is supplied only to half of cylinders, zshould be replaced with z/4 in formula (8) and for two-stroke engines z should be replaced by z/2
Example of calculation
By way of example let's look at 12-cylinder two-stroke engine with a nominal power of 9880 kW atthe rotation frequency of 114 RPM. Cylinder diameter of 424 mm, stroke - 1944 mm, crank length toconnecting rod length ratio - 0,5. Crankshaft with piston group, a flywheel, the propeller drive shaft andpropeller simplified moment of inertia is 224000 kg∙m2. Resistance moment of the propeller rotation Mprop
= 5800 ∙2 N∙m .The exhaust commences at the angle of 120 degree of crankshaft rotation φ3 = 120o in relation to
TDC. The exhaust valve closes at the angle of 240 degree of crankshaft rotation φ3 = 240o in relation toTDC. Compressed air pressure at the first starting time is pg = 3.0 MPa. The polytropic index is taken asn1 = 1,35 and mechanical efficiency during engine starting η = 0,8 .
The angular speed of the crankshaft and consumption of air after N number of crankshaftrevolution is calculated. Also the time of revolutions at different interruptions of air supply to cylinderswhich is determined by the angle 2 is calculated. In the case when compressed air is supplied to allcylinders, the result of the calculation is graphically shown in Figure 1. In the case when compressed airis supplied only to half of all cylinders, the result of the calculation is graphically shown in Figure 2.
From the diagrams it is possible to obtain that in the case, when the air is supplied to all cylinders -the lowest consumption of the air at one starting time is then angle φ2 , which is approximately 60o. Butin the case when air is supplied only to half of cylinders angle φ2 is approximately 90o.
The consumption of the air during one starting time and starting time duration at optimal φ2 valueswhen the air pressure in system is reduced are calculated and the results are diagrammatically shown inFigure 3. From this diagram it is obtained that the consumption of the air and duration of the start isslightly increased. The summary of air consumptions and the remaining air pressure in the air receiver

38
depending on the number of starts and different volumes of starting air receivers are calculated byformulas (8) and (9). The results are diagrammatically shown in Figure 4.
0
1
2
3
4
5
6
7
8
9
1 11 21
Figure 1. The angular speed of the crankshaft and consumption of air after N number of crankshaft revolution,when air is supplied to all cylinders
0
1
2
3
4
5
6
7
8
1 11 21
Figure 2. The angular speed of the crankshaft and consumption of air after N number of crankshaft revolution,when air is supplied to half of all cylinders.
0,5 1,0 1,5 2,0 2,5 N (rev)
t – sQ – m3
– rad/s
2= 90o
2= 80o
2= 70o
2= 60o
= n
Q
t
0,5 1,0 1,5 2,0 2,5 N (rev)
t – sQ – m3
– rad/s
2= 40o
2= 50o
2= 60o
2= 70o
= n
Qt
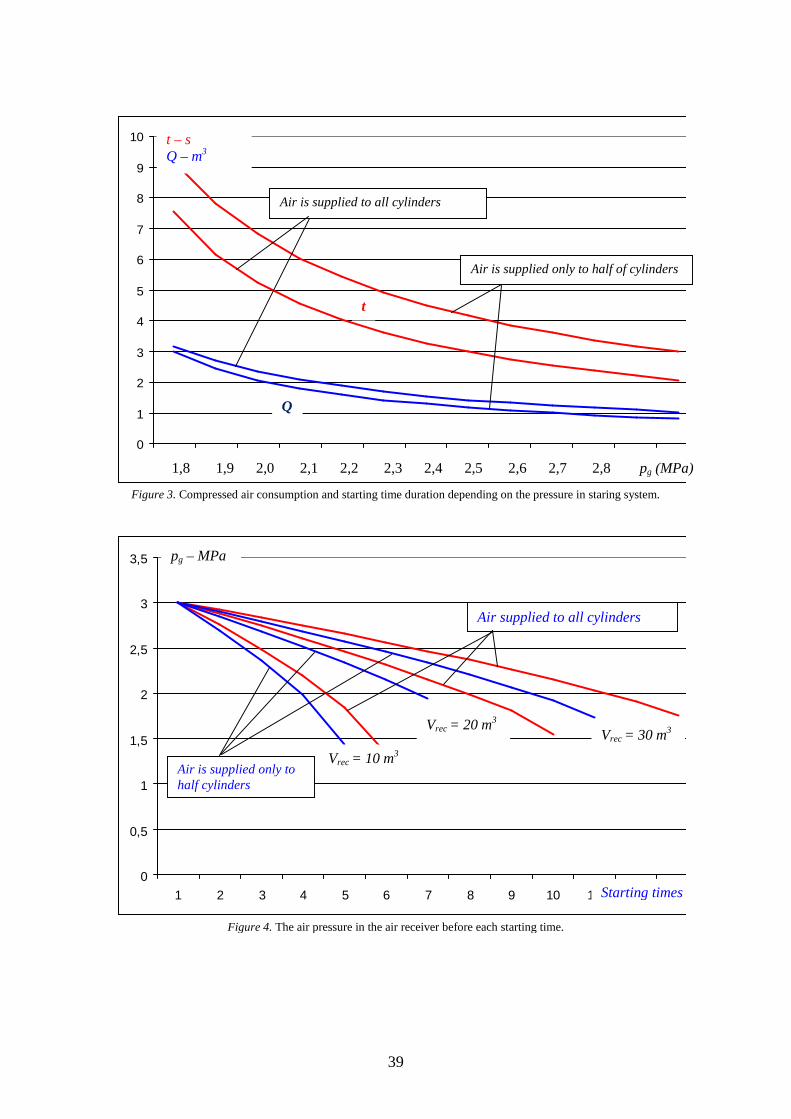
39
0
1
2
3
4
5
6
7
8
9
10
1 2 3 4 5 6 7 8 9 10 11 12 13
Figure 3. Compressed air consumption and starting time duration depending on the pressure in staring system.
0
0,5
1
1,5
2
2,5
3
3,5
1 2 3 4 5 6 7 8 9 10 11 12 13
Figure 4. The air pressure in the air receiver before each starting time.
1,8 1,9 2,0 2,1 2,2 2,3 2,4 2,5 2,6 2,7 2,8 pg (MPa)
t – sQ – m3
Air is supplied to all cylinders
Air is supplied only to half of cylinders
Q
t
Air supplied to all cylinders
Air is supplied only tohalf cylinders
Vrec = 10 m3
Vrec = 20 m3
Vrec = 30 m3
pg – MPa
Starting times

40
Conclusions
The paper offers a simplified calculation method of starting and reversing processes.Knowing the compression pressure in cylinder, air pressure in starting air system and engine
propulsion arrangement's parameters this method allows, without complex calculations, to determine thekey starting and reversing parameters of engine - the engine starting time duration, necessary number ofcrankshaft revolutions and air supply suspension angle, starting air receiver's volume and airconsumption during engine starting.
The method can be useful for marine engineers, also for ship designers for evaluation in designingnew or redesigning existing propulsion systems.
References
1. Bedford, A., Fowler, W. Engineering Mechanics. Statics & Dynamics. Pearson. Prentice Hall,2005.
2. Woodyard, D. Pounder’s Marine Diesel Engines and Gas Turbines. Elsevier, 2004.3. Rawson, K. J., Tupper, E. C. Basic Ship Theory. Longman Scientific&Technical, 1994.4. LPG tanker „Kurzeme” Main engine arrangement.5. Venkatesh, M., Jianhong, Z. Proceedings of the International Conference on Mechanical and
Electronics Engineering - ICMEE 2009 (Chennai, India, 24-26 July 2009), 2010.6. Raja, A. K. Dwivedi, M., Srivastava, A. P. Power Plant Engineering. New Age International,
2006.7. Возницкий, И. В. Судовые двигатели внутреннего сгорания. Санкт-Петербург: Моркнига,
2007.

41
CLUSTER BASED APPROACH AS TOOL FOR INCREASINGCOMPETITIVENESS OF FREEPORT OF RIGA
Edgars KasalisUniversity of Latvia, Riga, Latvia, LV-1050 Riga, 5 Aspazijas blvd.
E-mail: [email protected], phone: 371 67034 673,Ivars Kassalis
University of Latvia, Riga, Latvia, LV-1050 Riga, 5 Aspazijas blvd.E-mail: [email protected], phone: 371 29430 295,
Jānis KasalisLatvian Maritime Academy, Riga, Latvia, LV-1016 Riga, 58 Flotes street.
E-mail: [email protected], phone: 371 29425 545,
AbstractThe cluster-based approach offers a new way of dividing and understanding an economy andcompetitiveness. Cluster environment stimulates competitiveness and competition inside the cluster andthe industry. Some explanation of the current problems of Latvia’s competitiveness deals with the level ofco-operation and business integration of business entities into the national economy of Latvia andFreeport of Riga in particular. Companies are isolated into their approaches to increase theircompetitiveness and enter the global market. In many cases it is too hard a task for a single company.The co-operation and integration of business entities co-operation is a gateway to integrateddevelopment and higher competitiveness in the global markets. Cluster environment is stimulatingintegrated development of all the business entities within the cluster. The main objective of the presentedpaper is to find out the industrial cluster influence on business competitiveness and integrateddevelopment of the Freeport of Riga.Keywords: cluster, competitiveness, co-operation, development, Freeport.
Introduction
Rapid integration with the global economy, sustained growth (8-10% of GDP per annum) in Latviaover years 2004-2007 was not only a good example of successful transition economies, but has alsomade the country more vulnerable to contagion during the economic crisis that is now having dramaticconsequences in Latvia (shrinking of GDP about 25% in 2008-2010 and following growth rate 5.5% in2011). Government, companies and economic experts are trying to analyze mistakes of the past and findthe way out of economic recession and build the fundament for competitive national economy bymanaging conservative fiscal policy and planned joining to euro area in 2014, and it’s sustainabledevelopment in the future.
The term “competitiveness” and “integration” are used more and more in the context of economy’sperformance. These concepts may be discussed on different levels: countries, regions, industries andcompanies. In general country’s level of competitiveness can be measured by Global competitivenessindex - Latvia has only 64th place between 142 other countries in the year 2011-2012. The index issignificantly lower comparing to majority of other European Union countries, including our neighborcountries – Lithuania (44) and Estonia (33) [27]. There are many factors to be analyzed but the one whichindicates integrated development tendency and co-operation is state of cluster development index, whichmeasures how prevalent are well-developed and deep clusters. Unfortunately this is one of the weakestpoints of the country – we are far behind to more advanced countries.
A cluster initiative offers a comprehensive assessment of a cluster’s markets, products, linkages,externalities, and synergies to help identify regulatory and business constraints, find new and widermarket opportunities. Strategic initiatives may vary by different cases, but often focus on improvingmarket information, workforce development, supply chain improvements, common quality standards,branding, integration and process improvements. Cluster initiative around the world show the crucialelement of initiative development is the creation of a platform for meaningful dialogue within the cluster,to develop business strategies, and with the public sector, to discuss policy changes and possibly financialsupport. [10] ”Co-operation” and ”competition” are the key words to describe cluster environment. [18]
The Freeport of Riga is a significant part of global and regional cargo supply chains and passengertraffic network in the Baltic Sea region, providing safe and reliable services. An integral part of the city,

42
the Freeport recognizes its social and environmental responsibilities and makes a strong contribution tothe growth of Latvia’s economy.
Unfortunately, because of the lack of positive historical experience, the level of integration and co-operation among companies in Latvia is underdeveloped and in many cases term “competitor” is similarto “enemy”, which you must weaken and destroy. This is by no means a good environment forcollaboration and development. Companies are isolated in their approaches to enter into new markets andin many cases these approaches could be more successful if proper strategy would be selected. It isparticularly important to take in to account the specific feature of the national economy of Latvia – all thecompanies are small or medium sized according to the global market standards. It is essential for thecompanies to co-operate and integrate to be competitive, increase their export potential and be successfulin the global markets.
The hypothesis of the paper is: Cluster environment in Freeport of Riga may enlarge the level of co-operation between different enterprises and induces integrated development of enterprises in diverseindustries. The aim of the paper is to find out how cluster environment in Freeport of Riga can stimulatecompanies’ integrated development and competitiveness.
There are several tasks to be solved to achieve the aim: to describe the most important aspects of ports’ cluster environment and integration, to identify the linkage among cluster environment, integration and competitiveness, to describe the Freeport of Riga business and institutional situation, to develop cluster approach proposals to increase port’s competitiveness.The methods applied are as follows: monographic method, method of logical analysis and synthesis,
analysis of statistical information, expert method.
Facts and Figures about the Freeport of Riga
An integral part of the city, the Free port of Riga recognizes its social and environmentalresponsibilities and makes a strong contribution to the growth of Latvia’s economy. Due to economiccrises in former years, and according to provisional calculations operation of the Freeport of Rigaprovides approximately 3.5 % from the gross domestic product in 2011. The port is not just a ‘’spender”of tax payers’ money, but it is the major tax payer: the Freeport Authority together with port enterprisespay state taxes in the amount of 350-420 million euro per year. Operation of the port has a multipleinfluence and currently income on average is 14 euro for each reloaded ton of cargo. Share of the Balticcountries biggest ports in 2011 were following: Riga -9.4%, Klaipeda -9.9%, Tallin -9.9%, Ventspils -7.7%, and Liepaja -1.1% from the total sea bound cargo volume 361 million tons of the Baltic see East-North region [28]
Freeport of Riga lies on the both banks of the River Daugava covering 15 kilometres in length, landof the port 1 962 ha, port water area 4 386 ha, total length of berths, maximum permissible vessel draft bythe berth 12.2 meters. The Port is open for navigation all year round. Loading capacity (assessed) at theterminals of the Freeport of Riga accounts for 45 million tons per annum. In 2011 the volume of thetranshipped cargoes has reached 34.07 million tons – it was the highest index during all the 805 years ofRiga port activities. Having transshipped 9.48 million tons of cargos or 25% of the total amount of cargostransshipped in this region in the first quarter of this year, the Port of Riga has with certainty become theleader among ports of the Baltic States. It should be noted that per the amount of handled cargos the Portof Riga is also the third among the fourteen ports on the eastern shore of the Baltic Sea.
Main types of cargo handled at the Freeport are coal, containers, mineral fertilizers, timber, petroland food products. 32 stevedore companies and 35 shipping agents successfully operate at the Freeport ofRiga. The Law on the Freeport of Riga defines general principles of the Freeport of Riga activities and aprocedure of the free zone regime application: fulfilling certain requirements business companies canconclude an agreement on activities under free economic zone regime. Licensed business companies havethe opportunity to apply direct tax relief for the investment in their fixed assets that are used at least fiveyears. [14] Increase of activity of the Port of Riga can be explained with improvement of infrastructureand deepening of ship passes which allows bigger vessels to enter the Port of Riga and notably improvecompetitiveness of the Port of Riga. The number of vessels with capacity above 40 000 GT that haveentered the port approve the fact. This year such vessels form one third part of all ships that have enteredthe port, while last year there were only 3 vessels of such capacity in the accordant period of the last year.928 traders have entered the Freeport of Riga in the first three months of 2012. The number of vessels inthe period of account has increased by 6%, and simultaneously total GT of vessels has also increased by

43
9%. Approximately 81% of all cargos transshipped in the first quarter of 2012 were transit cargos. 8.4million tons were forwarded with vessels from the port, but 1.1 million tons of cargos were received. [29]
Vision of the Freeport of Riga development is to stay as a leading port of the Baltic States and asource of real prosperity for Latvia.
There is a very weak tendency to co-operate between Freeport of Riga and other big ports in Latvia –Ventspils, Liepaja and small ports. Co-operation between different ports in Latvia may increasecompetitiveness in the global market and therefore compete more successfully with other ports in theBaltic Sea Region. Further sustainable development and competitiveness increasing are the key questionsfor Freeport of Riga and requires new methods to reach it. One of them is the cluster based approach.
Cluster based approach – opportunity for port development and competitiveness
Macro-economic tendencies show that Freeport of Riga is located in a region of dynamicallygrowing countries. On the one hand, it opens good perspectives for increase of cargo volume, on the otherhand – high competitiveness and unstable political climate exists in the region. Just like in the rest of theworld, decrease of growth speed can be observed in this region along the economic recession. In thepresent global crisis it is facing a particularly steep decline for a number of reasons and the currentrecession is expected to significantly impact the economy growth also for the coming years. There is avery week tendency to co-operate between the Freeport of Riga and other ports in Latvia – Ventspils,Liepaja and other ports. Co-operation between different ports in Latvia may increase competitiveness inthe global market and therefore compete more successfully with other ports in the Baltic Sea Region.Further sustainable development and competitiveness increasing are the key questions for the Freeport ofRiga and requires new methods to reach it. One of them is the cluster based approach.
The significance of cluster approach is although emphasized by the European Union (EU). Councilof the European Union has set forming of clusters as one of the top priorities to support innovations andcompetitiveness. [10] Latvia has followed EU initiatives and cluster development is included in thenational level economy strategy. The cluster support program was developed involving governmentsupport and EU funds but unfortunately due to budget shortage it was canceled.
Haezendonck is the first scholar who uses the term ‘port cluster’ and draws from cluster theories.She defines a port cluster as ‘the set of interdependent firms engaged in port related activities, locatedwithin the same port region and possibly with similar strategies leading to competitive advantage andcharacterized by a joint competitive position vis-à-vis the environment external to the cluster’. [16]Haezendonck analyzes the performance of a port cluster with an adapted version of Porter’s diamondframework [21]. She identifies 14 factors that influence the competitiveness of seaports, includinginternal competition, internal cooperation, client relationships in the cluster, the presence of related andsupporting industries and the behaviour of (different levels of) the government.
The cluster approach recently has been used to analyze ports. Good example of port cluster casestudy is Antwerp’s port cluster, which is annually reported by Bank of Belgium. In this study, a clusterpopulation of about 1000 firms, including logistics and industrial firms, is identified. The development ofthe value added of this cluster is calculated. Hamburg port cluster management good practise showsanother possibility to solve complicated competitiveness problems in active business area.
The first step to construct a cluster is to identify the economic specialization of the cluster. In thecase of seaports the core specialization is the arrival of goods and ships. All activities related to thearrival of goods and ships are included in the port cluster. The importance of favourable geographicalconditions, such as the presence of a navigable river and deepwater shelters and the structure of theseabed, combined with economies of scale of port facilities, explain the concentration of the arrival ofships and goods in a limited number of ports (instead of a ‘scattered’ distribution of terminals along thecoast). All economic activities that are required to enable the loading and unloading of cargo and shipsare included in the port cluster. These activities include terminal handling, cargo storage, pilot andtowage. The arrival of ships and goods attracts related economic activities and therefore ports may be asdrivers of agglomeration in cities.
Following on from the vision and mission and to increase the competitiveness of Freeport of Rigastatement strategic objectives and strategic initiatives should be defined. The SWOT (Strength,Weaknesses, Opportunities, Threats) Matrix is the outcome from the analysis of Freeport’scompetitiveness in its overall business context, including geographical, regulatory, financial,environmental, reputation and other aspects. Essential competitiveness determinants as location, tariffpolicy, financial management, general management issues, infrastructure development, navigation safety,development of port terminals, part safety and security, environmental protection, port as socially

44
responsible entity, marketing strategy are the main topics for port’s strengths and weaknesses valuation.Opportunities and threats valuation cover the following topics: infrastructure development, navigationsafety, development of port terminals, port safety and security, environment protection, port as sociallyresponsible entity and marketing strategy.
The SWOT Matrix identifies factors, internal and external, which have or may have a positive ornegative impact on the realization of its strategic targets. Internal aspects include advantages andstrengths and weaknesses arising from the port’s internal resources. External aspects cover theopportunities and threats emerging from the outside environment. A successful strategy builds upon athorough SWOT analysis and aims at:
Making use of the strengths to exploit opportunities; Overcoming weaknesses by using the advantages of the opportunities offered; Using the strengths to overcome or avoid the threats; Making efforts to minimize the weaknesses and threats.
In consideration of the vision and mission statement and the SWOT analysis of the Freeport of Rigafor each of previous mentioned areas strategic objectives have been defined and targets have been setagainst which permanent improvement can be monitored.
The port cluster consists of all economic activities related to the arrival of goods and ships. Fivebroad groups of port cluster activities are identified: cargo handling activities, transport activities,logistics activities, manufacturing activities and trading activities. Transport activities are part of a portcluster, since a port is a part in a transport chain. Most cargo is transported further by means of inlandmodes, such as road, rail, and inland waterway. During the last months in Freeport of Riga manycomplicated problems are solved to develop transport chain seaport – airport, by handling cargo ofeconomic and political importance.
All current Latvian transport corridors are included into TEN-T Nordic Axis network and arelocated in the close vicinity of the Central Axis with the nearest largest logistic centre in Moscow, easingfreight transportation between the northern part of Europe to the Central Europe and further on to CentralAsia and Caucasus regions. Motorways of the Sea connect Riga with all TEN-T network ports. Distancesby sea from the biggest ports of the Central Europe – Rotterdam, Antwerp, Hamburg – to the ports of theeastern part of the Baltic Sea coastline are the shortest, providing advantage with regards to transportationcosts and transit time. In terms of distance, routes through Riga are the shortest providing the possibilityof transport cost reduction on rail and road from the Eastern Baltic Sea coast to the biggest cities of theRussian Federation, Belarus, Ukraine and other former Soviet Union countries that are developing asimportant and growing consumer markets. Riga is integrated into the uniform transport network of the EU,making Riga one of the most advantageous and efficient hub ports in regards to freight transhipment inthe Baltic Sea region.
Thus, (branches of) transport firms are located in ports and are so strongly related to the arrival ofgoods and services that they are included in the port cluster. This applies to all firms involved in freighttransport.
Logistics activities, such as storage, re-packing and assembling are included in a port cluster,because goods are stored in ports. This necessity of storage is a reason for locating logistics activities(such as blending and re-packing) in seaports. A second reason is that by locating in a port transport costscan be reduced. Both reasons explain the presence of logistics activities in ports and show that theseactivities are strongly related to the arrival of goods and ships in seaports. Thus, all logistics activities areincluded in the port cluster. Within the frameworks of the Freeport of Riga development program newinfrastructure projects are being implemented that promote performance of business activities. TheFreeport of Riga has a plan to extend borderline of the territory and build new logistic centre.
Specific kind of manufacturing firms are strongly related to the arrival of goods and ships inseaports: those firms get their raw materials from the port and are located in the port in order to reducetransport and logistics costs. A specific set of trading activities could although be included in the portcluster as well. Trading and storage (in a port) are closely linked. Commodity trade is, for somecommodities, still related to storage and cargo handling.
Conclusions
Summarizing the cluster environment influence to the integrated development and competitivenesslevel of the companies, some conclusions can be drawn to understand how collaboration within thecluster may be promoted.

45
1. The cluster environment increases competitiveness of companies within the cluster bystimulating collaboration, interaction, competition, innovation and increasing efficiency. Favorableconditions for the companies’ integrated development are created within the cluster and examples ofcompanies’ horizontal and vertical integration can be found in the cluster models. Integrated co-operationamong leading enterprises, related enterprises and support enterprises, deepening value chains to producemore value added production are the key factors to be competitive in the global markets. The economicpower of the company can increase in the cluster environment.
2. Clusters can create tangible economic benefits: Companies can operate with a higher level of efficiency, drawing on more specialized assets andsuppliers with shorter reaction times than they would be able to in isolation. Companies and research institutions can achieve higher levels of innovation. Close interactionwith customers and other companies create more new ideas and create pressure to innovate while thecluster environment lowers the cost of experimenting. The level of business formation tends to be higher in clusters. Level of trust is increasing withinthe cluster at same time reducing the costs of failure, as entrepreneurs can fall back on localemployment opportunities in the many other companies in the same field.3. Structure, activities and development level of Freeport of Riga are the main evidence for
implementation cluster approach to increase their international competitiveness. The cluster environmentincrease competitiveness of companies within the cluster by stimulating collaboration, interaction,competition, innovation and increasing efficiency. The economic power of the company can increase inthe cluster environment, and it is an evidence for developing cluster in the Freeport of Riga.
4. Successful implementation clusters approach in the Freeport of Riga can create tangibleeconomic benefits: Companies can operate with a higher level of efficiency; Companies in co-operation with research institutions can achieve higher levels of innovation; Level of trust is increasing within the cluster at same time reducing the costs of failure.5. As theoretical conception and good experience in foreign countries show it is useful to
implement clusters’ approach to successfully realize such ambitious development programmes as thoseworked out in the Freeport of Riga. Taking into account the Freeport’s mission and vision of developmentand giving a full appraisal of its existent internal and external problems it is recommended to createthree level clusters in certain time scale: Industrial business cluster inside the Freeport of Riga; Territorial cluster for Riga region, where the Freeport is included as one of the most importantmembers; Transport cluster (national or may be international regional), where Freeport of Riga is includedas member.
References
1. Amin, A., Thrift, N. Neo-Marshallian Nodes in Global Networks. International Journal of Urbanand Regional Research, Vol.16, 1992, pp. 571-587.
2. Asplund, G., Asplund G. An integrated development strategy. Chicheter a.o.: Wiley. X, 1982.3. Athiyaman, A., Parkan, C. A Functionalist Framework for Identifying Business Clusters:
Applications in Far North Queensland. Australian Journal on Management, 2008, pp. 28-32.4. Berg, L. van den. Urban Systems in a Dynamic Society. Aldershot: Gower, 1987.5. Boronenko, V. The Role of Clusters in the Development of Regional Competitiveness. Doctoral
Thesis. Latvia University of Agriculture, 2009.6. Boronenko, V., Vilcina, A. Role of Clusters in Developing the Competitiveness of the Regions
of Latvia. Economic Science for Rural Development, Vol.19, 2009, pp. 236-245.7. Brusco, S. The Emilian Model: Productive Decentralization and Social Integration. Cambridge
Journal of Economics, Vol. 6, 1982, pp. 167-184.8. Burka, A. Ministry of Economics, Entrepreneurship Competitiveness division, Head of
Industrial and Innovation department. Interviewed: 12.10.2009.9. Clusters for Competitiveness. The World Bank. – Washington, 2009.10. Cluster Policy in Europe. Oxford Research. – Norwey, 2008.11. Strategic Priorities for Innovation Action at EU Level. Council of the European Union, 2006.
Available: http://www.consilium.europa.eu/uedocs/cms_Data/docs/pressdata/en/intm/91989 Observed:12.12.2011.

46
12. Dijk, M.P., Sverrison, A. Enterprise Clusters in Developing Countries, Mechanisms ofTransition and Stagnation. Entrepreneurship and Regional Development, Vol.15, 2003, pp. 183-206.
13. Forming of Business Clusters. The Ministry of Economics of Latvia, 2007.14. Freeport of Riga Development Programme 2009-2018, Freeport of Riga Authority, 2009.15. Freeport of Riga; Handbook 2008. Freeport of Riga authority, 2008.16. Haezendonck, E. Essays on Strategy Analysis for Seaports. Leuven: Garant, 2001.17. Innotech: background, goals, results. Innovasjon Norge Ltd. Workshop material, Conference of
Clusters, Riga, Latvia, 2007.18. Kassalis, I. Cluster-Based Approach: a Tool to Enter into the Market. In: Business and
Management. Proceedings of the 6th International Conference (Vilnius, Lithuania, Vilnius GediminasTechnical University), 2010, pp. 635-642.
19. Krugman, P. Geography and Trade. Cambridge, Massachusetts: The MIT Press, 1991.20. Lindquist, A., Berglund, F. Supplier Integration and Communication Strategies in Collaborative
Platform Development. Concurrent Engineering, SAGE, 2008. Available at:http://cer.sagepub.com/cgi/content/abstract/16/1/23. Observed 12.05.2011.21. Porter, M. The Competitive Advantage of Nations. New York: The Free press. 1990.22. Power, D., Lundmark, M. Working through Knowledge Pools: Labor Market Dynamics, the
Transference of Knowledge and Ideas, and Industrial Clusters. Urban Studies Journal, Vol. 41, Issue 5-6,2004, pp. 1025-1044.
23. Rumelt, R.P., Schendel, D. E., Teece, D. Fundamental Issues in Strategy: a Research Agenda.Boston, Massachusetts: Harvard Business School Press, 1994.
24. Saxenian, A.L. Regional Advantage: Culture and Competition in Silicon Valley and Route 128.Cambridge, Massachusetts: Harvard University Press, 1994.
25. Seely, B., Duguid, P. Local Knowledge: Innovation in the Network Age. Management Learning,Vol. 33, Issue 4, 2002, pp. 427-437.
26. The European Cluster Memorandum. Centre of Strategy and Competitiveness, Europe ClusterObservatory, 2007. Available: www.hhs.se. Observed: 12.01.2012.
27. The Global Competitiveness Report 2011-2012. The World Economic Forum. Available at:www.weforum.org/issues/global-competitiveness Observed: 05.01.2012.
28. Unpublished data from Riga Freeport Authority, 2012.29. Up To Baltic States – CIS, Good for Business. The Baltic Course. http://www.baltic-course.com.
Observed: 25.05.2012.

47
MARITIME DELIMITATION OF LATVIAN WATERS, HISTORYAND FUTURE PROSPECTS
Gunārs ŠteinertsLatvian Maritime Academy, 5B Flotes Street, Riga, LV-1016, Latvia,
E-mail: [email protected], phone: +371 67161126
AbstractMaritime delimitation of Latvian waters was one of the important issues since Latvia has gainedindependence from USSR in 1991. The United Nations Law of the Sea convention, 1982 was not yet inforce by that time, nevertheless the basic provisions of this convention have been applied whennegotiating the sea borders with the Estonia and Lithuania. These negotiations resulted in Agreementwith Estonia in 1996 and Agreement with the Lithuania in 1999. The letter Agreement still has beenapplied on preliminary base as not ratified by Latvian Parliament – Saeima. As to Latvian and Swedishwaters delimitation, bilateral agreement of delimitation the Exclusive Economic Zone (EEZ) andContinental Shelf (CSh) is still pending, Tripartite agreement on common point between Estonia, Swedenand Latvia has been signed in 1997. Solution of this uncertain situation of delimitation of Latvian EEZand CSh between Lithuania and Sweden is still an urgent task for Latvia.Keywords: delimitation, equitable solution, equidistance.
Introduction
Delimitation principles for maritime zones have been prescribed by the United Nations Law of theSea convention, 1982 (UNCLOS 1982).This convention now is in force in Latvia and also in ourneighbouring States. In Article 15 of this convention in regard to territorial sea reference is made to the“method of the median line every point of which is equidistant from the nearest points on the baselinesfrom which the breadth of the territorial seas of each of the two States is measured” and „The aboveprovision does not apply, however, where it is necessary by reason of historic title or other specialcircumstances to delimit the territorial seas of the two States in a way which is at variance therewith”.
As to delimitation of the Exclusive Economic Zone (EEZ) between States with opposite or adjacentcoasts the provisions of Article 74 of UNCLOS 82 prescribe:
„1. The delimitation of the exclusive economic zone between States with opposite or adjacent coastsshall be effected by agreement on the basis of international law, as referred to in Article 38 of the Statuteof the International Court of Justice, in order to achieve an equitable solution.
2. If no agreement can be reached within a reasonable period of time, the States concerned shallresort to the procedures provided for in Part XV.
3. Pending agreement as provided for in paragraph 1, the States concerned, in a spirit ofunderstanding and cooperation, shall make every effort to enter into provisional arrangements of apractical nature and, during this transitional period, not to jeopardize or hamper the reaching of the finalagreement. Such arrangements shall be without prejudice to the final delimitation.”
All these UNCLOS 1982 provisions have been applied when negotiating with Estonia andLithuania, partly also with Sweden. When considering term „equitable solution” we may look at theOxfords Dictionary, were „equitable” is – fair, just, reasonable, and “Equity” – fairness, right judgement,principles of justice outside common law or Statute law, used to correct laws when these would applyunfairly in special circumstances. These principles of “justice outside common law” have been applied inmany cases and vast experience gained internationally based on many decisions of International Court ofJustice. [5]
Maritime delimitation with Estonia
Negotiations between delegations of Estonia and Latvia on Maritime delimitation have been startedsince 1991. Most of the difficulties to reach mutually acceptable agreement on delimitation were inconnection with fishery interests. In spring 1995 differences of positions of both countries escalated evenso that navy patrol boats were involved in the control of disputed area. Nevertheless negotiations were notterminated and in 1996 they resulted in „Agreement between the Republic of Estonia and the Republic ofLatvia on the Maritime Delimitation in the Gulf of Riga, the Strait of Irbe and the Baltic Sea, 12 July

48
1996” which soon was ratified by both countries. Details of these negotiations are described in Vol. IV,American Society of International Law, International Maritime Boundaries, 2002. [6] This Agreementconfirmed 15 points of delimitation and from point 15 also a straight geodetic line in the azimuth of289°19.35' up to the boundary of the exclusive economic zone and the continental shelf of the Kingdomof Sweden. [1]
Figure 1. Delimitation map when negotiating Agreement between the Republic of Estonia and the Republic of Latviaon the Maritime Delimitation in the Gulf of Riga, the Strait of Irbe and the Baltic Sea, 12 July 1996. [6]
In April 1997 the Agreement between the Government of the Republic of Estonia, the Governmentof the Republic of Latvia and the Government of the Kingdom of Sweden on the Common Maritimeboundary Point in the Baltic Sea was signed confirming this important common point in position 58°01.440’N, 20°23.775’E. [2]
Figure 2. Delimitation of Latvian waters as published in the Notices to Mariners of Maritime Administration ofLatvia [11]
These two Agreements, of 12 July 1996 (with Estonia) and of April 1997 (on tri-point with Estoniaand Sweden) are giving solid base for good neighbourhood relations with Estonia and also for furtherspatial planning of relevant maritime area. At the same time some specific situation in connection with

49
Latvian national legislation, i.e., the Law “On the State Border of the Republic of Latvia” it should benoted in regard to territorial sea outer limit in the Gulf of Rīga area. This issue is discussed more in detailin part 4 of this paper.
Maritime delimitation with Lithuania
Negotiations between Latvia and Lithuania on maritime delimitation have been commenced sincelate 1993. Drastic differences in proposals of delimitation were noted from both countries from verybeginning of these negotiations. In relation to territorial sea Latvia proposed prolongation of land borderdirection at sea, so applying historical method. That was declined by Lithuanian delegation. Then Latviandelegation gave in and proposed delimitation of territorial sea by equidistance from the relevant coastmethod. That proposal also was declined by Lithuanian side.
As to delimitation of EEZ and Continental Shelf (CSh) very different views have been presented.Latvia proposed application of equidistance method but Lithuania insisted on 270° azimuth (parallel)from last point of land border up to EEZ and CSh of Sweden. Basic obstacle to reach equitable solutionwas economic interests as there are substantial oil fields in disputed area. (Figure 3)
Figure 3. Oil fields on the Lithuanian – Latvian sea border [12]
Negotiations with Lithuanian delegation passed many unsuccessful stages. This situation wasinfluenced also by Latvia concluding and ratifying in Saeima agreement with AMOCO Oil Company inOctober 1995. Licence for this company was extended up to outer end of disputed EEZ/ CSh area.
Some compromise solutions have been reached on later stages of negotiations on delimitation ofterritorial sea, but Lithuanian delegation was obstinate and persisted on parallel method on EEZ/ CShdelimitation.
In 1999 negotiations were activated in response to political pressure from Latvian ruling parties andPresident to conclude maritime delimitation agreement with Lithuania without delay, so demonstratingEuropean Union that Latvia has no border conflicts with neighbouring countries.
In May 1999 in Palanga both delegations signed the “Agreement between the Republic of Latviaand the Republic of Lithuania on the delimitation of the territorial sea, exclusive economic zone andcontinental shelf in the Baltic Sea”. [3] This Agreement on 9th July 1999 was signed also by PrimeMinisters of both countries. Then Latvian–Lithuanian Maritime Delimitation agreement was sent toLatvian Parliament – Saeima for ratification, but passed only 1st reading, while Lithuanian Parliament –Seimas ratified it in October 1999 by almost unanimous vote.
Numerous attempts to resume the ratification process of 1999 Agreement in Latvia further failed.This was also because of Latvian Fishermen Association (LFA) activities, as LFA was strongly against

50
such delimitation and even thretend to initiate blockage of major Latvian ports with their fishing ships incase the ratification law is passed.
Figure 4. Equidistance method (LV) versus 270° azimuth (parallel) (LT) [6]
The 1999 Agreement was used since for practical application for cartography, for search and rescuepurposes and for fishing. This delimitation was unilaterally also confirmed by Lithuanian nationallegislation [14] but not by Latvian national legislation.
Figure 5. Delimitation of maritime waters of Lithuania as according to UN Division for Ocean Affairs and the Lawof the Sea, Law of the Sea Bulletin, No.61 [14]
It is apparent that delimitation of EEZ as in 1999 Latvia – Lithuania Agreement is not complyingnether with the principle of equidistance nor equity. This Agreement was driven by political motives ofthat time rather than following basic provisions of UNCLOS 82, which shall be applied now as thisconvention is ratified by both countries. 1999 Latvia–Lithuania maritime delimitation Agreement is not innational interests of Latvia, therefor need to be denounced and the case submitted for International Courtof Justice (ICJ) hearing. Such proposal of legal expert was recently published in Latvian Journal

51
“JuristaVārds”, where Liene Eglaja, M.Sc., has presented excellent analysis of history of this Agreementand proposal for future actions to rectify the situation. [9]
There are many ICJ Judgments where the three stage method of testing of delimitation is applied.On the first stage the preliminary equidistance line was drawn. Then this delimitation line may beadjusted to take into account the specific circumstances for reaching equitable solution. During the thirdstage the proportionality test may be applied if necessary to confirm the equity of delimitation.
Such method was used in ICJ Judgment for Maritime Delimitation in the Black Sea, Romania v.Ukraine case of 3rd February 2009. On the first stage in this Romania–Ukraine case the preliminaryequidistance line was drawn, then the relevant coast and relevant marine area was examined anddisproportionality test of relevant coast and relevant marine area was made. The final Judgement in factconfirmed the delimitation of the first stage, i.e., based on equidistance method. [8] This ICJ Judgmentresolved which country has the right to exploit oil and natural gas deposits in disputed area, which maytotal about 100 billion cubic meters of natural gas and 100 million metric tons of crude oil.
Figure 6. Map of maritime delimitation in the Black Sea, Romania v. Ukraine case as in the International Courtof Justice judgement of 3rd February 2009. [8]
This ICJ Judgment case is a good example for Latvia and confirming the necessity of more pro-active proposals and not to be afraid of submission Latvia – Lithuania delimitation case for independentjudgment of International body.
Maritime delimitation with Sweden
Sweden was the first of two countries who unilaterally established EEZ / CSh delimitationapplicable to Baltic Sates. This was also in regard to Latvia – Sweden EEZ / CSh delimitation. In 1992Swedish Government adopted the Ordinance on Sweden's Exclusive Economic Zone, 3 December 1992,were in paragraph 6. the Central and Northern Baltic Sea straight lines (loxodromes) between the 17points were confirmed. [13]
The delimitation line in regard to Baltic States apparently has been taken from 1988 USSR–Swedendelimitation Agreement, where the principles of disputed area delimitation was agreed as 75% in favourof Sweden in exchange of fishing quotas 75% in favour of USSR. [4]

52
Should Latvia inherit USSR-Sweden delimitation of EEZ / CSh the opinions are different. Swedennaturally was positive on that opinion; same internationally recognized legal experts (viz. Erik Frankx)also support this delimitation principle. [7]
This is not in line with general rule adopted by Latvian Parliament in 1991 saying that agreementssigned by USSR are not binding for Latvia. There were no maritime delimitation negotiations in early1990 between Sweden and Latvia (at least to the knowledge of author) when theoretically newdelimitation could be negotiated. Now that possibility is lost, especially because in 2005 Latvia submittedto UN Law of the Sea commission very similar delimitation points as in Sweden Government 1992Ordinances. It was confirmed by Latvia submission to UN Law of the Sea Commission that “points A4-A14 are according with the Agreement between the USSR and Sweden, 1988 which is de facto observed”.[10]
Even in case this 2005 submission from Latvia would not be made, the 20 year period for fishingquotas revision as in USSR - Sweden Agreement have expired in 2008 and is not applicable any more asnow all fishing activities are under European Union ruling. All this make delimitation line with Swedenclearly established and leave no chance to new negotiations. At the same time official bi-partialAgreement with Sweden need to be concluded but first the common point with Lithuania and Sweden beestablished.
Maritime Delimitation in the Gulf of Riga
Delimitation in the Gulf of Riga in regard to Estonia is clear since 1996 Agreement was in force.Some small problem rose because some Irbe fairway boys are installed in Estonian waters, but this matterhas been settled. We may notice some problems of compliance of Latvian National legislation withUNCLOS 82 provisions in regard to State border and territorial sea outer limit in Gulf of Rīga area.
Figure 7. Delimitation in the Gulf of Riga according to Notices of Mariners No.1, 2012 [11]
In Latvian Law “On the State Border of the Republic of Latvia”, Section 1 is a provision, that:“9) territorial sea of the Republic of Latvia (hereinafter – territorial sea):a) the waters of the Baltic Sea in width of 12 nautical miles, counting from the base line if it has not
been otherwise specified by international agreements,b) waters of the Gulf of Riga of the Baltic Sea from the base line to the State border which is
determined in accordance with the agreement of 12 July 1996 between the Republic of Latvia and theRepublic of Estonia regarding determination of the sea border in the Gulf of Riga, the Irbe Strait and theBaltic Sea;"
Looking on the map published by the Maritime Administration of Latvia in the Notices of MarinersNo.1, 2012 of the Latvian Hydrographical Service (Figure 7) [11], we may notice the Latvian State border

53
is the delimitation line as agreed with Estonia in 1996 Agreement. Nothing wrong with Latvia- Estoniamaritime border line, but according to UNCLOS 82 Article 3 territorial sea shall not exceed 12 nauticalmiles:”Every State has the right to establish the breadth of its territorial sea up to a limit not exceeding12 nautical miles, measured from baselines determined in accordance with this Convention.”
When examining baseline situation as on the map (Figure 7) in the Gulf of Riga we may notice fourstraight baselines drawn which are not in compliance with Articles 6 and 10 of UNCLOS 82.
These two non-compliances of Latvian legislation (Latvian Law “On the State Border of theRepublic of Latvia”), with UNCLOS 82 may be discussed more in detail, possibly this is deliberatelyadopted for strategic purposes.
Conclusions
1. There are no delimitation problems with Estonia, the 1996 Agreement is serving the purposeproperly.
2. Agreement of 1999 with Lithuania is serving as preliminary, but need to be denounced followingthe procedures of UNCLOS 82.
3. Submission to International Court of Justice or to International Tribunal for the Law of the Seashould be initiated seeking for independent judgement on Latvia-Lithuania maritime delimitation.
4. Maritime delimitation Agreement with Sweden should be negotiated to confirm the de factosituation, but first tri-point to be agreed with Lithuania and Sweden.
References
1. Agreement between the Republic of Estonia and the Republic of Latvia on the MaritimeDelimitation in the Gulf of Riga, the Strait of Irbe and the Baltic Sea, 12 July 1996.http://www.un.org/Depts/los/LEGISLATIONANDTREATIES/PDFFILES/TREATIES/EST - LVA1996MD.PDF
2. Agreement between the Government of the Republic of Estonia, the Government of the Republicof Latvia and the Government of the Kingdom of Sweden on the Common Maritime Boundary Point inthe Baltic Sea, 30 April 1997.http://www.un.org/Depts/los/ LEGISLATIONANDTREATIES/ PDFFILES/ TREATIES/EST-LVA-SWE 1997 MB.PDF
3. Agreement between the Republic of Latvia and the Republic of Lithuania on the delimitation ofthe territorial sea, exclusive economic zone and continental shelf in the Baltic Sea, 09 July 1999.http:// www.saeima.lv/bi8/lasa?dd=LP0036_1
4. Agreement on Principles for the Delimitation of the Sea Areas in the Baltic Sea between theKingdom of Sweden and the Union of Soviet Socialist Republics, 13 January 1988.http://www.un.org/ Depts/los/LEGISLATIONANDTREATIES/PDFFILES/TREATIES/SWE-RUS1988DS.PDF
5. Essays on Developments in International Maritime Boundary Practice, Vol. V. American Societyof International Law, 2005.
6. International Maritime Boundaries, Vol. IV. American Society of International Law, 2002, pp.2995-3013.
7. Franck, E. Maritime Boundaries in the Baltic Sea: Past, Present and Future. IBRU, 1996.8. ICJ Judgment of 3 February 2009 on Maritime Delimitation in the Black Sea (Romania v.
Ukraine) http://www.icj-cij.org/docket/files/132/14985.pdf9. Eglāja, L. Latvijas – Lietuvas jūras robeža: tiesiskais regulējums un nacionālās intereses. Maģistra
darbs. http://doktrina.files.wordpress.com/2011/11/eglaja-latvijas-lietuvas-juras-robeza.pdf10. Lists of geographical coordinates of points are reproduced in Law of the Sea Bulletin No. 76
http:// www.un.org/Depts/los/LEGISLATIONANDTREATIES/PDFFILES/DEPOSIT/lva_mzn54_2005.pdf11. Notices to Mariners, No.1, Latvian Hydrographical Service of Maritime Administration of
Latvia, 2012.12. Oil fields on the Lithuanian – Latvian sea border (Source – Ministry of Economics)13. Swedish Government Ordinance on Sweden's Exclusive Economic Zone, 3 December 1992.
http://www.un.org/Depts/los/LEGISLATIONANDTREATIES/PDFFILES/SWE_1992_Ordinance.pdf14. UN Division for Ocean Affairs and the Law of the Sea. Law of the Sea Bulletin, No. 61, pp.17-
21. http://www.un.org/depts/los/doalos_publications/LOSBulletins/ bulletinpdf/ bulletin61e.pdf

54
REQUIREMENTS FOR THE MANUSCRIPTSSUBMITTED FOR PUBLICATION
IN JOURNAL OF MARITIME TRANSPORT AND ENGINEERING
1. Page Layout (paper size A4 - 21 cm x 29,7 cm) should be as follows: Top – 3 cm, Bottom – 3 cm,Left – 3 cm, Right – 3 cm.
2. Manuscripts should be prepared using Microsoft Word programme (not older than Microsoft Word2000).
3. Minimum length for the article is 6 pages, maximum length - 10 pages.4. No page numbering.5. Text should be typed using font Times New Roman and be single-spaced. New paragraph should be
started with indentation 0,75 cm from the left margin.6. The article should include these sections:
– title;– author’s name(s) and information (organisation, city, country, address, phones, and e-mail
addresses);– abstract (100–150 words);– keywords (max. 5);– introduction – explaining the nature of the problem, goal and tasks of the research, research
object, previous work, contribution of the research, research methods;– description of research;– conclusion section (mandatory!) which should clearly indicate advantages, limitations and
possible applications;– references.
7. The text of the article should be prepared in English (spelling – British English).8. The title of the article – 14 point, UPPERCASE, style Bold and centered.9. Author’s names – centered, type size 12 point, Upper and lower case, style Bold Italic.10. Author’s information – 10 point, Upper and lower case, style Italic, centered.11. Abstract and keywords – 10 point size, style Normal, alignment Justify.12. The first level Headings – 11 point, Upper and lower case, style Bold, alignment Left. Use one line
space before the first level Heading and one line space after the first level Heading.13. The second and third level Headings – 10 point, Upper and lower case, style Bold, alignment Left.
Use one line space before the second level Heading and one line space after the second level Heading.14. Text of the article – 10 point, single-spaced, alignment Justify.15. The set of formulas on application of fonts, signs and a way of design should be uniform throughout
the text. The set of formulas is carried out with use of editors of formulas MS Equation 3.0 orMathType.
16. The formula with a number – the formula itself should be located on the left edge of the text, but anumber – on the right.
17. Font sizes for equations are: 11pt – full, 7pt – subscripts/superscripts, 5pt – sub-subscripts/superscripts, 16pt – symbols, 11pt – subsymbols.
18. All Figures – must be centered. Figure number and caption appear below the Figure, type size 9 point.
Figure 1. This is an example19. Diagrams, Figures and Photographs – must be of high quality, в in format *.TIFF, *.JPG, *.BMP
with resolution not less than 300 dpi. Also formats *.CDR, *.PSD are possible. Combination ofFigures in format, for instance, *.TIFF with elements of the in-built Figure Editor in MS Word isprohibited.
20. Table Number and Title are above the Table. Alignment Left. Type size 9 point. Use one line spacebefore the Table Title, one line space after the Table Title and one line space after the Table.
21. References in the text should be indicated by a number in square brackets, e.g. [1]. Numbered list ofreferences and quoted literature is presented at the end of the article in the alphabetic order. Thecorrect format for references is the following:
21.1. Articles:Panagoulia, D., Dimou, G. Sensitivity of flood events to global climate change. Journal of Hydrology,Vol. 191, Issue 1, 1997, pp. 208-222.

55
21.2. Books:Stoford, M. Maritime economics. New York: Routledge, 1997.
21.3. Conference proceedings:Andrejeva, D. The air pollution prevention from ships. In: Maritime Transport and Infrastructure.Proceedings of the 12th International Conference (Riga, Latvia, April 29-30, 2010, Latvian MaritimeAcademy), 2010, pp. 84-86.
22. If the number of authors of an article, a book or a paper published in the conference proceedingsexceeds three, the first author is indicated and followed by «et. al.» For example, the format forarticle is the following:
Wang, J., et. al. Safety based design and maintenance optimisation of large marine engineeringsystems. Applied Ocean Research, Vol. 18, Issue 1, 1996, pp. 13-27.
23. All papers will be reviewed by two reviewers. All authors have to provide one review from their owncountry (signed, scanned and sent by e-mail in pdf format) along with the paper. The other reviewerwill be provided by the Journal Editorial Board. Once referee evaluation forms have been returnedwe will contact you with regards to the position of your paper. In some cases the referees will suggestamendments which the author will be asked to attend to before the paper is suitable for publication.
24. Articles poorly prepared or incorrectly formatted may not be published in the Journal.