Journal of Low Temperature Physics, Vol. 110, Nos, 1/2, 1998temina/ekarmon/pubs/lowtemp.pdf ·...
14
Journal of Low Temperature Physics, Vol. 110, Nos, 1/2, 1998 Sectroscopic Studies of p-H2 to above 200 GPa Russell J. Hemley, Alexander F. Goncharov, Ho-kwang Mao, Eran Karmon*, and Jon H. Eggert# Geophysical Laboratory and Center for High Pressure Research, Carnegie Institution of Washington, 5251 Broad Branch Road NW, Washington, DC 20015 USA *Pomona College, Claremont, CA 91711 USA #Department of Physics, Colorado School of Mines, Golden, CO 80401 USA Raman and infrared vibrational spectra of H2 have been measured to pressures in excess of 200 GPa and at liquid helium temperatures using new high sensitivity techniques. Detailed study of the pressure dependence of o- p conversion rate reveals an initial increase followed by a decrease above 1 GPa. The conversion rate then increases dramatically with pressure, and this continues to above 50 GPa. New sets of vibron, phonon, roton, and libron excitations in converted para samples are documented as a function of pressure through phases I, II, and III. The results provide important information on the crystal structures, molecular orientational state, and vibrational dynamics of the high-pressure phases. PACS numbers: 62.60.+p, 64.70.Kb, 78.30.-j 1. INTRODUCTION As a result of advances in diamond-anvil cell techniques, the solid hydrogens have now been investigated to pressures of ~300 GPa (3 Mbars) and over a range of temperatures.1 The solids exhibit numerous phenomena over the large range of compression reached with these pressures, corresponding to a > 12-fold increase in density relative to the zero-pressure solid. Three solid phases (I, II, and III) are observed over this pressure range (Fig. 1),1 but the molecular state persists at all pressures.2 Vibrational spectra have been crucial for characterizing hydrogen in these highly compressed states. The vibrational excitations in the solid consist of 75 0022-2291/98/0100-0075$15.00/0 © 1998 Plenum Publishing Corporation
Transcript of Journal of Low Temperature Physics, Vol. 110, Nos, 1/2, 1998temina/ekarmon/pubs/lowtemp.pdf ·...

Journal of Low Temperature Physics, Vol. 110, Nos, 1/2, 1998
Sectroscopic Studies of p-H2 to above 200 GPa
Russell J. Hemley, Alexander F. Goncharov, Ho-kwang Mao,Eran Karmon*, and Jon H. Eggert#
Geophysical Laboratory and Center for High Pressure Research,Carnegie Institution of Washington, 5251 Broad Branch Road NW,
Washington, DC 20015 USA* Pomona College, Claremont, CA 91711 USA
#Department of Physics, Colorado School of Mines, Golden, CO 80401 USA
Raman and infrared vibrational spectra of H2 have been measured topressures in excess of 200 GPa and at liquid helium temperatures using newhigh sensitivity techniques. Detailed study of the pressure dependence of o-p conversion rate reveals an initial increase followed by a decrease above 1GPa. The conversion rate then increases dramatically with pressure, andthis continues to above 50 GPa. New sets of vibron, phonon, roton, andlibron excitations in converted para samples are documented as a function ofpressure through phases I, II, and III. The results provide importantinformation on the crystal structures, molecular orientational state, andvibrational dynamics of the high-pressure phases.
PACS numbers: 62.60.+p, 64.70.Kb, 78.30.-j
1. INTRODUCTION
As a result of advances in diamond-anvil cell techniques, the solidhydrogens have now been investigated to pressures of ~300 GPa (3 Mbars)and over a range of temperatures.1 The solids exhibit numerous phenomenaover the large range of compression reached with these pressures,corresponding to a > 12-fold increase in density relative to the zero-pressuresolid. Three solid phases (I, II, and III) are observed over this pressurerange (Fig. 1),1 but the molecular state persists at all pressures.2Vibrational spectra have been crucial for characterizing hydrogen in thesehighly compressed states. The vibrational excitations in the solid consist of
75
0022-2291/98/0100-0075$15.00/0 © 1998 Plenum Publishing Corporation

R. J. Hemley et al.
Fig. 1. Schematic high-pressure phase diagram of H2.
vibrons, rotons, and phonons (Fig. 2). Under pressure, the Raman vibronsform a multiplet of Qi(J) bands (Av =1; AJ=0), the rotons [S0(J), A7=2] aresplit into a triplet, and a single phonon [Q 1 (J ) ; Av=l, 7=0)] is observed; allare characteristic of the hexagonal-close-packed (hep) structure, consistentwith x-ray diffraction measurements carried out for phase I to 120 GPa.3This phase is stable for the 7=0 solids and for ortho-para (o-p) mixtures athigh temperatures (e.g., near the melting line). The solid consisting of J=0molecules (p-Ha) transforms to an ordered (broken symmetry phase, BSP,or phase II) near 110 GPa,4 but spectroscopic data are very limited. Thiscontrasts with detailed measurements for phase II of o-p D2 mixed crystals,which can be described as having an orientational superstructure.5 Anothertransformation is observed near 150 GPa (phase III). It is characterized bya 100 cm1 vibron discontinuity (both IR and Raman) and an increase byseveral orders of magnitude of the IR vibron oscillator strength.6 The latteris interpreted as arising from symmetry-breaking charge transfer andorientational ordering.7 In view of its unusual properties, phase III hasbeen the subject of continued theoretical study (e.g., Ref. 8).
Fig.2. Principal vibrational excitations of solid H2 (hep phase).
76
Many aspects of these high-pressure phases are still poorly understood,however, particularly at the lowest temperatures (i.e., all molecules initiallyin the J=0 state: pure p-H 2 and o-D2). The phase diagram has not beenstudied for p-H2 and o-H2, and the crystal structures of phases II and III arenot known, and this is crucial for understanding electronic changespredicted at the highest pressures. Spectroscopic data provide informationon the crystal symmetry from the distribution of Raman- and IR-activevibrational modes as well as their intensities. Moreover, this requiresdetermination of effects of disorder due to temperature or o-p state. Suchstudy also requires understanding the o-p distribution at high pressure,including the pressure dependence of the rate of conversion, which has notbeen studied in detail above 1 GPa. Here we describe several recentSpectroscopic studies of p -H 2 to above 200 GPa and at liquid heliumtemperatures using both Raman scattering and infrared absorption. With theenhanced sensitivity made possible by new techniques, we documentpreviously unobserved vibron, phonon, roton, and libron excitations inpure p-H2 as a function of pressure through all three phases (I, II, and III).The results place important new constraints on the crystal structures andorientational state of the molecules in these phases. Furthermore, detailedstudy of the pressure dependence of o-p conversion in H2 has revealedunexpected changes in the rate with pressure that imply new o-p conversionmechanisms at high pressure.
2 . E E R I M E N T A L
The principal aspects of the experimental technique have been describedpreviously.9-11 High-purity n-H2 was loaded at room temperature inmodified Mao-Bell diamond-anvil cells. In one set of measurements, weused ultrahigh purity synthetic type IIa diamonds. Samples werepressurized at room temperature to various pressures (<1 GPa to tens ofGPa depending on the pressure range under study). They were then cooledfirst to 100-120 K, and then to 10-16 K where spectra measured at constanttemperature and pressure as a function of time. Raman spectra were excitedby various lines of Ar- and Kr-ion lasers and recorded by a single HR-460ISA spectrometer with notch filters and Dilor XY triple spectrometer, bothequipped with CCD detectors. Low-temperature measurements wereperformed in liquid He continuous flow cryostats with ZnSe (synchrotronexperiments, type IIa diamond) and quartz infrasil windows (halogen lampsource for IR measurements, synthetic diamond anvils). Pressure wasdetermined either from the ruby R\ fluorescence band using Ar-ion (to 180GPa) or Ti-sapphire lasers (>180 GPa) or from previously calibratedfrequency of the Raman vibron and/or the vibron-phonon excitation qQR(J).1
Spectroscopic Studies of p-H2 to above 200 GPa 77

In the detailed study of the o-p conversion rate, the samples were cooleddown rapidly (in 7-10 minutes from 100 K to 10 K). Once the sampletemperature was below 20 K, Raman spectra were measured at 2 to 5minute intervals for 3 to 24 hours, depending on the conversion rate.Temperature was held constant at 6-19 K during conversion. The o-pconcentration was monitored from the intensities of the Raman-active S0(0)and S0(l) bands with time. In the higher pressure studies of the conversionrate, Q1(J)+S0(1)RHEEEEEEEHEEEEEE EEEEEEEEEEEEEEEEEEEEEEEEE Synchrotron IR spectra were measured in the spectral range of 700-11500cm-1, whereas the 3300-9000 cm-1 range was recorded with a conventionallight source.
3. RSULTS
3.1 Ortho-Para Conversion Rate
A detailed knowledge of the o-p state of the solid at high pressures iscrucial for understanding phenomena at megabar pressures. The molecularwavefunction for any isolated homonuclear diatomic molecule must besymmetric or antisymmetric under atom exchange. The equilibrium orthoconcentration of hydrogen drops from 75% at room temperature toessentially 0% below 20 K. At low temperatures, only the J = 0 and J = 1states are occupied. Since the rotational states of solid hydrogen at lowdensities are only slightly perturbed from the gaseous state, vrot can still beaccurately described as spherical harmonics, and o-p conversion is veryslow ~2%/hr so that it takes weeks for a solid sample to equilibrate.12-13
While a J= ± 1, ±3 ... transition is forbidden for an isolated molecule, inthe condensed phases ortho molecules with at least one ortho nearestneighbor can flip spin and become para molecules. During o-p conversionat zero (or very low) pressure, the conversion energy (E = 171 K permolecule) is transferred to lattice vibrations and is carried away by thecreation one or two phonons.
We determined the ortho concentration from the integrated intensities ofthe rotational Raman peaks,
78 R. J. Hemley et al.
where I0 and I1 are the integrated intensities of the S0(0) (J = 2 < 0) andthe S0(l) (J = 3 < 1) transitions, respectively. At higher pressures, thedetermination of c\ becomes less certain because the J = 2 < 0 and J = 3 <1 Raman peaks broaden, and begin to overlap making it difficult to assignunambiguous values for the integrated intensities I0 and I1, and the Raman-
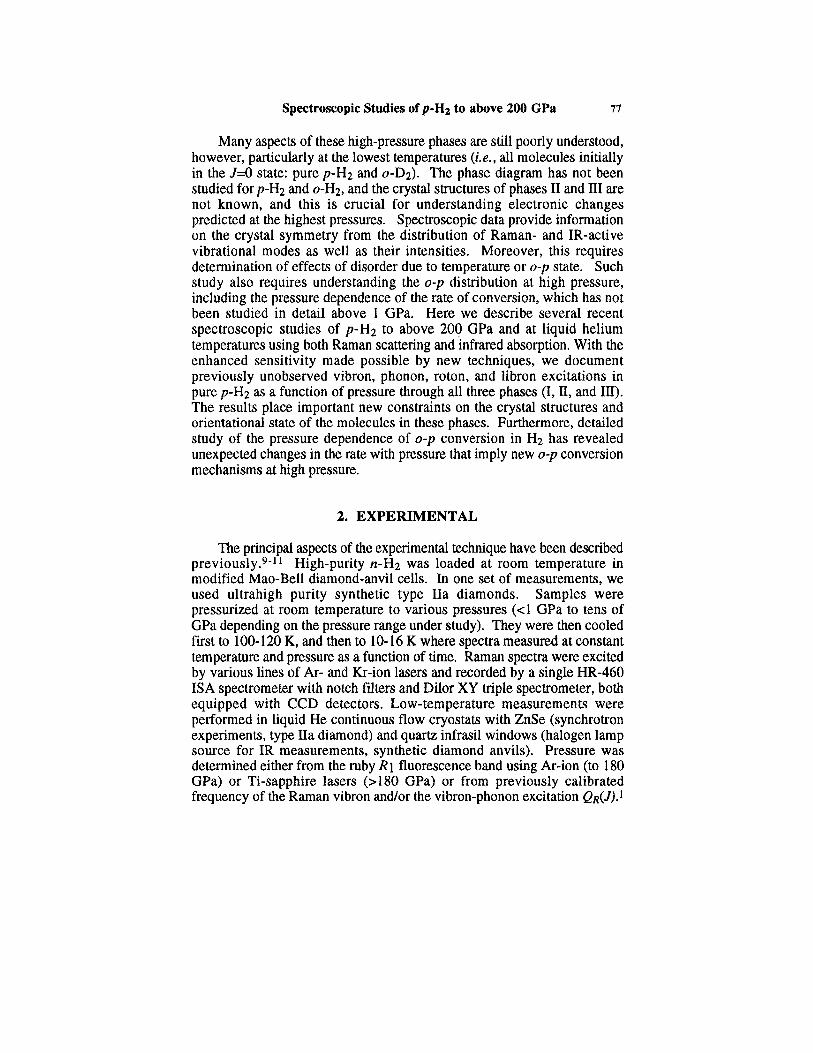
active phonon overlaps the J = 3 < 1 rotational peak. Representative resultsare shown in Fig. 3.
Fig. 3. Representative time dependence of the rotational Rman spectra todetermine the rate of o-p conversion.
Conversion requires a gradient in magnetic field over moleculardistances. In pure hydrogen this can only be supplied by a nearest neighborortho molecule so that the rate equation is proportional to the averagenumber of nearest ortho neighbors M,
The second-order rate equation is only valid for the case of rapid moleculardiffusion. In the absence of diffusion, the average number of ortho nearestneighbors will fall below the random value, i.e., M=12c1. A more involvedmean-field theory for the case of no diffusion has been given.14
We find an initial increase in K (Fig. 4), followed by a decrease above0.8 GPa, consistent with the results of previous workers.15 We achievedgood fits to our data for all pressures using a Monte Carlo method.16 Kcontinues to decrease with increasing pressure until it reaches a minimum atabout 3 GPa at which point it increases rapidly, reaching about 260 %/hr by
Spectroscopic Studies of p-H2 to above 200 GPa 79
If the ortho distribution is random, then M=12c1 and the rate equation issecond order in c\.
The solution to this equation is

R.J. Hemley et al..
Fig. 4. Pressure dependence of the conversion rate, including previous(low-pressure) data from Ref. 15.
58 GPa. There is good agreement with theory up to about 4 GPa (p/po =2.5) assuming one- and two-phonon processes,16 but new mechanismcome into play above 5 GPa (p/po = 3), perhaps involving rotationalexcitations.
We also obtained information on the rate of conversion at higherpressures. Both the IR spectra of the pure vibron and the zero-phononrotation-vibration bands as well as the Raman rotons were measured withtime. The conversion can be easily deduced from the intensities of the 4870cm-1 Q1(J)+S0(0) and 5100 cm-1 Q1(J)+S0(1) bands. Complete (or almostcomplete) conversion was also observed at 76 GPa, whereas a samplecooled at 112 GPa pressure did not convert completely even after anextended time (>100 hours) at 11-20 K. In the pure para state in phase I,the S0(0) transition is split by a crystal field into three levels.3 The S1(0)and the Q 1 ( J ) + S 0 ( 1 ) bands also disappear when the pure para state isreached, and all other spectral features remain unchanged with time. Wefind that the Raman vibron increases its frequency by some 10 cm-1 as thepure para state is reached. With the disappearance of the S0(0) transition toform pure p-H2, a new high-frequency Raman band appears together withnarrow IR bands. We now compare representative spectra of p-H2 inphases I, II, and III.
80

3.2 Rotons and Librons
Rotons are characteristic of the molecular quantum crystal and provideinformation on the extent of intermolecular and crystal field interactions. Inaddition to the splitting of the triply degenerate levels of the S0(0) band, theinitially narrow roton band (20 cm-1; Ref. 17) considerably broadens underpressure up to the transition to phase II such that the mJ triplet is barelyresolved.4,11 This is in part due to softening of the lower frequencycomponents, as predicted theoretically.18,19
Substantial changes in the low-frequency Raman spectra are observedat the transition to phase II at 110-120 GPa.11 The broadening and apparentdisappearance of rotational Raman bands was previously interpreted as thesignature of the transition.4 We find that although the main S0(0) Ramanmultiplet at 350 cm-1 broadens considerably, it does not disappear buttransforms into a doublet (Fig. 5) with both components having positivefrequency shifts with pressure. Moreover, two additional bands appear atlower frequencies. We attribute these modes to librons (lattice phononsderived from restricted rotational motion). Changes in relative intensitiesare observed at 140 GPa; these may result from changes in orientationalordering (directions of librational motion20) or an additional weak phasetransitin.
Fig. 5. Low-frequency Raman spectra of p-H2 in phases I, II, and III.
Spectroscopic Studies of p-H2 to above 200 GPa 81

In phase III, we observe a completely different manifold of low-frequency excitations (Fig. 5). Increasing pressure within the phase leadsto sharpening of the peaks and a substantial frequency shift to higherenergies.11 Up to 10 libron modes are observed, extending by a factor oftwo the number measured previously by IR in combination with the vibronfor samples starting out as o-p mixtures at 80 K.7 The spectral positions ofthe newly observed Raman modes are in good agreement with thosededuced from the IR. This confirms that the IR combination bands originatemainly from zone-center IR-active vibron and Raman-active librons. Thefrequency increase and dramatic sharpening of the bands points toward anincrease in static (classical) ordering;7 i.e., the system becomes moreharmonic and the excited states longer lived.
3. Phonons
The activity of the optical phonons at higher frequency (moleculartranslational modes) are characteristic of the crystal structure. The Raman-active phonons are also identified in Fig. 5. The phonon characteristic ofthe hcp structure is observed over the entire range of stability of phase I, asin previous work on o-p mixed crystals.21 We find that the intensity of thephonon mode near 900-1000 cm-1 becomes extremely weak in phase II forpressures higher than 115 GPa. On the other hand, the Raman-activephonon mode becomes strong in phase III, and it appears to split into adoublet.
Information on the phonon modes are available from IR measurementsof the high-frequency combination excitations involving the vibron. Thehighest frequency IR combination band near 6150 cm-1 is a combination ofthe IR vibron and the highest frequency optical phonon, corresponding tointermolecular vibrations of molecules along the c-axis.22,23 The pressuredependence of the bands in all three phases are continuous in the spectra ofthe o-p mixed crystal through phase II (where bands are observed). Thisarises because structures are all derived from close-packed types and assuch are expected to have similar lattice mode frequencies.
3.4 Vibrons
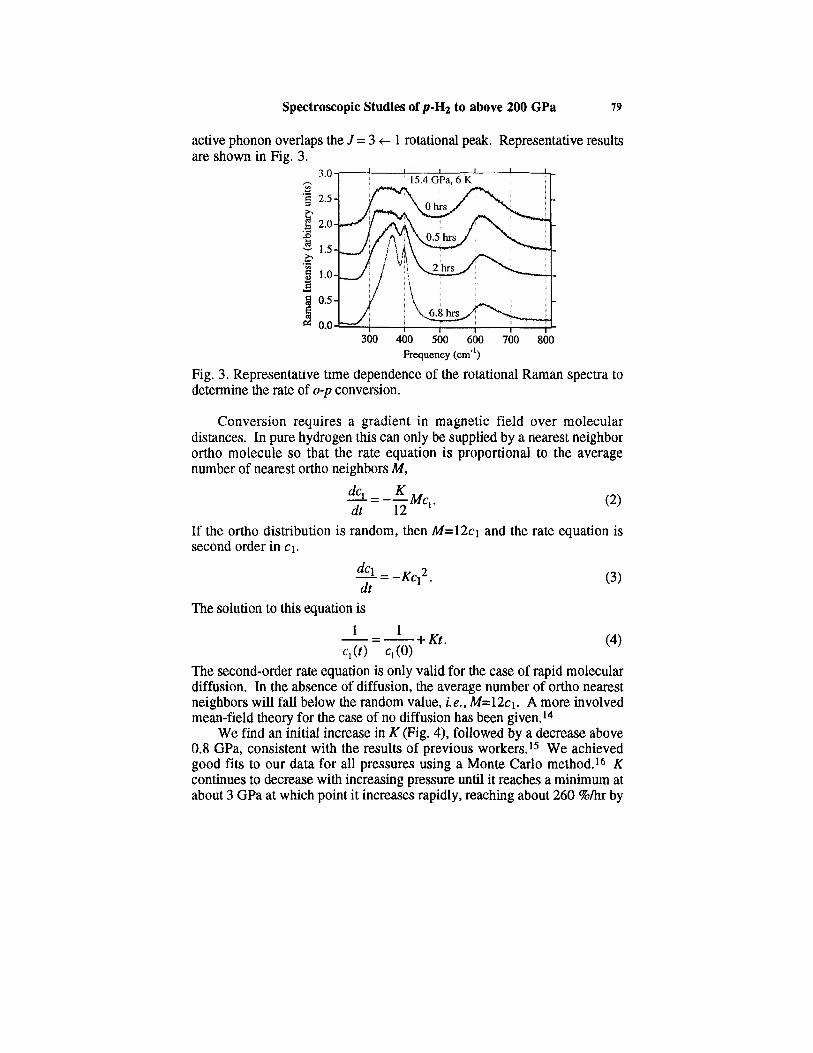
Raman vibron spectrum of solid hydrogen is characterized by a singlestrong band, and this was the first excitation to be measured in the solid atvery high pressures (>10 GPa) in p-H2 and o-p mixed crystals. Ramanvibron spectra for p-H2 are shown in Fig. 6. The enhanced sensitivity ofthe present techniques permit new vibrons to be observed. For p-H2 phase
82 R. J. Hemley et al.
I, we observe a second feature at higher frequency (e.g., 4670 cm-1 at 97GPa). The band is assigned to the S1(0) vibration-rotation transition,previously observed only in the zero-pressure solid.17,24 These bandsbecome distinct and narrow only for substantially high para concentrationsat ambient pressure.24 At the transition to phase II, the spectrum changeswith the appearance of vibron at lower frequency (e.g., near 4520 cm-1 at112 GPa). Assignment of the new peak to an S1(0) transition in phase IIwould require a large anharmonicity; hence we ascribe the band to a newvibron. A broad, higher frequency feature is also observed which isassigned to second-order (e.g., multiphonon excitations). The two sharpvibrons now evident in the Raman spectrum of phase II are assigned tofundamentals. In addition, the possibility of a second high-frequencyRaman vibron in phase III. In view of the loss of a J-like manifold oflowfrequency modes in phases II and III, J appears not to be a validfrequency modes in phases II and III, J appears not to be a valid quantumnumber in these phases, we designate the bands simply as v1 and v2.
The IR spectra in the region of the vibrons is shown in Fig. 7. Phase Iis characterized by a broad band corresponding to the multiple excitation ofthe vibron and rotons (k =0) as well as sharper S1(0) transitions.11,24
pon passage to phase II, the features observed in the principal band inE
Fig. 6. Raman vibron spectra of p-H2 in phases I, II, and III.
Spectroscopic Studies of p-H2 to above 200 GPa S3
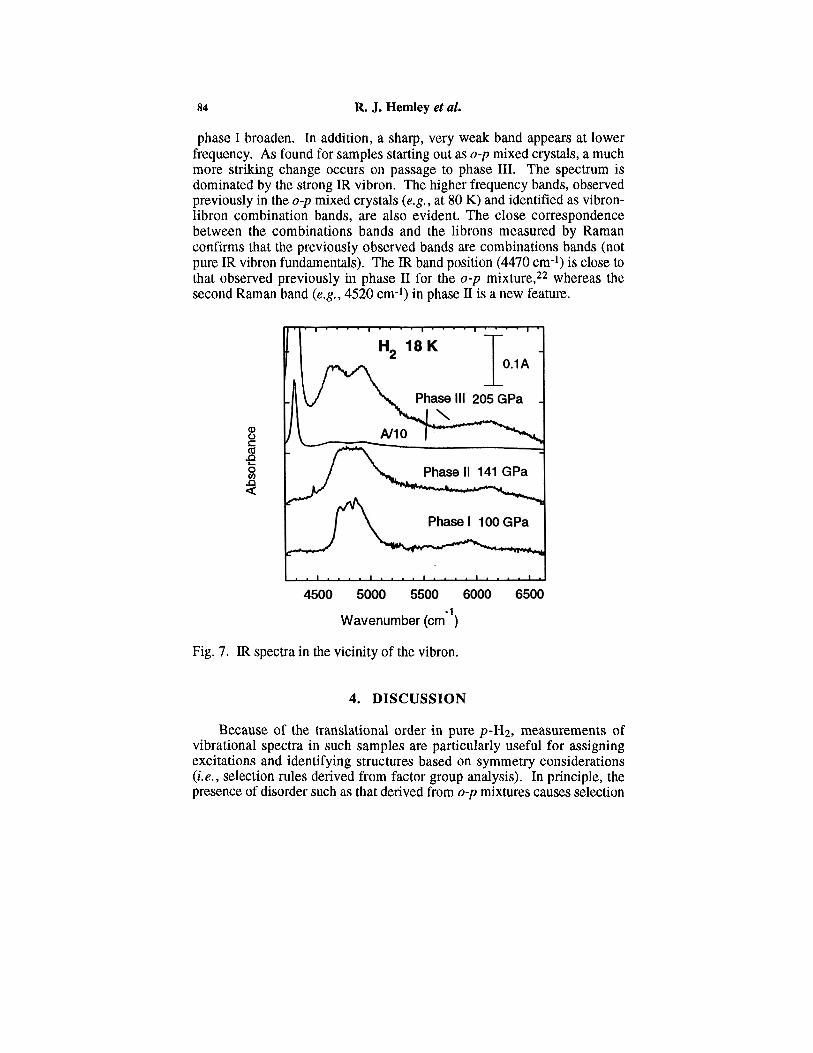
phase I broaden. In addition, a sharp, very weak band appears at lowerfrequency. As found for samples starting out as o-p mixed crystals, a muchmore striking change occurs on passage to phase III. The spectrum isdominated by the strong IR vibron. The higher frequency bands, observedpreviously in the o-p mixed crystals (e.g., at 80 K) and identified as vibron-libron combination bands, are also evident. The close correspondencebetween the combinations bands and the librons measured by Ramanconfirms that the previously observed bands are combinations bands (notpure IR vibron fundamentals). The IR band position (4470 cm-1) is close tothat observed previously in phase II for the o-p mixture,22 whereas thescond Raman band (e.g., 4520 cm-1) in phase II is a new feature.
Fig. 7. IR spectra in the vicinity of the vibron.
4. DISCUSSION
Because of the translational order in pure p-H2, measurements ofvibrational spectra in such samples are particularly useful for assigningexcitations and identifying structures based on symmetry considerations(i.e., selection rules derived from factor group analysis). In principle, thepresence of disorder such as that derived from o-p mixtures causes selection
84 R. J. Hemley et al.

res to be relaxed, giving rise to Raman excitations that reflect features ininthe vibrational density of states as well as those bands dictated by selectionrules for the perfect crystal. Thus, the measurements on p-H2 presentedhere provide new constraints on possible crystal structures for the high-pressure phases (II and III).
Our results indicate that the crystal structure of phase II (BSP) hasRaman allowed low-frequency excitations, but no Raman-activeintermolecular optical translational modes (phonons). The presence ofadditional vibron peaks (sidebands) and lower frequency librons suggestsan increase in the number of molecules in the primitive cell of the BSPphase by at least a factor of two compared to phase I. The absence of theRaman-active phonon as well as the disappearance of the IR active S1(0)excitations in phase II indicate a possible change from an hcp- to fee-basedstructure (with respect to molecular centers). Although the Pa3 structure25
would not seem to be a viable candidate because of the observation of IR-active vibrons,26 it is possible that such weak IR features could arise fromresidual disorder or stress and needs to be examined further. Thepossibility of an fee-based structure suggests a structural difference of phaseII for o-p mixed crystals versus pure p-H2. On the other hand, theexistence of a high-pressure stability field for Pa3 was suggested in aprevious study of o-p mixed crystals of D2, where a decrease in theintensity of the Raman phonon was found at the transition to phase IIbeginning at 65 GPa and 80 K.27 A later study of the transition at lowertemperatures in o-p mixtures showed the presence of multiple Ramanvibrons; the spectral activity of most of the bands could be ascribed to zone-folding to a lower symmetry structure based on hcp;5 it is of interest toexamine the extent to which the bands can fit a zone-folding scheme basedon the fcc structure. If the structure is fee-based, the bands could arise fromthe breakdown of selection rules due to disorder associated with stilldistinguishable ortho and para molecules and/or differences in molecularorientation (orientational superstructure based on fcc).
The presence of the Raman-active phonon and its continuity with phaseI suggests an hcp based structure for phase III. From the number of theRaman-active librations and the splitting of the Raman active phonon (seeabove) we deduce that the primitive cell should contain at least eightmolecules. The detailed Raman and IR measurements presented hereindicate that the stability field of phase III extends to at least 230 GPa;earlier measurements indicate the phase is stable to ~300 GPa.4 We alsoobserved for the first time in phase III a second Raman vibron near 4400cm-1. The frequency is some 20 cm-1 higher than the position of the IRvibron.6
We comment on the o-p effects on the phase diagram. We documentthat there are at least two different phases of molecular H2 in the same
Spectroscopic Studies of p-H2 to above 200 GPa 85
pressure range, depending on the o-p ratio. Raman measurements on D2
show qualitatively similar behavior.4 Notably, the frequencies of the IRand Raman bands in phase III (vibrons, phonons, and librons) as well asthe transition pressure seem to be independent of P-T path: they are similarat the same final conditions regardless of whether the samples originatedfrom pure p-H2 (as measured here), by others,28,29 or initially as samplesstarting out as o-p mixed crystals in phases I or II. This is consistent withthe loss of single-molecule o-p distinguishability in phase III. In contrast tothe behavior at lower pressures, no time dependent effects on the spectrawere observed at low temperature (15-20 K) or during a one weektemperature excursion to 100 K at 180-188 GPa and 205 GPa. Weconclude that the vibrational spectra in phase III are not affected by possibleo-p distinguishability, consistent with previous work.7,30 Previously, wereported evidence for an additional phase I’ at higher pressure andtemperatures in n-D2 based on a small vibron frequency change near the I-III phase line.30 The relationship between the o-p concentration and I'needs to be examined in future work.
5. CONCLUSIOSS
New Raman and infrared measurements of hydrogen at high pressureand low temperature reveal important information about the behavior of thisfundamental system with increasing density. The o-p conversion rate inphase I shows an unexpected non-monotonic behavior as a function ofpressure and increases markedly with increasing pressure above 3 GPa.The transition to phase II depends on the o-p concentration: mixed crystalstransform at lower pressure to an ordered superstructure, whereasessentially para-rich samples undergo the broken symmetry transition of theoriginal spherically symmetric molecules. Rich and distinct libron spectraare observed in phase II and III, and evidence for multiple Raman vibrons isfound. Although the results provide important guidance on possible crystalstructures for the high-pressure phases, the limitations of spectroscopicarguyments should be emphasized. The presence of disorder induced by o-p, frustrated orientational state, or residual strain (always present to somedegree in these very high-pressure samples), provides a mechanism for thebreakdown in selection rules that apply for the perfectly ordered crystal.Thus, candidate structures inferred from spectroscopy need to be confirmedby x-ray diffraction measurements, which have not yet been performed forp-H2 at high pressure.
86 R. J. Hemley et al.

ACKNOWLEDGMENTS
We thank J. F. Shu and V. V. Struzhkin for help with theseexperiments. This research was supported by the NSF (DMR-9624050),NASA (NAG5-3955) and DOE (DE-AC02-CG00016;;DE-FG02-2-96ER14651)
REFERENCE
1. H. K. Mao and R. J. Hemley, Rev. Mod. Phys. 66, 671 (1994).2. R. J. Hemley and H. K. Mao, Phys. Rev. Lett. 61, 857 (1988).3. P. Loubeyre, et al., Nature 383, 702 (1996).4. H. E. Lorenzana, I. F. Silvera and K. A. Goettel, Phys. Rev. Lett.
64, 1939 (1990).5. A. F. Goncharov, J. H. Eggert, I. I. Mazin, R. J. Hemley and H. K.
Mao, Phys. Rev. B 54, R15590 (1996).6. M. Hanfland, R. J. Hemley and H. K. Mao, Phys. Rev. Lett. 70,
3760 (1993).7. I. I. Mazin, R. J. Hemley, A. F. Goncharov, M. Hanfland and H. K.
Mao, Phys. Rev. Lett. 78, 1066 (1997).8. B. Edwards and N. W. Ashcroft, Nature 388, 652 (1997).9. A. F. Goncharov, V. V. Struzhkin, M. Somayazulu, R. J. Hemley and
H. K. Mao, Science 273, 218 (1996).10. R. J. Hemley, H. K. Mao, A. F. Goncharov, M. Hanfland and V.Struzhkin, Phys. Rev. Lett. 76, 1667 (1996).11. A. F. Goncharov, R. J. Hemley, H. K. Mao and J. Shu, Phys. Rev.Lett., submitted.12. J. van Kranendonk, Solid Hydrogen (Plenum Press, New York,1983).13. I. F. Silvera, Rev. Mod. Phys. 52, 393 (1980).14. F. Schmidt, Phys. Rev. B 10, 4480 (1974).15. A. Driessen, E. van der Poll and I. F. Silvera, Phys. Rev. B 30, 2517(1984).16. E. Karmon, J. H. Eggert, R. J. Hemley, A. F. Goncharov and H. K.Mao, to be published.17. J. van Kranendonk and G. Karl, Rev. Mod. Phys. 40, 531 (1968).18. A. Lagendijk and I. F. Silvera, Phys. Lett. A 84, 28 (1981).19. J. Igarishi, J. Phys. Soc. Japan 53, 2629 (1984).20. I.I. Mazin and R. E. Cohen, Phys. Rev. B 52, R8797 (1995).21. R. J. Hemley, H. K. Mao and J. F. Shu, Phys. Rev. Lett. 65, 2670(1990).
Spectroscopic Studies of p-H2 to above 200 GPa 87
22. M. Hanfland, R. J. Hemley and H. K. Mao, in High-Pressure Scienceand Technology -1993, edited by S. C. Schmidt, et al. (American Instituteof Physics, New York, 1994) p. 877.23. M. Nielsen, Phys. Rev. B 7, 1626 (1973).24. H. P. Gush, W. F. J. Hare, E. J. Allin, and H. L. Welsh, Can J.Phys. 38, 176 (1960).25. K. J. Runge, M. P. Surh, C. Mailhiot and E. L. Pollock, Phys. Rev.Lett. 69, 3527 (1992).26. L. Cui, N. H. Chen and I. F. Silvera, Phys. Rev. B 51, 14987(1995).27. R. J. Hemley, J. H. Eggert and H. K. Mao, Phys. Rev. B 48, 5779(1993).28. H. E. Lorenzana, I. F. Silvera and K. A. Goettel, Phys. Rev. Lett.63, 2080 (1989).29. N. H. Chen, E. Sterer and I. F. Silvera, Phys. Rev. Lett. 76, 1663(1996).30. A. F. Goncharov, I.I. Mazin, J. H. Eggert, R. J. Hemley and H. K.Mao, Phys. Rev. Lett. 5, 2514 (1995).
88 R. J. Hemley et al.