Journal of Immunological Methods - College of...
12
Optimization of murine small intestine leukocyte isolation for global immune phenotype analysis Andrew W. Goodyear a,1 , Ajay Kumar a,1 , Steven Dow a,2 , Elizabeth P. Ryan a,b, ⁎ a Department of Clinical Sciences, Colorado State University, 300 W. Drake Street, Fort Collins, CO 80523, USA b Department of Environmental and Radiological Health Sciences, Colorado State University, 200 W. Lake Street, Fort Collins, CO 80523, USA article info abstract Article history: Received 16 November 2013 Received in revised form 24 December 2013 Accepted 28 January 2014 Available online xxxx New efforts to understand complex interactions between diet, gut microbiota, and intestinal immunity emphasize the need for a standardized murine protocol that has been optimized for the isolation of lamina propria immune cells. In this study multiple mouse strains including BALB/c, 129S6/Sv/EvTac and ICR mice were utilized to develop an optimal protocol for global analysis of lamina propria leukocytes. Incubation temperature was found to significantly improve epithelial cell removal, while changes in media formulation had minor effects. Tissue weight was an effective method for normalization of solution volumes and incubation times. Collagenase digestion in combination with thermolysin was identified as the optimal method for release of leukocytes from tissues and global immunophenotyping, based on the criteria of minimizing marker cleavage, improving cell viability, and reagent cost. The effects of collagenase in combination with dispase or thermolysin on individual cell surface markers revealed diverse marker specific effects. Aggressive formulations cleaved CD8α, CD138, and B220 from the cell surface, and resulted in relatively higher expression levels of CD3, γδ TCR, CD5, DX5, Ly6C, CD11b, CD11c, MHC-II and CD45. Improved collagenase digestion significantly improved viability and reduced debris formation, eliminating the need for density gradient purification. Finally, we demonstrate that two different digestion protocols yield significant differences in detection of CD4 + and CD8 + T cells, NK cells, monocytes and interdigitating DC (iDC) populations, highlighting the importance and impact of cell collection protocols on assay outputs. The optimized protocol described herein will help assure the reproducibility and robustness of global assessment of lamina propria immune responses. Moreover, this technique may be applied to isolation of leukocytes from the entire gastrointestinal tract. © 2014 Elsevier B.V. All rights reserved. Keywords: Small intestine Global analysis Flow cytometry Collagenase digestion Isolation 1. Introduction The gastrointestinal mucosal environment is becoming increasingly interrogated for its dynamic properties of high immunological importance, and with regard to heightened knowledge and roles for the gut microbiome to interface with diet and gut associated inflammatory diseases (Hooper et al., 2012; Veldhoen and Brucklacher-Waldert, 2012). While immune cell isolation protocols typically follow the general steps of mucus removal, epithelial cell removal, and collage- nase digestion; there have been limited efforts since the 1980s to improve protocols for global murine intestinal immune phenotypic analysis (Castro et al., 1974; Davies and Parrott, 1981; Leventon et al., 1983; Dillon and MacDonald, 1985). Further complicating isolation methods is the precise development of protocols within inbred mouse strains, and multiple modifications aimed at isolation of specific cell types Journal of Immunological Methods xxx (2014) xxx–xxx ⁎ Corresponding author at: Department of Environmental and Radio- logical Health Sciences, College of Veterinary Medicine and Biomedical Sciences, Colorado State University, 200 W. Lake Street, 1680 Campus Delivery, Fort Collins, CO 80523-1680, USA. Tel.: +1 970 491 1536. E-mail addresses: [email protected] (A.W. Goodyear), [email protected] (A. Kumar), [email protected] (S. Dow), [email protected] (E.P. Ryan). 1 Tel.: +1 970 491 2100. 2 Tel.: +1 970 492 4382. JIM-11796; No of Pages 12 0022-1759/$ – see front matter © 2014 Elsevier B.V. All rights reserved. http://dx.doi.org/10.1016/j.jim.2014.01.014 Contents lists available at ScienceDirect Journal of Immunological Methods journal homepage: www.elsevier.com/locate/jim Please cite this article as: Goodyear, A.W., et al., Optimization of murine small intestine leukocyte isolation for global immune phenotype analysis, J. Immunol. Methods (2014), http://dx.doi.org/10.1016/j.jim.2014.01.014
-
Upload
truongkhanh -
Category
Documents
-
view
213 -
download
0
Transcript of Journal of Immunological Methods - College of...

Journal of Immunological Methods xxx (2014) xxx–xxx
JIM-11796; No of Pages 12
Contents lists available at ScienceDirect
Journal of Immunological Methods
j ourna l homepage: www.e lsev ie r .com/ locate / j im
Optimization of murine small intestine leukocyte isolation forglobal immune phenotype analysis
Andrew W. Goodyear a,1, Ajay Kumar a,1, Steven Dow a,2, Elizabeth P. Ryan a,b,⁎a Department of Clinical Sciences, Colorado State University, 300 W. Drake Street, Fort Collins, CO 80523, USAb Department of Environmental and Radiological Health Sciences, Colorado State University, 200 W. Lake Street, Fort Collins, CO 80523, USA
a r t i c l e i n f o
⁎ Corresponding author at: Department of Envirological Health Sciences, College of Veterinary MedSciences, Colorado State University, 200 W. LakeDelivery, Fort Collins, CO 80523-1680, USA. Tel.: +
E-mail addresses: [email protected] ([email protected] (A. Kumar), [email protected]@colostate.edu (E.P. Ryan).
1 Tel.: +1 970 491 2100.2 Tel.: +1 970 492 4382.
0022-1759/$ – see front matter © 2014 Elsevier B.V. Ahttp://dx.doi.org/10.1016/j.jim.2014.01.014
Please cite this article as: Goodyear, A.W.,phenotype analysis, J. Immunol. Methods (
a b s t r a c t
Article history:Received 16 November 2013Received in revised form 24 December 2013Accepted 28 January 2014Available online xxxx
New efforts to understand complex interactions between diet, gut microbiota, and intestinalimmunity emphasize the need for a standardized murine protocol that has been optimized forthe isolation of lamina propria immune cells. In this study multiple mouse strains includingBALB/c, 129S6/Sv/EvTac and ICR mice were utilized to develop an optimal protocol for globalanalysis of lamina propria leukocytes. Incubation temperature was found to significantlyimprove epithelial cell removal, while changes in media formulation had minor effects. Tissueweight was an effective method for normalization of solution volumes and incubation times.Collagenase digestion in combination with thermolysin was identified as the optimal methodfor release of leukocytes from tissues and global immunophenotyping, based on the criteria ofminimizing marker cleavage, improving cell viability, and reagent cost. The effects ofcollagenase in combination with dispase or thermolysin on individual cell surface markersrevealed diverse marker specific effects. Aggressive formulations cleaved CD8α, CD138, andB220 from the cell surface, and resulted in relatively higher expression levels of CD3, γδ TCR,CD5, DX5, Ly6C, CD11b, CD11c, MHC-II and CD45. Improved collagenase digestion significantlyimproved viability and reduced debris formation, eliminating the need for density gradientpurification. Finally, we demonstrate that two different digestion protocols yield significantdifferences in detection of CD4+ and CD8+ T cells, NK cells, monocytes and interdigitating DC(iDC) populations, highlighting the importance and impact of cell collection protocols on assayoutputs. The optimized protocol described herein will help assure the reproducibility androbustness of global assessment of lamina propria immune responses. Moreover, thistechnique may be applied to isolation of leukocytes from the entire gastrointestinal tract.
© 2014 Elsevier B.V. All rights reserved.
Keywords:Small intestineGlobal analysisFlow cytometryCollagenase digestionIsolation
1. Introduction
The gastrointestinal mucosal environment is becomingincreasingly interrogated for its dynamic properties of high
nmental and Radio-icine and BiomedicalStreet, 1680 Campus1 970 491 1536.Goodyear),state.edu (S. Dow),
ll rights reserved.
et al., Optimization of m2014), http://dx.doi.org/
immunological importance, and with regard to heightenedknowledge and roles for the gut microbiome to interface withdiet and gut associated inflammatory diseases (Hooper et al.,2012; Veldhoen and Brucklacher-Waldert, 2012). Whileimmune cell isolation protocols typically follow the generalsteps of mucus removal, epithelial cell removal, and collage-nase digestion; there have been limited efforts since the1980s to improve protocols for global murine intestinalimmune phenotypic analysis (Castro et al., 1974; Davies andParrott, 1981; Leventon et al., 1983; Dillon and MacDonald,1985). Further complicating isolation methods is the precisedevelopment of protocols within inbred mouse strains, andmultiple modifications aimed at isolation of specific cell types
urine small intestine leukocyte isolation for global immune10.1016/j.jim.2014.01.014

2 A.W. Goodyear et al. / Journal of Immunological Methods xxx (2014) xxx–xxx
such as B cells, γδ T cells and dendritic cells (Van der Heijdenand Stok, 1987; Ye et al., 2010; Geem et al., 2012). Forinstance, certain studies do not utilize mucolytic agents suchas dithiothreitol (DTT) while other studies utilize concentra-tions between 1 and 5 mM (Davies and Parrott, 1981;Waidmann et al., 2002; Resendiz-Albor et al., 2005). Removalof epithelial cells has been performed by mechanicaldisruption, enzymatic removal, and with chelating agentssuch as ethylenediaminetetraacetic acid (EDTA)(Castro et al.,1974; Davies and Parrott, 1981; Sheridan and Lefrancois,2012). The use of EDTA appears to be the most rapid andcommon method, though EDTA concentrations ranging from1 to 30 mM have been reported (Ericsson and Agace, 2004;Resendiz-Albor et al., 2005). In addition, incubations havebeen performed at room temperature (RT) or 37 °C withfrequency and duration combinations varying widely fromone wash for 90 min to 5 min washes for a total of 30 min(Davies and Parrott, 1981; Ericsson and Agace, 2004).Although expected cell yields and phenotype results aretypically reported, changes to media formulation are gener-ally not justified in the reported results. Therefore, identify-ing optimal conditions for recovery of intestinal leukocytepopulations under diverse conditions of intestinal inflamma-tion and anatomic location is a continuous challenge.
Use of different collagenase formulations for enzymaticdigestion also contributes to protocol variability. While someprotocols have used purified collagenase such as CLSPA fromWorthington, or Liberase formulations from Roche (Daviesand Parrott, 1981; Foureau et al., 2010), the vast majorityhave utilized crude collagenase preparations such as Type I,II, VI or VIII from Sigma-Aldrich, type III fromWorthington, orcollagenase D from Roche (Crofton et al., 1978; Lyscom andBrueton, 1982; Tseng, 1982; Lycke, 1986; Waidmann et al.,2002; Fujimoto et al., 2011). Justification for the choice ofcollagenase utilized has been rarely provided. Furthermore,optimal conditions for digestion of intestinal tissue are notreported by the manufacturer (Sigma-Aldrich, 2013). Inaddition, the use of crude collagenase preparations compli-cates protocol optimization because, as reported previously,the lot to lot variability necessitates re-optimization (Van derHeijden and Stok, 1987). Moreover, contaminating proteasesmay vary between lots resulting in alternative cleavage ofsurface markers (personal communication, Roche technicalsupport). Finally, digestion conditions vary widely andinclude digestion in Hank's balanced salt solution (HBSS), orculture media containing 0, 5, 10 or 20% serum, withincubation at RT or 37 °C in atmospheric or 5% CO2 environ-ments (Cebra et al., 1977; Tseng, 1982; Gautreaux et al., 1994;Johansson-Lindbom et al., 2005; Salazar-Gonzalez et al., 2006;Sheridan and Lefrancois, 2012). To the best of our knowledge,the effects of collagenase formulations on surface markers fromintestinal tissue have not been investigated, therefore the datapresented herein supports the ability to perform a globalimmune phenotype analysis of murine gastrointestinal tissue.
The prevalence of gastrointestinal diseases with knownand yet undiscovered immune dysfunctions is increasing(e.g. Ulcerative colitis, Crohn's, celiac, cancer, obesity, etc.).These conditions exemplify the strong rationale for identify-ing experimental variables necessary for efficient processingof intestinal cells that are reproducible and meet highthroughput, well powered experimental needs. For dietary
Please cite this article as: Goodyear, A.W., et al., Optimization of mphenotype analysis, J. Immunol. Methods (2014), http://dx.doi.org/
intervention and enteric pathogen infection studies per-formed in our laboratory (Henderson et al., 2012; Kumar etal., 2012), increased sample sizes and the need for globalimmune phenotypic analysis prompted the protocol optimi-zation described in this manuscript.
2. Methods
2.1. Stock solutions
10× phosphate buffered saline (PBS) was preparedaccording to the manufacturer's instructions (Calbiochem,Billerica, MA), and was stored at 4 °C. Antibiotic stocksincluded penicillin/streptomycin which was purchased as a10,000 unit/ml penicillin and 10 mg/ml streptomycin stockfrom Life Technologies (Carlsbad, CA) and aliquotswere storedat −20 °C. Enrofloxacin powder (Sigma-Aldrich, St. Louis, MO)was dissolved at 250 mg/ml in 10% acetic acid (Sigma-Aldrich),filter sterilized, and aliquots were frozen at −80 °C. Uponthawing enrofloxacin stocks were diluted to 25 mg/ml withsterile 60 mMTris base (Fisher Scientific, Pittsburgh, PA). Finally,polymyxin B (Sigma-Aldrich) was dissolved in distilled water at105 units/ml, filter sterilized, and aliquots stored at −80 °C. Allantibiotic stocks were used within 6 months of preparationbased on previously published stability studies (Griffith andBodily, 1992; Okerman et al., 2007; Goodyear et al., 2013).10× HBSS was purchased from Sigma-Aldrich and stored atRT. A 7.5% sodium bicarbonate (Sigma-Aldrich) stocksolution of was prepared in dH2O, sterile filtered and storedat RT. 1× HBSS was prepared by diluting 10× HBSS ten-foldwith dH2O, adding 4.2 mM NaHCO3 and adjusting the pH to7.4 (HBSS). HBSS was stored at 4 °C and used within6 months. 1 M DTT (Amresco, Solon, OH) stocks wereprepared in dH2O, filter sterilized and stored at −20 °C.DTT stocks were used within one year, and discarded aftertwo freeze/thaw cycles. Upon thawing DTT stocks were usedimmediately and either re-frozen or discarded as DTT ishighly unstable at RT or 4 °C (Nealon and Henderson, 1977).0.5 M EDTA pH 7.2–7.3 was prepared by dissolving EDTA(MP Biomedicals, Solon, OH) in dH20 and adjusting the pHwith 10 N sodium hydroxide (Fisher Scientific). 1 M HEPES(Fisher Scientific) was prepared in dH2O, the pH wasadjusted to 7.4 and was stored at RT. Liberase formulationsfrom Roche contained a standard amount of purifiedcollagenase in combination with dispase (D) or thermolysin(T), at low (DL, TL), medium (TM) or high (DH, TH)concentrations. Liberase stocks were prepared by re-suspending the lyophilized power in sterile HBSS at13 Wünsch units/ml, aliquots were stored at −20 °C. Colla-genase D (Sigma-Aldrich) stocks were prepared by dissolv-ing the lyophilized powder in HBSS at 5 mg/ml, and aliquotswere frozen at −20 °C. Glycerol stocks of DNase I frombovine pancreas (Sigma-Aldrich; Cat: D5025) were pre-pared. DNase I was dissolved at 104 Kunitz/ml in 10 mM TrispH 7.4, 10 mM CaCl2, 10 mM MgCl2, and 50% glycerol, allreagents from Fisher Scientific. DNase I glycerol stocks werestored at −20 °C, used within 1 year, and stored on icewhenever not at −20 °C. Trypsin inhibitor (Sigma-Aldrich)was dissolved in PBS at 10 mg/ml and aliquots were storedat −20 °C.
urine small intestine leukocyte isolation for global immune10.1016/j.jim.2014.01.014

3A.W. Goodyear et al. / Journal of Immunological Methods xxx (2014) xxx–xxx
2.2. Working solutions
1× PBS was prepared by diluting 10× PBS in dH2O. In anattempt to prevent non-specific activation of immune cellsby enteric microflora or experimental infection all solutionswere supplemented with 100 units/ml penicillin and100 μg/ml streptomycin to control extracellular bacteria,25 μg/ml enrofloxacin to control intracellular bacteria, and100 units/ml polymyxin B to neutralize LPS (PSEPx). Com-plete RPMI-1640 (cRMPI) was prepared utilizing RPMI-1640media (HyClone, Logan, UT) and adding 10% fetal bovine serum(Atlas Biologicals, Fort Collins, CO), 2 mM L-glutamine (LifeTechnologies, Carlsbad, CA), 1 mM sodium pyruvate (LifeTechnologies), 1× non-essential amino acids (Life Technolo-gies), and PSEPx. Solution 1 was used to remove mucus andresidual intestinal contents and consisted of HBSS + PSEPxsupplemented with 2% FBS, and 5 mM DTT was addedimmediately before use from 1 M DTT freezer stocks. Anyremaining solution 1 was discarded due to the unstable natureof DTT (Nealon and Henderson, 1977). Solution 2 was utilizedfor epithelial cell removal andwas composed of HBSS + PSEPxcontaining 2% FBS and 5 mM EDTA. Solution 3 was utilized forcollagenase digestion and consisted of HBSS + PSEPx supple-mented with 10 mM HEPES. 20× Liberase TM stocks included4 Wünsch unit/ml and 4000 Kunitz/ml DNase prepared insolution 3. 20× stock was ultimately diluted to a final workingconcentration of 0.2 Wünsch units/ml Liberase TM, and200 Kuntz units/ml DNase in solution 3. Working solutions ofcollagenase D were prepared in HBSS and contained40 collagen units/ml collagenase D, 30 Kuntz units/ml DNase,and 250 μg/ml trypsin inhibitor.
2.3. Mice
BALB/c mice were purchased from Jackson Laboratories (BarHarbor, ME), 129S6/SvEvTac mice from Taconic Laboratories(Germantown, NY), and institute for cancer research (ICR) micefrom Harlan (Indianapolis, IN). BALB/c and 129S6/SvEvTac werefemale, and ICR mice were male or female. Mice were 8 to40 weeks of age upon euthanasia. Mice were housed underpathogen-free conditions with filtered air. All experimentsinvolving animals were approved by the Institutional AnimalCare and Use Committee at Colorado State University.
2.4. Organ harvest, removal of intestinal contents, andtissue processing
Following euthanasia, the small intestine tissue was harvest-ed, and mesentery and adipose tissue was removed. The tissuewas arranged in a “spaced swiss roll” orientation within a100 × 15 mm Petri dish (VWR International, West Chester, PA),and placed on ice. Next, rather than flushing out intestinalcontentswith increased pressure, the intestinewas inflatedwithcold PBS to solubilize intestinal contents and grossly visiblePeyer's patches were removed. The tissue was then cut openlongitudinally and drawn through a pair of curved forceps whileapplying gentle pressure to remove intestinal contents. Theprocessed tissue was then weighed and this weight was utilizedto determine volumes and incubation times for all subsequentsteps. Next the tissue was cut into 2–4 cm lengths, placed in a50 ml conical tube containing 10 ml cRPMI and stored on ice. If
Please cite this article as: Goodyear, A.W., et al., Optimization of mphenotype analysis, J. Immunol. Methods (2014), http://dx.doi.org/
desired, intestinal contents were then stored at the appropriatetemperature for future analysis.
2.5. Mucus removal and epithelium isolation
2.5.1. Optimized protocolWashes were performed in polypropylene 50 ml conical
tubes (VWR international). Tubes were sealed, laid flat on aplatform shaker and taped to the platform. All washes wereperformed with shaking at 200 RPM as this speed resulted invigorous, but not turbulent mixing. Previous studies demon-strated that visual observation of solution cloudiness bymicroscopy was an accurate assessment of epithelial cellremoval (Bull and Bookman, 1977; Davies and Parrott, 1981;Tagliabue et al., 1982), and this technique was applied herein.In preliminary studies, 10 ml EDTA washes were found tosaturate in about 10 min (data not shown). Therefore,10 min washes were utilized for initial optimization studies.In experiments where incubations were performed at 4 °C or37 °C, solutions were acclimated to the appropriate temper-ature prior to addition. Incubations performed at 4 °C wereperformed by adding reagents cooled to 4 °C and shaking atRT. Platform shakers included, for RT (MaxQMini 4000,Thermo Scientific, Waltham, MA) and 37 °C incubations(Forma Orbital Shaker Model 420, Thermo Scientific). Tissueweight was used to determine the solution volume andincubation times for all solutions (see Results). For all washsolutions to be discarded as waste, samples were pouredthrough a 3 inch diameter food strainer (Walmart,Bentonville, AR) to rapidly re-isolate tissue. For isolation ofepithelial cells from EDTA washes samples were filteredthrough a 70 micron cell strainer (BD Biosciences, San Jose,CA). Epithelial samples were stored on ice and cells from allEDTA washes were pooled. If necessary, cell strainers wererinsed with dH2O between washes to remove debris.Epithelial cells were then centrifuged at 300 ×g for 5 min at8 °C, washed twice in 5 ml cold HBSS + 2% FBS, resuspendedin 5 ml cRPMI + PSEPx and stored on ice.
2.5.2. Previous protocolIntestinal tissue was flushed with PBS, washed 4 × 3 min in
PBS (25 ml per sample) at RT and 2 × 10 min in HBSS + 5 mMDTT (25 ml per sample) at RT. Next tissues were washed2 × 15 min in HBSS + 30 mM EDTA (25 ml per sample) at RTto remove epithelial cells. Isolation solutions contained penicillinand streptomycin at concentrations described in Section 2.2.
2.6. Collagenase digestion
2.6.1. Optimized protocolFollowing epithelial cell removal tissues were transferred
into 10 ml solution 3 to remove residual FBS and EDTA asboth of these have been shown to inhibit collagenase (Hooket al., 1971; McShane et al., 1989; Roche, 2013). Sampleswere shaken at 200 RPM at 37 °C for 10 min and the solutionwas discarded as waste. Tissue samples were then trans-ferred to 60 × 15 mm Petri dishes (Greiner Bio-One, Monroe,NC) containing solution 3 (HBSS + 10 mM HEPES). Volumesof solution 3, Liberase TM solution and incubation times weredetermined based on tissue weight (see Results). Tissueswere then minced into fine pieces and after all samples were
urine small intestine leukocyte isolation for global immune10.1016/j.jim.2014.01.014

4 A.W. Goodyear et al. / Journal of Immunological Methods xxx (2014) xxx–xxx
minced the correct volume of 20× Liberase TM solution wasadded to obtain 0.2 Wünsch units/ml Liberase TM and200 Kunitz/ml DNase. Samples were digested for 30 min at37 °C under atmospheric CO2 levels, and mixed every10 min. The digestion was performed in serum free HBSSbecause the digestion was shortened to 30 min, and becauseserum has been shown to inhibit collagenase (Roche, 2013).HEPES buffer was added to maintain a stable pH while tissuesare minced. Finally, samples were digested under atmo-spheric CO2 due to the sodium bicarbonate concentrationused in HBSS. For samples requiring less than 5 ml totalvolume, the digestionwas performed in 14 ml round bottomsnap cap tubes (BD Biosciences) with shaking at 200 RPM at37 °C for 30 min. Following digestion, 0.5 volumes cRPMI +PSEPx was added to stop the collagenase. Samples weretriturated 3× through an 18 gauge needle, and filteredthrough a 70 micron cell strainer (BD Biosciences). Cellswere pelleted by centrifugation at 300 ×g for 5 min at 8 °C,washed twice in 5 ml GI-HBSS + 2% FBS, resuspended in5 ml cRPMI + PSEPx and stored on ice.
To investigate the effects of collagenase formulations ondifferent surface markers, the percent of total cells and meanfluorescent intensity (MFI) for 20 distinct surface markerswas investigated. The goal was to identify a formulationwhich sufficiently digested the tissue while minimizingmarker cleavage. Therefore, we identified the formulationresulting in the strongest and weakest signal for each markerbased on the MFI or the mean percent of total cells. Thefrequency of the total number of strongest and weakestmarker expression results were determined for each Liberaseformulation and presented as a ratio. This ratio was used todetermine which formulation was optimal on a global scale,with a higher ratio being advantageous.
2.6.2. Previous protocolTissues were washed in HBSS for 5 min and transferred to
collagenase digestion solution. Samples were digested in40 collagen units/ml collagenase D (Sigma-Aldrich units) +30 Kunitz/ml DNase I and 250 μg/ml trypsin inhibitor in cRPMIsupplemented with 100 units/ml penicillin and 100 μ/mlstreptomycin (10 ml per sample). Digestion was performed ina 100 × 15 mm Petri dish at 37 °C + 5% CO2 for 1 h and30 min, and mixed every 30 min. Following digestion samplesweremechanically disrupted through a 70 micron cell strainer,pelleted by centrifugation and washed twice in HBSS. Sampleswere then purified by density gradient centrifugation asdescribed in Section 2.7.
2.7. Density gradient centrifugation
OptiPrep (60% Iodixanol solution) (Sigma-Aldrich) wasdiluted to 1.09 g/ml in 0.8% NaCl (Fisher Scientific) contain-ing 5 mM EDTA (MP Biomedicals) and 10 mM Tricine(Sigma-Aldrich), pH 7.4. Following collagenase digestionsamples were resuspended in cRMPI + PSEPx and overlaidover 1.09 g/ml OptiPrep. Samples were centrifuged at1700 ×g for 10 min with no brake based on previouslyreports (Gautreaux et al., 1994; Axis, 2013). Followingcentrifugation the cell layer on top of the 1.09 g/ml OptiPrepsolution was transferred to a new tube and cells were washed
Please cite this article as: Goodyear, A.W., et al., Optimization of mphenotype analysis, J. Immunol. Methods (2014), http://dx.doi.org/
twice with HBSS + 2% FBS. Samples were then re-suspendedin cRPMI and stored on ice until analysis.
2.8. Cell viability
Cell viability was determined by exclusion of 0.4% trypanblue (HyClone, Logan, UT) and counting on a hemocytom-eter. In separate studies live/dead analysis was performed byflow cytometry. 1 μM SYTO-9 (Life Technologies) and 10 μMpropidium iodide (Sigma-Aldrich) were added to samples inFACS buffer. Samples were incubated for 5 min at RT andimmediately analyzed by flow cytometry as described inSection 2.9. Cells were defined as SYTO-9+ events, live cellsas SYTO-9+/PI−, dead cells as SYTO-9+/PI+, and debris asSYTO-9− events.
2.9. Flow cytometry
Flow cytometry was performed as described previously(Goodyear et al., 2010). Briefly, directly conjugated antibodieswere purchased from eBioscience (San Diego, CA), BDBiosciences, or BioLegend (San Diego, CA). Antibodies fromeBioscience included anti-CD3 (Alexa Fluor 488 conjugated;clone 145-2C11), anti-PDCA (PE conjugated; clone eBio927),anti-CD117 (PE conjugated; clone 2B8), anti-CD11c (PE-Cy7conjugated; clone N418), anti-CD5 (PE-Cy7 conjugated; clone53-7.3), anti-CD103 (APC conjugated; clone 2E7), anti-FcεRIα(APC conjugated; clone MAR-1), anti-CD11b (Alexa Fluor 700conjugated; clone M1/70), anti-CD8α (Alexa Fluor 700 conju-gated; clone 53-6.7), anti-MHC-II (APC-eF780 conjugated;clone M5/114.15.2), anti-B220 (APC-eF780 conjugated; cloneRA3-6B2), anti-F4/80 (eF450 conjugated; clone BM8), anti-CD4(eF450 conjugated RM4-5), anti-CD45 (biotin conjugated;clone 30-F11). From BD Biosciences anti-Ly6G (FITC conjugat-ed; clone 1A8), anti-γδ TCR (FITC conjugated; clone GL3),anti-CD138 (PE conjugated; clone 281-2), anti-Siglec-F (PE-CF594 conjugated; clone E50-2440), anti-CD3 (PE-CF594conjugated; clone 145-2C11), anti Ly6C (PerCP-Cy5.5 conju-gated; clone AL-21). Finally, anti-DX5 (PerCP-Cy5.5 conjugated;clone DX5) was purchased from BioLegend. Single cell suspen-sions were washed in FACS buffer (PBS + 2% FBS + 5 mMsodium azide (Fisher Scientific)). Prior to staining, samples wereincubated with FACS block consisting of 50 mg/ml normalmouse serum (Jackson ImmunoResearch, West Grove, PA),200 μg/ml human IgG (Jackson ImmunoResearch) and 5 μg/mlunlabeled anti-mouse CD16/32 (clone 93, eBioscience) for 5 minat RT to block against nonspecific antibody binding. Antibodieswere diluted 1/200 in FACS buffer and incubated with samplesfor 30 min on ice, followed by washing with FACS buffer. Forbiotinylated antibodies, streptavidin-pacific orange (Life Tech-nologies) was added at a 1/500 dilution for 20 min on ice. Afterwashing in FACS buffer, cells were fixed in 1% paraformaldehyde(Electron Microscopy Science, Hatfield, PA) in PBS for 15 min at4 °C, washed, resuspended in FACS buffer and stored at 4 °Cuntil analyzed. Flow cytometry was performed using a Galliosflow cytometer using Gallios software version 1.2 (BeckmanCoulter, Fullerton, CA). Analysis was performed using FlowJosoftware version 7.6.5 (Tree Star Inc., Ashland, OR). Unless noted,cell population definitions utilized throughout this report arelisted in Table 1.
urine small intestine leukocyte isolation for global immune10.1016/j.jim.2014.01.014

Table 1Population definitions.
Population Definition
T cells FSC-SSClow/DX5−/CD3+
CD4+ T cells FSC-SSClow/DX5−/CD3+/CD4+
CD8+ T cells FSC-SSClow/DX5−/CD3+/CD8α+
γδ T cells FSC-SSClow/CD45+/γδ TCR+
NK cells FSC-SSClow/CD3−/DX5+
NK-T cells FSC-SSClow/CD3+/DX5+
B cells FSC-SSClow/CD45+/CD3−/DX5−/B220+
B1 B cells FSC-SSClow/CD45+/CD3−/DX5−/B220+/CD5+
Plasma cells FSC-SSClow/CD45+/CD138+
Allergy (FcεRIα+) FSC-SSClow/CD45+/FcεRIα+
Basophils FSC-SSClow/CD3−/B220−/FcεRIα +
Mast cells FSC-SSClow/CD3−/B220−/FcεRIα +/CD117+
Neutrophils CD45+/Siglec-F−/CD11b+/Ly6G+
Macrophage CD45+/Siglec-F−/CD11b+/Ly6G−/Ly6C−/F480+
Monocyte CD45+/Siglec-F−/CD11b+/Ly6G−/Ly6C+
Interdigitating DC(iDC)
CD45+/Siglec-F−/CD11c+/MHC-II+/CD103+
Myloid DC (mDC) CD45+/Siglec-F−/CD11c+/MHC-II+/CD11b+
Plasmacytoid DC(pDC)
CD45+/Siglec-F−/CD11c+/MHC-II+/PDCA+
Eosinophil CD45+/Siglec-F+
Table 2Effect of media composition, incubation temperature, wash frequency andtime on epithelial cell removal.
Media composition
Wash solutions
DTT EDTA Supplement % Viability Total washesa
2 mM 5 mM 52.67 102 mM 30 mM 47.88 95 mM 5 mM 59.03 105 MM 30 mM 57.05 95 mM 5 mM 2% FBS 56.57 105 mM 5 mM 10 mM HEPES 51.93 105 mM 5 mM 20 mM HEPES 52.1 10
Temperature
Wash temperature % Viability Total washesa
4 °C 44.51 ± 2.56 12Room temperature 52.65 ± 1.35 b 837 °C 57.42 ± 1.21 c, d 6
Wash frequency and time
Optimal conditionse
Solution Total washesa Total time Wash frequency
5 mM DTT 2 20 min 1 × 20 min5 mMEDTA
4 40 min 3 × 15 min
Normalization to tissue weightf
Solution Wash frequency Volume perwash Time per washg
5 mM DTT 1 20 ml/g 20 min/g5 mMEDTA 3 15 ml/g 15 min/g
a Ten min washes.b p b 0.05 compared to 4 °C.c p b 0.001 compared to 4 °C.d p b 0.05 compared to room temperature.e Determined in inbred 129SvEvTac mice.f Determined in outbred ICR mice.g Based on mean weight of all tissues within an experiment.
5A.W. Goodyear et al. / Journal of Immunological Methods xxx (2014) xxx–xxx
2.10. Statistical analysis
Statistical analysis was performed in Graph Pad Prismversion 5 software (Graph Pad, San Diego, CA). Analysisbetween two groups was performed by a two-tailedStudent's t-test. Comparisons between three or more groupswere performed by a one-way ANOVA followed by a Tukey'smultiple means test. Correlation analysis was performed by atwo-tailed Pearson analysis. Differences were consideredstatistically different for p b 0.05.
3. Results
3.1. Media formulation does not affect removal of mucus orepithelial cells
For the purpose of lamina propria leukocyte isolation,conditions resulting in the rapid removal of epithelial cellswere considered optimal. Complete epithelial cell removalwas identified by visual observation of solution clarificationas described in Section 2.5.1. The effects of DTT and EDTAconcentrations on removal of mucus and epithelial cells wereinvestigated utilizing BALB/c and ICR mice (n = 19 total).These studies demonstrated that regardless of the DTT (2 or5 mM) or EDTA (5 or 30 mM) concentration used, epithelialcells were removed in a similar number of washes, andneither DTT nor EDTA concentration had an effect on cellviability (Table 2). Therefore 5 mM DTT was chosen as therewas a trend towards increased viability as compared to 2 mMDTT. 5 mM EDTA was selected over 30 mM EDTA because30 mM EDTA provided only minor increases in epithelial cellremoval rates.
3.2. Wash temperature has a significant effect on mucus andepithelial cell removal
Utilizing optimized DTT and EDTA concentrations, wenext investigated the effect of temperature. Tissues from
Please cite this article as: Goodyear, A.W., et al., Optimization of mphenotype analysis, J. Immunol. Methods (2014), http://dx.doi.org/
129S6/SvEvTac (n = 4 to 21) mice were washed in DTT andEDTA solutions at 4 °C, RT or 37 °C. In contrast to mediaformulation, incubation temperature had a significant effecton both removal rate and cell viability (Table 2). The numberof washes required decreased with increasing temperature.Furthermore, cell viability was significantly increased at37 °C as compared to RT (p b 0.05) and 4 °C (p b 0.001),and 37 °C as compared to RT (p b 0.05). Therefore incubationat 37 °C was found to be critical for efficient mucus andepithelial cell removal.
3.3. Mucus and epithelial cell removal can be adapted based ontissue weight
Optimal media formulation and incubation temperatureconditions were used to determine optimal wash durationand frequency. 129S6/SvEvTac mice (n = 2–6 per group)were used were used to identify that 20 min in DTT (two10 min washes), and 40 min in EDTA (four 10 min washes)were required for mucus and epithelial cell removal,
urine small intestine leukocyte isolation for global immune10.1016/j.jim.2014.01.014

6 A.W. Goodyear et al. / Journal of Immunological Methods xxx (2014) xxx–xxx
respectively. Subsequently a single 20 min wash in solution 1and three 15 min washes in solution 2 were identified asoptimal for mucus and epithelial removal, respectively(Table 2). However, when these conditions were applied totissues from outbred strains such as ICR mice, epithelial cellremoval was incomplete. This finding prompted us toevaluate whether the protocol could be adapted based ontotal small intestinal (SI) tissue weight. One of the moststriking observations when specific volumes were used wasthat an increased amount of tissue led to a greater pH changein wash solutions. Utilizing volumes and tissue weights from129S6/SvEvTac mice, we determined that 20 ml solution 1and 45 ml solution 2 were needed per gram of SI tissue(Table 2). After adjusting the volumes according to tissueweight, the pH of all samples remained consistent asdetermined by visual observation of phenol red in washsolutions. Despite increases in the volume of each solution,we were still unable to remove all epithelial cells whenutilizing optimized times for the inbred mouse strains.
Experiments with media formulation had demonstratedthat increasing EDTA concentration had little effect on therate of epithelial cell removal (Table 2). Therefore, weinvestigated if increased incubation times were required forsamples that required larger volumes. With optimizedincubation times in 129S6/SvEvTac mice, we next deter-mined that 20 min/g of tissue was required for DTTincubations and 45 min/g of tissue was required for EDTAsolutions (~1 min per ml). However, while adjusting incu-bation time resulted in more consistent epithelial cellremoval, sample to sample variability was still a problem.Therefore, we investigated if replenishing solutions byincreasing the number of washes would improve consistencyutilizing the average tissue weight from all samples withinthe experiment to calculate incubation times. Tissue weightsfrom ICR mice (n = 6–10 per group) were used to adjustsolution volume and time, and the total time was thendivided into one, two, three or four incubations. We foundthat increasing the number of washes did indeed act as abuffer for eliminating sample variability, and that utilizingthe mean tissue weight was an effective method forcalculating incubation time. These studies revealed that one20 min/g wash in solution 1 and three 15 min/g washes insolution 2 were required to consistently remove mucus andepithelial cells, respectively.
3.4. Additional experimental observations
Many of the results from optimization experiments werestrictly observational anddifficult to quantify, orwere performedas preliminary studies. Given the important relevance of theseobservations, they were summarized below to further guidefuture investigations.
Initial experiments were performed to determine iftreatment with DTT to remove mucus prior to epithelial cellremoval was beneficial. These studies demonstrated that thesame number of washes was required to remove all epithelialcells if only EDTA washes were performed, or if DTT andEDTA were combined in the same solution. Separate DTT andEDTA washes resulted in the ability to isolate an epithelialcell population with greater purity in a smaller volume.Therefore, DTT and EDTA washes were performed separately
Please cite this article as: Goodyear, A.W., et al., Optimization of mphenotype analysis, J. Immunol. Methods (2014), http://dx.doi.org/
to remove mucus and epithelial cells, respectively. Additionalmedia supplementation for epithelial cell removal such asFBS or HEPES buffer did not significantly affect removal ratesor cell viability. FBS was found to result in a slight increase inviability, while inclusion of HEPES buffer reduced removalrates. Therefore 2% FBS was included while HEPES was notused.
Finally, in addition to wash temperature we also testedoptimal conditions for storage of samples betweenwashes, asprolonged intervals between washes can occur when pro-cessing multiple samples. These studies demonstrated that,in contrast to incubation temperatures, storage at RT or on icewas significantly better than storage at 37 °C. Storage on icewas slightly better than storage at RT but this difference wasnot significant, and therefore in the current study, sampleswere stored at RT between washes.
3.5. Collagenase formulations differentially cleave surfacemarkers
To the best of our knowledge the optimal collagenaseformulation for global analysis of SI immune populations hasnot been reported. We next examined the effects of astandard amount of collagenase combined with eitherdispase (D) or thermolysin (T), at low (DL, TL), medium(TM), or high (DH, TH) concentrations within Liberaseformulations commercially available from Roche. Tissuesfrom BALB/c (n = 3) or ICR mice (n = 2) were processedaccording to the optimal mucus and epithelial cell removalprotocols and tissues were then minced and digested at0.15 Wünsch units/ml with one of five Liberase formulations(DL, DH, TL, TM or TH) and 200 Kunitz/ml DNase as describedin Section 2.6.1. Analysis of MFI and percent of total cells on amarker specific level revealed a strong effect on lymphocyteswith B-cell markers being cleaved with more aggressiveformulations such as DH, TM and TH, and similar trends wereobserved for CD8α. In contrast, the aggressive formulationssuch as TM and TH were significantly improved for CD3 andphagocytic markers (Fig. 1, Supplemental Fig. 1). Thesemarker specific differences may be important for specificexperimental goals. To quantitate Liberase effects on a globalscale a scoring system was developed. For each marker, theLiberase formulation that maintained the highest level ofmarker integrity (strongest), and the formulation whichresulted in the most marker degradation (weakest) wasdetermined. Next the strongest/weakest frequency amongstthe 20 markers was determined for each formulation andexpressed as a ratio. This analysis revealed that Liberase TMwas optimal for BALB/c mice and for percent of total cells inICRmice, though Liberase DHwas optimal for MFI in ICRmice(Table 3). Additional B cell markers were also investigated asLiberase TM appeared to adversely affect B cell markers. BothCD19 and Ly-6K were investigated for identification of B-cellsand plasma cells, respectively. Unfortunately, both of thesemarkers were also cleaved by the same formulations (DH, TMand TH) suggesting that B-cell markers are more susceptibleto enzymatic cleavage (data not shown).
Marker cleavage is an important factor when choosing acollagenase formulation, and was considered in concert withother factors such as cost and cell viability. Amongst theLiberase formulations the TL formulation is presently theleast expensive while the DL, DH, TM and TL formulations are
urine small intestine leukocyte isolation for global immune10.1016/j.jim.2014.01.014
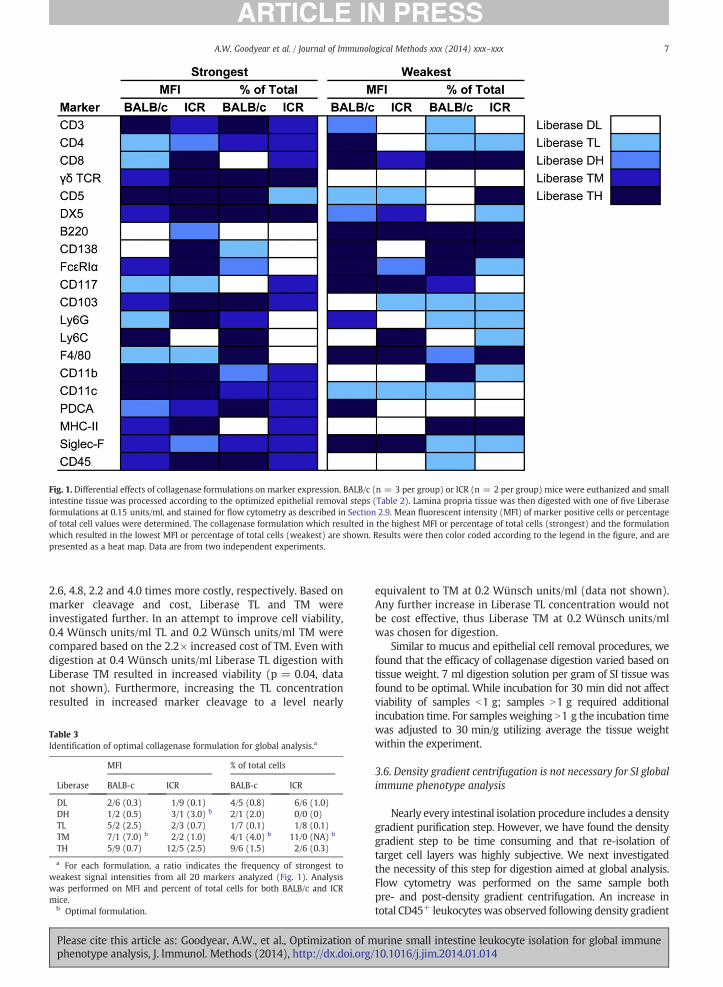
Fig. 1. Differential effects of collagenase formulations on marker expression. BALB/c (n = 3 per group) or ICR (n = 2 per group) mice were euthanized and smallintestine tissue was processed according to the optimized epithelial removal steps (Table 2). Lamina propria tissue was then digested with one of five Liberaseformulations at 0.15 units/ml, and stained for flow cytometry as described in Section 2.9. Mean fluorescent intensity (MFI) of marker positive cells or percentageof total cell values were determined. The collagenase formulation which resulted in the highest MFI or percentage of total cells (strongest) and the formulationwhich resulted in the lowest MFI or percentage of total cells (weakest) are shown. Results were then color coded according to the legend in the figure, and arepresented as a heat map. Data are from two independent experiments.
7A.W. Goodyear et al. / Journal of Immunological Methods xxx (2014) xxx–xxx
2.6, 4.8, 2.2 and 4.0 times more costly, respectively. Based onmarker cleavage and cost, Liberase TL and TM wereinvestigated further. In an attempt to improve cell viability,0.4 Wünsch units/ml TL and 0.2 Wünsch units/ml TM werecompared based on the 2.2× increased cost of TM. Even withdigestion at 0.4 Wünsch units/ml Liberase TL digestion withLiberase TM resulted in increased viability (p = 0.04, datanot shown). Furthermore, increasing the TL concentrationresulted in increased marker cleavage to a level nearly
Table 3Identification of optimal collagenase formulation for global analysis.a
MFI % of total cells
Liberase BALB-c ICR BALB-c ICR
DL 2/6 (0.3) 1/9 (0.1) 4/5 (0.8) 6/6 (1.0)DH 1/2 (0.5) 3/1 (3.0) b 2/1 (2.0) 0/0 (0)TL 5/2 (2.5) 2/3 (0.7) 1/7 (0.1) 1/8 (0.1)TM 7/1 (7.0) b 2/2 (1.0) 4/1 (4.0) b 11/0 (NA) b
TH 5/9 (0.7) 12/5 (2.5) 9/6 (1.5) 2/6 (0.3)
a For each formulation, a ratio indicates the frequency of strongest toweakest signal intensities from all 20 markers analyzed (Fig. 1). Analysiswas performed on MFI and percent of total cells for both BALB/c and ICRmice.
b Optimal formulation.
Please cite this article as: Goodyear, A.W., et al., Optimization of mphenotype analysis, J. Immunol. Methods (2014), http://dx.doi.org/
equivalent to TM at 0.2 Wünsch units/ml (data not shown).Any further increase in Liberase TL concentration would notbe cost effective, thus Liberase TM at 0.2 Wünsch units/mlwas chosen for digestion.
Similar to mucus and epithelial cell removal procedures, wefound that the efficacy of collagenase digestion varied based ontissue weight. 7 ml digestion solution per gram of SI tissue wasfound to be optimal. While incubation for 30 min did not affectviability of samples b1 g; samples N1 g required additionalincubation time. For samples weighing N1 g the incubation timewas adjusted to 30 min/g utilizing average the tissue weightwithin the experiment.
3.6. Density gradient centrifugation is not necessary for SI globalimmune phenotype analysis
Nearly every intestinal isolation procedure includes a densitygradient purification step. However, we have found the densitygradient step to be time consuming and that re-isolation oftarget cell layers was highly subjective. We next investigatedthe necessity of this step for digestion aimed at global analysis.Flow cytometry was performed on the same sample bothpre- and post-density gradient centrifugation. An increase intotal CD45+ leukocyteswas observed following density gradient
urine small intestine leukocyte isolation for global immune10.1016/j.jim.2014.01.014

Fig. 2. Density gradient centrifugation is not necessary for globalimmunophenotyping. (A) 129S6/SvEvTac mice (n = 9) were euthanizedand small intestine tissue was digested with collagenase D and analyzed byflow cytometry before and after density gradient centrifugation as describedin Sections 2.7 and 2.9. Data were pooled from 2 independent experimentsand statistical differences were determined by a two-tailed Student's t-test.(B) Percent viability and total live cells and were determined by trypan bluecell counts. For pre- and post-digestion groups samples were digested withcollagenase D and data were pooled from six experiments (n = 35).Samples from BALB/c (n = 15), 129S6/SvEvTac (n = 12) and ICR (n = 8)mice were analyzed both before and after density gradient centrifugation.For the Liberase group 65 samples from BALB/c (n = 5) 129S6/SvEvTac(n = 42), and ICR (n = 16) mice were digestion with 0.2 units/ml LiberaseTM. Individual values are graphed and gray bars indicate the mean value.Percent viability is graphed on the left axis and total viable cells on the rightaxis. Statistical differences were determined by a one-way ANOVA followedby a Tukey's multiple mean test. * p b 0.05, ** p b 0.01, *** p b 0.001.
8 A.W. Goodyear et al. / Journal of Immunological Methods xxx (2014) xxx–xxx
centrifugation. However, when distributed across multiplepopulations this difference was diluted out and only CD4+ Tcells were significantly increased, while NK cell and NK-T cellpopulations were significantly decreased (Fig. 2). Therefore,when balanced against additional time requirements andsubjective nature of re-purification, the minor changes inpopulation frequency suggested this stepmight not be necessarywhen isolation of a certain cell type is not required.
Next, we investigated the role of density gradientcentrifugation in the removal of dead cells and debris, viatrypan blue cell counting and flow cytometry. Followingdensity gradient centrifugation an increase in viability wasobserved (p b 0.001), although a trend towards a reductionin total viable cells was also observed (Fig. 2). Optimization ofthe digestion procedure with Liberase TM resulted insignificantly increased viability and total cell number overpost-density gradient centrifugation samples (p b 0.001)(Fig. 2). To investigate debris removal, live/dead fluorescentstaining was utilized to identify live cells, dead cells anddebris as described in Section 2.8. This analysis revealed asignificant correlation between pre-density viability anddebris removal as samples with lower pre-density viabilitieshad more debris removed by density gradient centrifugation(p b 0.01, data not shown). Interestingly, in samples withviability ≤80%, more debris was observed following densitygradient centrifugation, suggesting the need for densitygradient centrifugation can be prevented by optimizingcollagenase digestion procedures.
3.7. Variation across isolation methods can significantly affectinterpretation of results
The relevance of SI tissue processing methods wascompared via results obtained with the previous andoptimized protocols performed in our laboratory. In theseexperiments 129S6/SvEvTac mice (n = 10–18) were eutha-nized and lamina propria leukocytes were isolated fromintestinal tissue processed according to the previous isola-tion procedure (Sections 2.5.2 and 2.6.2) or according to theoptimized procedure described in the current manuscript(Sections 2.5.1 and 2.6.1). This comparative protocol anal-ysis revealed significantly different outcomes for bothlymphocytes and phagocytic cells (Fig. 3). Despite elimina-tion of the density gradient purification step, the majority ofdifferences were observed as increases in specific popula-tions on a percentage basis. We detected decreases in CD8+
T cells, B cells and plasma cells, and these differences werelikely due to marker cleavage by Liberase TM (Fig. 2). Theseresults highlight the difficulties associated with comparingresults between experiments that utilized different isolationprocedures, and the need to standardize the murineintestinal leukocyte isolation procedure.
3.8. Intraepithelial and lamina propria populations isolated withthe optimized protocol
While the main goal of the current protocol was to isolatelamina propria cells, we also collected epithelial cells for flowcytometric analysis. Normal populations in 129S6/SvEvTacmice were identified as our laboratory utilizes these mice forSalmonella infection and dietary interventions (Henderson et
Please cite this article as: Goodyear, A.W., et al., Optimization of mphenotype analysis, J. Immunol. Methods (2014), http://dx.doi.org/
al., 2012; Kumar et al., 2012). 129S6/SvEvTac mice (n = 9)were processed according to the optimized protocol de-scribed in Sections 2.5.1 and 2.6.1. Similar frequencies of totalT cells were observed in the epithelium and lamina propria,though CD8+ T cells were more prominent in the epithelium,
urine small intestine leukocyte isolation for global immune10.1016/j.jim.2014.01.014

Fig. 3. Variation in isolation procedure results in significant changes in cellpopulations. 129S6/SvEvTac mice (n = 10 per group) were euthanized andprocessed according to the collagenase D protocol followed by density gradientcentrifugation (previous protocol), orwere processed according to the LiberaseTM protocol (optimized protocol). Data were pooled from two independentexperiments. Statistical differences between previous and optimized protocolswere determined by a Student's two tailed t-test. Alternative populationdefinitions were used for some populations including: CD4+ T cells:FSC-SSClow/DX5−/CD4+; CD8+ T cells: FSC-SSClow/DX5−/CD8α+; NK Cells:FSC-SSClow/CD4−/CD8−/DX5+; NK-T cells: FSC-SSClow/DX5+/CD4+ orCD8α+; Macrophages: CD45+/CD11b+/Ly6G−/Ly6C-/F480+; CD103 DCs:CD45+/CD11c+/CD103+; myeloid DCs: CD45+/CD11c+/CD101b+; PCDCs:CD45+/CD11c+/PDCA+. Total T cells, B1 B cells, total allergy (FcεRIα+),basophils, mast cells and eosinophils were not investigated.
9A.W. Goodyear et al. / Journal of Immunological Methods xxx (2014) xxx–xxx
while CD4+ T cells were more prominent in the laminapropria (Fig. 4). Finally, the optimized protocol developed inthis study is summarized in a flow chart highlighting theconditions identified to be important for efficient epithelialcell removal and lamina propria cell isolation (Fig. 5).
4. Discussion
This report describes optimization of an intestinal isolationprocedure that can be standardized according to tissue weightand that demonstrated a reproducible, comprehensive intesti-nal immune phenotype analysis. Incubation temperature wasdetermined to be a critical variable formucus and epithelial cellremoval, while media formulation played a minor role. Theutilization of tissue weight to correct solution volume andincubation time, as well as optimization of wash frequencywere the factors required for consistent removal of intestinalepithelial cells. Collagenase digestion was improved to main-tain marker integrity and maximize cell viability in a costeffective manner. The optimized protocol was effective forisolation of intestinal cells from both inbred and outbredmouse strains.
Please cite this article as: Goodyear, A.W., et al., Optimization of mphenotype analysis, J. Immunol. Methods (2014), http://dx.doi.org/
Strain specific differences were also identified. For example,the mucus and epithelial cell removal steps optimized for 129SvEvTac mice were not as effective in ICR mice. Furthermore,strain specific differences in enzymatic marker cleavage includ-ing Ly6C and Ly6G expression, as well as CD8 were observed(Fig. 1, Supplementary Fig. 1). These differences highlightdifficulties in broadly applying protocols that were optimizedwith specific mouse strains. In the current study we identifiedtissue weight as an effective method for normalization of mucusand epithelial cell removal across mouse strains. Differences inthe susceptibility of specific markers to collagenase cleavageremain a concern. However, identification of Liberase TM as theoptimal formulation for global analysis in two mouse strainssuggests this formulation may be optimal across strains.
Improvements inmucus and epithelial cell removal aswell asidentification of optimal digestion techniques for global analysiswere also validated by total cell yields and observed immune cellpopulations. For example, the current procedure yielded anaverage of 1.3 × 10⁷ viable lymphocytes based on cell countsand CD45 staining (Fig. 2, data not shown). This is in agreementwith previous reports of 1 × 10⁷ lymphocytes or 2–5 × 10⁶
lymphocytes per intestine (Davies and Parrott, 1981; Sheridanand Lefrancois, 2012). The average viability of 72.1% obtained inthis study was similar to the 50–75% reported for samples priorto density gradient centrifugation (Lyscom and Brueton, 1982).Although the epithelial cell isolation was not the focus of thisstudy, viability results were similar to that previously reported,48 ± 17% (Leventon et al., 1983).
With regard to immune populations we observed largenumbers of CD8+ and γδ T cells in the epitheliumwith higherlevels of CD4+ T cells in the lamina propria as describedpreviously (De Geus et al., 1990; Gautreaux et al., 1994; Ye etal., 2010). Furthermore B cells were essentially absent fromthe epithelial fraction (Suzuki, 2012). Also, the majority ofiDCs were localized within the lamina propria (Farache et al.,2013). Unfortunately, comparison of specific frequenciesbetween studies proved difficult because previous studiesreported percentages of total lymphocytes rather than totalintestinal cells.
Such difficulties comparing results between gut immunecell phenotype studies that utilize different isolation proto-cols has been a topic of discussion for some time (Van derHeijden and Stok, 1987; Kearsey and Stadnyk, 1996). Indeed,the current study demonstrates that significant differencescan be obtained simply by altering the isolation protocol(Fig. 4). The current protocol provides an attractive option forstandardization as multiple variables were optimized basedon cell viability. Furthermore, this report provides a templatefor implementation of minor modifications required forspecific experimental needs. For instance, in our own studiesinvestigating dietary interventions we have observed certaindiets increase mucus production resulting in incompleteepithelial cell removal. With the knowledge that increasingthe number of washes can buffer out such slight variances wewere able to perform two 10 min DTT washes rather thanone 20 min wash and subsequently removed all epithelialcells without changing the epithelial wash procedure. Byidentifying the relevance of certain conditions to the effectiveisolation of epithelial and lamina propria cells, small changesin the protocol can be made to minimize variation betweenexperiments, resulting in more comparable results.
urine small intestine leukocyte isolation for global immune10.1016/j.jim.2014.01.014

Fig. 4. Intraepithelial and lamina propria leukocyte populations. (A). 129S6/SvEvTacmice (n = 9)were euthanized and processed according to the Liberase digestionprotocol. Single cell suspensions were stained and analyzed by flow cytometry as described in Section 2.9. Data were pooled from two independent experiments.(B). Representative dot plots from epithelium and lamina propria cell populations isolated from 129S6/SvEvTac mice. Preliminary gating strategies for representativedot plots include: T cells: FSC-SSClow/DX5−/CD3+; B cells: FSC-SSClow/CD45+/CD3−/DX5−; Dendritic cells: CD45+/Siglec-F−/CD11c+/MHC-II+.
10 A.W. Goodyear et al. / Journal of Immunological Methods xxx (2014) xxx–xxx
Optimization of the collagenase digestion for global pheno-typing was one of the major improvements in the currentreport. However, B cell markers were disproportionally affected(Fig. 3). As increasing TL formulations to concentrations whichresult in acceptable cell viability was found to cleave B cellmarkers, mechanical disruption followed by density gradientcentrifugation may be a more effective technique for B cellinvestigations. Specific B cell isolation procedures have alsobeen reported, although the effects of the crude collagenaseused in these studies on marker expression were not investi-gated (Cebra et al., 1977; Lycke, 1986; Van derHeijden and Stok,1987). Purified collagenase formulations from Worthington,Sigma or other manufacturers may also be more effective for Bcell isolation, although this will need to be tested and weighedagainst the effects on other immune cell markers.
Finally, removal of the density gradient centrifugation stepswas one of the major time saving modifications allowing ahigher number of mouse intestinal samples to be processed atone time. In agreement with previous studies we observed thatwhile dead cells and debris were removed, the total number ofviable cells was also reduced (Lyscom and Brueton, 1982; Van
Please cite this article as: Goodyear, A.W., et al., Optimization of mphenotype analysis, J. Immunol. Methods (2014), http://dx.doi.org/
derHeijden and Stok, 1987). However, at viabilities of≥80% thiseffect appears to be lost. Due to increased time requirementsand the subjective nature of density gradient centrifugation, thisstep was eliminated from the current protocol. Improving thecollagenase digestion step enhanced cell viability, though deadcells were still present. To ensure analysis of live cells by flowcytometry, newly available fixable viability dyes could be used.
In summary, this report provides an optimized protocolfor isolation of lamina propria leukocytes for global immunephenotype analysis. The flexibility and identification of keyvariables affecting isolation will allow for rapid applicationbased on experimental needs. These results provide ratio-nale for further studies to more precisely optimize epithelialcell isolation conditions. Given that similar techniques havebeen reported for stomach, cecum and colon (Weigmann etal., 2007; Lee et al., 2009; Ruiz et al., 2012), this optimizedproceduremay also be applicable, and potentially reduce thetime needed for isolation of the entire gastrointestinalmucosa. Finally, results from the current investigation mayalso be applicable or adaptable to tissues from other speciesincluding humans.
urine small intestine leukocyte isolation for global immune10.1016/j.jim.2014.01.014

Fig. 5. Flow diagram of optimized intestinal digestion procedure. * = Incubation time is calculated from the mean tissue weight for animals within theexperiment.
11A.W. Goodyear et al. / Journal of Immunological Methods xxx (2014) xxx–xxx
Supplementary data to this article can be found online athttp://dx.doi.org/10.1016/j.jim.2014.01.014.
Acknowledgments
We would like to thank Dustin Brown and Cadie Tillotsonfor their experimental assistance. The authors have noconflicts of interest to report. Protocol optimization experi-ments were completed with funding from the Bill andMelinda Gates Foundation Phase II Grand Challenges Explo-ration Grant (OPP1043255).
References
Axis, S., 2013. Isolation of Mouse Dendritic Cells from Tissues by a MixerTechnique (C21). (http://www.axis-shield-density-gradient-media.com/C21.pdf).
Please cite this article as: Goodyear, A.W., et al., Optimization of mphenotype analysis, J. Immunol. Methods (2014), http://dx.doi.org/
Bull, D.M., Bookman, M.A., 1977. Isolation and functional characterization ofhuman intestinal mucosal lymphoid cells. J. Clin. Invest. 59, 966–974.
Castro, G.A., Roy, S.A., Stockstill, R.D., 1974. Trichinella spiralis: peroxidaseactivity in isolated cells from the rat intestine. Exp. Parasitol. 36, 307–315.
Cebra, J.J., Gearhart, P.J., Kamat, R., Robertson, S.M., Tseng, J., 1977. Thesecretory immunoglobulin a response in the gut. Biochem. Soc. Trans. 5,1565–1569.
Crofton, R.W., Cochrane, C., McClelland, D.B., 1978. Preparation of lymphoidcells from small specimens of human gastrointestinal mucosa. Gut 19,898–906.
Davies, M.D., Parrott, D.M., 1981. Preparation and purification of lympho-cytes from the epithelium and lamina propria of murine small intestine.Gut 22, 481–488.
De Geus, B., Van den Enden, M., Coolen, C., Nagelkerken, L., Van der Heijden, P.,Rozing, J., 1990. Phenotype of intraepithelial lymphocytes in euthymic andathymic mice: implications for differentiation of cells bearing a CD3-associated γδ T cell receptor. Eur. J. Immunol. 20, 291–298.
Dillon, S.B., MacDonald, T.T., 1985. Isolation and function of mucosallymphocytes in the mouse. Prog. Clin. Biol. Res. 181, 381–385.
Ericsson, A., Agace, W., 2004. CCL25 enhances CD103-mediated lymphocyteadhesion to E-cadherin. Ann. N. Y. Acad. Sci. 1029, 334–336.
urine small intestine leukocyte isolation for global immune10.1016/j.jim.2014.01.014

12 A.W. Goodyear et al. / Journal of Immunological Methods xxx (2014) xxx–xxx
Farache, J., Koren, I., Milo, I., Gurevich, I., Kim, K.W., Zigmond, E., Furtado,G.C., Lira, S.A., Shakhar, G., 2013. Luminal bacteria recruit CD103+
dendritic cells into the intestinal epithelium to sample bacterial antigensfor presentation. Immunity 38, 581–595.
Foureau, D.M., Mielcarz, D.W., Menard, L.C., Schulthess, J., Werts, C., Vasseur,V., Ryffel, B., Kasper, L.H., Buzoni-Gatel, D., 2010. TLR9-dependentinduction of intestinal α-defensins by Toxoplasma gondii. J. Immunol.184, 7022–7029.
Fujimoto, K., Karuppuchamy, T., Takemura, N., Shimohigoshi, M., Machida, T.,Haseda, Y., Aoshi, T., Ishii, K.J., Akira, S., Uematsu, S., 2011. A new subsetof CD103+ CD8α+ dendritic cells in the small intestine expresses TLR3,TLR7, and TLR9 and induces Th1 response and CTL activity. J. Immunol.186, 6287–6295.
Gautreaux, M.D., Deitch, E.A., Berg, R.D., 1994. T lymphocytes in host defenseagainst bacterial translocation from the gastrointestinal tract. Infect.Immun. 62, 2874–2884.
Geem, D., Medina-Contreras, O., Kim, W., Huang, C.S., Denning, T.L., 2012.Isolation and characterization of dendritic cells and macrophages fromthe mouse intestine. J. Vis. Exp. e4040.
Goodyear, A., Jones, A., Troyer, R., Bielefeldt-Ohmann, H., Dow, S., 2010.Critical protective role for MCP-1 in Pneumonic Burkholderia malleiinfection. J. Immunol. 184, 1445–1454.
Goodyear, A., Strange, L., Rholl, D.A., Silisouk, J., Dance, D.A., Schweizer, H.P.,Dow, S., 2013. An improved selective culture medium enhances theisolation of Burkholderia pseudomallei from contaminated specimens.Am. J. Trop. Med. Hyg. 89, 973–982.
Griffith, M.E., Bodily, H.L., 1992. Stability of antimycobacterial drugs insusceptibility testing. Antimicrob. Agents Chemother. 36, 2398–2402.
Henderson, A.J., Kumar, A., Barnett, B., Dow, S.W., Ryan, E.P., 2012. Consumption ofrice bran increases mucosal immunoglobulin A concentrations and numbersof intestinal Lactobacillus spp. J. Med. Food 15, 469–475.
Hook, C.W., Brown, S.I., Iwanij, W., Nakanishi, I., 1971. Characterization andinhibition of corneal collagenase. Invest. Ophthalmol. 10, 496–503.
Hooper, L.V., Littman, D.R., Macpherson, A.J., 2012. Interactions between themicrobiota and the immune system. Science 336, 1268–1273.
Johansson-Lindbom, B., Svensson, M., Pabst, O., Palmqvist, C., Marquez, G.,Forster, R., Agace, W.W., 2005. Functional specialization of gut CD103+
dendritic cells in the regulation of tissue-selective T cell homing. J. Exp.Med. 202, 1063–1073.
Kearsey, J.A., Stadnyk, A.W., 1996. Isolation and characterization of highlypurified rat intestinal intraepithelial lymphocytes. J. Immunol. Methods194, 35–48.
Kumar, A., Henderson, A., Forster, G.M., Goodyear, A.W.,Weir, T.L., Leach, J.E., Dow,S.W., Ryan, E.P., 2012. Dietary rice bran promotes resistance to Salmonellaenterica serovar typhimurium colonization in mice. BMC Microbiol. 12, 71.
Lee, J.S., Oka, K., Obara, M., Nishimukai, M., Yoo, Y.C., Yamada, K., Tsukahara,T., Nakayama, K., Hara, H., Ishizuka, S., 2009. Improved isolation methodsfor mucosal leukocytes from small and large intestines in rats. Biosci.Biotechnol. Biochem. 73, 1732–1740.
Leventon, G.S., Kulkarni, S.S., Meistrich, M.L., Newland, J.R., Zander, A.R.,1983. Isolation of murine small bowel intraepithelial lymphocytes.J. Immunol. Methods 63, 35–44.
Lycke, N., 1986. A sensitive method for the detection of specific antibodyproduction in different isotypes from single lamina propria plasma cells.Scand. J. Immunol. 24, 393–403.
Lyscom, N., Brueton, M.J., 1982. Intraepithelial, lamina propria and peyer'spatch lymphocytes of the rat small intestine: isolation and
Please cite this article as: Goodyear, A.W., et al., Optimization of mphenotype analysis, J. Immunol. Methods (2014), http://dx.doi.org/
characterization in terms of immunoglobulin markers and receptorsfor monoclonal antibodies. Immunology 45, 775–783.
McShane, P., Sutton, R., Gray, D.W., Morris, P.J., 1989. Protease activity inpancreatic islet isolation by enzymatic digestion. Diabetes 38 (Suppl. 1),126–128.
Nealon, D.A., Henderson, A.R., 1977. Stability of commonly used thiols and ofhuman creatine kinase isoenzymes during storage at various tempera-ture in various media. Clin. Chem. 23, 816–829.
Okerman, L., Van Hende, J., De Zutter, L., 2007. Stability of frozen stocksolutions of β-lactam antibiotics, cephalosporins, tetracyclines andquinolones used in antibiotic residue screening and antibiotic suscep-tibility testing. Anal. Chim. Acta. 586, 284–288.
Resendiz-Albor, A.A., Esquivel, R., Lopez-Revilla, R., Verdin, L., Moreno-Fierros, L., 2005. Striking phenotypic and functional differences inlamina propria lymphocytes from the large and small intestine of mice.Life Sci. 76, 2783–2803.
Roche, 2013. Liberase Research Grade Purified Enzyme Blends, vol. 6(https://cssportal.roche.com/LFR_PublicDocs/ras/05401119001_en_06.pdf).
Ruiz, V.E., Sachdev, M., Zhang, S., Wen, S., Moss, S.F., 2012. Isolating,immunophenotyping and ex vivo stimulation of CD4+ and CD8+gastric lymphocytes during murine Helicobacter pylori infection.J. Immunol. Methods 384, 157–163.
Salazar-Gonzalez, R.M., Niess, J.H., Zammit, D.J., Ravindran, R., Srinivasan, A.,Maxwell, J.R., Stoklasek, T., Yadav, R., Williams, I.R., Gu, X., McCormick,B.A., Pazos, M.A., Vella, A.T., Lefrancois, L., Reinecker, H.C., McSorley, S.J.,2006. CCR6-mediated dendritic cell activation of pathogen-specific Tcells in Peyer's patches. Immunity 24, 623–632.
Sheridan, B.S., Lefrancois, L., 2012. Isolation of mouse lymphocytes fromsmall intestine tissues. Curr. Protoc. Immunol. 99, 3.19.1–3.19.11.
Sigma-Aldrich, 2013. General Information about Sigma-Aldrich Collage-nase Products, vol. 2013 (http://www.sigmaaldrich.com/life-science/metabolomics/enzyme-explorer/learning-center/collagenase-guide.html).
Suzuki, H., 2012. Age-dependent changes in intraepithelial lymphocytes(IELs) of the small intestine, cecum, and colon from young adult to agedmice. Arch. Gerontol. Geriatr. 55, 261–270.
Tagliabue, A., Befus, A.D., Clark, D.A., Bienenstock, J., 1982. Characteristics ofnatural killer cells in the murine intestinal epithelium and laminapropria. J. Exp. Med. 155, 1785–1796.
Tseng, J., 1982. Expression of immunoglobulin isotypes by lymphoid cells ofmouse intestinal lamina propria. Cell. Immunol. 73, 324–336.
Van der Heijden, P.J., Stok, W., 1987. Improved procedure for the isolation offunctionally active lymphoid cells from the murine intestine. J. Immunol.Methods 103, 161–167.
Veldhoen, M., Brucklacher-Waldert, V., 2012. Dietary influences on intestinalimmunity. Nat. Rev. Immunol. 12, 696–708.
Waidmann, M., Allemand, Y., Lehmann, J., di Genaro, S., Bucheler, N.,Hamann, A., Autenrieth, I.B., 2002. Microflora reactive IL-10 producingregulatory T cells are present in the colon of IL-2 deficient mice but lackefficacious inhibition of IFN-γ and TNF-α production. Gut 50, 170–179.
Weigmann, B., Tubbe, I., Seidel, D., Nicolaev, A., Becker, C., Neurath, M.F.,2007. Isolation and subsequent analysis of murine lamina propriamononuclear cells from colonic tissue. Nat. Protoc. 2, 2307–2311.
Ye, Y., Yue, M., Jin, X., Chen, S., Li, Y., 2010. Isolation of murine small intestinalintraepithelial γδ T cells. Immunol. Invest. 39, 661–673.
urine small intestine leukocyte isolation for global immune10.1016/j.jim.2014.01.014