
Journal of Hydrology - swu.edu.cngeography.swu.edu.cn/viscms/u/cms/geography/201705... · thought...
12
Research papers Hydrogeochemistry and geothermometry of deep thermal water in the carbonate formation in the main urban area of Chongqing, China Pingheng Yang a,b,⇑ , Qun Cheng c , Shiyou Xie a,b , Jianli Wang a,b , Longran Chang d,⇑ , Qin Yu a,b , Zhaojun Zhan a,b , Feng Chen a,b a School of Geographical Sciences, Southwest University, Chongqing Key Laboratory of Karst Environment, Key Laboratory of Eco-environments in Three Gorges Reservoir, Ministry of Education of the People’s Republic of China, Chongqing 400715, China b Field Scientific Observation and Research Base of Karst Eco-environments at Nanchuan in Chongqing, Ministry of Land and Resources of China, Chongqing 408435, China c Nanjiang Hydrogeological Team under the Chongqing Bureau of Geology and Minerals Exploration, Chongqing 401120, China d College of Resources and Environment, Southwest University, Chongqing 400715, China article info Article history: Received 2 August 2016 Received in revised form 21 January 2017 Accepted 24 March 2017 Available online 30 March 2017 This manuscript was handled by L. Charlet, Editor-in-Chief, with the assistance of Nico Goldscheider, Associate Editor Keywords: Thermal water Carbonate rocks Water-rock interaction Geothermometry Regional groundwater flow Chongqing China abstract Many geothermal reservoirs in Chongqing in southwestern China are located in carbonate rock aquifers and exploited through drilling. Water samples from 36 geothermal wells have been collected in the main urban area of Chongqing. Chemical types of the thermal water samples are CaMg-SO 4 and Ca-SO 4 . High contents of Ca 2+ and SO 4 2 in the thermal water samples are derived from the dissolution of evaporates. Furthermore, the HCO 3 concentration is constrained by the common ion effect. Drilling depth has no effect on the physical and chemical characteristics according to the results of a t-test. The geothermal reservoir’s temperature can be estimated to be 64.8–93.4 °C (average 82 °C) using quartz and improved SiO 2 geothermometers. Values of dD and d 18 O for the thermal water samples indicate that the thermal water resources originate from local precipitation with a recharge elevation between 838 and 1130 m and an annual air temperature between 10.4 and 13.9 °C. A conceptual model of regional scale ground- water flow for the thermal water is proposed. The thermal water mainly originates from the meteoric water recharged in the elevated areas of northeastern Tongluoshan and Huayingshan by means of perco- lation through exposed carbonate before becoming groundwater. The groundwater is heated at depth and moves southwest along the fault and the anticlinal core in a gravity-driven regime. The thermal water is exposed in the form of artesian hot springs in river cutting and low-elevation areas or in wells. Ó 2017 Elsevier B.V. All rights reserved. 1. Introduction Geothermal energy is a type of clean energy that consists of heat, minerals, and water. It is characterized by its wide distribu- tion, low levels of pollutants, direct utility, renewability, and signif- icant environmental and economic effects. The global development of geothermal energy has become especially rapid since the 1970s (Lund et al., 2011). In response to the serious issues of population expansion, energy shortages, and environmental pollution, the exploration and exploitation of geothermal energy have attracted an increasing amount of attentions. There are numerous geothermal reservoirs in China with vast potential for exploitation and utilization. The potential geothermal resources in the major sedimentary basins in China are approxi- mately 2.5 10 22 J, and the amount of exploitable geothermal energy is approximately 7.5 10 21 J(Kong et al., 2014; Wang et al., 2015). The annual exploitable hydrothermal resources are estimated to be 1.8 10 19 J, which is equivalent to a reduction of 1.4 10 8 t CO 2 emission (Kong et al., 2014; Wang et al., 2015); of this quantity, the hot spring releases a total of 6.6 10 17 J annu- ally, which is equivalent to 2.26 10 7 t of standard coal or a reduc- tion of 5.93 10 7 t CO 2 emissions (Wang et al., 2015). Until 2014, China had found approximately 4000 hot water points (including hot springs, drilling, and mine water resources) with water tem- peratures above 25 °C(Zhao and Wan, 2014). Chongqing municipality was named ‘‘the hot springs capital of China” in April 2011, due to its plentiful thermal water resources (Cheng et al., 2015). The area containing thermal water is approx- imately 1 10 4 km 2 (Cheng et al., 2015). The thermal water is http://dx.doi.org/10.1016/j.jhydrol.2017.03.054 0022-1694/Ó 2017 Elsevier B.V. All rights reserved. ⇑ Corresponding authors at: No. 2 Tiansheng Road, Beibei District, Chongqing 400715, China. E-mail addresses: [email protected] (P. Yang), [email protected] (Q. Cheng), [email protected] (S. Xie), [email protected] (J. Wang), 544288987@qq. com (L. Chang), [email protected] (Q. Yu), [email protected] (Z. Zhan), [email protected] (F. Chen). Journal of Hydrology 549 (2017) 50–61 Contents lists available at ScienceDirect Journal of Hydrology journal homepage: www.elsevier.com/locate/jhydrol
Transcript of Journal of Hydrology - swu.edu.cngeography.swu.edu.cn/viscms/u/cms/geography/201705... · thought...

Journal of Hydrology 549 (2017) 50–61
Contents lists available at ScienceDirect
Journal of Hydrology
journal homepage: www.elsevier .com/locate / jhydrol
Research papers
Hydrogeochemistry and geothermometry of deep thermal water in thecarbonate formation in the main urban area of Chongqing, China
http://dx.doi.org/10.1016/j.jhydrol.2017.03.0540022-1694/� 2017 Elsevier B.V. All rights reserved.
⇑ Corresponding authors at: No. 2 Tiansheng Road, Beibei District, Chongqing400715, China.
E-mail addresses: [email protected] (P. Yang), [email protected] (Q.Cheng), [email protected] (S. Xie), [email protected] (J. Wang), [email protected] (L. Chang), [email protected] (Q. Yu), [email protected] (Z. Zhan),[email protected] (F. Chen).
Pingheng Yang a,b,⇑, Qun Cheng c, Shiyou Xie a,b, Jianli Wang a,b, Longran Chang d,⇑, Qin Yu a,b,Zhaojun Zhan a,b, Feng Chen a,b
a School of Geographical Sciences, Southwest University, Chongqing Key Laboratory of Karst Environment, Key Laboratory of Eco-environments in Three Gorges Reservoir, Ministryof Education of the People’s Republic of China, Chongqing 400715, Chinab Field Scientific Observation and Research Base of Karst Eco-environments at Nanchuan in Chongqing, Ministry of Land and Resources of China, Chongqing 408435, ChinacNanjiang Hydrogeological Team under the Chongqing Bureau of Geology and Minerals Exploration, Chongqing 401120, ChinadCollege of Resources and Environment, Southwest University, Chongqing 400715, China
a r t i c l e i n f o
Article history:Received 2 August 2016Received in revised form 21 January 2017Accepted 24 March 2017Available online 30 March 2017This manuscript was handled by L. Charlet,Editor-in-Chief, with the assistance of NicoGoldscheider, Associate Editor
Keywords:Thermal waterCarbonate rocksWater-rock interactionGeothermometryRegional groundwater flowChongqingChina
a b s t r a c t
Many geothermal reservoirs in Chongqing in southwestern China are located in carbonate rock aquifersand exploited through drilling. Water samples from 36 geothermal wells have been collected in the mainurban area of Chongqing. Chemical types of the thermal water samples are Ca�Mg-SO4 and Ca-SO4. Highcontents of Ca2+ and SO4
2� in the thermal water samples are derived from the dissolution of evaporates.Furthermore, the HCO3
� concentration is constrained by the common ion effect. Drilling depth has noeffect on the physical and chemical characteristics according to the results of a t-test. The geothermalreservoir’s temperature can be estimated to be 64.8–93.4 �C (average 82 �C) using quartz and improvedSiO2 geothermometers. Values of dD and d18O for the thermal water samples indicate that the thermalwater resources originate from local precipitation with a recharge elevation between 838 and 1130 mand an annual air temperature between 10.4 and 13.9 �C. A conceptual model of regional scale ground-water flow for the thermal water is proposed. The thermal water mainly originates from the meteoricwater recharged in the elevated areas of northeastern Tongluoshan and Huayingshan by means of perco-lation through exposed carbonate before becoming groundwater. The groundwater is heated at depth andmoves southwest along the fault and the anticlinal core in a gravity-driven regime. The thermal water isexposed in the form of artesian hot springs in river cutting and low-elevation areas or in wells.
� 2017 Elsevier B.V. All rights reserved.
1. Introduction
Geothermal energy is a type of clean energy that consists ofheat, minerals, and water. It is characterized by its wide distribu-tion, low levels of pollutants, direct utility, renewability, and signif-icant environmental and economic effects. The global developmentof geothermal energy has become especially rapid since the 1970s(Lund et al., 2011). In response to the serious issues of populationexpansion, energy shortages, and environmental pollution, theexploration and exploitation of geothermal energy have attractedan increasing amount of attentions.
There are numerous geothermal reservoirs in China with vastpotential for exploitation and utilization. The potential geothermalresources in the major sedimentary basins in China are approxi-mately 2.5 � 1022 J, and the amount of exploitable geothermalenergy is approximately 7.5 � 1021 J (Kong et al., 2014; Wanget al., 2015). The annual exploitable hydrothermal resources areestimated to be 1.8 � 1019 J, which is equivalent to a reduction of1.4 � 108 t CO2 emission (Kong et al., 2014; Wang et al., 2015); ofthis quantity, the hot spring releases a total of 6.6 � 1017 J annu-ally, which is equivalent to 2.26 � 107 t of standard coal or a reduc-tion of 5.93 � 107 t CO2 emissions (Wang et al., 2015). Until 2014,China had found approximately 4000 hot water points (includinghot springs, drilling, and mine water resources) with water tem-peratures above 25 �C (Zhao and Wan, 2014).
Chongqing municipality was named ‘‘the hot springs capital ofChina” in April 2011, due to its plentiful thermal water resources(Cheng et al., 2015). The area containing thermal water is approx-imately 1 � 104 km2 (Cheng et al., 2015). The thermal water is
P. Yang et al. / Journal of Hydrology 549 (2017) 50–61 51
thought to form by means of non-volcanic heating and can emit3.32 � 1011 kcal/yr (1.9 � 1012 kJ/yr), which is equivalent to4.75 � 104 t/yr of standard coal (Wang et al., 2015). The exploita-tion of the thermal water resources in Chongqing has focused oncarbonate strata in the main urban area. The Bei hot spring hasbeen used since the Song dynasty, and the Nan hot spring wasexploited in the Ming dynasty. The Dong hot spring, later calledthe Xi hot spring, has become increasingly famous. Now, thereare 107 areas with thermal water resources in Chongqing, includ-ing 65 geothermal wells, 26 hot springs, and 16 geothermal miningwaters (Li and Liu, 2011). In 2012, the Chongqing MunicipalGovernment planned to develop 10 groups of springs in five loca-tions in the main urban area and 100 hot springs and thermal wellswithin a one-hour drive from the city center. However, from themid-1980s to the early 1990s, the discharge and temperature ofthe water in the hot springs decreased rapidly due to overexploita-tion. Some of the springs even dried up. Despite this interest, littlehas been published on the thermal water resources in Chongqing,China, except the work of Li and Liu (2011), Xiao et al. (2015), andCheng et al. (2015) in Chinese. However, these studies focus onlyon individual cases (Xiao et al., 2015) and on the general chemicalcharacteristics and quantity of thermal water resources on a regio-nal scale (Li and Liu, 2011; Cheng et al., 2015; Xiao et al., 2015).
The widely applicable fundamental tools for studying thermalwater include regional scale hydraulics, water chemistry, 2H and18O isotopic composition, and geothermometry. Studies on regio-nal scale groundwater hydraulics can be traced back to Tóth(1962, 1963), and the subject has been further developed by a ser-ies of researchers (e.g., Zijl, 1999; Jiang et al., 2011). The relation-ship between groundwater temperature distribution and a singleflow system in a unit basin was first studied by Domenico andPalciauskas (1973). According to Tóth (1995), a subsurface rockbody can be considered to be hydraulically continuous on a giventime scale. The concept of hydraulic continuity can help us to inter-pret carbonate reservoirs as a whole without separate warm andcold fluids and confined and unconfined parts. Evaluating theregional scale groundwater hydraulics and hydraulic continuitycould be useful in geothermal exploration (Mádl-Sz}onyi andTóth, 2015; Mádl-Sz}onyi and Simon, 2016). Typically, differentflow systems differ greatly in hydrochemistry and isotopes (Tóth,2009). Therefore, the interaction and mixing of thermal waterand surface water can be determined using the concentrations ofmajor ions and the values of d18O and dD to trace the origin ofthe thermal water (e.g., Lee et al., 2011; Wang et al., 2013;Pérez-Zárate et al., 2015; Chatterjee et al., 2016). The geother-mometers currently used to efficiently estimate reservoir temper-atures include cation geothermometers, e.g., K-Mg (Giggenbach,1988), Na-K (Can, 2002), Na-K-Ca (Fournier and Truesdell, 1973),and Na-Li thermometers (Fouillac and Michard, 1981); silica(quartz and chalcedony) geothermometers (Fournier, 1977); iso-tope geothermometers (Millot and Négrel, 2007); and gas geother-mometers (D’Amore et al., 1993).
In this study, we focus on characterizing the geochemistry ofthermal water in 36 wells in the carbonate rock aquifer in the mainurban area of Chongqing, identifying the sources of the major ionsto estimate the reservoir temperature based on different geother-mometric methods, and setting up a conceptual regional modelfor the circulation of thermal water. In addition, deep carbonaterock aquifers, most of which are to some degree karstified, areprobably the most important thermal water resources outside ofvolcanic areas (Goldscheider et al., 2010). The deep karst aquifersin China containing hot water are ideal targets for future exploita-tion and utilization due to their favorable characteristics, whichinclude a high single-well yield, low salinity, easy reinjection,and fewer environmental effects when exploited (Kong et al.,
2014). Therefore, studying the thermal water resources in carbon-ate strata in the main urban area of Chongqing can also provideuseful references for the national strategy of geothermal energyexploitation in carbonate formations.
2. Study area description
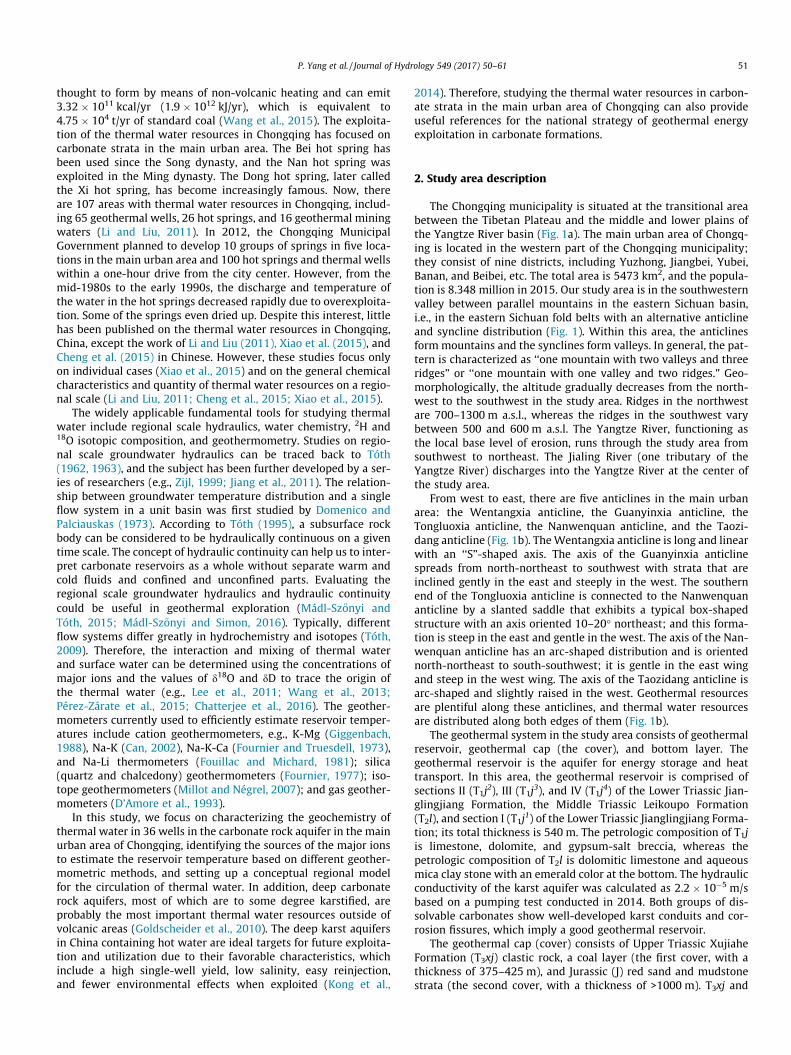
The Chongqing municipality is situated at the transitional areabetween the Tibetan Plateau and the middle and lower plains ofthe Yangtze River basin (Fig. 1a). The main urban area of Chongq-ing is located in the western part of the Chongqing municipality;they consist of nine districts, including Yuzhong, Jiangbei, Yubei,Banan, and Beibei, etc. The total area is 5473 km2, and the popula-tion is 8.348 million in 2015. Our study area is in the southwesternvalley between parallel mountains in the eastern Sichuan basin,i.e., in the eastern Sichuan fold belts with an alternative anticlineand syncline distribution (Fig. 1). Within this area, the anticlinesformmountains and the synclines form valleys. In general, the pat-tern is characterized as ‘‘one mountain with two valleys and threeridges” or ‘‘one mountain with one valley and two ridges.” Geo-morphologically, the altitude gradually decreases from the north-west to the southwest in the study area. Ridges in the northwestare 700–1300 m a.s.l., whereas the ridges in the southwest varybetween 500 and 600 m a.s.l. The Yangtze River, functioning asthe local base level of erosion, runs through the study area fromsouthwest to northeast. The Jialing River (one tributary of theYangtze River) discharges into the Yangtze River at the center ofthe study area.
From west to east, there are five anticlines in the main urbanarea: the Wentangxia anticline, the Guanyinxia anticline, theTongluoxia anticline, the Nanwenquan anticline, and the Taozi-dang anticline (Fig. 1b). TheWentangxia anticline is long and linearwith an ‘‘S”-shaped axis. The axis of the Guanyinxia anticlinespreads from north-northeast to southwest with strata that areinclined gently in the east and steeply in the west. The southernend of the Tongluoxia anticline is connected to the Nanwenquananticline by a slanted saddle that exhibits a typical box-shapedstructure with an axis oriented 10–20� northeast; and this forma-tion is steep in the east and gentle in the west. The axis of the Nan-wenquan anticline has an arc-shaped distribution and is orientednorth-northeast to south-southwest; it is gentle in the east wingand steep in the west wing. The axis of the Taozidang anticline isarc-shaped and slightly raised in the west. Geothermal resourcesare plentiful along these anticlines, and thermal water resourcesare distributed along both edges of them (Fig. 1b).
The geothermal system in the study area consists of geothermalreservoir, geothermal cap (the cover), and bottom layer. Thegeothermal reservoir is the aquifer for energy storage and heattransport. In this area, the geothermal reservoir is comprised ofsections II (T1j2), III (T1j3), and IV (T1j4) of the Lower Triassic Jian-glingjiang Formation, the Middle Triassic Leikoupo Formation(T2l), and section I (T1j1) of the Lower Triassic Jianglingjiang Forma-tion; its total thickness is 540 m. The petrologic composition of T1jis limestone, dolomite, and gypsum-salt breccia, whereas thepetrologic composition of T2l is dolomitic limestone and aqueousmica clay stone with an emerald color at the bottom. The hydraulicconductivity of the karst aquifer was calculated as 2.2 � 10�5 m/sbased on a pumping test conducted in 2014. Both groups of dis-solvable carbonates show well-developed karst conduits and cor-rosion fissures, which imply a good geothermal reservoir.
The geothermal cap (cover) consists of Upper Triassic XujiaheFormation (T3xj) clastic rock, a coal layer (the first cover, with athickness of 375–425 m), and Jurassic (J) red sand and mudstonestrata (the second cover, with a thickness of >1000 m). T3xj and

Fig. 1. (a) Location and main structural pattern of the main urban area of Chongqing. The outcrops in the Tongluoshan and Huayingshan areas are the suggested rechargezone for the thermal water of the study area. (b) General geology and DEM of the study area with sampling locations (after Cheng et al., 2015). The sample numbers are shownin Table 1. Numbers 12–15, 25–26, 27–28, and 31–26 are very close together. (c) Geologic section of A-A0 showing an alternative anticline and syncline distribution. Theanticlines and synclines mainly consist of carbonate and clastic rock, respectively. WA: Wentangxia anticline, GA: Guanyinxia anticline, TA: Tongluoxia anticline, NA:Nanwenquan anticline, TZA: Taozidang anticline.
52 P. Yang et al. / Journal of Hydrology 549 (2017) 50–61

P. Yang et al. / Journal of Hydrology 549 (2017) 50–61 53
the Jurassic strata are located above T1j + T2l and are characterizedby poor thermal and water conductivity that, to some extent, pre-vents thermal loss in the geothermal reservoir and forms a layerwith low permeability.
The bottom of the geothermal reservoir consists of lower Trias-sic Feixianguan Formation (T1f) carbonate and clastic sediment.The petrology is mud limestone and shale with a thickness over500 m. The shale layer exhibits poor porosity, low permeability,and low thermal conductivity.
The 36 geothermal wells in this study are distributed within the2 km surrounding the axis of the Wentangxia, Guanyinxia, Tonglu-oxia, Nanwenquan, and Taozidang anticlines (Fig. 1b).
The study area features a subtropical wet monsoon climate withan average temperature of 17 �C. The annual precipitation is heavyand peaks during late spring and summer; its annual averageranges from 1000 to 1400 mm (Bai et al., 2014).
3. Methods
3.1. Sample collection and experimental analysis
Water samples from the 36 thermal wells (Fig. 1b) were col-lected by pumping during the wet season in 2009. Each sample’stemperature, pH, and total dissolved solids (TDS) were measuredin the field with uncertainties of 0.1 �C, 0.1 unit, and 1 mg/L,respectively. The concentrations of Ca2+, Mg2+, and SO4
2� were mea-sured using the EDTA titration method with relative errors of ±1%,±1%, and ±0.6%, respectively. The concentrations of K, Na, and Liwere determined using flame atomic absorption spectrophotome-try with an accuracy of 0.1 mg/L. The Cl� concentration was ana-lyzed using argentometric titration with a relative error of ±1%.The SiO2 concentration was tested using Si-Mo yellow spectropho-tometry with a relative standard deviation of 0.5%. The HCO3
� con-centration was determined by titration with a relative error of±1.6%. All the elemental concentrations were measured at theGeotechnical Engineering Testing Center of Chongqing in accor-dance with the Determination Method for Underground Water pub-lished by the Chinese government (The Geological and Mineral ofthe People’s Republic of China, 1993).
No. 2 was collected during the dry season on December 17,2009, and the other 35 samples were collected during the wet sea-son in 2009. The values of d18O and dD of nos. 2, 4, 15, 16, 26, 32and 33 were obtained using a DELTA V Plus isotope ratio massspectrometer connected with a GasBench II (Thermo Fisher Scien-tific Inc., Bremen, Germany). Both international and laboratory iso-topic standards were utilized with external uncertainties of lessthan 0.2‰. The isotopic ratios were reported in delta (d) notationrelative to the V-SMOW standard and expressed in per mil (‰).These measurements were made at the Laboratory of Geochem-istry and Isotopes, Southwest University, Chongqing, China.
3.2. Data processing
3.2.1. Saturation index (SI)The SI was calculated using Phreeqc version 3 (Parkhurst and
Appelo, 2013). When SI < 0, the solution is considered undersatu-rated. When SI = 0, the solution is saturated, and equilibrium isachieved between mineral dissolution and precipitation. WhenSI > 0, the solution is oversaturated, and extra minerals precipitate.
3.2.2. t-test for independent samples and correlation analysisThe t-test for independent samples is designed to compare two
independent samples from normal populations to test whether themean and variance of the samples’ sources are the same (e.g.,Schipper and McGill, 2008). When Sig > 0.05, the difference
between the samples is insignificant; when Sig < 0.05, the differ-ence between the samples cannot be ignored.
Correlation coefficient analysis is used to measure the strengthof the association between two continuous variables. A Pearsonrank correlation analysis (two-tailed) was used to examine thepossible correlations among various physical and chemicalparameters.
The t-test and the correlation coefficient analysis were per-formed using IBM SPSS statistics 19.0.
3.2.3. GeothermometryThe geothermometric calculations of the reservoir tempera-
tures used in this study are as follows:
Quartz (Fournier, 1977): TSiO2 = [1309/(5.19 � lgS)] � 273.15,Chalcedony (Fournier, 1977): TSiO2 = [1032/(4.69 � lgS)] �273.15,Improved SiO2 (Verma and Santoyo, 1997): TSiO2 = �44.119+ 0.24469S � 1.7414 � 10�4S2 + 79.305lgS,K-Mg (Giggenbach, 1988): TK-Mg = 4410/[14 � lg(K2/Mg)] �273.15,Na-Li (Fouillac and Michard, 1981): TNa-Li = 1049/[lg(Na/Li)+ 0.44] � 273.15,Na-K (Giggenbach, 1988): TNa-K = 1390/[1.75 � lg(Na/K)] �273.15, andNa-K-Ca (Fournier and Truesdell, 1973): TNa-K-Ca = 1647/{lg(Na/K) + (4/3)[lg(
pCa/Na) + 2.06] + 2.47} � 273.15,
where S is the concentration of SiO2 in the water (mg/L), and K, Mg,Na, Li, and Ca represent the concentrations (mg/L) of the corre-sponding elements.
3.2.4. Circulation depth
Z ¼ ðTZ � T0Þ=Gþ Z0; ð1Þwhere Z is the circulation depth (m); Tz is the temperature of thegeothermal reservoir calculated by a reasonable geothermometer(�C); T0 is the local annual average temperature (�C); G is thermalgradient (�C/m); and Z0 is the thickness of the constant temperaturezone (m). The average temperature in this area is 17 �C, as men-tioned above, and therefore, T0 = 17 �C, Z0 = 0, and G = 0.03 �C/m(Cheng et al., 2015) here.
3.2.5. Recharge altitude and its annual average air temperature basedon dD
Because the study area has a regional scale, the recharge alti-tude and its annual average air temperature can be calculatedusing the general equation for China (Zhou et al., 2010):
dD ¼ �0:03ALT� 27; ð2Þ
dD ¼ 3T� 92; ð3Þwhere ALT is the altitude (m), and T is the annual air temperature(�C) in the recharge area.
4. Results
4.1. Hydrogeochemistry of the thermal water samples
The physical and chemical indexes of the 36 thermal watersamples in the study area are presented in Table 1. Except for no.21 (�7.32%), the relative uncertainties of all the ion equilibria areless than 5% (Table 1). The cation molarity (TZ� = HCO3
� + 2-SO4
2� + Cl�) is 24.3–47.6 meq/L, and the anion molarity
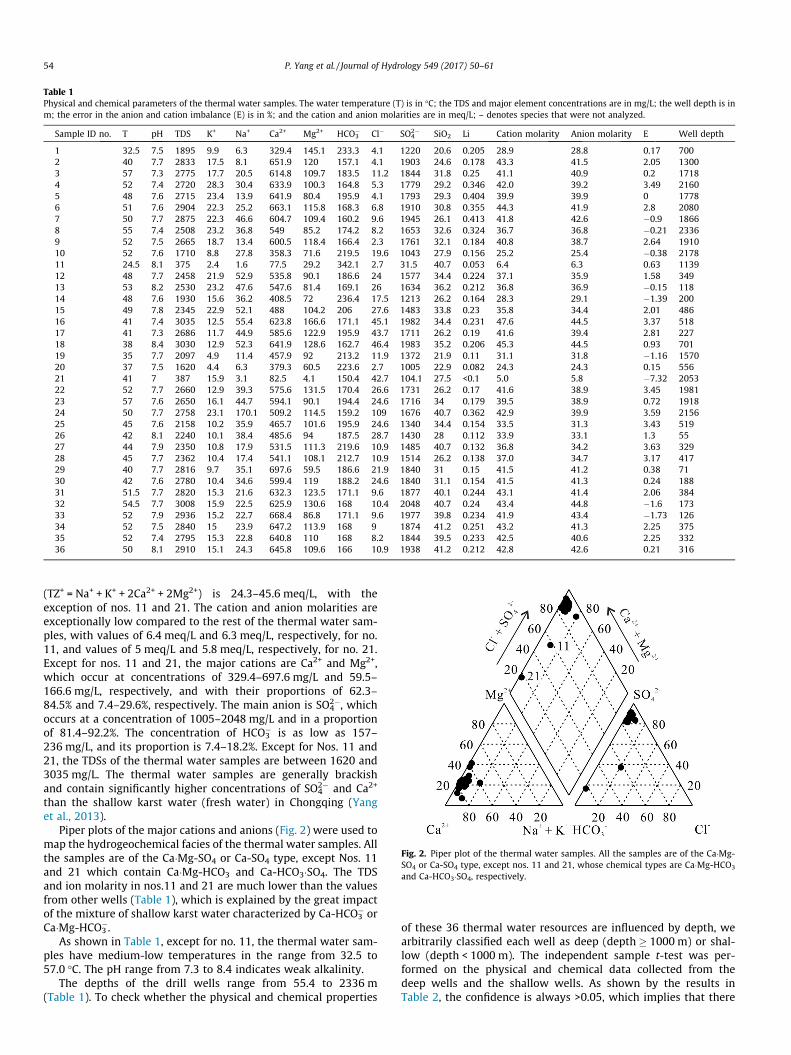
Table 1Physical and chemical parameters of the thermal water samples. The water temperature (T) is in �C; the TDS and major element concentrations are in mg/L; the well depth is inm; the error in the anion and cation imbalance (E) is in %; and the cation and anion molarities are in meq/L; – denotes species that were not analyzed.
Sample ID no. T pH TDS K+ Na+ Ca2+ Mg2+ HCO3� Cl� SO4
2� SiO2 Li Cation molarity Anion molarity E Well depth
1 32.5 7.5 1895 9.9 6.3 329.4 145.1 233.3 4.1 1220 20.6 0.205 28.9 28.8 0.17 7002 40 7.7 2833 17.5 8.1 651.9 120 157.1 4.1 1903 24.6 0.178 43.3 41.5 2.05 13003 57 7.3 2775 17.7 20.5 614.8 109.7 183.5 11.2 1844 31.8 0.25 41.1 40.9 0.2 17184 52 7.4 2720 28.3 30.4 633.9 100.3 164.8 5.3 1779 29.2 0.346 42.0 39.2 3.49 21605 48 7.6 2715 23.4 13.9 641.9 80.4 195.9 4.1 1793 29.3 0.404 39.9 39.9 0 17786 51 7.6 2904 22.3 25.2 663.1 115.8 168.3 6.8 1910 30.8 0.355 44.3 41.9 2.8 20807 50 7.7 2875 22.3 46.6 604.7 109.4 160.2 9.6 1945 26.1 0.413 41.8 42.6 �0.9 18668 55 7.4 2508 23.2 36.8 549 85.2 174.2 8.2 1653 32.6 0.324 36.7 36.8 �0.21 23369 52 7.5 2665 18.7 13.4 600.5 118.4 166.4 2.3 1761 32.1 0.184 40.8 38.7 2.64 191010 52 7.6 1710 8.8 27.8 358.3 71.6 219.5 19.6 1043 27.9 0.156 25.2 25.4 �0.38 217811 24.5 8.1 375 2.4 1.6 77.5 29.2 342.1 2.7 31.5 40.7 0.053 6.4 6.3 0.63 113912 48 7.7 2458 21.9 52.9 535.8 90.1 186.6 24 1577 34.4 0.224 37.1 35.9 1.58 34913 53 8.2 2530 23.2 47.6 547.6 81.4 169.1 26 1634 36.2 0.212 36.8 36.9 �0.15 11814 48 7.6 1930 15.6 36.2 408.5 72 236.4 17.5 1213 26.2 0.164 28.3 29.1 �1.39 20015 49 7.8 2345 22.9 52.1 488 104.2 206 27.6 1483 33.8 0.23 35.8 34.4 2.01 48616 41 7.4 3035 12.5 55.4 623.8 166.6 171.1 45.1 1982 34.4 0.231 47.6 44.5 3.37 51817 41 7.3 2686 11.7 44.9 585.6 122.9 195.9 43.7 1711 26.2 0.19 41.6 39.4 2.81 22718 38 8.4 3030 12.9 52.3 641.9 128.6 162.7 46.4 1983 35.2 0.206 45.3 44.5 0.93 70119 35 7.7 2097 4.9 11.4 457.9 92 213.2 11.9 1372 21.9 0.11 31.1 31.8 �1.16 157020 37 7.5 1620 4.4 6.3 379.3 60.5 223.6 2.7 1005 22.9 0.082 24.3 24.3 0.15 55621 41 7 387 15.9 3.1 82.5 4.1 150.4 42.7 104.1 27.5 <0.1 5.0 5.8 �7.32 205322 52 7.7 2660 12.9 39.3 575.6 131.5 170.4 26.6 1731 26.2 0.17 41.6 38.9 3.45 198123 57 7.6 2650 16.1 44.7 594.1 90.1 194.4 24.6 1716 34 0.179 39.5 38.9 0.72 191824 50 7.7 2758 23.1 170.1 509.2 114.5 159.2 109 1676 40.7 0.362 42.9 39.9 3.59 215625 45 7.6 2158 10.2 35.9 465.7 101.6 195.9 24.6 1340 34.4 0.154 33.5 31.3 3.43 51926 42 8.1 2240 10.1 38.4 485.6 94 187.5 28.7 1430 28 0.112 33.9 33.1 1.3 5527 44 7.9 2350 10.8 17.9 531.5 111.3 219.6 10.9 1485 40.7 0.132 36.8 34.2 3.63 32928 45 7.7 2362 10.4 17.4 541.1 108.1 212.7 10.9 1514 26.2 0.138 37.0 34.7 3.17 41729 40 7.7 2816 9.7 35.1 697.6 59.5 186.6 21.9 1840 31 0.15 41.5 41.2 0.38 7130 42 7.6 2780 10.4 34.6 599.4 119 188.2 24.6 1840 31.1 0.154 41.5 41.3 0.24 18831 51.5 7.7 2820 15.3 21.6 632.3 123.5 171.1 9.6 1877 40.1 0.244 43.1 41.4 2.06 38432 54.5 7.7 3008 15.9 22.5 625.9 130.6 168 10.4 2048 40.7 0.24 43.4 44.8 �1.6 17333 52 7.9 2936 15.2 22.7 668.4 86.8 171.1 9.6 1977 39.8 0.234 41.9 43.4 �1.73 12634 52 7.5 2840 15 23.9 647.2 113.9 168 9 1874 41.2 0.251 43.2 41.3 2.25 37535 52 7.4 2795 15.3 22.8 640.8 110 168 8.2 1844 39.5 0.233 42.5 40.6 2.25 33236 50 8.1 2910 15.1 24.3 645.8 109.6 166 10.9 1938 41.2 0.212 42.8 42.6 0.21 316
Fig. 2. Piper plot of the thermal water samples. All the samples are of the Ca�Mg-SO4 or Ca-SO4 type, except nos. 11 and 21, whose chemical types are Ca�Mg-HCO3
and Ca-HCO3�SO4, respectively.
54 P. Yang et al. / Journal of Hydrology 549 (2017) 50–61
(TZ+ = Na+ + K+ + 2Ca2+ + 2Mg2+) is 24.3–45.6 meq/L, with theexception of nos. 11 and 21. The cation and anion molarities areexceptionally low compared to the rest of the thermal water sam-ples, with values of 6.4 meq/L and 6.3 meq/L, respectively, for no.11, and values of 5 meq/L and 5.8 meq/L, respectively, for no. 21.Except for nos. 11 and 21, the major cations are Ca2+ and Mg2+,which occur at concentrations of 329.4–697.6 mg/L and 59.5–166.6 mg/L, respectively, and with their proportions of 62.3–84.5% and 7.4–29.6%, respectively. The main anion is SO4
2�, whichoccurs at a concentration of 1005–2048 mg/L and in a proportionof 81.4–92.2%. The concentration of HCO3
� is as low as 157–236 mg/L, and its proportion is 7.4–18.2%. Except for Nos. 11 and21, the TDSs of the thermal water samples are between 1620 and3035 mg/L. The thermal water samples are generally brackishand contain significantly higher concentrations of SO4
2� and Ca2+
than the shallow karst water (fresh water) in Chongqing (Yanget al., 2013).
Piper plots of the major cations and anions (Fig. 2) were used tomap the hydrogeochemical facies of the thermal water samples. Allthe samples are of the Ca�Mg-SO4 or Ca-SO4 type, except Nos. 11and 21 which contain Ca�Mg-HCO3 and Ca-HCO3�SO4. The TDSand ion molarity in nos.11 and 21 are much lower than the valuesfrom other wells (Table 1), which is explained by the great impactof the mixture of shallow karst water characterized by Ca-HCO3
� orCa�Mg-HCO3
�.As shown in Table 1, except for no. 11, the thermal water sam-
ples have medium-low temperatures in the range from 32.5 to57.0 �C. The pH range from 7.3 to 8.4 indicates weak alkalinity.
The depths of the drill wells range from 55.4 to 2336 m(Table 1). To check whether the physical and chemical properties
of these 36 thermal water resources are influenced by depth, wearbitrarily classified each well as deep (depth � 1000 m) or shal-low (depth < 1000 m). The independent sample t-test was per-formed on the physical and chemical data collected from thedeep wells and the shallow wells. As shown by the results inTable 2, the confidence is always >0.05, which implies that there
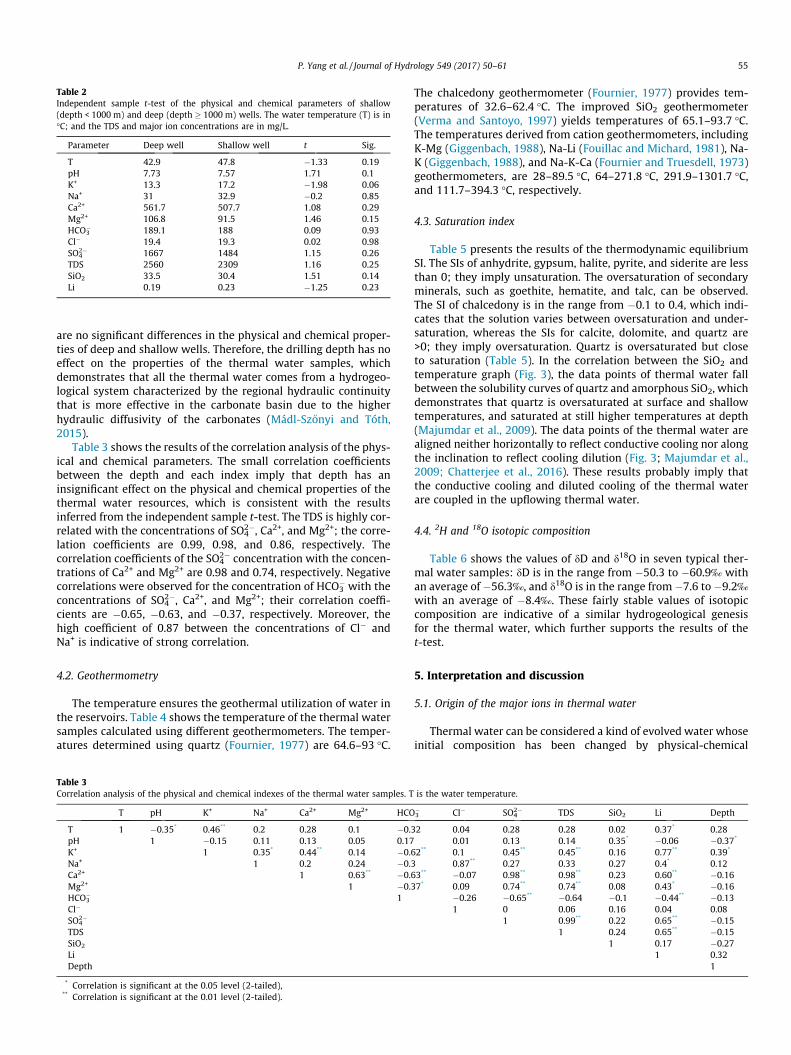
Table 2Independent sample t-test of the physical and chemical parameters of shallow(depth < 1000 m) and deep (depth � 1000 m) wells. The water temperature (T) is in�C; and the TDS and major ion concentrations are in mg/L.
Parameter Deep well Shallow well t Sig.
T 42.9 47.8 �1.33 0.19pH 7.73 7.57 1.71 0.1K+ 13.3 17.2 �1.98 0.06Na+ 31 32.9 �0.2 0.85Ca2+ 561.7 507.7 1.08 0.29Mg2+ 106.8 91.5 1.46 0.15HCO3
� 189.1 188 0.09 0.93Cl� 19.4 19.3 0.02 0.98SO4
2� 1667 1484 1.15 0.26TDS 2560 2309 1.16 0.25SiO2 33.5 30.4 1.51 0.14Li 0.19 0.23 �1.25 0.23
P. Yang et al. / Journal of Hydrology 549 (2017) 50–61 55
are no significant differences in the physical and chemical proper-ties of deep and shallow wells. Therefore, the drilling depth has noeffect on the properties of the thermal water samples, whichdemonstrates that all the thermal water comes from a hydrogeo-logical system characterized by the regional hydraulic continuitythat is more effective in the carbonate basin due to the higherhydraulic diffusivity of the carbonates (Mádl-Sz}onyi and Tóth,2015).
Table 3 shows the results of the correlation analysis of the phys-ical and chemical parameters. The small correlation coefficientsbetween the depth and each index imply that depth has aninsignificant effect on the physical and chemical properties of thethermal water resources, which is consistent with the resultsinferred from the independent sample t-test. The TDS is highly cor-related with the concentrations of SO4
2�, Ca2+, and Mg2+; the corre-lation coefficients are 0.99, 0.98, and 0.86, respectively. Thecorrelation coefficients of the SO4
2� concentration with the concen-trations of Ca2+ and Mg2+ are 0.98 and 0.74, respectively. Negativecorrelations were observed for the concentration of HCO3
� with theconcentrations of SO4
2�, Ca2+, and Mg2+; their correlation coeffi-cients are �0.65, �0.63, and �0.37, respectively. Moreover, thehigh coefficient of 0.87 between the concentrations of Cl� andNa+ is indicative of strong correlation.
4.2. Geothermometry
The temperature ensures the geothermal utilization of water inthe reservoirs. Table 4 shows the temperature of the thermal watersamples calculated using different geothermometers. The temper-atures determined using quartz (Fournier, 1977) are 64.6–93 �C.
Table 3Correlation analysis of the physical and chemical indexes of the thermal water samples. T
T pH K+ Na+ Ca2+ Mg2+ HCO
T 1 �0.35* 0.46** 0.2 0.28 0.1 �0.3pH 1 �0.15 0.11 0.13 0.05 0.17K+ 1 0.35* 0.44** 0.14 �0.6Na+ 1 0.2 0.24 �0.3Ca2+ 1 0.63** �0.6Mg2+ 1 �0.3HCO3
� 1Cl�
SO42�
TDSSiO2
LiDepth
* Correlation is significant at the 0.05 level (2-tailed),** Correlation is significant at the 0.01 level (2-tailed).
The chalcedony geothermometer (Fournier, 1977) provides tem-peratures of 32.6–62.4 �C. The improved SiO2 geothermometer(Verma and Santoyo, 1997) yields temperatures of 65.1–93.7 �C.The temperatures derived from cation geothermometers, includingK-Mg (Giggenbach, 1988), Na-Li (Fouillac and Michard, 1981), Na-K (Giggenbach, 1988), and Na-K-Ca (Fournier and Truesdell, 1973)geothermometers, are 28–89.5 �C, 64–271.8 �C, 291.9–1301.7 �C,and 111.7–394.3 �C, respectively.
4.3. Saturation index
Table 5 presents the results of the thermodynamic equilibriumSI. The SIs of anhydrite, gypsum, halite, pyrite, and siderite are lessthan 0; they imply unsaturation. The oversaturation of secondaryminerals, such as goethite, hematite, and talc, can be observed.The SI of chalcedony is in the range from �0.1 to 0.4, which indi-cates that the solution varies between oversaturation and under-saturation, whereas the SIs for calcite, dolomite, and quartz are>0; they imply oversaturation. Quartz is oversaturated but closeto saturation (Table 5). In the correlation between the SiO2 andtemperature graph (Fig. 3), the data points of thermal water fallbetween the solubility curves of quartz and amorphous SiO2, whichdemonstrates that quartz is oversaturated at surface and shallowtemperatures, and saturated at still higher temperatures at depth(Majumdar et al., 2009). The data points of the thermal water arealigned neither horizontally to reflect conductive cooling nor alongthe inclination to reflect cooling dilution (Fig. 3; Majumdar et al.,2009; Chatterjee et al., 2016). These results probably imply thatthe conductive cooling and diluted cooling of the thermal waterare coupled in the upflowing thermal water.
4.4. 2H and 18O isotopic composition
Table 6 shows the values of dD and d18O in seven typical ther-mal water samples: dD is in the range from �50.3 to �60.9‰ withan average of �56.3‰, and d18O is in the range from�7.6 to �9.2‰with an average of �8.4‰. These fairly stable values of isotopiccomposition are indicative of a similar hydrogeological genesisfor the thermal water, which further supports the results of thet-test.
5. Interpretation and discussion
5.1. Origin of the major ions in thermal water
Thermal water can be considered a kind of evolved water whoseinitial composition has been changed by physical-chemical
is the water temperature.
3� Cl� SO4
2� TDS SiO2 Li Depth
2 0.04 0.28 0.28 0.02 0.37* 0.280.01 0.13 0.14 0.35* �0.06 �0.37*
2** 0.1 0.45** 0.45** 0.16 0.77** 0.39*
0.87** 0.27 0.33 0.27 0.4* 0.123** �0.07 0.98** 0.98** 0.23 0.60** �0.167* 0.09 0.74** 0.74** 0.08 0.43* �0.16
�0.26 �0.65** �0.64 �0.1 �0.44** �0.131 0 0.06 0.16 0.04 0.08
1 0.99** 0.22 0.65** �0.151 0.24 0.65** �0.15
1 0.17 �0.271 0.32
1

Table 4Temperatures of the thermal water samples determined using different geothermometers. The reservoir temperature is the average calculated using quartz and improved SiO2
geothermometers. The circulation depth is in m; all other values are in �C; –: no datum.
SampleID no.
SiO2 geothermometers Cation geothermometers Reservoirtemperature
Circulationdepth
Quartz(Fournier,1977)
Chalcedony(Fournier,1977)
Improved SiO2
(Verma andSantoyo, 1997)
K-Mg(Giggenbach,1988)
Na-Li (Fouillacand Michard,1981)
Na-K(Giggenbach,1988)
Na-K-Ca (Fournierand Truesdell,1973)
1 64.6 32.57 65.1 39.1 271.8 440.3 163.1 64.8 1579.12 71.4 39.69 72.1 52.5 226.3 394.2 130.4 71.8 1806.83 81.8 50.56 82.6 53.6 172.5 551.4 150 82.2 2151.64 78.3 46.89 79.1 64.8 167 535.2 177.1 78.7 2036.15 78.4 46.97 79.2 63.1 257.6 430 153.1 78.8 2039.46 80.5 49.19 81.3 58 184.8 545.6 157.2 80.9 2108.77 73.8 42.17 74.5 58.6 147.7 698.8 177 74.2 18868 82.8 51.67 83.6 62.2 147.2 623.8 185.5 83.2 2184.69 82.3 51.09 83.1 54 182.3 461.2 148.1 82.7 2168.110 76.5 44.95 77.2 43.6 116.7 840.7 173.8 76.8 1975.111 92.5 61.92 93.2 28 271 449.5 222.7 92.9 2503.112 85.2 54.17 86 60.3 99.7 744.2 191.7 85.6 2263.813 87.3 56.43 88.1 62.8 102.6 693.3 190.6 87.7 2333.114 74 42.34 74.7 55.4 103.7 730.5 196.2 74.3 1892.615 84.4 53.28 85.2 59.7 102.1 725.4 204.8 84.8 2237.416 85.2 54.17 86 42.3 98.8 987.2 147.8 85.6 2263.817 74 42.34 74.7 44.1 99.7 917.3 147.6 74.3 1892.618 86.2 55.21 87 45.5 95.6 943.9 145.8 86.6 2296.819 67 35.02 67.5 30.3 154.1 731.7 111.7 67.2 1658.320 68.6 36.7 69.2 32.2 178.3 596.6 114.7 68.9 1712.721 75.8 44.26 76.6 89.5 – 291.9 394.3 76.2 1953.622 74 42.34 74.7 45.4 101 823.6 151.7 74.3 1892.623 84.6 53.55 85.4 53.8 96.5 790.6 161.4 85 224424 92.5 61.92 93.2 58.9 63.9 1301.7 224.9 92.9 2503.125 85.2 54.17 86 43.2 100.5 882.5 159.1 85.6 2263.826 76.6 45.08 77.4 43.8 79.4 914 155.8 77 198027 92.5 61.92 93.2 43.4 134.6 635.5 138.6 92.9 2503.128 74 42.34 74.7 43.1 139.8 636.1 135.1 74.3 1892.629 80.8 49.49 81.6 47.5 100.3 893.9 120.3 81.2 2118.630 80.9 49.61 81.7 42 102.6 860.6 135.8 81.3 2121.931 91.8 61.17 92.6 49.3 166.5 595.8 141.3 92.2 2481.632 92.5 61.92 93.2 49.6 161.7 596.5 144.7 92.9 2503.133 91.5 60.85 92.2 52.9 159.1 608.8 136.9 91.9 2470.134 93 62.44 93.7 49.8 160.5 625.7 139.9 93.4 2519.635 91.2 60.52 91.9 50.6 158.3 609.2 141 91.6 2460.236 93 62.43 93.7 50.3 146.5 628.1 140.7 93.3 2519.6
56 P. Yang et al. / Journal of Hydrology 549 (2017) 50–61
processes (Goldscheider et al., 2010). High concentration of SO42�
frequently occurs in thermal water discharged from carbonateaquifers (Gunn et al., 2006; Goldscheider et al., 2010). As shownin Table 1 and Fig. 2, SO4
2� and Ca2+ are the dominant anion andcation, respectively, in the thermal water samples, and the concen-tration of SO4
2� is identical to its value in the volcanic hot spring(Yoshiike, 2003). The correlation between SO4
2� and Ca2+ is positivewith a coefficient of 0.98 (Table 3). The SIs of gypsum and anhy-drite in most of the thermal water samples are negative or zero(Table 5), which indicates that most of the samples are undersatu-rated with respect to gypsum and anhydrite. This suggests that theSO4
2� concentrations of these thermal water resources may be con-trolled by a steady state dissolution process (Grasby et al., 2000).Therefore, SO4
2� and Ca2+ are derived from the dissolution of evap-orates such as gypsum and anhydrite. The correlation between Na+
and Cl� is positive with a correlation coefficient of 0.87 (Table 3),which implies a provenance involving salt (NaCl) dissolution. Themajor reservoir consists of T1j2, T1j3, and T1j4 strata, and the sec-ondary reservoir is composed of T2l and T1j1 carbonate strata witha total thickness of 540 m, as mentioned above. The T1j2 and T1j4
strata in the Sichuan basin were deposited during the regressiveperiod in which seawater was separated, condensed, and salinizedto form a salty lagoon and Sabkha sedimentation. Therefore, twosedimentary sequences with periodic marine carbonate?sulfate?chloride (NaCl) formed (Guo et al., 1996), which explains
the high correlations between SO42� and Ca2+ and between Na+
and Cl� (Table 3).In the thermal water samples, HCO3
� is not a predominant anion(Fig. 2); its molarity is much lower than that of SO4
2�. This phe-nomenon results from the production of Ca2+ during the dissolu-tion of gypsum or/and anhydrite, which involves solubilityreduction of CaCO3 and CaMg(CO3)2 and precipitation (e.g.,Plummer et al., 1990; Bischoff et al., 1994; Dobrzynski, 2007; Jinet al., 2010). This phenomenon is called the common ion effect,which makes the SIs of calcite and dolomite positive (Table 5). Thisfact can be verified by the correlation coefficients, which are �0.65for SO4
2� and HCO3� and �0.63 for Ca2+ and HCO3
� (Table 3).The concentration of Mg2+ in the thermal water samples is 3–4
times the value for some volcanic hot springs (Yoshiike, 2003) and10 times the value for the shallow karst water in Chongqing (Yanget al., 2013). The correlation coefficient for Mg2+ and HCO3
� is �0.37(Table 3), which indicates that this high concentration of Mg2+ isnot derived from the dissolution of dolomite. This can be verifiedusing the scatter diagram of Mg2+ and HCO3
� (Fig. 4). If the datapoints are located around the line representing a 1:4 ratio, this sug-gests that the Mg2+ is derived from congruent dissolution of dolo-mite (Wang et al., 2006). It can be seen that most data pointsexcept nos. 11 and 21, are far from the line (Fig. 4), which suggeststhat Mg2+ in the most thermal water is not the result of congruentdissolution of dolomite (Wang et al., 2006). The data points of nos.

Table 5Calculated SI of each thermal water sample. –: no datum.
Sample ID no. Anhydrite Calcite Chalcedony Dolomite Fluorite Goethite Gypsum Halite Hematite Quartz Siderite Talc
1 �0.5 0.7 0 1.4 0 9.3 �0.4 �9.3 20.6 0.4 0 2.42 �0.1 1 0 1.6 0.2 9.2 0 �9.3 20.4 0.4 �1.1 4.13 0 0.8 �0.1 1.3 0.1 8.1 0 �8.4 18.4 0.3 �1.9 3.54 �0.1 0.9 �0.1 1.4 0.2 9 0 �8.5 20.1 0.3 �1.2 3.85 �0.1 1.1 0 1.7 0.4 9 0 �9 20 0.4 �1.4 4.26 �0.1 1 0 1.7 0.2 9.1 0 �8.5 20.3 0.3 �1.4 4.77 �0.1 1 �0.1 1.7 0.2 9.1 0 �8.1 20.2 0.3 �1.5 4.88 �0.1 0.9 0 1.4 0.2 9 �0.1 �8.3 20.1 0.3 �1.3 49 �0.1 1 0 1.6 0.1 8.6 �0.1 �9.3 19.2 0.4 �1.8 4.610 �0.4 1 �0.1 1.7 0.2 8.2 �0.3 �8 18.4 0.3 �2.1 4.211 �2.1 1 0.4 1.9 �1.3 7.9 �1.9 �9.9 17.8 0.8 �2 5.112 �0.2 1.1 0.1 1.9 0.2 7.6 �0.1 �7.6 17.4 0.4 �2.9 5.413 �0.1 1.5 0 2.7 0.3 – �0.1 �7.6 – 0.4 – 8.514 �0.3 1 �0.1 1.7 0 7.5 �0.3 �7.9 17.1 0.3 �2.6 3.815 �0.2 1.2 0 2.2 0.2 7.2 �0.2 �7.6 16.4 0.4 �3.5 616 �0.2 0.8 0.1 1.4 0.3 7.8 0 �7.3 17.7 0.5 �1.9 3.617 �0.2 0.7 0 1.1 0.3 7 �0.1 �7.4 16 0.4 �2.3 1.818 �0.2 1.6 0.2 2.9 0.4 8.5 0 �7.3 19 0.5 �3 8.719 �0.4 1 0 1.7 0.1 7.5 �0.2 �8.6 17.1 0.4 �2.4 3.420 �0.5 0.8 0 1.2 �0.4 8.3 �0.3 �9.4 18.7 0.4 �1.2 221 �1.7 �0.2 0 �1.2 �0.4 7.7 �1.5 �8.5 17.4 0.4 �1.1 �322 �0.1 1.1 �0.1 1.9 0.1 9.1 �0.1 �7.7 20.3 0.3 �1.6 5.423 �0.1 1.1 0 1.9 0.3 8.8 �0.1 �7.7 19.7 0.3 �1.9 5.224 �0.2 1 0.1 1.8 0.1 8.5 �0.1 �6.5 19.1 0.5 �2.1 5.725 �0.3 1 0.1 1.7 0.1 8.3 �0.2 �7.8 18.7 0.5 �1.8 4.526 �0.3 1.4 0 2.5 0.1 – �0.2 �7.7 – 0.4 – 6.827 �0.3 1.3 0.2 2.3 0.1 8.4 �0.1 �8.4 19 0.5 �2.1 6.328 �0.2 1.2 0 2.1 0.1 8.4 �0.1 �8.4 18.9 0.3 �2 529 �0.1 1.1 0.1 1.6 0.5 7.8 0 �7.8 17.6 0.5 �2.4 3.830 �0.2 1 0.1 1.7 0.3 7.4 0 �7.8 17 0.5 �2.6 4.331 �0.1 1.1 0.1 2 0.2 8.2 0 �8.4 18.6 0.4 �2.4 6.132 0 1.2 0.1 2.1 0.1 7.6 0 �8.4 17.4 0.4 �3.2 6.533 0 1.3 0.1 2.1 0.2 7.9 0 �8.4 18 0.4 �3.1 6.534 �0.1 1 0.1 1.7 0.2 7.4 0 �8.4 17 0.5 �2.9 535 �0.1 0.9 0.1 1.4 0.2 8.3 0 �8.5 18.8 0.4 �1.8 4.236 �0.1 1.5 0.1 2.6 0.3 – 0 �8.3 – 0.5 – 8.3
Fig. 3. Correlation between the SiO2 concentration and the temperature reflectingthe coupling of conductive cooling and dilution cooling.
P. Yang et al. / Journal of Hydrology 549 (2017) 50–61 57
11 and 21 are closer to the 1:4 line, which are attributed to themixture of shallow karst groundwater. The correlation coefficientof 0.74 between Mg2+ and SO4
2� demonstrates that the Mg2+ origi-nates from the dissolution of magnesium sulfate.
In general, the concentrations of Ca2+ and SO42� in the thermal
water of the Chongqing main urban area are high due to the disso-lution of gypsum or/and anhydrite, which can restrain the dissolu-tion of carbonate and reduce the concentration of HCO3
�.
5.2. Reservoir temperature and circulation depth
Care must be taken to select the appropriate geothermometerto estimate the reservoir temperature and avoid incorrect resultsor explanations. Distinct differences were observed among thereservoir temperatures (Table 4), which emphasizes the necessityof selecting a suitable geothermometer for the study area.
The Na-K-Mg Giggenbach diagram (Giggenbach, 1988) can beused to identify the water-rock equilibrium and the degree of mix-ing. As shown in Fig. 5, the data for all the thermal water samplesare distributed in the right corner representing ‘‘immature water”,which indicates possible mixing with cold water as the thermalwater rises. Fig. 3 also demonstrates the potential effect of shallowcold water, which is to cause over- or under-estimated tempera-tures when cation thermometers, such as Na-K, Na-K-Ca, Na-Li,and K-Mg thermometers, are used (Table 4). Therefore, cationgeothermometers are inappropriate for evaluating reservoir tem-peratures (Verma and Santoyo, 1997).
Some of the calculated temperatures given by the chalcedonythermometer (Fournier, 1977) listed in Table 4 are lower thanthe measured temperatures listed in Table 1. The average calcu-lated temperature based on the chalcedony thermometer is50.6 �C, which is slightly higher than the measured temperature(46.5 �C). Therefore, the chalcedony thermometer is not suitable.
The original SiO2 content is preserved without significant lossduring the ascent of the thermal water. No secondary equilibriumoccurs, and the SiO2 content is close to the solubility curve ofquartz (Fig. 3). The stable SiO2 content may be the result ofconductive cooling in the upper low-temperature strata and

Table 6dD and d18O in typical thermal water samples. dD and d18O are in ‰; the recharge altitude is in m; and the annual average air temperature is in �C.
Sample ID no. dD d18O Recharge altitude Annual average air temperature
2 �52 �7.6 838 13.34 �61 �9.2 1130 10.415 �50 �7.7 778 13.916 �60 �9.1 1103 10.626 �56 �8.7 960 10.432 �57 �8.4 1013 10.433 �58 �8.1 1020 10.4Mean value �56 �8.4 977 11.3
Fig. 4. Correlation between Mg2+ and HCO3� in the thermal water samples (modified
from Wang et al., 2006). That most samples are far from the line representing a 1:4ratio indicates that the dissolution of dolomite does not mainly contribute to thehigh concentration of Mg2+.
Fig. 5. Na–K–Mg Giggenbach plot (Giggenbach, 1988) of the thermal watersamples. The water samples are located in the ‘‘immature water” region, whichindicates that the thermal water mixes with the surface cold water.
58 P. Yang et al. / Journal of Hydrology 549 (2017) 50–61
diluted cooling by the cold surface water. Therefore, it is theoreti-cally reliable to estimate the reservoir temperature using quartzand improved SiO2 thermometers (Fournier, 1977; Verma andSantoyo, 1997), which yield reservoir temperatures of 64.6–93 �Cand 65.1–93.7 �C, respectively, with average values of 81.8 �C and82.5 �C, respectively. The average reservoir temperatures calcu-lated using these two methods are between 64.8 and 93.4 �C(Table 4). When the reservoir’s temperature is over 70 �C, the sys-tem achieves quartz equilibrium (Fournier, 1983). All the thermal
water resources are oversaturated with quartz (Table 5 andFig. 3). Additionally, most reservoir temperatures estimated usingquartz geothermometers are higher than 70 �C (Fournier, 1983),which suggests that the quartz geothermometer is the best for thisregion.
The circulation depth is one of the significant factors influencingthe reservoir’s temperature, as well as one of the important param-eters in geothermal studies that analyze the origin and formationmechanism of thermal water and assess potential geothermalreservoirs. The circulation depth calculated using Eq. (1) is 1579–2520 m with an average of 2150 m (Table 4), which is consistentwith the reservoir depth revealed by the well. For example, inthe well called Tong-5, which was drilled four km southeast of wellno. 14 in 1993, the layer with low permeability at the bottom ofthe geothermal reservoir (T1j) was 2002 m deep, which is approx-imately consistent with the estimated average circulation depth of2150 m.
5.3. Recharge of the thermal water resources based on an isotopicanalysis
The source of the water is an important factor when consideringthe heat source of thermal water. Hydrogen and oxygen isotopescan, to some extent, trace the circulation of water through theatmosphere and are, therefore, widely applied in studies of the ori-gin of thermal water (e.g., Pastorelli et al., 1999; Chandrajith et al.,2013; Chatterjee et al., 2016). The values of dD and d18O obtainedfrom seven wells, nos. 2, 4, 15, 16, 26, 32, and 33 (Table 6), aregraphed and compared with the global meteoric water line(GMWL; Craig, 1961) and the Chongqing meteoric water line(CMWL; Li et al., 2010). As shown in Fig. 6, all the data points areclose to the GMWL and the CMWL without shifting. This impliesthat local precipitation is the major factor in recharging thegeothermal water, which is consistent with other studies demon-strating meteoric origins for thermal water around the world(e.g., Grasby et al., 2000; Ahmad et al., 2001; Lee et al., 2011;Moreira and Fernández, 2015), especially in carbonate reservoirs(e.g., Goldscheider et al., 2010; Sun et al., 2016).
The values of dD for the thermal water resources show that therecharge altitude can be calculated to be 838–1130 m using Eq. (2),with an average of 977 m (Table 6). The annual temperature of therecharge area ranges from 10.4 to 13.9 �C, according to Eq. (3), andthe average is 11.3 �C (Table 6).
Dating by means of the radioactive carbon isotope 14C is one ofthe most useful methods for dating groundwater that is between1000 and 45,000 yrs old (Zhu and Murphy, 2000). This methodhas recently been well developed (Samborska et al., 2013). The14C data in this paper are from a geological investigation report(Chongqing Monitoring Station of Geological Environments,2009). According to the 14C analyses of nos. 2, 3, 5, and 8 at theGuanyinxia anticline, the 14C ages increase from the north to thesouth from 14830 ± 220 to 17550 ± 250 yrs, which indicates that

Fig. 6. Values of dD and d18O for the thermal water samples over the GlobalMeteoric Water Line (GMWL; Craig, 1961) and the Chongqing Meteoric Water Line(CMWL; Li et al., 2010).
P. Yang et al. / Journal of Hydrology 549 (2017) 50–61 59
the thermal water at the Guanyinxia anticline moves from thenorth to the south.
5.4. Conceptual model of thermal water circulation
In the surrounding area, Tongluoshan and Huayingshan, whichare approximately 175 km northeast (Fig. 1a), satisfy the elevation(838–1130 m) and annual air temperature (11.3 �C) criteria for thethermal water recharge area. The elevation of the highest peak inthese areas is 1704.1 m; the annual average temperature is11.5 �C, and the average precipitation is 1282.2 mm (Luo et al.,2013).
On the basis of the above interpretation and discussion, a con-ceptual regional flow model shown in Fig. 7 is proposed; thismodel is not intended to represent the detailed heterogeneityand anisotropy of the system, rather only its main features. Thepresence of a structurally weak zone, such as a permeable fault,is more favorable for the percolation of meteoric water to shallowdepths (Chandrajith et al., 2013). These regions exhibit two faults,
Fig. 7. Conceptual regional flow model of the circulation of thermal water. The horizont
the Tongluoshan fault and Huayingshan fault whose structureextends from northeast to southwest (Zhang et al., 2015; Shiet al., 2016) shown in Fig. 1a. Carbonate is widely distributed inthe Tongluoshan and Huayingshan areas, especially on the exposedanticline; caves, sinkholes, shafts, and fractures are well developedand acts as unconfined carbonate outcrops and provide ideal chan-nels for the vertical infiltration and recharge of meteoric water.
On the regional scale, groundwater movement from recharge todischarge areas is generally gravity (topography) driven (Tóth1963; Jiang et al., 2012; Mádl-Sz}onyi and Tóth, 2015; Mádl-Sz}onyi and Simon, 2016). Meteoric water falling in the Tonglu-oshan and Huayingshan areas percolates to the geothermal reser-voir and is heated continuously by the bedrock until it becomesthermal water. An ideal reservoir has a high hydraulic conductivityand large specific storage for long term productivity and is charac-terized by hydrostatic pressure-like conditions (Mádl-Sz}onyi andSimon, 2016). Deep carbonate rocks are often more permeablethan other reservoirs (Goldscheider et al., 2010). Based on informa-tion on the drilled wells in Chongqing, the geothermal reservoirs ofthe study area exhibit porosities of 3–4% (Cheng et al., 2015),which could provide good conditions to produce a high productiv-ity rate of thermal water. The high topographic gradient betweenthe higher altitude recharge areas of Tongluoshan, Huayingshanand the low-lying discharge zone in the main urban area ofChongqing drives the thermal water along the fault and the anti-cline core of the east Sichuan fold belts to the southwest (Figs. 1and 7). The pattern of thermal groundwater flow in our study areacharacterized by confined carbonate is similar to the confined partof Budapest in Hungary, where intense heat accumulation could beestablished under the confined part of a carbonate basin (Mádl-Sz}onyi and Tóth, 2015).
The residence time of the regional groundwater flow is rela-tively long; therefore, the water-rock interaction is sufficient tocontinuously dissolve evaporates during its transport (Fig. 7),which results in elevated TDS (Table 1). The dissolution of gypsumcould increase the porosity and the permeability in the carbonateaquifer, which can provide an initial secondary porosity to allowthe deep penetration of groundwater that is not saturated with cal-cite, and accelerate karstification and increase the productivity(Gunn et al., 2006). During the transport of the thermal water,the cover pressure is reduced along river cutting and in lower-elevation areas, which leads to natural exposures of thermal water
al and vertical scales in the model are not equal; some are decreased for visibility.

60 P. Yang et al. / Journal of Hydrology 549 (2017) 50–61
in the form of artesian hot springs that form a geothermal artesiankarstic system, as in the case reported by Frumkin and Gvirtzman(2006) or drainage in the form of drilled wells.
6. Conclusion
The thermal water in the main urban area of Chongqing comesfrom the karst aquifer formed by Lower and Middle Triassic car-bonate rock. Using its physical and chemical properties and thevalues of d18O, dD, and d14C, its origin, reservoir temperature, circu-lation depth, recharge, and drainage have been investigated.
The chemical types of most of the thermal water samples areCa�Mg-SO4 and Ca-SO4. The independent sample t-test demon-strates that the well depth has no effect on the physical and chem-ical properties. Concentrated SO4
2� and Ca2+ are formed through thedissolution of gypsum and anhydrite in the karst strata; the disso-lution of carbonate is restrained by the common ion effect, whichresults in dilute HCO3
�. Furthermore, Na+ and Cl� originate fromthe dissolution of salt in the strata.
The Na-K-Mg diagram shows that the thermal water is imma-ture, which indicates that cation thermometers (Fournier andTruesdell, 1973; Fouillac and Michard, 1981; Giggenbach, 1988)cannot be used. Quartz (Fournier, 1977) and improved SiO2 ther-mometers (Verma and Santoyo, 1997) are selected; they yieldreservoir temperatures in the range from 64.8 to 93.4 �C and circu-lation depths from 1579 to 2520 m with an average of 2150 m.
The d18O and dD values for the thermal water samples aremainly distributed near the local meteoric water line. Combinedwith the region’s geology and tectonic characteristics, a large vol-ume of meteoric water infiltrates through the unconfined carbon-ate outcrops in the Tongluoshan and Huayingshanregionsnortheast of the study area. The meteoric water infiltrates throughexposed carbonate karst channels to the geothermal reservoir. Inthis process, the water is continuously heated and driven by grav-ity along the fault and the anticline core to the southwest. In rivercutting and lower-elevation areas, the water is exposed in artesiansprings or drained in wells.
Acknowledgments
Special thanks are due to Wenjian Wu and Qiong Xiao, whogenerously provided the digital elevation model (DEM) data ofthe study area and one isotopic datum (sample no. 2), respectively.The authors also appreciate the constructive comments and sug-gestions by anonymous reviewers. Additional thanks are given toXinyi Xiang for her valuable comments. This work was supportedby the National Key Technology R&D Program of China (GrantNos. 2011BAC09B01, 2016YFC050230206), the 2014 Scientificand Technical Program of the Land Resource and Housing Manage-ment Bureau of Chongqing, China (Grant No. CQGT-KJ-2014056),and the Fundamental Research Funds for Central Universities(Grant Nos. XDJK2014A016, XDJK2016E022, XDJK2016E023,XDJK2016E042, and XDJK2016D046).
References
Ahmad, M., Akram, W., Hussain, S.D., Sajjad, M.I., Zafar, M.S., 2001. Origin andsubsurface history of geothermal water of Murtazabad area, Pakistan - anisotopic evidence. Appl. Radiat. Isot. 55 (5), 731–736. http://dx.doi.org/10.1016/S0969-8043(01)00119-1.
Bai, Y.T., Xu, Z.G., Zhang, J., Mao, D.Q., Luo, C., He, Y.Y., Liang, G.D., Lu, B., Bisesi, M.S.,Sun, Q.H., Xu, X.Y., Yang, W.Z., Liu, Q.Y., 2014. Regional impact of climate onJapanese encephalitis in areas located near the Three Gorges Dam. PLoS ONE 9(1), e84326. http://dx.doi.org/10.1371/journal.pone.0084326.
Bischoff, J.L., Juliá, R., Shanks III, W.C., Rosenbauer, R.J., 1994. Karstification withoutcarbonic-acid: bedrock dissolution by gypsum-driven dedolomitization. Geol.22 (11), 995–998. http://dx.doi.org/10.1130/0091-7613(1994) 022.
Can, I., 2002. A new improved Na/K geothermometer by artificial neuralnetworks. Geothermics 31, 751–760. http://dx.doi.org/10.1016/S0375-6505(02)00044-5.
Chandrajith, R., Barth, J.A.C., Subasinghe, N.D., Merten, D., Dissanayake, C.B., 2013.Geochemical and isotope characterization of geothermal spring waters in SriLanka: evidence for steeper than expected geothermal gradients. J. Hydrol. 476,360–369. http://dx.doi.org/10.1016/j.jhydrol.2012.11.004.
Chatterjee, S., Sharma, S., Ansari, M.A., Deodhar, A.S., Low, U., Sinha, U.K., Dash, A.,2016. Characterization of subsurface processes estimation of reservoirtemperature in Tural Rajwadi geothermal fields, Maharashtra, India.Geothermics 59, 77–89. http://dx.doi.org/10.1016/j.geothermics.2015.10.011.
Cheng, Q., Yang, H., Zeng, M., 2015. The formation and protection of karstgeothermal water resources in the main urban area of Chongqing. CarsologicaSin. 34 (3), 217–227. http://dx.doi.org/10.11932/karst20150303 (in Chinesewith English abstract).
Chongqing Monitoring Station of Geological Environments, 2009. Survey and EffectAssessment of the Water Quality of Thermal Waters and Mineral Waters in theMain Urban Area of Chongqing (in Chinese).
Craig, H., 1961. Isotopic variations in meteoric waters. Science 133 (3465), 1702–1703. http://dx.doi.org/10.1126/science.133.3465.1702.
D’Amore, F., Ramos-Candelaria, M.N., Seastres Jr, J., Ruaya, J.R., Nuti, S., 1993.Applications of gas chemistry in evaluating physical processes in the southernNegros (Palinpinon) geothermal field, Philippines. Geothermics 22, 535–553.http://dx.doi.org/10.1016/0375-6505(93)90035-L.
Dobrzynski, D., 2007. Chemical diversity of groundwater in the Carboniferous-Permian aquifer in the Unisław Slaski - Sokołowsko area (the Sudetes, Poland);a geochemical modelling approach. Acta Geol. Pol. 57 (1), 97–112.
Domenico, P.A., Palciauskas, V.V., 1973. Theoretical analysis of forced convectiveheat-transfer in regional groundwater flow. Geol. Soc. Am. Bull. 84 (12), 3803–3814. http://dx.doi.org/10.1130/0016-7606(1973) 84<3803:Taofch>2.0.Co;2.
Fouillac, C., Michard, G., 1981. Sodium/lithium ratio in water applied togeothermometry of geothermal reservoirs. Geothermics 10, 55–70. http://dx.doi.org/10.1016/0375-6505(81)90025-0.
Fournier, R.O., 1977. Chemical geothermometers and mixing models for geothermalsystems. Geothermics 5, 41–50. http://dx.doi.org/10.1016/0375-6505(77)90007-4.
Fournier, R.O., 1983. A method of calculating quartz solubilities in aqueous sodiumchloride solutions. Geochim. Cosmochim. Acta 47 (1–4), 579–586. http://dx.doi.org/10.1016/0016-7037(83)90279-X.
Fournier, R.O., Truesdell, A.H., 1973. An empirical Na-K-Ca geothermometer fornatural waters. Geochim. Cosmochim. Acta 37 (3), 1255–1275. http://dx.doi.org/10.1016/0016-7037(73)90060-4.
Frumkin, A., Gvirtzman, H., 2006. Cross-formational rising groundwater at anartesian karstic basin: the Ayalon Saline Anomaly. Israel. J. Hydrol. 318 (1–4),316–333. http://dx.doi.org/10.1016/j.jhydrol.2005.06.026.
Giggenbach, W.F., 1988. Geothermal solute equilibria. Derivation of Na-K-Mg-Cageoindicators. Geochim. Cosmochim. Acta 52, 2749–2765. http://dx.doi.org/10.1016/0016-7037(88)90143-3.
Goldscheider, N., Mádl-Sz}onyi, J., Er}oss, A., Schill, E., 2010. Review: thermal waterresources in carbonate rock aquifers. Hydrogeol. J. 18 (6), 1303–1318. http://dx.doi.org/10.1007/s10040-010-0611-3.
Grasby, S.E., Hutcheon, I., Krouse, H.R., 2000. The influence of water-rock interactionon the chemistry of thermal springs in western Canada. Appl. Geochem. 15 (4),439–454. http://dx.doi.org/10.1016/S0883-2927(99)00066-9.
Gunn, J., Bottrell, S.H., Lowe, D.J., Worthington, S.R.H., 2006. Deep groundwater flowand geochemical processes in limestone aquifers: evidence from thermalwaters in Derbyshire, England, UK. Hydrogeol. J. 14 (6), 868–881. http://dx.doi.org/10.1007/s10040-006-0022-7.
Guo, Z., Deng, K., Han, Y., Liu, Y., 1996. The Formation and Development of SichuanBasin. Geological Press, Beijing (in Chinese).
Jiang, X.W., Wan, L., Ge, S., Cao, G.L., Hou, G.C., Hu, F.S., Wang, X.S., Li, H.L., Liang, S.H., 2012. A quantitative study on accumulation of age mass around stagnationpoints in nested flow systems. Water Resour. Res. 48 (12), 771–784. http://dx.doi.org/10.1029/2012WR012509.
Jiang, X.W., Wang, X.S., Wan, L., Ge, S., 2011. An analytical study on stagnant pointsin nested flow systems in basins with depth-decaying hydraulic conductivity.Water Resour. Res. 47 (1), 128–139. http://dx.doi.org/10.1029/2010WR009346.
Jin, L., Siegel, D.I., Lautz, L.K., Mitchell, M.J., Dahms, D.E., Mayer, B., 2010. Calciteprecipitation driven by the common ion effect during groundwater–surface-water mixing: a potentially common process in streams with geologic settingscontaining gypsum. Geol. Soc. Am. Bull. 122 (7–8), 1027–1038. http://dx.doi.org/10.1130/B30011.1.
Kong, Y., Pang, Z., Shao, H., Hu, S., Kolditz, O., 2014. Recent studies on hydrothermalsystems in China: a review. Geotherm. Energy 2, 19. http://dx.doi.org/10.1186/s40517-014-0019-8.
Lee, S., Kim, T., Lee, T.J., 2011. Strontium isotope geochemistry and its geochemicalimplication from hot spring waters in South Korea. J. Volcanol. Geotherm. Res.208 (1–2), 12–22. http://dx.doi.org/10.1016/j.jvolgeores.2011.09.004.
Li, D., Liu, D., 2011. Geothermal reservoir structure and runoff flow recharge ofgeothermal water resources in Chongqing City. J. Hohai Univ. (Nat. Sci.) 39(4),372–376. http://dx.doi.org/10.3876/j.issn.1000-1980.2011.04.004 (in Chinesewith English abstract).
Li, T., Li, H., Shen, C., Yang, C., Li, J., Yi, C., Yuan, D., Wang, J., Xie, S., 2010. Study on thedD and d18O characteristics of meteoric precipitation during 2006–2008 inChongqing. Adv. Water Sci. 21 (6), 757–764 (in Chinese with English abstract).

P. Yang et al. / Journal of Hydrology 549 (2017) 50–61 61
Lund, J.W., Freeston, D.H., Boyd, T.L., 2011. Direct utilization of geothermal energy2010 worldwide review. Geothermics 40, 159–180. http://dx.doi.org/10.1016/j.geothermics.2011.07.004.
Luo, P., Qin, Z., Sun, C., 2013. The geological heritage resources system ofHuayingshan Grand Canyon Geo-park in Sichuan and its geographicsignificance. Acta Geosci. Sinica 34 (6), 738–748. http://dx.doi.org/10.3975/cagsb.2013.06.11 (in Chinese with English abstract).
Mádl-Sz}onyi, J., Simon, S., 2016. Involvement of preliminary regional fluid pressureevaluation into the reconnaissance geothermal-exploration-Example of anoverpressured and gravity-driven basin. Geothermics 60, 156–174. http://dx.doi.org/10.1016/j.geothermics.2015.11.001.
Mádl-Sz}onyi, J., Tóth, A., 2015. Basin-scale conceptual groundwater flow model foran unconfined and confined thick carbonate region. Hydrogeol. J. 23 (7), 1359–1380. http://dx.doi.org/10.1007/s10040-015-1274-x.
Majumdar, N., Mukherjee, A.L., Majumdar, R.K., 2009. Mixing hydrology andchemical equilibria in Bakreswar geothermal area, Eastern India. J. Volcanol.Geotherm. Res. 183 (3–4), 201–212. http://dx.doi.org/10.1016/j.jvolgeores.2009.03.014.
Millot, R., Négrel, P., 2007. Multi-isotopic tracing (d7Li, d11B, 87Sr/86Sr) and chemicalgeothermometry: evidence from hydro-geothermal systems in France. Chem.Geol. 244 (3–4), 664–678. http://dx.doi.org/10.1016/j.chemgeo.2007.07.015.
Moreira, P., Fernández, R.R., 2015. La Josefina Au-Ag deposit (Patagonia, Argentina):a Jurassic epithermal deposit formed in a hot spring environment. Ore Geol.Rev. 67, 297–313. http://dx.doi.org/10.1016/j.oregeorev.2014.12.012.
Parkhurst, D.L., Appelo, C.A.J., 2013. Description of input and examples for PHREEQCversion 3 – A computer program for speciation, batch-reaction, one-dimensional transport, and inverse geochemical calculations. Chapter 43 ofSection A, Groundwater Book 6, Modeling Techniques, <http://pubs.usgs.gov/tm/06/a43/>.
Pastorelli, S., Marini, L., Hunziker, J.C., 1999. Water chemistry and isotopecomposition of the Acquarossa thermal system, Ticino, Switzerland.Geothermics 28, 75–93. http://dx.doi.org/10.1016/S0375-6505(98)00045-5.
Pérez-Zárate, D., Santoyo, E., Guevara, M., Torres-Alvarado, I.S., Peiffer, L., Martínez-Frías, J., 2015. Geochemometric modeling and geothermal experiments ofwater/rock interaction for the study of alkali-feldspars dissolution. Appl. Therm.Eng. 75, 1244–1261. http://dx.doi.org/10.1016/j.applthermaleng.2014.09.011.
Plummer, L.N., Busby, J.F., Lee, R.W., Hanshaw, B.B., 1990. Geochemical modeling ofthe Madison aquifer in parts of Montana, Wyoming, and South-Dakota. WaterResour. Res 26 (9), 1981–2014. http://dx.doi.org/10.1029/Wr026i009p01981.
Samborska, K., Ró _zkowski, A., Małoszewski, P., 2013. Estimation of groundwaterresidence time using environmental radioisotopes (14C, T) in carbonate aquifers,southern Poland. Isot. Environ. Healt. Stud. 49 (1), 73–97. http://dx.doi.org/10.1080/10256016.2012.677041.
Schipper, L.A., McGill, A., 2008. Nitrogen transformation in a denitrification layerirrigated with dairy factory effluent. Water Res. 42 (10–11), 2457–2464. http://dx.doi.org/10.1016/j.watres.2008.01.033.
Shi, H., Shi, X., Glasmacher, U.A., Yang, X., Stockli, D.F., 2016. The evolution ofeastern Sichuan basin, Yangtze block since Cretaceous: constraints from lowtemperature thermochronology. J. Asian Earth Sci. 116, 208–221. http://dx.doi.org/10.1016/j.jseaes.2015.11.008.
Sun, Z.Y., Ma, R., Wang, Y.X., Ma, T., Liu, Y.D., 2016. Using isotopic,hydrogeochemical-tracer and temperature data to characterize recharge andflow paths in a complex karst groundwater flow system in northern China.Hydrogeol. J 24 (6), 1393–1412. http://dx.doi.org/10.1007/s10040-016-1390-2.
The Geological and Mineral of the People’s Republic of China, 1993. DetectionMethod of Groundwater (DZ/T 0064.1�0063.80-93) (in Chinese).
Tóth, J., 1962. A theory of groundwater motion in small drainage basins in centralAlberta, Canada. J. Geophys. Res. 67 (11), 4375–4388. http://dx.doi.org/10.1029/Jz067i011p04375.
Tóth, J., 1963. A theoretical analysis of groundwater flow in small drainage basins. J.Geophys. Res. 68 (16), 4795–4812. http://dx.doi.org/10.1029/Jz068i008p02354.
Tóth, J., 1995. Hydraulic continuity in large sedimentary basins. Hydrogeol. J. 3 (4),4–16. http://dx.doi.org/10.1007/s100400050250.
Tóth, J., 2009. Gravitational systems of groundwater flow. In: Theory, Evaluation,Utilization. Cambridge University Press, Cambridge.
Verma, S.P., Santoyo, E., 1997. New improved equations for Na/K, Na/Li and SiO2,geothermometers by outlier detection and rejection. J. Volcanol. Geotherm. Res.79, 9–23. http://dx.doi.org/10.1016/S0377-0273(97)00024-3.
Wang, G., Li, K., Wen, D., Lin, W., Lin, L., Liu, Z., Zhang, W., Ma, F., Wang, W., 2015.Assessment of geothermal resources in China. In: Proceedings of the WorldGeothermal Congress 2015, Melbourne, Australia.
Wang, S., Pang, Z., Liu, J., Lin, P., Liu, S., Yin, M., 2013. Origin and evolutioncharacteristics of geothermal water in the Niutuozhen geothermal field, NorthChina Plain. J. Earth Sci. 24 (6), 891–902. http://dx.doi.org/10.1007/s12583-013-0390-6.
Wang, Y., Guo, Q., Su, C., Ma, T., 2006. Strontium isotope characterization and majorion geochemistry of karst water flow, Shentou, northern China. J. Hydrol. 328(3–4), 592–603. http://dx.doi.org/10.1016/j.jhydrol.2006.01.006.
Xiao, Q., Shen, L., Yang, L., 2015. Analysis on origin and recharge mechanism ofgeothermal water, a case study of Beiwenquan hot spring in Chongqing, China.J. Chongqing Univ. 38 (4), 91–103. http://dx.doi.org/10.11835/j.issn.1000-582X.2015.04014 (in Chinese with English abstract).
Yang, P., Yuan, D., Ye, X., Xie, S., Chen, X., Liu, Z., 2013. Sources and migration path ofchemical compositions in a karst groundwater system during rainfall events.Chin. Sci. Bull. 58 (20), 2488–2496. http://dx.doi.org/10.1007/s11434-013-5762-x.
Yoshiike, Y., 2003. Variation in the chemical composition of Obuki Spring,Tamagawa Hot Springs (1951–2000). Geochem. J. 37 (6), 649–662.
Zhang, X., Zha, X., Dai, Z., 2015. Stress changes induced by the 2008 Mw7:9Wenchuan earthquake, China. J. Asian Earth Sci. 98, 98–104. http://dx.doi.org/10.1016/j.jseaes.2014.10.001.
Zhao, X., Wan, G., 2014. Current situation and prospect of China’s geothermalresources. Renew. Sustain. Energy Rev. 32, 651–661. http://dx.doi.org/10.1016/j.rser.2014.01.057.
Zhou, X., Jin, X., Liang, S., Shen, Y., Zhang, H., 2010. Monograph of GroundwaterSciences. Geological Press, Beijing (in Chinese).
Zhu, C., Murphy, W.M., 2000. On radiocarbon dating of ground water. GroundWater38 (6), 802–804. http://dx.doi.org/10.1111/j.1745-6584.2000.tb00671.x.
Zijl, W., 1999. Scale aspects of groundwater flow and transport systems. Hydrogeol.J. 7 (1), 139–150. http://dx.doi.org/10.1007/s100400050185.

![Download EcoKnights Services Catalogue here[3.32 MB]](https://static.fdocuments.in/doc/165x107/589eeb3d1a28ab124a8c1d4e/download-ecoknights-services-catalogue-here332-mb.jpg)


![View full document [PDF 3.32 MB]](https://static.fdocuments.in/doc/165x107/589054e31a28abfd438be349/view-full-document-pdf-332-mb.jpg)

![[ENG]코웨이 웹진 201705 Market Review Stock Market TheKOSPIsoared6.44%fromthepreviousmonthto2,347.38pointsattheendofMay2017,takinganuptrendfor …](https://static.fdocuments.in/doc/165x107/5ecb6e12b9aa4150522145a8/eng-market-review-stock-market-thekospisoared644fromthepreviousmonthto234738pointsattheendofmay2017takinganuptrendfor.jpg)