Journal of Hydrology - Groundwater · a modified Richards equation formulation within a standard...
15
Incorporating the effect of gas in modelling the impact of CBM extraction on regional groundwater systems Daan Herckenrath a,b,d,⇑ , John Doherty a,c,d , Sorab Panday e a National Centre for Groundwater Research and Training, Adelaide, SA 5001, Australia b School of the Environment, Flinders University, GPO Box 2100, Adelaide, SA 5001, Australia c Watermark Numerical Computing, 336 Cliveden Avenue, Corinda, QLD 4075, Australia d Office of Groundwater Impact Assessment, Queensland Government, 61 Mary Street, Brisbane, QLD 4000, Australia e GSI Environmental, Herndon, VA, USA article info Article history: Received 8 September 2014 Received in revised form 5 February 2015 Accepted 6 February 2015 Available online 16 February 2015 This manuscript was handled by Corrado Corradini, Editor-in-Chief, with the assistance of Adrian Deane Werner, Associate Editor Keywords: Coalbed Methane Reservoir model Regional groundwater model Multiphase flow Richards equation summary Production of Coalbed Methane (CBM) requires extraction of large quantities of groundwater. To date, standard groundwater flow simulators have mostly been used to assess the impact of this extraction on regional groundwater systems. Recent research has demonstrated that predictions of regional impact assessment made by such models may be seriously compromised unless account is taken of the presence of a gas phase near extraction wells. At the same time, CBM impact assessment must accommodate the traditional requirements of regional groundwater modelling. These include representation of surficial groundwater processes and up-scaled rock properties as well as the need for calibration and predictive uncertainty quantification. The study documented herein (1) quantifies errors in regional drawdown pre- dictions incurred through neglect of the presence of a gas phase near CBM extraction centres, and (2) evaluates the extent to which these errors can be mitigated by simulating near-well desaturation using a modified Richards equation formulation within a standard groundwater flow simulator. Two synthetic examples are provided to quantify the impact of the gas phase and verify the proposed modelling approach (implemented in MODFLOW-USG) against rigorous multiphase flow simulations (undertaken using ECLIPSE ⁄ ). ECLIPSE simulations demonstrate convergence towards a time-asymptotic relationship between water saturation and pressure. This relationship can be approximated using a slightly modified van Genuchten function. Where this function is employed in combination with the modified Richards equa- tion strategy to accommodate near-well desaturation, errors in predicted drawdown are reduced sig- nificantly, including in cases where complexities such as sloping coal layers are introduced to the model domain (the latter promoting buoyancy-driven movement of gas). Sensitivity analyses further indicate that only the general properties of the employed desaturation function need to be respected to significantly reduce errors in regional drawdown predictions that would arise if the presence of the near-well gas phase was ignored. These properties can be inferred from reservoir properties and from the outcomes of reservoir model simulations that are available at local CBM operation sites. Crown Copyright Ó 2015 Published by Elsevier B.V. All rights reserved. 1. Introduction 1.1. General As in many other countries, Coalbed Methane (CBM) production is growing rapidly in Australia. Much of this is focussed on the Surat Basin (Hamawand et al., 2013; Moore, 2012; Queensland- Government, 2013), where CBM development areas are of a sig- nificant scale. Up to 40,000 wells will be drilled over the next half century. Water production from each of these is expected to aver- age about 20,000 litres per day (CSIRO, 2013). Gas companies and governments are required to assess regional impacts of CBM production on overlying/underlying aquifer sys- tems that serve as sources of water for industrial/agricultural/do- mestic use and that sustain important groundwater-dependent eco-systems. Groundwater modelling is therefore undertaken to develop management and monitoring strategies that mitigate the potential impacts of these developments on regional groundwater systems (CEDA, 2012; Fisher, 2010; Mudd, 2012; QWC, 2012a; http://dx.doi.org/10.1016/j.jhydrol.2015.02.012 0022-1694/Crown Copyright Ó 2015 Published by Elsevier B.V. All rights reserved. ⇑ Corresponding author at: School of the Environment, Flinders University, GPO Box 2100, Adelaide, SA 5001, Australia. E-mail address: daan.herckenrath@flinders.edu.au (D. Herckenrath). ⁄ Mark of Schlumberger. Journal of Hydrology 523 (2015) 587–601 Contents lists available at ScienceDirect Journal of Hydrology journal homepage: www.elsevier.com/locate/jhydrol
-
Upload
trinhthien -
Category
Documents
-
view
216 -
download
0
Transcript of Journal of Hydrology - Groundwater · a modified Richards equation formulation within a standard...

Journal of Hydrology 523 (2015) 587–601
Contents lists available at ScienceDirect
Journal of Hydrology
journal homepage: www.elsevier .com/ locate / jhydrol
Incorporating the effect of gas in modelling the impact of CBM extractionon regional groundwater systems
http://dx.doi.org/10.1016/j.jhydrol.2015.02.0120022-1694/Crown Copyright � 2015 Published by Elsevier B.V. All rights reserved.
⇑ Corresponding author at: School of the Environment, Flinders University, GPOBox 2100, Adelaide, SA 5001, Australia.
E-mail address: [email protected] (D. Herckenrath).⁄ Mark of Schlumberger.
Daan Herckenrath a,b,d,⇑, John Doherty a,c,d, Sorab Panday e
a National Centre for Groundwater Research and Training, Adelaide, SA 5001, Australiab School of the Environment, Flinders University, GPO Box 2100, Adelaide, SA 5001, Australiac Watermark Numerical Computing, 336 Cliveden Avenue, Corinda, QLD 4075, Australiad Office of Groundwater Impact Assessment, Queensland Government, 61 Mary Street, Brisbane, QLD 4000, Australiae GSI Environmental, Herndon, VA, USA
a r t i c l e i n f o
Article history:Received 8 September 2014Received in revised form 5 February 2015Accepted 6 February 2015Available online 16 February 2015This manuscript was handled by CorradoCorradini, Editor-in-Chief, with theassistance of Adrian Deane Werner,Associate Editor
Keywords:Coalbed MethaneReservoir modelRegional groundwater modelMultiphase flowRichards equation
s u m m a r y
Production of Coalbed Methane (CBM) requires extraction of large quantities of groundwater. To date,standard groundwater flow simulators have mostly been used to assess the impact of this extractionon regional groundwater systems. Recent research has demonstrated that predictions of regional impactassessment made by such models may be seriously compromised unless account is taken of the presenceof a gas phase near extraction wells. At the same time, CBM impact assessment must accommodate thetraditional requirements of regional groundwater modelling. These include representation of surficialgroundwater processes and up-scaled rock properties as well as the need for calibration and predictiveuncertainty quantification. The study documented herein (1) quantifies errors in regional drawdown pre-dictions incurred through neglect of the presence of a gas phase near CBM extraction centres, and (2)evaluates the extent to which these errors can be mitigated by simulating near-well desaturation usinga modified Richards equation formulation within a standard groundwater flow simulator. Two syntheticexamples are provided to quantify the impact of the gas phase and verify the proposed modellingapproach (implemented in MODFLOW-USG) against rigorous multiphase flow simulations (undertakenusing ECLIPSE⁄). ECLIPSE simulations demonstrate convergence towards a time-asymptotic relationshipbetween water saturation and pressure. This relationship can be approximated using a slightly modifiedvan Genuchten function. Where this function is employed in combination with the modified Richards equa-tion strategy to accommodate near-well desaturation, errors in predicted drawdown are reduced sig-nificantly, including in cases where complexities such as sloping coal layers are introduced to the modeldomain (the latter promoting buoyancy-driven movement of gas). Sensitivity analyses further indicate thatonly the general properties of the employed desaturation function need to be respected to significantlyreduce errors in regional drawdown predictions that would arise if the presence of the near-well gas phasewas ignored. These properties can be inferred from reservoir properties and from the outcomes of reservoirmodel simulations that are available at local CBM operation sites.
Crown Copyright � 2015 Published by Elsevier B.V. All rights reserved.
1. Introduction
1.1. General
As in many other countries, Coalbed Methane (CBM) productionis growing rapidly in Australia. Much of this is focussed on theSurat Basin (Hamawand et al., 2013; Moore, 2012; Queensland-
Government, 2013), where CBM development areas are of a sig-nificant scale. Up to 40,000 wells will be drilled over the next halfcentury. Water production from each of these is expected to aver-age about 20,000 litres per day (CSIRO, 2013).
Gas companies and governments are required to assess regionalimpacts of CBM production on overlying/underlying aquifer sys-tems that serve as sources of water for industrial/agricultural/do-mestic use and that sustain important groundwater-dependenteco-systems. Groundwater modelling is therefore undertaken todevelop management and monitoring strategies that mitigate thepotential impacts of these developments on regional groundwatersystems (CEDA, 2012; Fisher, 2010; Mudd, 2012; QWC, 2012a;

588 D. Herckenrath et al. / Journal of Hydrology 523 (2015) 587–601
Commonwealth of Australia, 2014). In most cases of which theauthors are aware, standard groundwater flow simulators such asMODFLOW (Harbaugh, 2005) have been employed for the makingof these assessments (Meredith et al., 2008; Myers, 2009;Wheaton and Metesh, 2002; QWC, 2012a; Golder Associates,2009, 2011; and Arrow-Energy, 2012). At the same time, the U.S.National Research Council (Fisher, 2010) states that traditionalgroundwater modelling has not been able to incorporate the fullrange of natural complexities in CBM basins and recommends that‘‘uncertainties in groundwater modelling results should be explicit-ly recognized when the results are used to make produced watermanagement and regulatory decisions’’. Implied in this recommen-dation is that errors incurred through failure to simulate importantaspects of the coal bed methane extraction process be included inthe uncertainties that are computed for predictions made by suchmodels. Two potential sources of error associated with currentCBM impact assessment modelling include: (1) the up-scaling ofcomplex coal reservoir units that is required for their representa-tion in regional models, and (2) incorporating the presence of agas phase in the vicinity of CBM extraction sites. A recent studyby Moore et al. (2014) demonstrates the importance of both of the-se issues in regional CBM impact assessment modelling. It suggeststhat further research on each of them is urgently required, firstseparately so that each can be properly understood, and thentogether as both must operate simultaneously in any regionalCBM impact assessment context.
Spatial scales over which regional CBM impact assessmentsmust be made can be very large, this reflecting both the large arealextent of CBM gas fields, and the distances over which drawdownsinduced by CBM extraction may propagate. For example the areaover which the impact of Surat Basin gas extraction must beassessed is of the order of 550 km � 660 km (QWC, 2012a), an areaequivalent to the size of Germany. Furthermore, some of the aqui-fers for which impact must be assessed are up to 1.5 km deep.Models whose domains span this area are described by QWC(2012a) and Howell et al. (2013). Groundwater systems withinsuch vast areas are affected not just by gas extraction, but alsoby historical processes (spanning millions of years) which havedetermined their present state, these including complex interac-tions with streams and shallow groundwater systems at rechargeand discharge areas, interactions with waters of continental scaleaquifers such as those of the Great Artesian Basin, and extractionwhich has taken place over the last hundred years to support thedevelopment of agriculture and other industries prior to the adventof gas extraction. Despite their large domain, models of this typeare required to run at reasonable execution speeds so that theirparameters can be informed through calibration, and so that theirpredictions can be subjected to calibration-constrained uncertain-ty analysis (QWC, 2012b).
The presence of a subsurface gas phase near sites of methaneextraction can have a significant impact on these model predictions.Moore et al. (2013, 2014) and Howell et al. (2013) demonstrate thatfailure to simulate the presence of subsurface gas near CBM extrac-tion wells can lead to severe over-prediction of CBM induced draw-down at distances from those wells that far exceed those overwhich gas is present as a separate phase. While multiphase reser-voir models are regularly employed by CBM operators to studydepressurization and gas generation at a local scale, the use of suchmodels in regional scale impact assessment is rare, the onlyinstance of which the authors are aware being that of QGC(2014). While a reservoir model can indeed accommodate theeffects of near-well gas desorption as part of a regional scale impactassessment, it may not always be the preferred option for a range ofpractical reasons. Current reservoir simulation software is notspecifically designed for regional groundwater impact assessment.Its limitations in this capacity include a lack of steady-state capa-
bilities and reduced number of modules through which inflowsand outflows to and from a groundwater system can be representedcompared with those offered by standard groundwater simulators(QGC, 2014). Furthermore, the use of reservoir simulators, whichare often expensive and closed-source, requires high levels ofexpertise and complex material property data sets that might notbe available to those undertaking the impact assessment modelling.Furthermore the multiphase flow equations embodied in suchsimulators may not provide adequate descriptions of these process-es when these are applied to the necessarily up-scaled representa-tion of coal measures that a regional model requires.
In summary, as recognized by Commonwealth of Australia(2014), a unique challenge to CBM groundwater impact assess-ment modelling is the need to account for the presence of gas nearCBM extraction centres while maintaining computational speedand simulation integrity as it pertains to other processes, some ofwhich are operative on a regional scale, that must be representedin the making of such assessments.
The purpose of this paper is to:
(1) report the outcomes of a series of numerical experiments inwhich errors incurred by neglecting the presence of gas onsimulated drawdowns are examined in a controlled mod-elling environment;
(2) discuss strategies for inclusion of the effects of near-well gasin models built for the purpose of regional CBM impactassessment; and
(3) propose an efficient, practical methodology for incorporat-ing the impact of a near-well gas phase on regional draw-down assessments made using a traditional, single-phasegroundwater model, and verify this approach against rigor-ous multiphase modelling.
A short description of flow dynamics associated with CBM pro-duction is first provided. This is followed by a brief overview of pre-vious groundwater modelling studies that have been undertaken insupport of regional CBM impact assessment. Finally, a modifiedgroundwater flow modelling approach is presented with verifica-tion problems to address the issue of gas phase presence on assess-ment of regional groundwater impacts of CBM production.
1.2. CBM production – basics
CBM production can be divided into three stages, namely (1) thedewatering stage, (2) the production stage, and (3) the declinestage. During the dewatering stage coalbeds are depressurised byextraction of water. When sufficiently depressurised, gas starts todesorb from the coal matrix. As dewatering continues, gas concen-trations in coalbed fractures/cleats start to increase. This leads toincreased gas mobility, which allows gas to migrate down pressuregradients to CBM extraction wells. During the dewatering phase,gas production rates generally increase over time while water pro-duction rates generally decrease, this ushering in the productionphase. Eventually gas production rates start to decline due todepletion of gas in depressurised coal seams that are connectedto the well. Type curves provided in publications such as Seidle(2011) and Moore (2012) depict gas and water production ratesfor these three stages, and illustrate their variability between dif-ferent gas fields.
Knowledge of coal permeability is essential for estimation of gasand water extraction rates, as well as for assessment of the impactof CBM production on regional groundwater systems. Coal perme-ability is determined by the properties of its fracture system (i.e. bythe system of coal cleats). The hydraulic properties of the coalcleats systems have been well-documented in publications suchas Laubach et al. (1998), Palmer (2009) and Pan and Connell
D. Herckenrath et al. / Journal of Hydrology 523 (2015) 587–601 589
(2012). The overall permeability of coal beds is generally low com-pared to that of aquifers, ranging from less than 1 milliDarcy (mD)to 1000 mD (Seidle, 2011). (Note that 1 mD is equivalent to ahydraulic conductivity of about 1.25 � 10�3 m/day for freshwaterat 40 �C.) During CBM production the relative permeabilities ofgas and water alter in accordance with their respective saturations.The relationship between relative permeability and saturation isoften described using a power function; see Brooks and Corey(1964). Though neglected in the present study, total coal perme-ability can change as gas production progresses as an outcome ofchanges to effective stress, and through coal shrinkage and swel-ling. See, for example, Klinkenberg (1941) and Pan and Connell(2012) for further details. Typically, coalbeds exhibit greatest per-meability parallel to bedding, this giving rise to significant verticalanisotropy (Laubach et al., 1998). Vertical connectivity of cleat net-works is generally limited by the termination of small cleats atinterfaces between coal types, and large cleats at coal-non-coalbed interfaces (Laubach et al., 1998).
Coal seams are generally neither evenly distributed nor laterallycontinuous throughout a coal measure sequence. In the Surat Bas-in, Australia, thicknesses of individual coal seams vary betweenless than 10 cm to over 10 m (bhpbilliton, 2012). Most individualseams are less than 3 km in lateral extent (Ryan et al., 2012). Coalseams are generally separated by relatively impermeable siltstonesand claystones – these often being referred to as interburden.Because of the limited connectivity of coal seams, many wells mustbe drilled to depressurise large enough areas to support productionof economic quantities of gas. Sometimes hydraulic fracturing isused to enhance connectivity between CBM production wells andcoal seams, and between seams themselves.
1.3. CBM-related regional groundwater modelling
To date, assessments of the effect of CBM extraction on regionalgroundwater systems has received little attention in the scientificliterature. Meredith et al. (2008), Myers (2009), and Wheatonand Metesh (2002) discuss modelling carried out in the PowderRiver Basin (USA) for the purpose of impact assessment; thegroundwater flow simulator, MODFLOW, was employed in all cas-es. While modelling carried out to date in the Surat Basin (Aus-tralia) has not been reported in scientific journals, it has beendiscussed extensively in company reports, and in technical confer-ences. See QWC (2012a), Golder Associates (2009, 2011), Arrow-Energy (2012) and QGC (2014). All but the last of these employedMODFLOW as their simulation platform; QGC (2014) employed theECLIPSE (Schlumberger, 2012) reservoir simulator.
1.4. Regional modelling and gas phase impacts
In a comprehensive study focussed on flow conditions close to asemi-synthetic CBM extraction well-field, Moore et al. (2013,2014) compares pressures calculated by a traditional (single-phase) groundwater flow model with those calculated by a multi-phase reservoir simulator. The model domain used in their studywas comprised of a complex lithological realization of thin coaland interburden layers that is typical of certain Surat Basin gasfields. The study demonstrated that drawdowns calculated by astandard groundwater flow model can significantly exceed thosecalculated by a multiphase reservoir model, both close to extrac-tion well fields and at large distances from well fields. Similar con-clusions were drawn by Golder Associates (2012) in a studyundertaken to assess the impact of oil-sand mining on regionalgroundwater systems in Canada.
As outlined by Moore et al. (2013, 2014) there are two principalreasons why use of a standard groundwater model leads to over-prediction of pressure drawdown. As gas desorbs from the coal
matrix because of coal seam depressurization, its presence in thecleat system through which fluid flow takes place instigates areduction in the relative permeability of the water phase. Thisreduced water phase permeability hinders the outward propaga-tion of the extraction-induced cone of depressurization. At thesame time, water is displaced from the coal cleat system by gas.Even where coal porosity is low, the volume of water released bygas generation in cleats is far greater than that released from elas-tic storage, which further mitigates the transient outward propaga-tion of extraction-induced drawdown.
Means through which it may be possible to take these effectsinto account in regional impact modelling include (1) use of adetailed multi-phase reservoir simulator for regional impactassessment, and (2) implementation of a hybrid approach in whichthe above effects are approximated in a modified single-phasegroundwater flow model designed for regional scale impact assess-ment. The former approach is taken by QGC (2014); the latterapproach is the subject of the present paper.
The proposed formulation described in the present paperemploys a modified Richards equation to characterize waterdesaturation arising from the presence of gas in coal cleats. It hasbeen coded into the public domain groundwater flow code MOD-FLOW-USG (Panday et al., 2013). Its use is demonstrated usingtwo synthetic models which embody simplified representationsof CBM reservoirs. These models simulate extraction from a singlehomogeneous coal seam on the one hand, and CBM extraction froma more complex sequence comprised of two homogeneous coalseams separated by an interburden layer and overlain by awater-bearing formation on the other hand. First, errors in predict-ing drawdown incurred by ignoring the presence of gas are inves-tigated by comparing pressures calculated using the ECLIPSEreservoir simulator with those calculated using the standard MOD-FLOW-USG simulator. Second, two alternative strategies are inves-tigated for mitigating drawdown over-prediction by a groundwatersimulator. The first of these alternatives employs MODFLOW-USGas a traditional groundwater flow model; however its waterextraction rates are pre-calculated by the reservoir simulatorECLIPSE. The second alternative acknowledges the existence of agas phase by simulating desaturation using a modified Richardsequation functionality coded into MODFLOW-USG.
2. Methodology
The equations for two-phase flow of gas and water that are nowbriefly presented find numerical expression in commercial CBMproduction simulators such as ECLIPSE (Schlumberger, 2012) andSIMEDWin (CSIRO, 2014), as well in open source-codes such asthose described by Thararoop et al. (2012) and Manik et al.(2002). Secondary effects such as alterations to coal permeabilitywith pressure and gas content, and the low-level solubility ofmethane in water are neglected.
The amount of methane that can be stored in the coal matrixthrough adsorption, and its variation with pressure, is describedby a nonlinear Langmuir isotherm:
L ¼ Lmp
pþ pL
� �ð1Þ
where:L, is the coal gas content (volume of gas under standard condi-tions per volume of coal) (–);Lm, is the gas sorption capacity of coal (–);p, is the pressure (M/LT2); andpL, is the Langmuir pressure constant (M/LT2).
When pressure in a coal seam is reduced to the point wheremethane concentration exceeds the capacity of the coal matrix to
590 D. Herckenrath et al. / Journal of Hydrology 523 (2015) 587–601
adsorb it, methane is released. It then diffuses through the coalmatrix to the cleat system, where it displaces water to exist asits own phase and flow with water to extraction wells.
Flow of water and gas through an isotropic porous medium canbe described by the following equation.
r � kkri
liBir pi þ qigzð Þ
� �¼ @
@t/Si
Bi
� �� qi ð2Þ
where:k, is the permeability of the medium (L2);kri, is the relative permeability of phase i (–);li, is the viscosity of phase i (M/LT);Bi, is the formation volume factor of phase i (volume of phaseunder formation conditions per volume of phase under stan-dard conditions) (–);pi, is the pressure of phase i (M/LT2);qi, is the density of phase i (M/L3);g, is acceleration due to gravity (L/T2);z, is elevation (L);t, is time (T);/, is porosity (–);Si, is the saturation of phase i (–); andqi, is the source strength density of phase i expressed as volume(under standard conditions) of phase i introduced to the medi-um per unit volume of the medium (1/T).
where there are two phases, modelling must solve for fourunknowns, these being pi and Si for i = g (i.e. gas) and i = w (i.e.water). The above two equations must therefore be supplementedby another two equations. These are:
pg � pw ¼ pc ð3Þ
and
Sg þ Sw ¼ 1 ð4Þ
where pc is the (saturation-dependent) capillary pressure (M/LT2).In CBM reservoir modelling this is usually assumed to be zero;hence pg is assumed to equal pw.
An injection/extraction well constitutes a point source/sink offluid, and can thus be represented in the qi term of Eq. (2). Howeverin most contexts of CBM extraction, well pressure eventually fallsto a level which is then maintained for the rest of the life of thewell. A well then constitutes a constant pressure boundarycondition.
As a coal seam is being depressurized another source of fluidcomes into existence as gas is desorbed from the coal matrix. Oncethe pressure declines to a point where, according to the governingLangmuir isotherm, gas is desorbed, it diffuses from the matrix tothe cleat system in accordance with Fick’s law. This takes placeunder a concentration gradient equal to the difference betweenits current bulk concentration and the Langmuir concentration atcurrent pressure. Diffusion creates a time delay between desorp-tion of gas and its functioning as the qg term in Eq. (2). The timeconstant s of this delay is given by:
s ¼ 1rDc
ð5Þ
where:Dc, is the diffusion coefficient (L2/T); andr, is a shape factor (see Kazemi et al., 1976) which describes theassumed geometry of the matrix-fracture interface within thecoal seams (L�2).
For both phases, kri is a function of Si. A Brooks–Corey formula-tion (Brooks and Corey, 1964) is often used to describe this func-tion. For water, effective water saturation is defined as:
Se ¼Sw � Sr
1� Srð6Þ
where Sr is residual water content (–). krw (–) is then expressed as:
krw ¼ Sne ð7Þ
where n is chosen appropriately for the porous medium under con-sideration. A similar formula is employed for krg.
Where fluid flow is horizontal (as is approximately the case inCBM extraction), then over that part of the model domain wherepressures are low enough for gas to be released, Eq. (2) can beapproximated for the gas and water phases respectively, as:
r � kkrg
lgBgrpþ gzrqg
� �" #¼ /
@
@tSg
Bg
� �þ dL
dp@p@t
ð8aÞ
and
r � kkrw
lwrp
� �¼ /
@Sw
@tð8bÞ
Use of Eq. (8) implies that:
� Capillary pressure is zero so that pressure of gas and water arethe same, this allowing the subscript on p to be dropped.� Water is incompressible so that Bw is unity.� The matrix is incompressible so that / is constant.� Diffusion time of desorbed gas from matrix to cleats is small
enough to be ignored.
Eqs. (8) and (4) form a system of three equations which can besolved for p, Sw and Sg. Sg appears in Eq. (8a) through its influenceon krg, while Sw is expressed in Eq. (8b) through both the storageterm and its influence on krw. These equations become de-coupledif Sw (and hence Sg) can be expressed as a function of p alone.Hence, as will be suggested later in this paper, if the behaviour ofa dual-phase system under certain configurations and boundaryconditions is such that Sw can be approximately considered to bea function p, then the second of the above equations can be solvedindependently of the first for pw. Solution of Eq. (8b) independentlyof Eq. (8a) is a matter of great convenience in CBM impact assess-ment modelling as this impact is mostly defined in terms of draw-downs induced by gas production, often at considerable distancesfrom pumping centres, and hence far from the locations where gasis extracted and desaturation occurs. The purpose of the presentstudy is to inquire whether separation of the gas and water flowequations is justified in the CBM impact assessment context,notwithstanding the obvious shortcomings of such a strategy inother contexts, especially those whose focus is on processes closeto gas extraction centres where the flow of two separate phasesmust be explicitly represented (e. g. reservoir production forecaststudies).
In traditional unsaturated modelling of water movement, dual-phase flow of water and air in the vadose zone is often described bya single equation pertaining to flow of water alone, this beingreferred to as the Richards Equation. The assumption here is thatgas flow is instantaneous, with the gas phase rapidly equilibratingto atmospheric pressure conditions (pg = 0). Thus the capillarypressure, which is not neglected in such simulations, is the nega-tive of the water pressure as per Eq. (3). In vadose zone modellingthe dependence of Sw on p is often described by the van Genuchtenfunction (van Genuchten, 1980). This provides a general S-shapedcurve in which the a and b parameters (see below) are adjustedto define the soil’s capillary characteristics at a particular site. Inthe present paper we employ a modified form of this function,though not to define capillarity (which is often ignored in CBMsimulations), but rather to describe the time-asymptotic
D. Herckenrath et al. / Journal of Hydrology 523 (2015) 587–601 591
dependence of Sw on p that emerges from CBM-induced waterdesaturation processes that have been described above. The mod-ified van Genuchten equation is:
Se ¼Sw � Sr
1� Sr¼ ½1þ faðhb � hÞgb�
�cfor ðhb � hÞ > 0 ð9Þ
The term c (–) is computed as:
c ¼ 1� 1=b ð10Þ
while water head h (L) is computed as:
h ¼ pq g
wð11Þ
In Eq. (9), a (L�1) and b (–) are fitting parameters. hb is the bub-ble point pressure head [L], this being the pressure head at whichwater desaturation induced by gas desorption commences. Theintroduction of this term marks the only departure of equation 9from the standard van Genuchten equation. It allows waterdesaturation to commence at a pressure of the user’s choice. If itis set to zero then equation 9 becomes the standard van Genuchtenequation wherein desaturation commences as water pressure fallsbelow atmospheric pressure. In a CBM production contextdesaturation commences at pressures that are much greater thanatmospheric pressure. hb therefore represents the height of a col-umn of water that corresponds to the pressure at which gas startsto be released by the coal matrix.
It is important to note that our use of a modified van Genuchtenequation in the CBM context does not imply that physical process-es in that context are the same as those in the vadose zone. In par-ticular, capillary pressure is assumed to be zero in simulationsdescribed herein. Its use is based partly on the fact that the modi-fied van Genuchten equation replicates water desaturation com-puted by a dual-phase reservoir simulator reasonably well. Itsuse is also based on its availability in MODFLOW-USG. The authorsdid, in fact, test other analytical formulations of the dependence ofwater saturation on water head; however no improvements overthe above formulation were found.
Reservoir simulators typically provide a high degree of flexibil-ity in definition of well emplacement and pumping rates fromwells. In the current study, a target pumping rate is set for eachindividual well; extraction from each well continues at this rateuntil the pressure in the well (referred to as bottom-hole pressure)falls to a level at which it is then constrained (at 73.5 psia in the
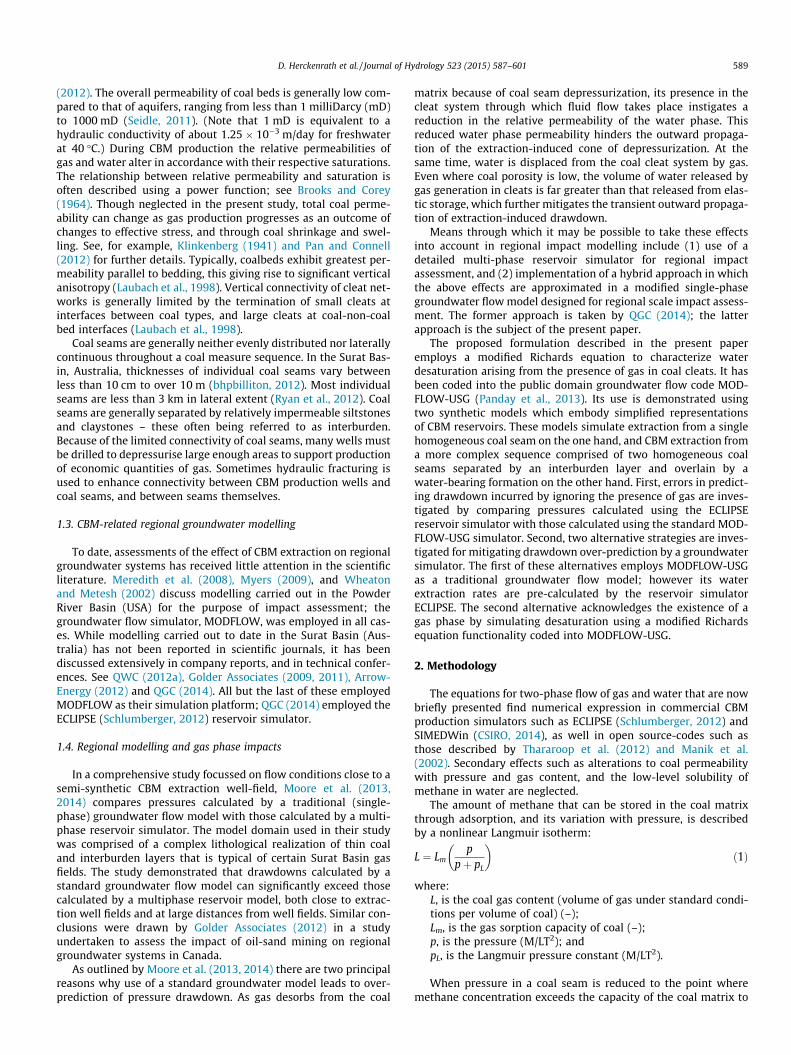
Fig. 1. (a) Grid used for the single layer model. The red dots are a row of observation welextraction wells (blue) and monitoring wells (red). (For interpretation of the references to
present study) to fall no further. This representation of extractionwells is common in CBM reservoir simulation. For an individualwell, the rate of water production qw is calculated as:
qw ¼Wðp� pwellÞ ð12Þ
where the well productivity index, W (L4T/M), is computed usingPeaceman’s formula (Peaceman, 1983); this is a function of wellradius, grid size, permeability of the model cell perforated by thewell, and an optional skin factor (assumed to be zero in the presentstudy). Where an individual well taps multiple layers, extraction isdivided between them in such a manner as to maintain eitherhydrostatic conditions within the well, or a pressure drop thataccounts for fluid flow within the well column. In MODFLOW-USGsimilar functionality is available through the connected linear net-work (CLN) package. Slight modifications were made to the codingof this package for the present study in order to allow identicaldefinition of bottom-hole pressure constraints to that employedby reservoir simulators.
3. Numerical models
In a series of numerical experiments which are now described,pressures and saturations induced by CBM extraction are calculat-ed throughout the domains of two different models, a simple mod-el in which a single coal seam is represented, and a more complexmodel comprised of multiple coal seams. The latter model alsoincludes boundary conditions which enable exchange of waterwith neighbouring formations. In both cases CBM extraction issimulated using both a reservoir simulator (ECLIPSE) and a ground-water flow simulator (MODFLOW-USG). The purpose of the experi-ments is to test, in a controlled numerical environment, whether asingle-phase groundwater flow simulator, configured for accom-modation of CBM-induced water desaturation, can be used forthe purpose of regional CBM impact assessment. Specifications ofthe two models are now provided; variations are introduced later.
3.1. Single layer model
Fig. 1 shows a simulation grid comprised of 368 rows and 368columns. Row and column widths vary from 15 m at the centreof the model domain (where pumping takes place) to 1 km at itsperiphery, with a cell width multiplication factor of 1.1 at interme-diate distances. The dimensions of the overall model domain are
ls. 9 pumping wells are located in the centre of the model domain. (b) Setup of CBMcolour in this figure legend, the reader is referred to the web version of this article.)

0
0.2
0.4
0.6
0.8
1
0 0.2 0.4 0.6 0.8 1
Rela
�ve
perm
eabi
lity
[-]
Sw [-]
krg
krw
0
40
80
120
160
200
0 200 400 600 800 1000 1200Gas v
olum
e fo
rma�
on fa
ctor
[r
eser
voir
barr
el/M
scf]
Pressure [psia]
Gas Forma�on Factor
0.0E+00
3.0E-03
6.0E-03
9.0E-03
1.2E-02
0 200 400 600 800 1000 1200
Gas c
onte
nt [M
scf/
�3]
Pressure [psia]
Ini�al Gas Content
Langmuir Isotherm
(a)
(b)
(c)
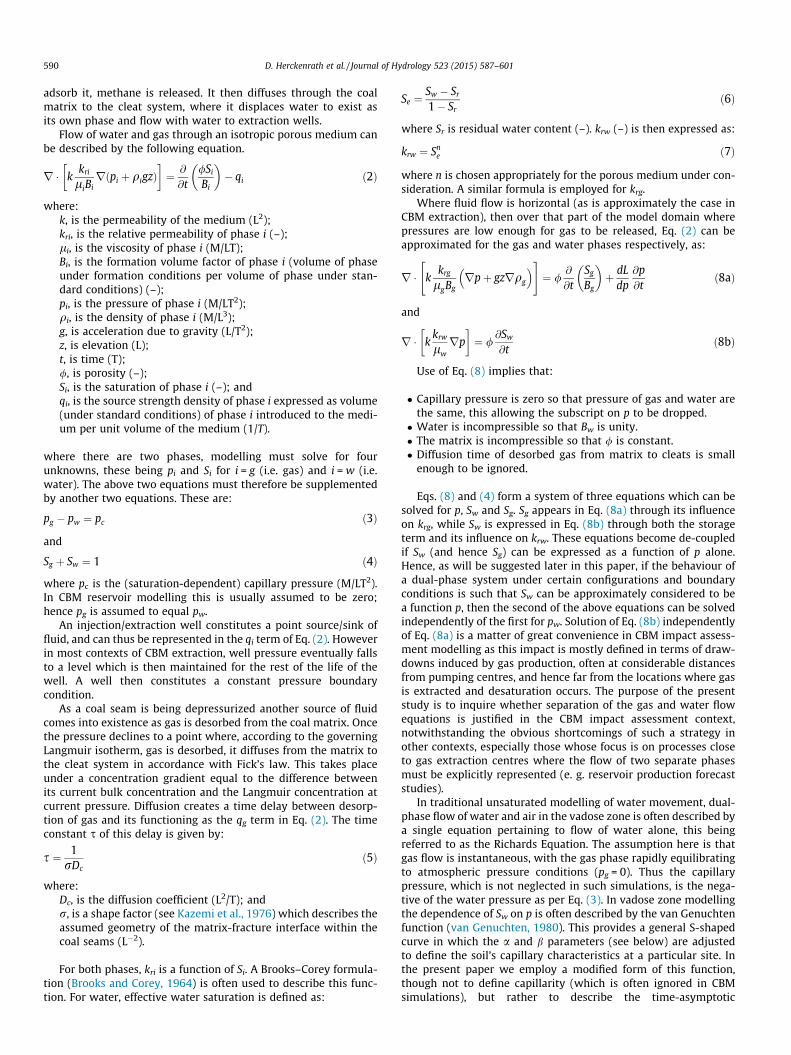
Fig. 2. (a) Relative permeabilities, (b) gas volume formation factor, and (c)Langmuir isotherm, used in ECLIPSE simulations.
592 D. Herckenrath et al. / Journal of Hydrology 523 (2015) 587–601
about 244 km � 244 km. The grid contains one coal layer of 1 mthickness.
A regular array of 9 CBM extraction wells is placed at the centreof the model domain. These are spaced 375 m apart; each has adiameter of 0.25 m. Each of these wells is specified to pump at awater rate of 200 stb/day (i.e. 31.80 m3 per day), subject to a lim-iting bottom-hole pressure constraint of 73.5 psia (41.34 m ofwater) at the elevation of the centre of the grid block from whicheach well pumps. CBM production takes place for 20 years; the fol-lowing 20 years of drawdown recovery are also simulated. No-flowconditions are applied at all model boundaries.
Properties of coal comprising the single model layer are provid-ed in Table 1. These are similar to those employed by Moore et al.(2014) and are representative of parts of the Surat Basin. In MOD-FLOW-USG elastic storage is accommodated using the specific stor-age parameter. This is calculated to be 1.1 � 10�6 m�1 based on theporosity provided in Table 1, with water and rock compressibilitiesassumed to be 4.4 � 10�6 m�1 and 2.8 � 10�5 m�1 respectively.Relative permeability functions pertaining to the water and gasphases are depicted in Fig. 2a (only the former is used by MOD-FLOW-USG whereas both are required by ECLIPSE). Sr in Eq. (6) isassigned a value of 0.2 while the Brooks–Corey exponent used inEq. (7) is assigned a value of 2.
The gas compressibility function (expressed as a gas formationvolume factor) is depicted in Fig. 2b while the Langmuir isothermis depicted in Fig. 2c; both of these are used by ECLIPSE. Re-adsorp-tion of gas upon cessation of pumping is assumed to be governedby the same properties as desorption. The capillary pressurebetween gas and water is set to zero.
An initial pressure of 900 psia at an elevation of 0.0 m (this cor-responding to the top of the coalbed layer) is assumed. This isequivalent to a head of 623 m. The initial gas content is set to1.0 � 10�2 Msm3/m3.
3.2. Six layer model
Simulation grid specifications are provided in Table 2. Onceagain, the grid is comprised of 368 rows and 368 columns. Rowand column widths vary between 50 m and 100 m; dimensionsof the total model domain are roughly 30 km � 30 km. The gridcontains 6 layers. Layers 1 and 2 represent overburden materialwhile layers 3–6 represent a coal measure sequence comprisingtwo separate, continuous coal seams (layers 4 and 6) overlain by
Table 1Specifications of the single layer model.
Parameters Petroleum units Metric units
Grid extent ca.800.000 ft � 800.000 ft
ca.244 km � 244 km
Grid dimensions 1 layer, 368 columns, 368 rowsGrid cell size 49.2 ft–3280 ft 15 m–1 kmThickness of coal seam 3.28 ft 1 mPorosity 1%Permeability 200 mD 0.25 m/dMatrix gas content at initial
pressure0.01 Mscf/ft3 0.01 Msm3/m3
Sorption capacity at initialpressure
0.012 Mscf/ft3 0.012 Msm3/m3
Diffusion coefficient of coalmatrix
0.01 Mscf/ft2 0.01 Msm3/m3
Initial pressure 900 psia 622.59 m H2ONumber of wells 9Duration of production phase 7305 daysDuration of recovery phase 7305 daysTarget water extraction rate 200 bbl/day 31.80 m3/dBottom-hole pressure
constraint73.5 psia 41.35 m H2O
Model boundaries No flow
continuous interburden layers (layers 3 and 5). Layer thicknessesare provided in Table 3.
Extraction takes place through a regular array of 25 wellsseparated by 750 m (a typical well separation in the Surat Basin(Arrow-Energy, 2012; QGC, 2012). Well diameters are 0.25 m;pumping specifications are 600 stb/day (95.4 m3/day) of waterwith a bottom-hole pressure constraint of 73.5 psia at the centreof the top coal seam. Pumping takes place for 20 years; this is fol-lowed by a recovery period of 20 years. Screens are open to both ofthe coal layers in all wells; extraction is distributed automaticallybetween these two layers in the manner described above. A con-stant pressure condition equal to the initial pressure is applied atall lateral boundaries. Rock properties are listed in Table 3.
4. Numerical simulations
4.1. Single layer model
4.1.1. VerificationPrior to undertaking any of the numerical experiments
documented below, a number of ECLIPSE simulations were under-taken under similar pumping conditions to those described above,but with gas concentrations set to zero; single-phase flow wasthereby simulated. ECLIPSE-calculated pressures were convertedto heads and compared with heads calculated by MODFLOW-USGunder the same pumping regime. Differences between correspond-ing model outputs were found to be minimal.
4.1.2. Errors incurred by neglecting desaturationFirst ECLIPSE was used to simulate water and gas extraction
under the conditions described in Section 3.1 The black line in

Table 2Specifications of the six layer model. Specifications not provided below are the same as those in Table 1.
Property Petroleum units Metric units
Grid extent 98.400 ft � 98.400 ft 30 km � 30 kmDepth 98.4 ft 30 mGrid dimensions 6 layers, 368 columns, 368 rowsGrid cell size 164 ft–328 ft 50 m–100 mNumber of wells 25Distance between wells 2460 ft 750 mTarget water extraction rate 600 bbl/day 95.4 m3/dBottom-hole pressure constraint 73.5 psia 41.35 m H2OModel boundaries MODLFOW-USG: GHB boundary at edges of layers 1–6; ECLIPSE: ‘‘AQUFETP’’ layers 1–6
Table 3Layer thicknesses and rock properties used by six layer model.
Layer Unit Thickness(m)
Porosity(–)
Kh (m/d) Kz (m/d)
1 Aquitard 1 0.15 1.3 � 10�2 1.3 � 10�5
2 Aquitard 9 0.15 1.3 � 10�2 1.3 � 10�5
3 Interburden 9 0.05 1.3 � 10�3 1.3 � 10�6
4 Coal 1 0.01 2.5 � 10�1 1.3 � 10�5
5 Interburden 9 0.05 1.3 � 10�3 1.3 � 10�6
6 Coal 1 0.01 2.5 � 10�1 1.3 � 10�5
D. Herckenrath et al. / Journal of Hydrology 523 (2015) 587–601 593
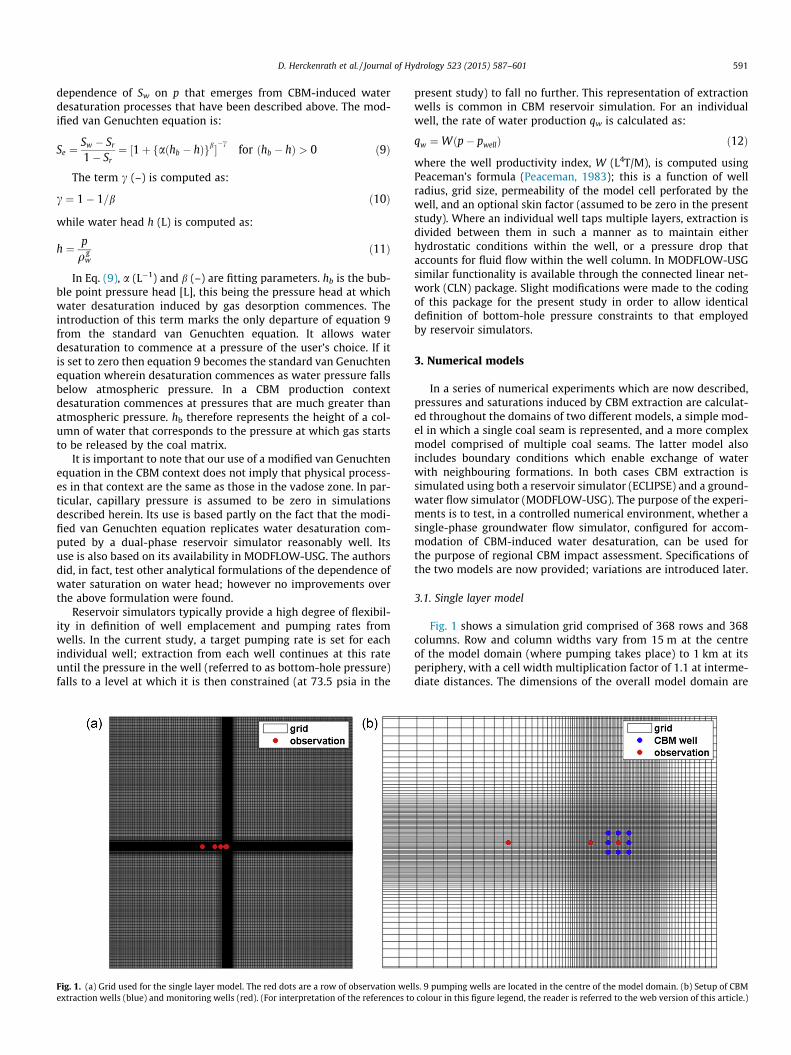
Fig. 3 shows ECLIPSE-simulated drawdowns at 6 different distancesfrom the centre of the extraction well field; note that pumping isassumed to commence at the beginning of year 2000. Close to
Fig. 3. Drawdown calculated by ECLIPSE (solid black lines), MFsingle (red dashed lines), Mto colour in this figure legend, the reader is referred to the web version of this article.)
the wells, drawdowns of up to 500 m are sustained during the20 years of CBM production. Maximum drawdowns diminish toaround 80 m at a distance of 24,390 m from the production centre.Near the wells the bottom-hole pressure limited maximum draw-down is achieved within a year. Further from the wells drawdownsincrease steadily during the CBM production period; far from thewells these continue to increase even after CBM production hasceased. When pumping ceases, drawdown recovery close to thewells is initially rapid as residual gas is re-adsorbed into the coalmatrix and replaced (in coal cleats) by nearby water. This is fol-lowed by a period of more gradual recovery as water flow withinthe model domain attempts to establish a new hydrostatic equilib-rium. Because boundary conditions are such that the modeldomain is essentially a ‘‘closed box’’, initial pressures are not re-at-tained. At larger distances from the CBM well cluster recovery is
FECLIPSE-rates (green lines) and MFVG (blue lines). (For interpretation of the references
594 D. Herckenrath et al. / Journal of Hydrology 523 (2015) 587–601
more gradual, though is essentially complete at distances of up to12,195 m from the pumping centre by the year 2030.
The simulation was then repeated using MODFLOW-USG. Iden-tical pumping conditions (including target well extraction ratesand bottom-hole pressure constraints) were imposed on extractionwells as were used in the above ECLIPSE simulation. HoweverMODFLOW-USG was employed as a ‘‘traditional groundwatermodel’’ as no desaturation was allowed to occur; hence extractedwater is sourced from elastic storage only, and there is no perme-ability reduction that would occur due to the presence of gas. Werefer to simulations under these conditions as ‘‘MFsingle’’ (where ‘‘s-ingle’’ stands for ‘‘single-phase flow’’ as is assumed in standardgroundwater models). Simulated drawdowns are shown as dashedred lines in Fig. 3. At the production wells maximum MFsingle andECLIPSE drawdowns are very similar as both models encounterthe same bottom-hole pressure constraint. However MFsingle
encounters this constraint at an earlier time than does ECLIPSE.At 1220 m from the production centre ECLIPSE and MFsingle draw-downs deviate significantly from each other, with MFsingle overes-timating drawdown by more than 100 m. At larger distances thisdiscrepancy increases; at the same time MFsingle drawdowns pro-pagate faster outwards from the well field than do ECLIPSE draw-downs. As has already been discussed, MFsingle’s overestimationof drawdown is an outcome of two factors, namely (1) its relianceon elastic storage as its only source of water to supply the demandsof extraction whereas ECLIPSE draws on pore water that is dis-placed by gas, and (2) its failure to reduce relative permeabilitywith drawdown as MFsingle allows no desaturation.
Further discrepancies are encountered when comparing totalvolumes of extracted water calculated by the two simulators. Over20 years of production ECLIPSE extracts 8.52 � 105 m3 of waterwhile MFsingle extracts 1.16 � 106 m3 of water; the latter thereforeoverestimates water production by 36%.
Significant differences in simulated recovery are also observed,with MFsingle recovery being much faster than that of ECLIPSE. Theredistribution of water that is necessary to attain a new equilibri-um can happen much more quickly when there is no desaturation,and groundwater flow therefore takes place under fully saturatedand confined conditions.
4.1.3. Error mitigation through use of ECLIPSE pumping ratesThe green dashed line in Fig. 3 shows drawdowns calculated
using MODFLOW-USG, once again run as a traditional groundwatermodel, but this time using pumping rates calculated by ECLIPSE;this run is referred to as MFECLIPSE-rates. A similar strategy was
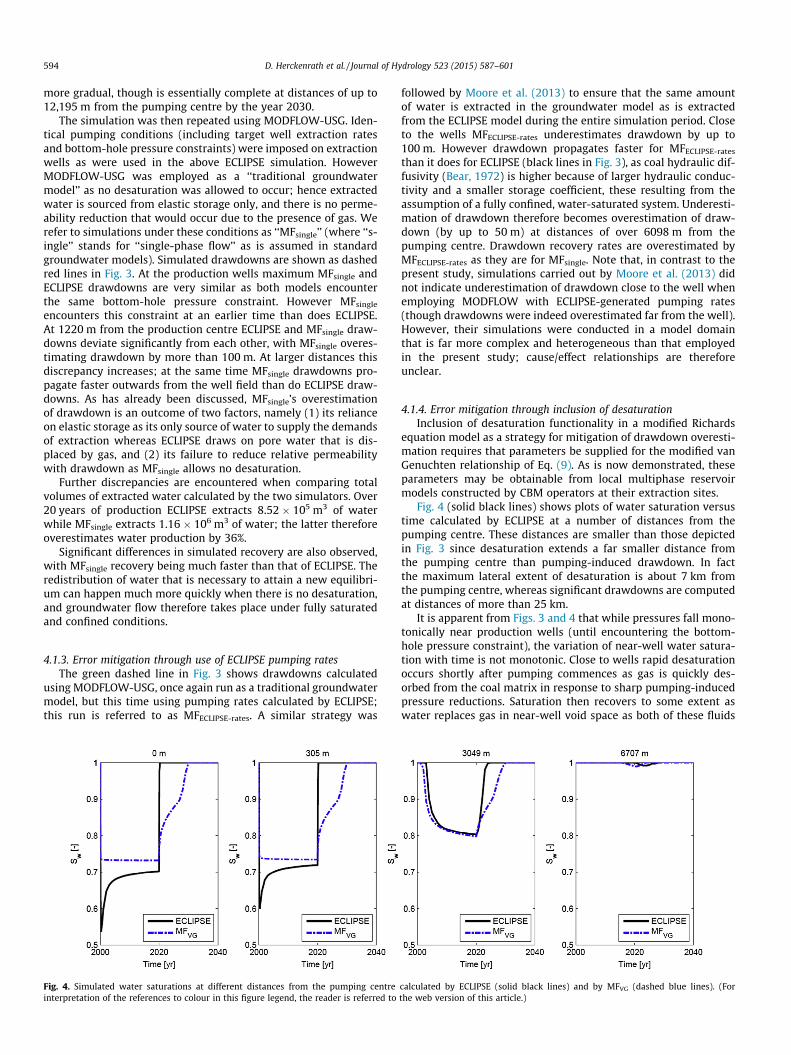
Fig. 4. Simulated water saturations at different distances from the pumping centreinterpretation of the references to colour in this figure legend, the reader is referred to
followed by Moore et al. (2013) to ensure that the same amountof water is extracted in the groundwater model as is extractedfrom the ECLIPSE model during the entire simulation period. Closeto the wells MFECLIPSE-rates underestimates drawdown by up to100 m. However drawdown propagates faster for MFECLIPSE-rates
than it does for ECLIPSE (black lines in Fig. 3), as coal hydraulic dif-fusivity (Bear, 1972) is higher because of larger hydraulic conduc-tivity and a smaller storage coefficient, these resulting from theassumption of a fully confined, water-saturated system. Underesti-mation of drawdown therefore becomes overestimation of draw-down (by up to 50 m) at distances of over 6098 m from thepumping centre. Drawdown recovery rates are overestimated byMFECLIPSE-rates as they are for MFsingle. Note that, in contrast to thepresent study, simulations carried out by Moore et al. (2013) didnot indicate underestimation of drawdown close to the well whenemploying MODFLOW with ECLIPSE-generated pumping rates(though drawdowns were indeed overestimated far from the well).However, their simulations were conducted in a model domainthat is far more complex and heterogeneous than that employedin the present study; cause/effect relationships are thereforeunclear.
4.1.4. Error mitigation through inclusion of desaturationInclusion of desaturation functionality in a modified Richards
equation model as a strategy for mitigation of drawdown overesti-mation requires that parameters be supplied for the modified vanGenuchten relationship of Eq. (9). As is now demonstrated, theseparameters may be obtainable from local multiphase reservoirmodels constructed by CBM operators at their extraction sites.
Fig. 4 (solid black lines) shows plots of water saturation versustime calculated by ECLIPSE at a number of distances from thepumping centre. These distances are smaller than those depictedin Fig. 3 since desaturation extends a far smaller distance fromthe pumping centre than pumping-induced drawdown. In factthe maximum lateral extent of desaturation is about 7 km fromthe pumping centre, whereas significant drawdowns are computedat distances of more than 25 km.
It is apparent from Figs. 3 and 4 that while pressures fall mono-tonically near production wells (until encountering the bottom-hole pressure constraint), the variation of near-well water satura-tion with time is not monotonic. Close to wells rapid desaturationoccurs shortly after pumping commences as gas is quickly des-orbed from the coal matrix in response to sharp pumping-inducedpressure reductions. Saturation then recovers to some extent aswater replaces gas in near-well void space as both of these fluids
calculated by ECLIPSE (solid black lines) and by MFVG (dashed blue lines). (Forthe web version of this article.)

Fig. 5. (a) Sw vs. p at various times during CBM production. (b) Sw vs. p during recovery after CBM production. Time labels in 5b represent time elapsed since cessation ofpumping.
Fig. 6. Sw vs. p after 20 years of CBM production (red dots). The black curve showsthe estimated modified van Genuchten function. (For interpretation of thereferences to colour in this figure legend, the reader is referred to the web versionof this article.)
D. Herckenrath et al. / Journal of Hydrology 523 (2015) 587–601 595
flow towards the wells. An immediate repercussion of the non-monotonic behaviour of saturation with time is that the samewater saturation can occur at multiple pressures; the notion ofpseudo-equilibrium conditions in which saturation is pressure-de-pendent as expressed by Eq. (9) is thus violated at these earlytimes.
Fig. 5a provides a scatterplot of water saturation versus pres-sure head (referred to as Sw vs. p) calculated during the CBM pro-duction phase of the ECLIPSE simulation. All cells for whichdesaturation occurs in this simulation are featured in this plot.Points within the plot are colour-coded according to simulationtime. Points at the left of the plot are those nearest to the produc-tion wells where pressure reduction is greatest. It is apparent fromthese plots that while the relationship between Sw and p is hardlystationary with time, it evolves over time to a curve where time-s-tationarity appears to be attained. Fig. 5b shows Sw and p scatter-plots during recovery. No stable relationship between Sw and pexists over this time; complete resaturation occurs afterapproximately 6 years of recovery.
The shape of the time-asymptotic curve of Fig. 5a suggests theattainment of a dynamic pseudo-equilibrium state. Except for loca-tions in the immediate vicinity of the extraction wells, watersaturation appears to decreases in a regular way as pressure falls.Meanwhile cones of drawdown and desaturation increase in areaand perimeter as gas and water production continue. Water ismade available for transmission to wells through desaturationitself. At the same time, gas is made available because reductionin pressure induces gas desorption from the coal matrix inamounts described by the Langmuir isotherm; see Eq. (1). Everincreasing amounts of both of these become available as the coneof pressure decline expands. The perimeter of the cone of waterdesaturation, where saturation falls from a value of unity, marksthe location where pressure falls below the threshold at which,according to the Langmuir isotherm, gas can be released to the flowsystem. Meanwhile, between the desaturation perimeter and theextraction wells, gas and water are continuously released fromstorage as pressure and saturation continue to fall. Close to thewells themselves, however, the rate of gas desorption falls to zeroas a constant pressure condition is maintained there.
It is obvious from Fig. 5b that as soon as pumping ceases and therecovery process commences, saturation cannot be considered,even approximately, to be a function of pressure despite the factthat such a relationship had been established prior to cessationof pumping. Fig. 4 indicates that water re-saturation is almost
immediate near switched-off extraction wells where pressure gra-dients are steepest. Here down-gradient flow of water that waspreviously collected by wells now fills cleats as low pressure gasrapidly re-enters the matrix where, with very little rise in pressure,its re-adsorption is readily accommodated by the Langmuir iso-therm. Meanwhile, further from pumping wells where pressuresare higher and gradients are lower, recovery of the pressure neces-sary for readsorption of gas to occur is slower. However re-adsorp-tion does indeed occur, progressing from low pressure areas nearthe well to higher pressure areas further from the well, forming aring of desaturation whose internal radius expands until it meetsits almost static external radius when desaturation had ceased.
Parameters a and b of the modified van Genuchten equation(Eq. (9)) used by MODFLOW-USG were obtained by fitting thisequation to the Sw vs. p scatterplot of Fig. 5a. In fitting this curvehb (the bubble point pressure head) was assumed to be the sameas the gas desorption threshold calculated using the same Lang-muir isotherm as that used by ECLIPSE. The residual water satura-tion was also adopted from the ECLIPSE simulation. Fig. 6 showsthe resulting curve; best-fit parameters are listed in Table 4.

Table 4Estimated modified van Genuchten parameters for thesingle layer model.
Parameter Value
Sr (–) 0.2a (m�1) 0.22b (–) 1.073n (–) 2hb (m) 463
596 D. Herckenrath et al. / Journal of Hydrology 523 (2015) 587–601
Equipped with the modified van Genuchten relationshipderived in this manner, MODFLOW-USG was used to simulatethe evolution of water pressure and saturation during extractionand recovery. The same pumping conditions (i.e. a target extractionrate together with a bottom-hole pressure constraint) and relativepermeability function for water were provided to MODFLOW-USGas were provided to ECLIPSE; hence MODFLOW-USG calculatesappropriate pumping rates itself once the bottom-hole pressureconstraint is encountered. Pressures resulting from this simulationare labelled MFVG in Fig. 3; see the dashed blue lines. It is apparentthat drawdowns calculated by MFVG provide a very good match tothose calculated by ECLIPSE over the 20 year production period.However drawdowns at very early simulation times close toextraction wells are over-estimated. More significant differencesbetween MFVG and ECLIPSE drawdowns occur over the 20 yearrecovery period where MFVG slightly underestimates drawdowns
Fig. 7. Drawdowns calculated for the six layer model. Each subplot represents a differenfrom the well cluster are shown for the pertinent layer within each subplot. Black linescalculated by MFVG. (For interpretation of the references to colour in this figure legend,
calculated by ECLIPSE during part of the recovery period, andslightly overestimates ECLIPSE drawdowns during the other part.Nevertheless the fit with ECLIPSE-drawdowns during this recoveryperiod is far better than that attained by either MFsingle orMFECLIPSE-rates.
Water saturations calculated by ECLIPSE and MFVG are com-pared in Fig. 4. Despite the attainment of a relatively good pressurematch during the recovery phase, ECLIPSE saturation behaviourduring recovery is poorly matched by MFVG; in particular, thenear-instant resaturation attained through gas re-adsorption can-not be reproduced by MFVG. During the 20 year pumping period,the match between ECLIPSE and MFVG saturations is reasonable,except for early times close to the extraction centre where thetransient desaturation peak calculated by ECLIPSE cannot be repro-duced by MFVG.
Total extracted water volume calculated by MFVG matches thatcomputed by ECLIPSE reasonably well, the former being only 2%higher than the latter.
In summary, drawdowns calculated by MFVG track those calcu-lated by ECLIPSE well, with the greatest departures being at earlytimes in close proximity to pumping wells, and during the recoveryperiod. MFVG’s ability to reproduce ECLIPSE-calculated watersaturations is not as good. However, this is of secondary impor-tance, as the purpose of the present study is to assess MFVG’s abilityto act in regional CBM impact assessment where the primary goalof modelling is to predict regional water-pressure drawdown and
t layer of the model. In contrast to Figs. 3 and 4, drawdowns at different distancesrepresent drawdowns calculated by ECLIPSE and blue lines represent drawdowns
the reader is referred to the web version of this article.)

Table 5Estimated modified van Genuchten parameters for layers 4 and 6 of the six layermodel.
Parameter Layer 4 Layer 6
Sr (–) 0.2 0.2a (m�1) 0.40 0.51b (–) 1.053 1.047n (–) 2 2hb (m) 468 473
D. Herckenrath et al. / Journal of Hydrology 523 (2015) 587–601 597
global water production figures rather than near-well watersaturation or gas production figures.
Though not reported herein, similar numerical experimentswere performed using variations of the above model in which per-meability, porosity, relative permeability, layer thickness, andLangmuir isotherm characteristics were all varied. In all cases astable asymptotic Sw vs. p curve was attained in the ECLIPSEsimulations. In all cases MFVG replicated ECLIPSE-calculated draw-downs very well during the extraction phase of the simulation, andmoderately well during recovery, when using a modified vanGenuchten function that matches the asymptotic Sw vs. p curvecomputed by ECLIPSE.
4.2. Six layer model
4.2.1. Flat layersThe six layer model was described in Section 3.2. Recall that this
model features two overburden layers, two coal layers and twointerburden layers. It is also laterally enclosed by fixed pressureboundary conditions.
ECLIPSE-calculated drawdowns for the six layer model areshown as solid black lines in Fig. 7 wherein drawdown curves ineach layer at three different distances from the well are provided.Largest drawdowns of about 500 m are incurred near the extrac-tion wells in the coal seam layers (i.e. layers 4 and 6). Total extract-ed water over 20 years of production is 7.02 � 106 m3.
As provision of ECLIPSE-calculated pumping rates to a MOD-FLOW-USG model that does not allow desaturation does not yieldaccurate prediction of drawdown for the single layer model, the‘‘MFECLIPSE-rates’’-modelling strategy is not repeated for the six layermodel. Only the performance of MFVG is discussed.
Scatterplots of Sw vs. p for layer 4 at different simulation timesare depicted in Fig. 8; those for layer 6 are similar. In both cases atime-stationary Sw vs. p curve is approached at high simulationtimes (see Fig. 8a). The modified van Genuchten curves fitted toboth of these are shown in Fig. 8b; fitted parameters used by thisequation are listed in Table 5. Drawdowns calculated by MFVG
when using these parameters are shown in blue in Fig. 7. As forthe single layer case, drawdowns calculated by MFVG match thosecalculated by ECLIPSE well, except at early simulation times andduring recovery. The rate of recovery is slightly overestimated byMFVG. MFVG extracts a total of 6.71 � 106 m3 of water; in doingso it underestimates total ECLIPSE water extraction by 4%.
Fig. 8. (a) Sw vs. p at different times since commencement of extraction for coal seam layelisted in Table 5.
Differences in water saturations calculated by ECLIPSE andMFVG are illustrated in Fig. 9. At early times near the productionwells, saturations calculated by ECLIPSE are significantly lowerthan those calculated by MFVG where, as already discussed, the lat-ter is unable to simulate the high levels of desaturation thataccompany rapid gas desorption; this is an outcome of the staticrelationship between saturation and pressure that is employedby MFVG. Upon cessation of pumping, MFVG over-estimatesdesaturation as ECLIPSE simulates rapid gas re-adsorption wherebygas in coal cleats is quickly removed and replaced by water.
4.2.2. Sloping layersIntroduction of a sloping segment to the synthetic coal measure
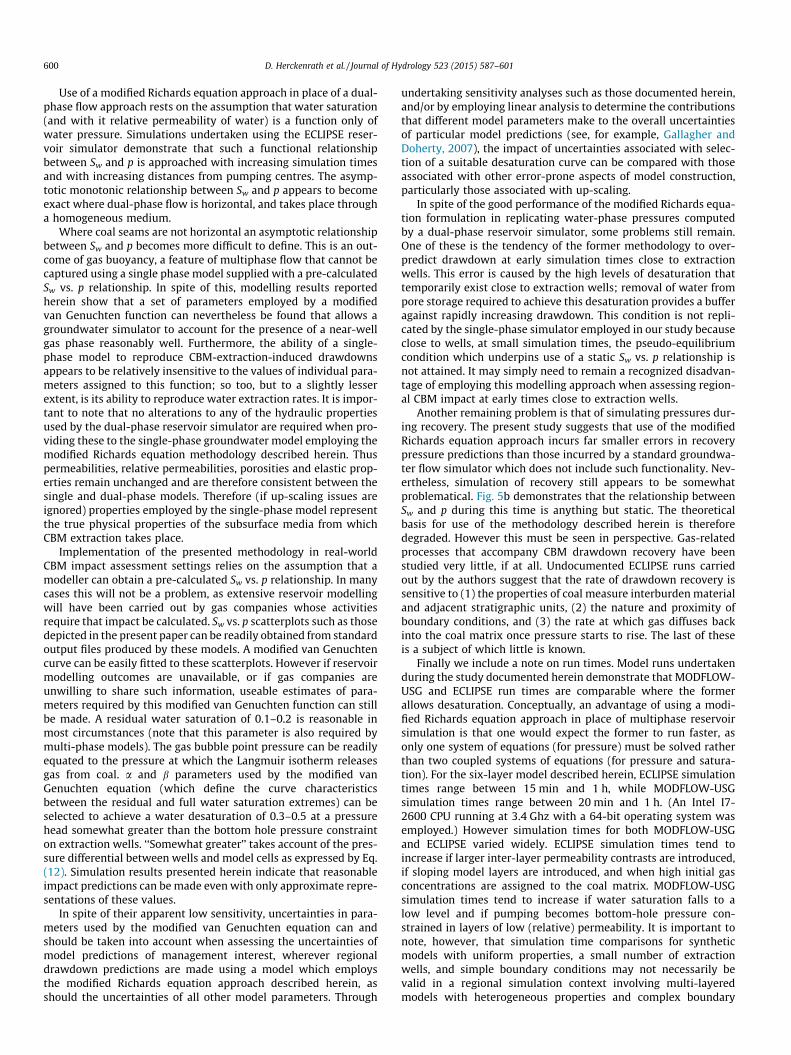
sequence leads to significant scatter of Sw vs. p. Fig. 11a (diamondmarkers) shows the ECLIPSE scatterplot at a simulation time of20 years for layer 4 (which is similar to that for layer 6) where anorth–south segment of slope 2% is introduced to the central partof the model domain between rows 153 and 215 (a distance of3000 m); this slope is applied to all model layers so that the thick-ness of each remains uniform. Buoyant upslope migration of gas tothe top of coal seams is visible in Fig. 10 which depicts the spatialdisposition of saturation in the upper coal layer (layer 4) at the endof the production period (i.e. at a simulation time of 20 years).
Parameters for use of the modified van Genuchten functionwere obtained for MFVG simulations conducted on the sloping-seg-ment model by visually fitting this function to the ECLIPSE-gener-ated Sw vs. p scatterplot of Fig. 11a. See the red line superimposedon the Sw vs. p scatterplot in this figure; parameters pertaining tothis curve are listed in Table 6. Fig. 11c and d compare pressureand saturation profiles through the centre of the model domaincomputed by ECLIPSE with those computed by MFVG when usingthese parameters (see red lines again). Drawdown profiles are ingood agreement while saturation profiles (which, as stated
r 4; (b) Estimated modified van Genuchten-curves for layers 4 and 6; parameters are
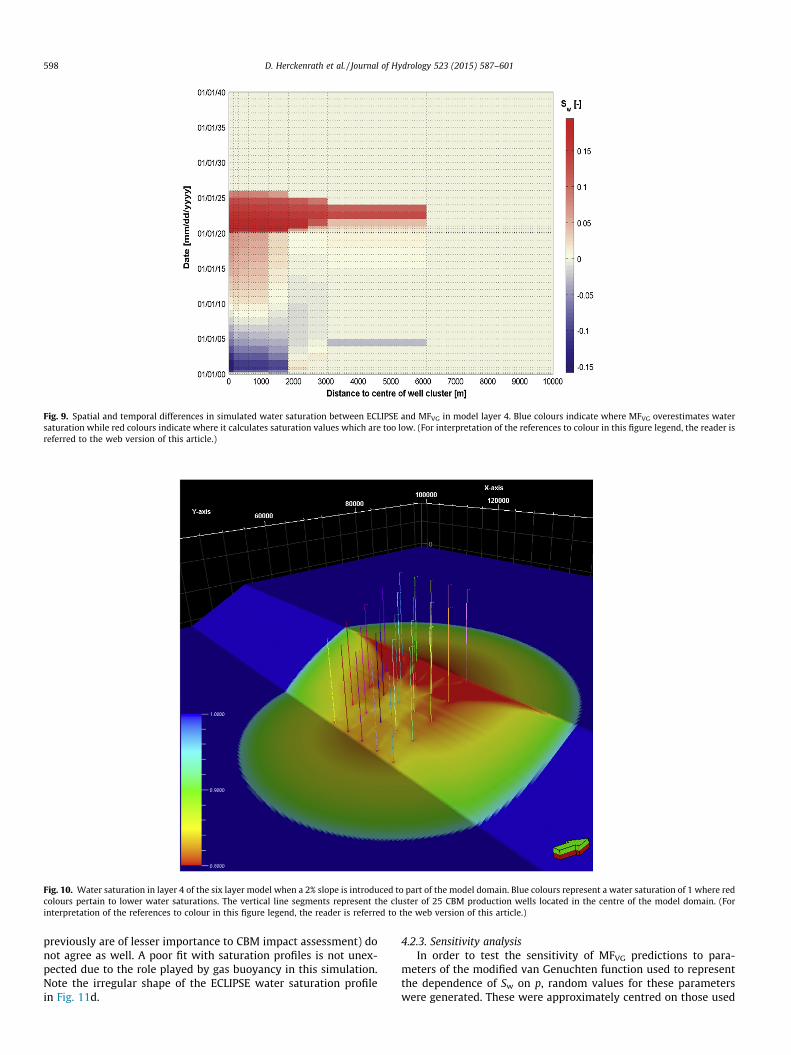
Fig. 9. Spatial and temporal differences in simulated water saturation between ECLIPSE and MFVG in model layer 4. Blue colours indicate where MFVG overestimates watersaturation while red colours indicate where it calculates saturation values which are too low. (For interpretation of the references to colour in this figure legend, the reader isreferred to the web version of this article.)
Fig. 10. Water saturation in layer 4 of the six layer model when a 2% slope is introduced to part of the model domain. Blue colours represent a water saturation of 1 where redcolours pertain to lower water saturations. The vertical line segments represent the cluster of 25 CBM production wells located in the centre of the model domain. (Forinterpretation of the references to colour in this figure legend, the reader is referred to the web version of this article.)
598 D. Herckenrath et al. / Journal of Hydrology 523 (2015) 587–601
previously are of lesser importance to CBM impact assessment) donot agree as well. A poor fit with saturation profiles is not unex-pected due to the role played by gas buoyancy in this simulation.Note the irregular shape of the ECLIPSE water saturation profilein Fig. 11d.
4.2.3. Sensitivity analysisIn order to test the sensitivity of MFVG predictions to para-
meters of the modified van Genuchten function used to representthe dependence of Sw on p, random values for these parameterswere generated. These were approximately centred on those used

Fig. 11. (a) Modified van Genuchten functions superimposed on ECLIPSE-calculated Sw vs. p scatterplot. (b) Water extraction rates. (c) Drawdown profile through centre of themodel domain at a simulation time of 20 years. (d) Water saturation profile through centre of the model domain at a simulation time of 20 years. ECLIPSE outputs are plottedusing black diamond markers; red lines pertain to a MFVG simulation using a modified van Genuchten function that was ‘‘fitted by eye’’ to the ECLIPSE-generated Sw vs. pscatterplot. Green and yellow lines pertain to randomly-generated modified van Genuchten parameters. See text for further details. (For interpretation of the references tocolour in this figure legend, the reader is referred to the web version of this article.)
Table 6The first column of values represents the modified van Genuchten parameters thatwere used to fit the Sw vs. p scatter plot obtained with ECLIPSE. The last two columnsshow the parameter bounds used in randomly generating modified van Genuchtenfunctions that are tested as part of the sensitivity analysis conducted for the slopingsix layer model.
Parameter Initial value (fitted by eye) Lower bound Upper bound
Sr (–) 0.2 0.2 0.2a (m�1) 0.15 0.01 0.60b (–) 1.045 1.01 1.20n (–) 2 2 2hb (m) 600 540 660
D. Herckenrath et al. / Journal of Hydrology 523 (2015) 587–601 599
to generate the modified van Genuchten curve depicted in Fig. 11a.For all parameters a uniform probability distribution wasemployed spanning the interval between the upper and lowerbounds listed in Table 6. Note that the bounds for hb are narrow,reflecting the fact that this parameter can be derived from reser-voir Langmuir properties with reasonable precision.
Fig. 11a shows the range of modified van Genuchten functionscalculated from these random parameters together with theECLIPSE scatterplot of Sw vs. p. These are coloured yellow, but witha subset coloured green; the basis for selection of the green subsetis explained below. Fig. 11c shows layer 4 drawdowns computedusing MFVG along a profile through the centre of the model domainat a simulation time of 20 years. Drawdowns at simulation times of2 and 10 years show similar patterns, but are not presented here.Saturations along this same profile are depicted in Fig. 11d. Waterextraction rates are plotted against time in Fig. 11b. Yellow andgreen curve colouring in all of these figures corresponds to thatin Fig. 11a. In all cases the pertinent ECLIPSE-calculated quantityis shown with black diamond markers. These figures demonstrate
relatively small sensitivity of MFVG-computed drawdowns to para-meters employed by the modified van Genuchten function. Pump-ing rates are more sensitive to these parameters however; watersaturations are the most sensitive.
The set of curves coloured green in Fig. 11 afford a better fitwith ECLIPSE-calculated pumping rates than those coloured yel-low. Fit was measured using a weighted least squares objectivefunction calculated on the basis of differences between ECLIPSEand MFVG pumping rates; weights were calculated as the inverseof ECLIPSE pumping rates. A green colouration threshold was setat an objective function value that indicates a root-mean-squaremisfit of 5% of ECLIPSE-calculated pumping rates. It is apparentfrom Fig. 11 that parameters employed by the modified vanGenuchten function which endow MFVG with the ability to fitwater extraction rates well, are also those which result in a goodfit with the ECLIPSE-generated Sw vs. p scatterplot, and a moderatefit with ECLIPSE-calculated saturations.
The above analysis suggests that model outputs of most interestto CBM regional impact assessment are relatively insensitive to theexact choice of modified van Genuchten function parameters. If aSw vs. p curve described by this function passes roughly throughan ECLIPSE-generated Sw vs. p scatterplot, then drawdowns andpumping rates computed by MFVG will approximate those comput-ed by ECLIPSE.
5. Discussion
The outcomes of a series of numerical experiments have beenpresented. These experiments were conducted in order to examinewhether use of a modified single-phase groundwater simulator,configured to allow desaturation to occur in coal layers, is justifi-able when assessing the effects of CBM production on regionalgroundwater systems.
600 D. Herckenrath et al. / Journal of Hydrology 523 (2015) 587–601
Use of a modified Richards equation approach in place of a dual-phase flow approach rests on the assumption that water saturation(and with it relative permeability of water) is a function only ofwater pressure. Simulations undertaken using the ECLIPSE reser-voir simulator demonstrate that such a functional relationshipbetween Sw and p is approached with increasing simulation timesand with increasing distances from pumping centres. The asymp-totic monotonic relationship between Sw and p appears to becomeexact where dual-phase flow is horizontal, and takes place througha homogeneous medium.
Where coal seams are not horizontal an asymptotic relationshipbetween Sw and p becomes more difficult to define. This is an out-come of gas buoyancy, a feature of multiphase flow that cannot becaptured using a single phase model supplied with a pre-calculatedSw vs. p relationship. In spite of this, modelling results reportedherein show that a set of parameters employed by a modifiedvan Genuchten function can nevertheless be found that allows agroundwater simulator to account for the presence of a near-wellgas phase reasonably well. Furthermore, the ability of a single-phase model to reproduce CBM-extraction-induced drawdownsappears to be relatively insensitive to the values of individual para-meters assigned to this function; so too, but to a slightly lesserextent, is its ability to reproduce water extraction rates. It is impor-tant to note that no alterations to any of the hydraulic propertiesused by the dual-phase reservoir simulator are required when pro-viding these to the single-phase groundwater model employing themodified Richards equation methodology described herein. Thuspermeabilities, relative permeabilities, porosities and elastic prop-erties remain unchanged and are therefore consistent between thesingle and dual-phase models. Therefore (if up-scaling issues areignored) properties employed by the single-phase model representthe true physical properties of the subsurface media from whichCBM extraction takes place.
Implementation of the presented methodology in real-worldCBM impact assessment settings relies on the assumption that amodeller can obtain a pre-calculated Sw vs. p relationship. In manycases this will not be a problem, as extensive reservoir modellingwill have been carried out by gas companies whose activitiesrequire that impact be calculated. Sw vs. p scatterplots such as thosedepicted in the present paper can be readily obtained from standardoutput files produced by these models. A modified van Genuchtencurve can be easily fitted to these scatterplots. However if reservoirmodelling outcomes are unavailable, or if gas companies areunwilling to share such information, useable estimates of para-meters required by this modified van Genuchten function can stillbe made. A residual water saturation of 0.1–0.2 is reasonable inmost circumstances (note that this parameter is also required bymulti-phase models). The gas bubble point pressure can be readilyequated to the pressure at which the Langmuir isotherm releasesgas from coal. a and b parameters used by the modified vanGenuchten equation (which define the curve characteristicsbetween the residual and full water saturation extremes) can beselected to achieve a water desaturation of 0.3–0.5 at a pressurehead somewhat greater than the bottom hole pressure constrainton extraction wells. ‘‘Somewhat greater’’ takes account of the pres-sure differential between wells and model cells as expressed by Eq.(12). Simulation results presented herein indicate that reasonableimpact predictions can be made even with only approximate repre-sentations of these values.
In spite of their apparent low sensitivity, uncertainties in para-meters used by the modified van Genuchten equation can andshould be taken into account when assessing the uncertainties ofmodel predictions of management interest, wherever regionaldrawdown predictions are made using a model which employsthe modified Richards equation approach described herein, asshould the uncertainties of all other model parameters. Through
undertaking sensitivity analyses such as those documented herein,and/or by employing linear analysis to determine the contributionsthat different model parameters make to the overall uncertaintiesof particular model predictions (see, for example, Gallagher andDoherty, 2007), the impact of uncertainties associated with selec-tion of a suitable desaturation curve can be compared with thoseassociated with other error-prone aspects of model construction,particularly those associated with up-scaling.
In spite of the good performance of the modified Richards equa-tion formulation in replicating water-phase pressures computedby a dual-phase reservoir simulator, some problems still remain.One of these is the tendency of the former methodology to over-predict drawdown at early simulation times close to extractionwells. This error is caused by the high levels of desaturation thattemporarily exist close to extraction wells; removal of water frompore storage required to achieve this desaturation provides a bufferagainst rapidly increasing drawdown. This condition is not repli-cated by the single-phase simulator employed in our study becauseclose to wells, at small simulation times, the pseudo-equilibriumcondition which underpins use of a static Sw vs. p relationship isnot attained. It may simply need to remain a recognized disadvan-tage of employing this modelling approach when assessing region-al CBM impact at early times close to extraction wells.
Another remaining problem is that of simulating pressures dur-ing recovery. The present study suggests that use of the modifiedRichards equation approach incurs far smaller errors in recoverypressure predictions than those incurred by a standard groundwa-ter flow simulator which does not include such functionality. Nev-ertheless, simulation of recovery still appears to be somewhatproblematical. Fig. 5b demonstrates that the relationship betweenSw and p during this time is anything but static. The theoreticalbasis for use of the methodology described herein is thereforedegraded. However this must be seen in perspective. Gas-relatedprocesses that accompany CBM drawdown recovery have beenstudied very little, if at all. Undocumented ECLIPSE runs carriedout by the authors suggest that the rate of drawdown recovery issensitive to (1) the properties of coal measure interburden materialand adjacent stratigraphic units, (2) the nature and proximity ofboundary conditions, and (3) the rate at which gas diffuses backinto the coal matrix once pressure starts to rise. The last of theseis a subject of which little is known.
Finally we include a note on run times. Model runs undertakenduring the study documented herein demonstrate that MODFLOW-USG and ECLIPSE run times are comparable where the formerallows desaturation. Conceptually, an advantage of using a modi-fied Richards equation approach in place of multiphase reservoirsimulation is that one would expect the former to run faster, asonly one system of equations (for pressure) must be solved ratherthan two coupled systems of equations (for pressure and satura-tion). For the six-layer model described herein, ECLIPSE simulationtimes range between 15 min and 1 h, while MODFLOW-USGsimulation times range between 20 min and 1 h. (An Intel I7-2600 CPU running at 3.4 Ghz with a 64-bit operating system wasemployed.) However simulation times for both MODFLOW-USGand ECLIPSE varied widely. ECLIPSE simulation times tend toincrease if larger inter-layer permeability contrasts are introduced,if sloping model layers are introduced, and when high initial gasconcentrations are assigned to the coal matrix. MODFLOW-USGsimulation times tend to increase if water saturation falls to alow level and if pumping becomes bottom-hole pressure con-strained in layers of low (relative) permeability. It is important tonote, however, that simulation time comparisons for syntheticmodels with uniform properties, a small number of extractionwells, and simple boundary conditions may not necessarily bevalid in a regional simulation context involving multi-layeredmodels with heterogeneous properties and complex boundary
D. Herckenrath et al. / Journal of Hydrology 523 (2015) 587–601 601
conditions which include explicit or implicit interaction with sur-face water systems.
6. Conclusions
CBM impact assessment occupies a unique position in the mod-elling landscape. It is situated at the boundary between two verydifferent modelling contexts, namely reservoir modelling on theone hand and regional groundwater modelling on the other hand.At the present point in time, it is not served well by software andtechniques that have been developed for either of these contexts.State-of-the-art reservoir modelling software is expensive, closedsource, requires a specialized skillset to use, and is not well adapt-ed to representation of boundary conditions to which regionalgroundwater systems are commonly subject. On the other hand,groundwater models cannot simulate processes that are integralto gas extraction, this resulting in a tendency to over-predictimpact of this extraction on regional groundwater systems.
The present paper presents a methodology that allows out-comes of reservoir modelling studies to be used by a groundwatermodel modified to account for the presence of a gas phase. Ofimportance is the definition of an appropriate relationshipbetween water saturation and reservoir pressure that can bederived from such studies. The latter can be approximated with amodified van Genuchten relationship that enables a groundwaterflow model to characterize desaturation. Use of this functionallows the groundwater model to predict drawdowns and waterextraction rates incurred by CBM extraction reasonably well.
The methodology presented herein allows a groundwater mod-el to be used for regional CBM impact assessment, leaving reservoirmodelling to do what it does best, namely perform detailedsimulation of flow of gas and water near wells. Saturation vs. pres-sure relationships emerging from reservoir modelling can be usedby a regional groundwater over those parts of its model domainwhere gas extraction takes place, while it assesses impact overan area that is far larger than the domain of any reservoir model.The impacts of gas extraction on broad scale coal measuresequences, on stratigraphic horizons that overlie and underlie coalmeasure sequences, and over areas where any of these horizonsabut surficial alluvial systems, or interact directly with surfacewater systems, can thereby be assessed by a model that is pri-marily constructed for this task.
Acknowledgements
Funding for this research was provided by the Office of Ground-water Impact Assessment (OGIA) and the National Centre forGroundwater Research and Training (NCGRT), an Australian gov-ernment initiative, supported by the Australian Research Counciland the National Water Commission. The authors would like tothank Schlumberger for donating the ECLIPSE software to under-take the CBM reservoir simulations and thank QGC for their mod-elling and data support.
References
Arrow-Energy, 2012. Environmental Impact Statement - Surat Gas Project, Preparedby: Coffey Environments, Rep., CR 7040_4_v3.
Bear, J., 1972. Dynamics of Fluids in Porous Media. American Elsevier, New York.bhpbilliton, 2012. Mt Arthur Coal Open Cut Modification, Rep.Brooks, R.H., Corey, A.T., 1964. Hydraulic properties of porous media, Hydrology
Papers. Colorado State University, pp. 24.CEDA, 2012. Australia’s Unconventional Energy Options, Rep., Committee for
Economic Development of AustraliaCommonwealth of Australia, 2014. Coal Seam Gas Extraction: Modelling
Groundwater Impacts, Prepared by: Coffey Geotechnics for the Department ofthe Environment, Commonwealth of Australia, Rep.
CSIRO, 2013, Coal seam gas developments – predicting impacts, April.CSIRO, 2014, SIMEDWin Factsheet. <http://www.csiro.au/Organisation-Structure/
Divisions/Earth-Science–Resource-Engineering/SIMEDWin.aspx> (accessed05.12.14).
Fisher, W., 2010. Management and Effects of Coalbed Methane Produced Water inthe Western United States. The National Academies Press.
Gallagher, M., Doherty, J., 2007. Predictive error analysis for a water resourcemanagement model. J. Hydrol. 34 (3–4), 513–533.
Golder Associates Ltd, 2012. Numerical Simulation of Basal AquiferDepressurization in the Presence of Dissolved Gas, Presentation at WaterTech2012.
Golder Associates Pty Ltd, 2009. Coal Seam Gas Field Component for EnvironmentalImpact Statement. QGC Groundwater Study Surat Basin, Queensland, Australia.
Golder Associates Pty Ltd, 2011. Groundwater Impact Assessment Report for QCLNGProject, Appendix C of the Stage 1 CSG Water Management and MonitoringPlan, GEN2 Groundwater Model Report, Queensland, Australia.
Hamawand, I., Yusaf, T., Hamawand, S.G., 2013. Coal seam gas and associated water:A review paper. Renew. Sustain. Energy Rev. 22, 550–560.
Harbaugh, A.W., 2005. MODFLOW-2005. The U.S. Geological Survey ModularGround-Water Model – Ground-Water Flow Process. U.S. Geological SurveyTechniques and Methods.
Howell, S., Guiton., S., de Verteuil, D., Campbell, L., Vaughan, R., Ryan, D., Curum, N.,K. Coulibaly, 2013. The Future of Integrated Groundwater and CSG Simulation –Modeling the Surat Basin, Queensland, Australia, inSPE UnconventionalResources Conference and Exhibition-Asia Pacific, Brisbane, Australia.
Kazemi, H., Merrill Jr., L.S., Porterfield, K.L., Zeman, P.R., 1976. Numerical simulationof water–oil flow in naturally fractured reservoirs. SPE J.
Klinkenberg, L.J., 1941. The permeability of porous media to liquids and gases. Drill.Product. Practice, Am. Petrol. Inst., 200–213
Laubach, S.E., Marrett, R.A., Olson, J.E., Scott, A.R., 1998. Characteristics and originsof coal cleat: a review. Int. J. Coal Geol. 35 (1–4), 175–207.
Manik, J., Ertekin, T., Kohler, T.E., 2002. Development and validation of acompositional coalbed simulator. J. Canad. Petrol. Technol. 41.
Meredith, E., Wheaton, J., Kuzara, S., T. Donato, 2008. Water Year Annual CoalbedMethane Regional Ground-Water Monitoring Report: Powder River Basin,Montana, Rep., MBMG OPEN FILE REPORT 578, Montana Bureau of Mines andGeology.
Moore, T.A., 2012. Coalbed methane: a review. Int. J. Coal Geol. 101, 36–81.Moore, C., Doherty, J., Howell, S., Erriah, L., de Verteuil, D., Cui, T., 2013. Challenges
for upscaling hydraulic properties and processes in the Coal Seam Gas context,Rep. CSIRO.
Moore, C., Doherty, J., Howell, S., Erriah, L., 2014. Some challenges posed by coal bedmethane regional assessment modelling. Groundwater.
Mudd, M.B., 2012. Montana v. Wyoming: An Opportunity to Right the Course forCoalbed Methane Development and Prior Appropriation, Golden Gate U. Envtl.L.J., 298.
Myers, T., 2009. Groundwater management and coal bed methane development inthe Powder River Basin of Montana. J. Hydrol. 368 (1–4), 178–193.
Palmer, I., 2009. Permeability changes in coal: analytical modeling. Int. J. Coal Geol.77 (1–2), 119–126.
Pan, Z.J., Connell, L.D., 2012. Modelling permeability for coal reservoirs: a review ofanalytical models and testing data. Int. J. Coal Geol. 92, 1–44.
Panday, S.N., Langevin, C.D., Niswonger, R.G., Ibaraki, M., Hughes, J.D., 2013.MODFLOW-USG: An Unstructured Grid Version of MODFLOW for SimulatingGroundwater Flow and Tightly Coupled Processes Using a Control VolumeFinite-Difference Formulation.
Peaceman, D.W., 1983. Interpretation of well-block pressures in numerical reservoirsimulation with non-square grid blocks and anisotropic permeability. SPE J. 23,531–543.
QGC, 2012. Queensland Curtis LNG, EIS, Environmental Impacts of Gas Fields, Rep.QGC, 2014. GEN3 Surat Basin Regional Groundwater Flow Model Calibration Report.
QCLNG-BE99-WAT-PLN-000006.Queensland-Government, 2013. Queensland’s coal seam gas overview, February,
edited by N. R. a. Mines. Queensland Government, Brisbane.QWC, 2012a. Underground Water Impact Report, Rep. Queensland Water
Commission.QWC, 2012b. Predictive Uncertainty of the Regional-Scale Groundwater Flow Model
for the Surat Cumulative Management Area. Report produced by WatermarkNumerical Computing and Queensland Water Resources Commission.
Ryan, D.J., Hall, A., Erriah, L., Wilson, P.B., 2012. The Walloon Coal Seam Gas Play,Surat Basin, Queensland, APPEA Journal, 52.
Schlumberger, 2012. Manual for ECLIPSE Reservoir simulation software.Seidle, J., 2011. Fundamentals of Coalbed Methane Reservoir Engineering. PennWell,
Tulsa, Oklahoma.Thararoop, P., Karpyn, Z.T., Ertekin, T., 2012. Development of a multi-mechanistic,
dual-porosity, dual-permeability numerical flow model for coalbed methanereservoirs. J. Nat. Gas Sci. Eng. 8, 121–131.
Van Genuchten, M.T., 1980. A closed-form equation for predicting the hydraulicconductivity of unsaturated soils. Soil Sci. Soc. Am. J. 44 (5), 892–898.
Wheaton, J., Metesh, J., 2002. Potential Ground-Water Drawdown and Recoveryfrom Coalbed Methane Development in the Powder River Basin, Montana:Project Completion Report to the U. S. Bureau of Land Management, Rep., OpenFile Report 458, Montana Bureau of Mines and Geology.