Journal of Health Economics - Harvard University Papers... · Journal of Health Economics 32 (2013)...
13
Journal of Health Economics 32 (2013) 850–862 Contents lists available at SciVerse ScienceDirect Journal of Health Economics j o ur na l ho me pag e: www.elsevier.com/locate/econbase Consumers’ misunderstanding of health insurance George Loewenstein a,∗ , Joelle Y. Friedman b,1 , Barbara McGill c,2 , Sarah Ahmad p,13 , Suzanne Linck d,3 , Stacey Sinkula e,4 , John Beshears f,5 , James J. Choi g,6 , Jonathan Kolstad h,7 , David Laibson i,8 , Brigitte C. Madrian j,9 , John A. List k,10 , Kevin G. Volpp l,m,n,o,11 a Carnegie Mellon University, Social and Decision Sciences, 5000 Forbes Avenue, 319 C Porter Hall, Pittsburgh, PA 15213, United States b Center for Health Incentives and Behavioral Economics, Leonard Davis Institute, University of Pennsylvania, Blockley Hall, 1135, 423 Guardian Drive, Philadelphia, PA 19104-6021, United States c Colchester Consulting Group, 387 Park Avenue, Glencoe, IL 60022, United States 12 d Strategic Consultant Product Development l Small Business, Humana, 1100 Employers Boulevard, Green Bay, WI 54344, United States e Managing Actuary | Small Business, Humana, 1100 Employers Boulevard, Green Bay, WI 54344, United States f Stanford Graduate School of Business, 655 Knight Way, Stanford, CA 94305, United States g Yale School of Management, 135 Prospect Street, P.O. Box 208200, New Haven, CT 06520-8200, United States h The Wharton School, University of Pennsylvania, 3641 Locust Walk, 306 CPC, Philadelphia, PA 19104, United States i Robert I Goldman Professor of Economics, Department of Economics, Harvard University, Littauer Center, 1805 Cambridge Street, Cambridge, MA 02138, United States j Harvard University, 79 JFK Street, Cambridge, MA 02138, United States k University of Chicago, 1700 59th Street, Chicago, IL 65422, United States l Philadelphia VA Medical Center, United States m Center for Health Incentives and Behavioral Economics, Leonard Davis Institute, United States n Penn Medicine Center for Innovation, United States o Perelman School of Medicine and the Wharton School, University of Pennsylvania, 1120 Blockley Hall, 423 Guardian Drive, Philadelphia, PA 19104-6021, United States p Commercial Product, Development Humana, 500 W. Main Street, Louisville, KY 40202, United States a r t i c l e i n f o Article history: Received 9 February 2013 Received in revised form 8 April 2013 Accepted 19 April 2013 Available online xxx JEL classification: D8 I1 Keywords: Insurance Behavioral economics Simplification a b s t r a c t We report results from two surveys of representative samples of Americans with private health insur- ance. The first examines how well Americans understand, and believe they understand, traditional health insurance coverage. The second examines whether those insured under a simplified all-copay insurance plan will be more likely to engage in cost-reducing behaviors relative to those insured under a traditional plan with deductibles and coinsurance, and measures consumer preferences between the two plans. The surveys provide strong evidence that consumers do not understand traditional plans and would better understand a simplified plan, but weaker evidence that a simplified plan would have strong appeal to consumers or change their healthcare choices. © 2013 Elsevier B.V. All rights reserved. ∗ Corresponding author. Tel.: +1 412 268 8787. E-mail addresses: [email protected] (G. Loewenstein), [email protected] (B. McGill), [email protected] (S. Ahmad), [email protected] (S. Sinkula), [email protected] (J. Beshears), [email protected] (J.J. Choi), [email protected] (J. Kolstad), [email protected] (D. Laibson), brigitte [email protected] (B.C. Madrian), [email protected] (J.A. List). 1 Tel.: +1 215 746 5873. 2 Tel.: +1 508 251 0418; mobile: +1 617 306 9429. 3 Tel.: +1 920 337 3837; mobile: +1 920 265 8648. 4 Tel.: +1 920 337 8047; mobile: +1 920 376 4089. 5 Tel.: +1 650 723 6792. 6 Tel.: +1 203 436 1833. 7 Tel.: +1 215 573 9075. 8 Tel.: +1 617 496 3402. 9 Tel.: +1 617 495 8917. 10 Tel.: +1 773 702 9811. 11 Tel.: +1 215 573 0270. 12 www.colchesterconsultinggroup.com. 13 Tel.: +1 502 580 8210. 0167-6296/$ – see front matter © 2013 Elsevier B.V. All rights reserved. http://dx.doi.org/10.1016/j.jhealeco.2013.04.004
Transcript of Journal of Health Economics - Harvard University Papers... · Journal of Health Economics 32 (2013)...

C
GSJJa
b
Pc
d
e
f
g
h
i
Uj
k
l
m
n
o
Up
ARRAA
JDI
KIBS
s(
0h
Journal of Health Economics 32 (2013) 850– 862
Contents lists available at SciVerse ScienceDirect
Journal of Health Economics
j o ur na l ho me pag e: www.elsev ier .com/ locate /econbase
onsumers’ misunderstanding of health insurance
eorge Loewensteina,∗, Joelle Y. Friedmanb,1, Barbara McGill c,2, Sarah Ahmadp,13,uzanne Linckd,3, Stacey Sinkulae,4, John Beshears f,5, James J. Choig,6,onathan Kolstadh,7, David Laibsoni,8, Brigitte C. Madrianj,9,ohn A. Listk,10, Kevin G. Volppl,m,n,o,11
Carnegie Mellon University, Social and Decision Sciences, 5000 Forbes Avenue, 319 C Porter Hall, Pittsburgh, PA 15213, United StatesCenter for Health Incentives and Behavioral Economics, Leonard Davis Institute, University of Pennsylvania, Blockley Hall, 1135, 423 Guardian Drive,hiladelphia, PA 19104-6021, United StatesColchester Consulting Group, 387 Park Avenue, Glencoe, IL 60022, United States12
Strategic Consultant Product Development l Small Business, Humana, 1100 Employers Boulevard, Green Bay, WI 54344, United StatesManaging Actuary | Small Business, Humana, 1100 Employers Boulevard, Green Bay, WI 54344, United StatesStanford Graduate School of Business, 655 Knight Way, Stanford, CA 94305, United StatesYale School of Management, 135 Prospect Street, P.O. Box 208200, New Haven, CT 06520-8200, United StatesThe Wharton School, University of Pennsylvania, 3641 Locust Walk, 306 CPC, Philadelphia, PA 19104, United StatesRobert I Goldman Professor of Economics, Department of Economics, Harvard University, Littauer Center, 1805 Cambridge Street, Cambridge, MA 02138,nited StatesHarvard University, 79 JFK Street, Cambridge, MA 02138, United StatesUniversity of Chicago, 1700 59th Street, Chicago, IL 65422, United StatesPhiladelphia VA Medical Center, United StatesCenter for Health Incentives and Behavioral Economics, Leonard Davis Institute, United StatesPenn Medicine Center for Innovation, United StatesPerelman School of Medicine and the Wharton School, University of Pennsylvania, 1120 Blockley Hall, 423 Guardian Drive, Philadelphia, PA 19104-6021,nited StatesCommercial Product, Development Humana, 500 W. Main Street, Louisville, KY 40202, United States
a r t i c l e i n f o
rticle history:eceived 9 February 2013eceived in revised form 8 April 2013ccepted 19 April 2013vailable online xxx
EL classification:
a b s t r a c t
We report results from two surveys of representative samples of Americans with private health insur-ance. The first examines how well Americans understand, and believe they understand, traditional healthinsurance coverage. The second examines whether those insured under a simplified all-copay insuranceplan will be more likely to engage in cost-reducing behaviors relative to those insured under a traditionalplan with deductibles and coinsurance, and measures consumer preferences between the two plans. Thesurveys provide strong evidence that consumers do not understand traditional plans and would better
81
eywords:nsuranceehavioral economicsimplification
understand a simplified plan, but weaker evidence that a simplified plan would have strong appeal toconsumers or change their healthcare choices.
© 2013 Elsevier B.V. All rights reserved.
∗ Corresponding author. Tel.: +1 412 268 8787.E-mail addresses: [email protected] (G. Loewenstein), bmcgill@colchesterconsul
[email protected] (S. Sinkula), [email protected] (J. Beshears), james.choi@yaleD. Laibson), brigitte [email protected] (B.C. Madrian), [email protected] (J.A. List).
1 Tel.: +1 215 746 5873.2 Tel.: +1 508 251 0418; mobile: +1 617 306 9429.3 Tel.: +1 920 337 3837; mobile: +1 920 265 8648.4 Tel.: +1 920 337 8047; mobile: +1 920 376 4089.5 Tel.: +1 650 723 6792.6 Tel.: +1 203 436 1833.7 Tel.: +1 215 573 9075.
167-6296/$ – see front matter © 2013 Elsevier B.V. All rights reserved.ttp://dx.doi.org/10.1016/j.jhealeco.2013.04.004
tinggroup.com (B. McGill), [email protected] (S. Ahmad),.edu (J.J. Choi), [email protected] (J. Kolstad), [email protected]
8 Tel.: +1 617 496 3402.9 Tel.: +1 617 495 8917.10 Tel.: +1 773 702 9811.11 Tel.: +1 215 573 0270.12 www.colchesterconsultinggroup.com.13 Tel.: +1 502 580 8210.

Health
1
(hodespitp
cleaaetoudl
rb(topmstdcdcdf
dtedTaiesoc4stmon
woeie
dbmblmtp
srCqaeot(
ttustt2osas
uwtfishawatcuirpt
2
cri
h–vU
G. Loewenstein et al. / Journal of
. Introduction
Beginning in Fall 2013, as part of the 2010 Affordable Care ActACA), the Federal government and the minority of states whoave opted to do so will begin open enrollment for a new setf ‘affordable insurance exchanges’. The website HealthCare.govescribes an affordable insurance exchange as a “new transpar-nt and competitive insurance marketplace where individuals andmall businesses can buy affordable and qualified health benefitlans.” The linking of the words “competitive” and “affordable”
n the description reflects the stated intention of the designers ofhe ACA that competition between insurance companies will lowerrices while maintaining quality.
In thinking about competition in the insurance market, onean distinguish between two levels at which it occurs. At a higherevel, insurers compete with one another to attract business frommployers (or possibly exchanges) – i.e., to include their plansmong those offered to employees (or exchange subscribers). At
lower level, once a plan has been selected for inclusion by anmployer or exchange, insurers will compete to attract subscriberso their plan as opposed to other plans being offered. Althoughur main focus in this paper is at the lower level – on employeesnderstanding of, attitudes toward, and behaviors contingent uponifferent insurance plans – ideally competition at both of these
evels will have beneficial effects on price and quality.Competition at the consumer level, however, is only likely to
esult in reduced prices and improved quality when sufficient num-ers of consumers make informed decisions. As Gabaix and Laibson2006) show (see, more recently, Heidhues et al., 2012a,b), compe-ition can fail to eliminate biases in markets if there exists a coref consumers who make systematic errors in choosing betweenroducts. Given a significant core of naïve consumers, they show, aarket equilibrium can arise in which naïve consumers pay prices
ubstantially above marginal cost, and effectively subsidize sophis-icated consumers who are able to exploit the mispricing. In theomain of insurance, for example, the existence of a substantialore of consumers who are disproportionately attracted to loweductible policies (see, e.g., Barseghyan et al., 2013; Sydnor, 2010)an enhance insurer’s profits at the expense of those opting for loweductibles, while those who opt for high deductibles escape toairly priced plans.
Whether consumers make self-interested or self-destructiveecisions is not only a function of their individual levels of sophis-ication, but also of market-level factors. Research has shown, forxample, that consumers can be overwhelmed and make worseecisions when they are given too much choice (Cronqvist andhaler, 2004; Iyengar and Lepper, 2000). In the domain of insur-nce, consumers faced with too many choice options, particularlyf not pre-screened for price and quality by an agent such as anmployer, are likely to engage in suboptimal decision strategies,uch as sticking with existing insurers or deciding based on wordf mouth, and competition can suffer as a result. One study of Medi-are plans in a Boston suburb, in which consumers chose between7 different Part D prescription plans, found that the most expen-ive of the highly rated plans charged a premium 2.4 times that ofhe least expensive plan (Frank and Zeckhauser, 2009). Sensibly,
ost private employers who offer employees multiple insuranceptions not only prescreen plans but typically only offer a smallumber (e.g., 3–6).
Consumers can also make suboptimal decisions when facedith choices that are overly complex. Recognizing the importance
f simplicity, the ACA mandates that, by March 2013, all insur-rs and employers will be required to present information aboutnsurance plans in a standardized “summary of benefits and cov-rage” document that describes plan features such as premiums,
ieht
Economics 32 (2013) 850– 862 851
eductibles and co-insurance. The law also eliminates the prover-ial ‘fine print’ in a somewhat literal fashion by mandating ainimum 12-point type size. In addition, insurance shoppers will
e given standardized cost estimates, modeled after nutrition factsabels on food products, for three common medical conditions:
aternity care, breast cancer and diabetes. These provisions seeko mitigate a widely perceived but poorly documented problem:eople’s lack of understanding of their health insurance.
Despite frequent lamentations about Americans’ poor under-tanding of health insurance, there is only limited empiricalesearch addressing the issue. A recent posting on the website ofonsumers Union lamented that “the field of health literacy, whileuite robust in other ways, does not precisely measure consumers’bility to understand and use health insurance.” (Consumers Uniont al., 2011). The same posting notes that a comprehensive surveyf health literacy research includes not a single study that inves-igates consumers’ ability to understand and use health insuranceBerkman et al., 2011).
We address this gap in existing empirical research by repor-ing results from two different surveys designed to address thewo issues raised by Consumer’s Union: consumers’ ability to (1)nderstand and (2) use health insurance. The first, ‘comprehen-ion’, survey addresses not only how well Americans understandheir own health insurance coverage, but also how well they believehey understand it. Prior research (e.g., O’Donoghue and Rabin,009) has shown that whether consumers have insights into theirwn decision errors can be as consequential as whether they areubject to the errors in the first place, in part because those who areware of being prone to errors can take self-protective measures,uch as hiring experts or employing decision aids.
The second, ‘choice’ survey, addresses consumers’ ability tose information about health insurance and specifically examineshether they would make better decisions if they had a bet-
er understanding of their insurance plan. Drawing on insightsrom the comprehension survey regarding which features of healthnsurance consumers find difficult to understand, we devised aimplified health insurance policy that eliminated the features ofealth insurance that consumers find most confusing: deductiblesnd coinsurance. Instructing respondents to imagine that theyere either insured under this simplified plan, or under an actu-
rially equivalent traditional plan, the choice survey then askedhem to make a series of hypothetical health care decisions. Thesehoices were specifically designed to assess whether those insurednder the simplified insurance plan would be more likely to engage
n cost-reducing behaviors, such as going to an urgent care centerather than the emergency room for a non-life-threatening medicalroblem. The survey also assesses consumer preferences between araditional plan and a simplified all-copay medical insurance plan.
. Prior research
Prior studies of individuals’ understanding of health insuranceoverage have adopted a wide range of methods, but have generallyeached a common conclusion: people’s understanding of healthnsurance is far from perfect.
In one broad line of research, people with health insuranceave been asked to report on – i.e., have effectively been tested on
relatively crude aspects of their own coverage. One study sur-eyed a mixed sample of individuals in different regions of the.S., some of who were participating in a health insurance exper-
ment and others who were insured but not participating in thexperiment. The survey revealed that 90% of respondents withealth insurance coverage were aware of being covered, were rela-ively well informed about their coverage of in-patient services, but

8 Health
dssapAorrtiwwbwgtfrvmssis
ihsfasCohswmtffsoati(bpt
ci4taofilKwopTc
btaambdhfpRsBqwstuclb
3
hurmswenitbttd
otoiasceEMsutbtlnrv
52 G. Loewenstein et al. / Journal of
ramatically underestimated their policy’s coverage of outpatientervices and drugs (Marquis, 1983). In addition, and perhaps noturprisingly, consumers whose insurance plans included coinsur-nce or fee-schedules were far less able to estimate costs than wereatients with policies that would fully cover such expenditures.nother study (Meredith et al., 2002), of patients with depression,bserved greater knowledge of medical benefits (accuracy ratesanging from 86% to 89%) than of mental health benefits (accuracyates from 33% to 60%). A third study found that about three quar-ers of Wisconsin adults were aware of whether they were enrolledn a managed care or fee-for-service plan, but, of the minority who
ere in fee-for-service plans, 84% incorrectly believed that theyere in managed care (Nelson et al., 2000). That is, most people
elieved they were in managed care, regardless of whether theyere or not. In a fourth study, less than a third of respondents
ave correct responses to four questions about basic features ofheir own plan’s coverage (Cunningham et al., 2001). A fifth studyound that individuals with health insurance were relatively accu-ate about whether their policy covered hospital and physicianisits, but much less accurate about whether their plan includedental health coverage or covered emergency room visits in other
tates (Garnick et al., 1993). A common finding, seen across thesetudies, is that consumers tended to overestimate the restrictionsn their own plans, and in particular the need for approval to seepecialists.
A second line of research relevant to consumers’ understand-ng of health insurance has examined whether people chooseealth insurance policies that minimize their costs. The “Con-umers’ Checkbook Guide” to health plans for Federal employees,or example, reports that “hundreds of thousands of employeesnd annuitants are enrolled in plans that are much more expen-ive than average, but provide no valued benefits”(Consumers’heckbook). One study conducted shortly after the introductionf Medicare part D presented Medicare-eligible individuals withypothetical choices and found that 71% made appropriate deci-ions about whether to enroll but only 36% chose the plan thatould minimize their total costs (Heiss et al., 2006); while costinimization is not necessarily equivalent to utility maximiza-
ion, it is a useful benchmark. Drawing on actual plan choicesrom individuals several years into the program, another studyound that many Medicare beneficiaries made suboptimal deci-ions, putting too much weight on monthly premiums and too littlen out-of-pocket drug costs (Abaluck and Gruber, 2011). The aver-ge insured individual in this study could have saved 31% of theirotal Part D spending by choosing an alternative plan. Acknowledg-ng the problem, the Centers for Medicare and Medicaid ServicesCMS) introduced an online total cost calculator designed to enableeneficiaries to compare the total out-of-pocket costs of differentlans for consumers with different patterns of healthcare utiliza-ion.
Finally, a third line of research that is most relevant to theurrent paper tests consumers’ comprehension of basic healthnsurance concepts. One study (Winter et al., 2006) found that0% of Medicare-eligible individuals contacted shortly followinghe launch of Medicare part D reported little or no knowledgebout Medicare prescription drug coverage. Given the older agef respondents, however, it is unclear whether these and otherndings pertaining to Medicare will generalize to younger, likely
ess cognitively impaired, populations. Another study (Handel andolstad, 2013), found that only a minority of workers at a large firmere able to accurately answer questions on benefit design, their
wn recent health care cost, or other key questions that should, inrincipal, have been relevant to their choice of health insurance.his lack of understanding was correlated with their insurancehoices.
vs
a
Economics 32 (2013) 850– 862
In addition to studies conducted by academics, a limited num-er of studies conducted by commercial entities have addressedhe issue of comprehension. One industry-sponsored study thatsked individuals with health insurance to define insurance termsnd calculate their bill found average accuracy rates of approxi-ately 50% (The Regence Group, 2008). Another survey conducted
y a health insurance company found that only 23% of respon-ents understood the terminology used in their health policy, onlyalf knew their monthly health insurance premium, and only a
ew understood common healthcare acronyms such as HMO (36ercent), PPO (20 percent) and HSA (11 percent) (eHealth, 2008).esults from these survey-based studies are complemented by aeries of studies conducted by Consumer’s Union (Health Policyrief, 2012) that employed cognitive interviewing, a one-on-oneualitative research method that yields rich and nuanced data evenith small sample sizes (n = 16 in each study). These studies yielded
imilar conclusions to the studies just reviewed. Findings includedhat consumers dread shopping for insurance, don’t have a goodnderstanding of cost-sharing concepts (specifically, deductibles,o-insurance levels and benefit maximums), and require a highevel of numeracy to make informed judgments about and choicesetween medical plans.
. Consequences of consumers’ lack of understanding
At the individual level, consumers’ limited understanding ofealth insurance has several likely consequences. First, limitednderstanding is likely to lead to suboptimal decisions. Prioresearch has found that individuals often stick with the status quo,aintaining the same coverage they had in the past even when
uperior options are available, seek advice from family or friendsho may also have low levels of health literacy, and commonly
nroll in highly advertised plans or those with a well-known brandame (Frank and Lamiraud, 2009; Handel, 2011). If simplifying
nsurance reduced these tendencies, it could potentially improvehe quality of choices. Moreover, offering plans with copaymentsut no deductibles could help to remove one major source of subop-imality generally observed in choices among insurance plans – theendency for consumers to choose plans with lower than optimaleductibles (Sydnor, 2010).
Second, as already noted, if consumers don’t understand theirwn health insurance policies, it is unlikely that they will respondo the incentives embedded in those policies. Field experimentsn simplifying either the information gathering or decision mak-ng process have documented positive impacts on outcomes in
variety of health and non-health domains: parents’ choices ofchools for their children (Hastings and Weinstein, 2008), senioritizens’ Medicare Part D plan choices (Kling et al., 2012), employ-es’ rates of 401k enrollment (Choi et al., 2009), take-up of thearned Income Tax Credit by low income families (Bhargava andanoli, 2012), and college financial aid applications and sub-
equent college attendance (Bettinger et al., 2009). If peoplenderstand their own health insurance, they should be more likelyo make the types of cost-effective choices that are encouragedy plan design, such as visiting an urgent care center rather thanhe emergency room when the former is more appropriate. Theatter issue is especially important given the increasing promi-ence of value-based insurance design (VBID), which increaseseimbursement of high value services and/or lowers it on lowalue services, in an attempt to drive consumers to make more
alue-responsive decisions when it comes to consuming medicalervices.Third, if insurance purchasers (or potential purchasers) areware of their own lack of understanding, this may help explain

Health
woMtw7f5DdpuloiMbtia
qstmtmbpcEstto
braa
4u
icTHb
4
saKg2dheot
ptaidpwaotuAic
ecttt
©©
©
©
©
©
©
dAwwcaamiinformation packets.
Respondents were first asked to imagine that they were insuredunder the policy they were shown, and were then asked to respond
14 KnowledgePanel is based on probability sampling covering both the onlineand offline populations in the U.S.. Panel members are recruited through nationalrandom samples. Households are provided with access to the Internet and hard-ware if needed. Unlike Internet convenience panels, KnowledgePanel recruitmentuses dual sampling frames that include both listed and unlisted telephone num-bers, telephone and non-telephone households, and cell-phone-only households,as well as households with and without Internet access. KnowledgePanel recruit-
G. Loewenstein et al. / Journal of
idespread discontent with existing insurance options. One studyf individuals who made an active choice about whether to enroll inedicare part D, found evidence of widespread dissatisfaction with
he program, both among those who decided to enroll and thoseho did not (Heiss et al., 2006). Among those who decided to enroll,
1% indicated that there were too many alternative plans to chooserom, 34% that the enrollment process was very complicated, and2% that they “had difficulty understanding how Medicare Part
works and what savings it would provide.” Among those whoecided not to enroll, the equivalent figures were 69% (too manylans), 61% (enrollment process complicated) and 62% (difficultynderstanding how Medicare Part D works). In a question asked of a
arger, representative, sample of senior citizens that included aboutne third who were actually facing the choice of whether to enrolln Medicare part D, only 30% endorsed the statement that “the
edicare Part D program is well designed.” Any accounting of theenefits of simplified insurance should include reductions in theime consumers spend on information search and decision mak-ng as well as improvements in well-being resulting from reducednxiety.
Fourth, a somewhat more subtle, but equally important, conse-uence of insurance complexity is that individuals will focus on theimplified information that is presented to them, and insurers willhen engage in what economists call ‘shrouding’ – displaying infor-
ation in a selective fashion that highlights aspects advantageouso the seller (Gabaix and Laibson, 2006). For example, the require-
ent for insurance companies to publicize the cost of maternity,reast cancer, and diabetes care, will likely lead them to designlans that dramatically reduce costs for these services and raiseosts on other types of care which they do not have to report.xactly such a pattern has been documented from the Mexicanocial security system, in which financial providers were requiredo provide information about fees. These providers reduced the feeshat were required to be reported but raised those they were notbligated to report (Hastings and Tejeda-Ashton, 2008).
Finally, it is possible that a simplified insurance product woulde simpler for an insurer to administer and might also lead toeduced costs if consumers were less likely to contact the insur-nce company with questions that require costly employee time tonswer.
. Comprehension study: insurance-holders’nderstanding of health insurance
The comprehension survey was conducted mainly to elicitnsurance-holders’ understanding of basic health insurance con-epts and their beliefs about their own level of understanding.he survey was designed by the academic team using input fromumana employees who were expert in the workings, and buildinglocks, of medical insurance.
.1. Methods
The comprehension study (as well as the ‘choice’ study pre-ented below) were both surveys (see Appendix A for details)dministered to representative samples of Americans recruited bynowledge Networks Inc. in January and February 2012. To be eli-ible, respondents had to be (1) non-institutionalized adults age5–64 residing in the United States; (2) the primary or sharedecision maker for their own or their families’ healthcare; and (3)
ave health insurance through their own or a family member’smployer. The two latter questions were asked at the beginningf the survey, and respondents were not allowed to participate ifheir answer to either was negative.msIdh
Economics 32 (2013) 850– 862 853
Knowledge Networks’ sample, KnowledgePanel®, is based onrobability sampling covering both the online and offline popula-ions in the U.S.14 Active panel members were drawn at random,ssigned to the survey, and received a notification e-mail contain-ng a link that sent them to the survey questionnaire. After threeays, automatic email reminders were sent to all non-respondinganel members in the sample. Knowledge Networks provideseights for improving the fit to the U.S. population which we
pplied in all analyses except where noted. The left-hand columnsf Table 1 present summary statistics on the demographics ofhe comprehension study sample (n = 202), comparing both thenweighted and weighted distribution of sample characteristics.s is evident from the table, in this study and the next, the weight-
ng did not have a major impact on the distribution of sampleharacteristics.
Respondents were asked, first, to state whether they understoodach of the 4 most basic insurance parameters: deductible, copay,oinsurance and out-of-pocket maximum. After stating whetherhey knew what each was, they were given a multiple choice ques-ion to elicit their actual understanding. The pair of questions abouthe deductible, for example, was:
Q111 Do you know what a Deductible is?
Yes No
Q3 Which of the following best describes a Deductible?
An amount deducted from your paycheck to pay for your insur-ance premium
The amount deducted (covered) out of your total yearly medicalexpenses
The amount you pay before your insurance company pays ben-efits
The amount you pay before your health expenses are covered infull
I’m not sure
After answering these questions for all four concepts, respon-ents were presented with a conventional insurance policy (seeppendix A, Plan T), which they were asked to print out and whichas also available to them in a box at the bottom of the screenhenever they were asked questions that required accessing it. The
onventional policy incorporated deductibles, copays, coinsurancend out-of-pocket maxima (different for individual and family,nd different for in- and out of network). The policy was closelyodeled on a commercially available product, and was described
n terms comparable to those provided in typical open enrollment
ent methodology conforms to the quality standards established by selected RDDurveys conducted for the Federal government (such as the CDC-sponsored Nationalmmunization Survey). More information about the KnowledgePanel sampling,ata collection procedures, weighting, and IRB-bearing issues are available at:ttp://www.knowledgenetworks.com/knpanel/index.html.

854 G. Loewenstein et al. / Journal of Health Economics 32 (2013) 850– 862
Table 1Characteristics of two samples (including only qualified respondents).
Comprehension Study (n = 202) Choice Study (n = 413)
Weighted Unweighted Weighted Unweighted
% Male 51.7% 52.5% 45.1% 45.8%
AgeMean 43.7 45.9 44.1 47.0%(S.D.) (11.0) (11.2) (11.3) (11.1)[range] [25–64] [25–64] [25–64] [25–64]
Married % 75.2% 75.2% 69.0% 70.7%
Income median $75,000 to $84,999 $75,000 to $84,999 $75,000 to $84,999 $75,000 to $84,999
Income ($thousands)<50 20.3% 20.3% 22.1% 22.8%50–99 48.3% 45.0% 43.9% 44.1%100–149 23.2% 24.8% 20.1% 22.3%>= 150 8.2% 9.9% 13.9% 10.9%
Employment statusEmployed % 75.4% 77.7% 80.2% 79.2%Unemployed % 3.6% 3.0% 3.0% 3.4%Retired/other % 21.0% 19.3% 16.8% 17.4%
Race/ethnicityWhite % 73.7% 78.7% 69.8% 77.0%Black % 7.2% 6.9% 10.3% 9.0%Hispanic % 12.2% 9.4% 12.7% 8.5%Other/Mixed % 7.0% 5.0% 7.2% 5.6%
Household size median 3 2 2 2
Highest EducationLess than HS grad % 5.5% 3.5% 4.7% 4.4%
%
%
%
titdrhi
h
©©©©©©©
edtd
qcT
ucppusi(rt
ac
High school grad % 52.2% 53.5College grad % 28.3% 27.7Advanced degree % 14.0% 15.3
o a series of multiple-choice questions about the costs of med-cal services under different scenarios that varied in terms ofhe services being used and whether they had spent down theireductible. Responses to these questions were selected so theyequired few, if any, calculations to answer, but only required, andence measured, their understanding of the mechanics of health
nsurance.The first question they answered, for example, was:First, imagine that none of your family members, including you,
ave spent any money so far this year on medical care.
Q18 Your (in network) primary care doctor charges $80 for anoffice visit. How much will it cost you to visit your doctor if youare sick?
Nothing (free) $30 $40 $55 $80 $150 I’m not sure
Following each of these questions they were asked an open-nded question about whether the multiple choice question wasifficult to answer and, if so, why. (Few respondents answeredhis question, so responses to it were not analyzed and are notiscussed.)
Next, respondents were asked to answer a single open-endeduestion (not multiple choice) which asked them to compute theost of a specific service – a 4 day stay at an in-network hospital.hey were told:
©©©
52.0% 48.2%24.9% 26.2%18.3% 21.3%
Q29 You have not had any medical expenses so far this year. Yougo in to an in-network hospital for 4 days to obtain surgery. Thehospital stay for the surgery costs $100,000. How much will thehospital stay for the surgery cost you, personally?
$
Two questions then elicited further information about theirnderstanding of different features of health insurance, specificallyoverage of preventive care and whether spending on in-networkroviders counts toward the deductible for out-of-networkroviders. The next 11 questions elicited their self-perceivednderstanding (on a 5-point scale from “definitely don’t under-tand” to “definitely do understand”) of different concepts andssues – e.g., “how the individual and family deductibles work.”Results from these questions, which largely paralleled thoseeported above and were otherwise uninteresting, are reported inhe on-line appendix but not discussed in this paper.)
Respondent were then asked two multiple choice questions,bout their desire for a simplified insurance product, an issue ofentral importance to the research team:
Q58 Suppose there was a new insurance product that had nodeductibles, and only fixed (copay) fees for different services. Theplan still covers preventive services for free. Assuming that in theend you paid about the same total amount for medical care, wouldyou prefer the plan you have been working with in this survey, orthis new plan?
Strongly prefer existing plan Prefer existing plan No preference between them

G. Loewenstein et al. / Journal of Health Economics 32 (2013) 850– 862 855
Table 2Actual and self-perceived comprehension of insurance concepts; Comprehension Study.
Concept Percent who think theyunderstand concept
Percent of those who think they understandwho correctly answer question testingunderstanding of concept
Percent of total sample who correctlyanswer question testing understandingof concept
Deductible 97% 81% 78%Copay 100% 72% 72%Coinsurance 57% 59% 34%
55%
N uestion with 5 possible responses.
©©
c
pis
4
trwacfuciGccaOMeydtra
dtpievomaaroicma
ar
Table 3Ability to compute insurance costs: percent answering multiple choice and fill-in-the-blank questions correctly; Comprehension Study.
% correct
Multiple choice cost-estimate questionsIn-network primary care visit 73%Out-of-network office primary care doctor 59%In-network MRI 41%In-network primary care (after meeting deductible) 77%In-network MRI (after meeting deductible) 57%Level 1 allergy medication 78%In-network primary care (after meeting MOOP) 58%Out-of-network office primary care doctor (aftermeeting MOOP)
35%
E.R. charge (with admission) 40%Average, multiple choice questions 58%Open-ended cost question:
Cost of 4 day stay in hospital 11%Two multiple choice questions:
In the plan, is preventive care covered 100% if youhave not yet met your deductible?
76%
(rioimTaaohTacbpwc
arFpand 7% strongly preferred the existing plan. An ordered probitregression16 (column 3 of Table 4) showed that the simplifiedplan appeals more to females but there are no other significant
Maximum Out-of-Pocket 93% 59%
ote: Comprehension of each concept was assessed in a separate multiple choice q
Prefer new (copay only) plan Strongly prefer new (copay only) plan
They were then asked the same question, but imagining that theopay fees were 50% higher.
Finally, they were asked a question about the importance theylaced on an insurance plan offering out-of-network coverage (an
ssue of interest to Humana when it came to deciding on thepecifics of the simplified plan they would create).
.2. Results
Table 2 reports the percent of respondents who stated thathey understood each concept listed, the percent who were cor-ect about their own knowledge (correctly understanding a concepthen they believed they did), and the percent who correctly
nswered the multiple choice questions about each insurance con-ept regardless of their self-assessed understanding. As is evidentrom the table, people were highly confident about their ownnderstanding of copays, deductibles and maximum out-of-pocketosts (all > 90%), but were less confident about their understand-ng of coinsurance, which only 57% reported that they understood.auging actual understanding by correct responses to the multiplehoice questions, however, respondents’ actual understanding ofoncepts was lower than perceived understanding, ranging from
high of 78% for deductibles to a low of 34% for coinsurance.nly 14% of respondents answered all four questions correctly.oreover, note that the multiple choice questions probably over-
stimate respondents’ understanding, since simply guessing wouldield an accuracy rate of 20%. Overconfidence (assessed by respon-ents who reported that they understood the concept, but gavehe wrong multiple choice response) was evident for all four items,anging from a low of 19% for deductibles to 41% for both coinsur-nce and maximum out-of-pocket costs.
Table 3 reports the percent of correct answers to questionsesigned to gauge respondents’ ability to estimate costs of differentests and procedures given the traditional insurance plan they wereresented with. There is substantial heterogeneity across questions
n respondents’ ability to correctly assess health care costs. For sev-ral multiple choice items (e.g., the cost of an in-network officeisit either before or after meeting the deductible), more than 75%f respondents answered correctly. However, accuracy rates wereuch lower – approximately 40% – for a number of other services
nd tests, such as an MRI (before or after meeting the deductible)nd out-of-network services. On average, respondents gave correctesponses to 58% of the multiple choice questions. Finally, only 11%f respondents gave the correct response to a relatively simple fill-n-the-blank question about the cost of a 4 day hospital stay (14%ame within plus or minus $1000 of the correct number; approxi-ately the same fraction who estimated incorrectly overestimated
nd underestimated the correct value).To determine what demographic characteristics were associ-
ted with respondents’ understanding of health insurance, weegressed, using OLS, the sum of the number of insurance questions
d
n
In the plan, if you spend money out-of-pocket onin-network providers, does this spending counttoward the deductible for out-of-network providers?
34%
summarized in Table 2) answered correctly (mean: 2.39, SD: 1.04,ange: 0–4), and the number of the ten cost questions (summarizedn Table 3) answered correctly (mean: 5.30, SD: 2.27, range: 0–10),n a variety of demographic characteristics (see Table 4), includ-ng a dummy variable based on number of visits they reported
aking to a doctor (greater than or equal to once a month = 1).15
he first regression in the table shows that older respondentsnswered fewer questions correctly, while college educated andbove-median income respondents answered a higher numberf concept questions correctly. Having more experience with theealth care system, however, did not have a significant effect.he second regression shows that neither of these variables, norny others we included, predicts respondents’ abilities to calculateosts. Neither comprehension variable was predicted significantlyy the frequency of medical visits variable, failing to provide sup-ort for the prediction that greater experience with medical careould increase people’s understanding of concepts or ability to
ompute costs.When presented with the concept of a simplified plan, and
sked for their preference between it and a traditional plan,espondents exhibited a strong preference for the simplified plan.ourteen percent strongly preferred the simplified plan, 41%referred it, 31% were indifferent, 7% preferred the existing plan,
15 OLS was appropriate because the error terms were approximately normallyistributed.16 Ordered probit was used because the preference response scale is clearly ordi-al, but not necessarily cardinal in the sense that respondents could interpret the

856 G. Loewenstein et al. / Journal of Health Economics 32 (2013) 850– 862
Table 4Predictors of comprehension and preference; Comprehension Study.
Linear Regressions Ordered Probit Regressions
Dependent variable: (1) Number of insuranceconcepts identified correctly
(2) Number of cost questionsanswered correctly
(3) Preference forsimplified plan
(4) Preference forsimplified plan
Male (SE) 0.05 (0.15) −0.32 (0.32) −0.29 (0.16)* −0.29 (0.16)*
Age (SE) −0.11 (0.06)* −0.11 (0.13) 0.05 (0.01) 0.09 (0.01)Age2 (SE) 0.00 (0.00)* 0.00 (0.00) −0.00 (0.00) −0.00 (0.00)≥College (SE) 0.31 (0.15)** 0.36 (0.34) 0.09 (0.16) −0.00 (0.16)≥Median income (SE) 0.33 (0.15)** 0.04 (0.34) 0.14 (0.16) 0.08 (0.16)Visit >= once per month (SE) 0.20 (0.15) −0.73 (0.49) 0.03 (0.23) 0.03 (0.23)Number of cost questions
answered correctly (SE)– – – 0.05 (0.04)
Number of insurance conceptsidentified correctly (SE)
– – – 0.24 (0.08)***
Adjusted R2 0.05 0.00 – –
Overall test of parameters F(6,192) = 2.74, p = 0.0141 F(6,192) = 0.95, p = 0.4593 X2(6) = 5.88,p = 0.4366
X2(8) = 22.15,p = 0.0068
Standard errors in parentheses.* Significant at = 0.10.
dqcscwstia
pW2pedwfiTpi
5s
pssbr
iinih
di
coilvipie(
5
hqhthoamsbpvo
ioedam
** Significant at = 0.05.*** Significant at = 0.01.
emographic differences. Adding variables for the number of costuestions answered correctly and the number of insurance con-epts identified correctly (column 4 of Table 4), we find, somewhaturprisingly, that the number of concept questions answeredorrectly has a positive effect on preference for the new plan; thoseith a better understanding of health insurance concepts show a
tronger preference for the simplified plan. One possible explana-ion for this effect is that people who did not understand healthnsurance concepts may not have been aware of their ignorancend, as a result, under-appreciated the benefits of simplification.
Not surprisingly, respondents were less positive about the sim-lified plan when it came with copay fees that were 50% higher.ith this modification, 7% strongly preferred the simplified plan,
1% preferred it, 34% were indifferent, and 29% prefer the originallan and 9% strongly preferred the original plan. The 50% differ-nce does not represent the likely cost-consequence of eliminatingeductibles, but was chosen somewhat arbitrarily to determinehether respondents would be willing to make a substantial sacri-ce on another dimension to enroll in a simplified insurance plan.his reduced the percentage who stated they would prefer a simplelan from 55%, in the case in which higher copayments were not
ndicated, to 28%.
. Choice study: the impact of health insuranceimplification on healthcare decision making
The choice study was conducted to assess the impact of a sim-lified health insurance plan on choices between medical tests andervices, and also to measure the relative appeal of a traditional orimplified insurance plan both before and after respondents hadeen asked to compute the cost they would incur for obtaining aoutine medical expense.
Working in a collaborative team of academics and insurancendustry professionals at Humana, we designed a simplifiednsurance product that reduces cost-share variance and elimi-
ates deductibles and coinsurance, two components of standardnsurance policies that are least well understood by policyolders, as indicated by prior research and corroborated by the
ifference between, e.g., “strongly prefer S” and “prefer S” as having greater signif-cance than the difference between, e.g., “prefer S” and “No preference.”
omprehension study just discussed. The simplified plan consistednly of a series of copays for different services. The simplifiednsurance product, which is presented in Appendix A, includesarger copay differentials between higher cost/lower value ser-ices and lower cost/higher value services, with the goal of drivingnsured individuals toward the latter. The simplified insurancelan poses a stark contrast to the “consumer-driven” health
nsurance plans that are currently popular among insurers andmployers that incorporate high deductibles that apply to mostbut typically not preventive) services.
.1. Methods
Respondents (n = 413; demographics presented in the right-and columns of Table 1) were randomly assigned to answeruestions in one of two orders. Half were first assigned to makeypothetical healthcare choices imagining they had the sameraditional plan that had been shown to respondents in the compre-ension survey (see Appendix A). The plan was presented to themn the bottom part of their computer screen, and they were alsosked to print it out for ease of perusal. They were then asked toake the same decisions again, but this time assuming they had a
implified plan (see Appendix A). The simplified plan was designedy Humana actuaries to have the same premium as the traditionallan (assuming a similar client base, rate of profit, and, conser-atively, that the plan did not change healthcare utilization). Thether half of subjects made the same decisions, but in reverse order.
The decisions, which were presented in the form of scenar-os, were designed to determine if respondents would choose theption encouraged by the incentives embedded in both plans. Forxample, the first scenario asked respondents to choose between aermatologist who was in-network but whose office was far awaynd one who was out-of-network but closer and highly recom-ended:
Q111 For this question, imagine that you have not had any med-ical expenses to date. You need to see a dermatologist for a spoton your back that you are worried about. Dr. H is a board-certified
dermatologist who is in your insurance company’s network. Heis 10 miles away, and you don’t know much about his reputation.Several friends of yours have highly recommended Dr. O, a derma-tologist who is only 2 miles away, but is not part of your insurance
Health Economics 32 (2013) 850– 862 857
©©©©©
©©
©©©©©
puatwtt
twwoi$sassswr
uhadty
wwtmt
Fu
inhaaactu
5
dmttcihetta
4tawpTwmttotitivp
aa
G. Loewenstein et al. / Journal of
plan’s network. You know that both doctors charge $150 for anoffice visit. Please remember that your insurance plan is <PLAN>.Who will you make an appointment to see?
Definitely Dr. H Probably Dr. H Not sure Probably Dr. O
Definitely Dr. O
Q112 In answering the previous question, did you take account ofwhat you would end up paying, out of pocket, depending on whatyou chose to do?
Yes No
Q113 How did your insurance plan affect your decision? (open-ended response)Q114 How difficult was it, or would it be, for you to understandhow much you would have to pay if you went to the in-networkversus the out-of-network dermatologist?
Very difficult Somewhat difficult Not particularly difficult Somewhat easy Very easy
The second scenario asked respondents to imagine they had aainful ear-ache and to choose between the emergency room orrgent care. In the third scenario, respondents were presented with
scenario in which they went to the pharmacy and were told byhe pharmacist that their doctor had prescribed a name brand drughen a generic was available. They were asked if they would want
he pharmacist to call the doctor if he/she offered, and whetherhey themselves would be willing to make such a call.
For each scenario, there were pros and cons for each alterna-ive choice, but one choice was designed to minimize costs, and weere interested in whether making these costs more transparentould increase respondents’ sensitivity to them. While the costs
f making different choices were quite different across scenar-os (approximately a $100 difference in the dermatology scenario,200 in the Urgent care/ER scenario and $35 in the medicationcenario), they were not very different between the two insur-nce policies ($5 greater difference for plan T in the dermatologycenario, $50 greater difference for plan T in the Urgent Care/ERcenario and $10 greater difference for plan S in the medicationcenario). Thus, the main determinant of choices between the plansas not differences in the incentives provided by the plans, but
ather the respondents’ ability to understand the incentives.After each of these sets of questions, they were asked follow-
p questions about whether they took account of what they wouldave to pay when they made the decision and whether the insur-nce policy made it easy to understand the cost ramifications of theecision. After each, they were also asked an open-ended question,o express in their own words, “How did your insurance plan affectour decision?”
In a final section of the choice survey, respondents were askedhich of the two plans they preferred, and which they thought
as easier to understand. Their responses were recorded on a (−5o +5) scale using a slider. They were then asked to compute howuch a single service would cost under the two plans. The ques-
ion asked them to imagine, “You have personally incurred $2000
todY
ig. 1. Cumulative proportion correct by percent absolute error in cost calculationsnder traditional and simplified plans, by frequency of doctor visits; Choice Study.
n out-of-pocket medical expenses this year. You go in to an in-etwork hospital for 4 days. The hospital stay costs $100,000. If youad Plan , how much would the hospital stay cost you person-lly?” The correct response under the simplified plan was $1050,nd under the traditional plan it was $2500. Having attempted tonswer the question, but without being given feedback about theorrect answer, respondents then used the sliders to again answerhe questions about plan reference and which plan was easier tonderstand.
.2. Results
Table 5 summarizes respondents’ answers to the questions justescribed, irrespective of ordering (since order turned out not toatter). For all decisions, respondents are directionally more likely
o make the lower cost choice if they had the simplified plan, buthe differences relative to the traditional plan are small (2–3 per-entage points) and not always statistically significant. Differencesn whether respondents would take account of what they wouldave to pay are all close to zero and not significant. Finally, differ-nces on the question of whether the simplified plan made it easyo understand the cost ramifications of a particular choice all favorhe simplified plan, are somewhat larger (8–21 percentage points),nd are all statistically significant at the 0.01 level.
Supporting the idea that the simple plan was indeed simpler,3% of respondents gave the correct answer to the cost of the hospi-al stay question for the simple plan, but only 2.2% gave the correctnswer for the traditional plan. For the simple plan, 38% of thoseith a high school education or less gave the correct answer, com-ared to 49% of those with a college degree or higher (p < 0.001).he equivalent numbers for the traditional plan were 1.3% for thoseith a high school education or less and 3.6% correct for those withore than a high school education (p of difference = 0.14). Thus,
hose with more education were more likely to answer the ques-ion correctly under either plan, but a larger effect is that, regardlessf education, people were much more likely to answer the ques-ion correctly for the simplified than for the traditional plan. Thencreased probability of correctness with the simplified plan washe same regardless of how often the respondent reported visit-ng the doctor (based on adding a variable for frequency of doctorisits to a logistic regression of probability of correctness on plan,
= 0.47).To investigate more generally whether respondents are able to
nswer more precisely under either plan, we calculated the percentbsolute error (or PAE, |answer-correct|/correct) of each answer to
he hospital stay question. Fig. 1 shows the cumulative distributionf respondents exhibiting different levels of absolute error, brokenown between less- and more-frequent visitors to the doctor. Theintercepts shows the different proportions exactly correct (i.e.

858 G. Loewenstein et al. / Journal of Health Economics 32 (2013) 850– 862
Table 5Hypothetical choices stratified by traditional or simplified insurance plan coverage; Choice Study.
Scenario/Decision outcome Traditional Plan (Plan T) Simple Plan (Plan S) Significance of difference betweenrespondents’ answersa
DermatologistChose to go in-network 78% 80% p = 0.24Took account of what you would pay? 91% 93% p = 0.62Found it easy to understand cost ramifications? 73% 81% p = 0.01
Care for Ear-acheChose urgent care over ER 74% 77% p = 0.04Took account of what you would pay? 87% 87% p = 0.43Found it easy to understand cost ramifications? 79% 88% p = 0.001
Blood pressure medications: name brand vs. genericWould ask pharmacist to call doctor 78% 81% p = 0.09Respondent would call doctor (only asked if “no” above) 70% 77% p < 0.001Took account of what you would pay? 88% 88% p = 0.43Found it easy to understand cost ramifications? 69% 90% p < 0.001
wivqtfmbvdtw8rbla
artrreitd(iaEcu
twfrtocsbod
bavs
ah(to(sttpvw
6
npoaccSbkq
mcdsddmtp
a McNemar’s test on unweighted data.
ith zero error) – as reported above, the simplified plan has signif-cantly more correct answers in both cases. Among less-frequentisitors, we see that almost 90% are able to answer the simple planuestion with 500 PAE or less, compared to around 60% with theraditional plan; furthermore, the simple plan seems to outperformor any error level below 800 PAE. The picture is similar among
ore-frequent visitors, although performance there is uniformlyetter, and the traditional plan seems to be less relatively disad-antageous (Kolmogorov-Smirnov tests of equality of the weightedistribution functions all with ps < 0.001). Interestingly, the tradi-ional plan seems to outperform for about the 10% of respondentsith the highest errors in both visit-frequency groups (above about
00 and 1700 PAE respectively). However, since only 6 respondentseached these levels of error in either group, this comparison maye especially sensitive to individual- and question-level effects (for
ikely examples of the latter, note the discrete jumps at about 700nd 3100 PAE in only the traditional plan, regardless of frequency).
Responses to the open-ended questions about how the insur-nce plan affected each decision (available from the authors, onequest) were more interesting than the open-ended responseso the comprehension survey. Two differences between thoseesponding for plan S and plan T were salient. The first was thatespondents used many more words in their responses whenxplaining their decision under plan S than plan T. For plan S,ncluding only those who saw plan S first and summing over thehree questions (corresponding to the three scenarios), respon-ents used an average of 172 words to explain their decisionS.E. = 13.8), but with plan T only a mean of 133 (S.E. 10.4), a signif-cant difference (p < 0.01). Even more striking, though admittedlynecdotal, were the differences in the nature of the explanations.xplanations for decisions made under plan S were much moreoherent and more likely to cite specific numbers than those madender plan T.
Respondents were asked two questions, both before and afterhey had attempted to compute the cost of the hospital stay: (1)hich plan they preferred, and (2) which of the two plans they
ound easier to understand. Fig. 2 presents the distribution ofesponses to the two questions, both before and after computinghe cost of the hospital stay. Initially, prior to computing the costf the service, there was a slight, although statistically insignifi-ant, preference for the simple plan (mean = 0.12 on −5 to +5 scale,
.d. = 3.77; t(412) = 0.54, p = 0.59). There was, however, a strongelief that the simple plan was easier to understand (mean = 1.64n −5 to +5 scale, s.d. = 3.29; t(412) = 8.07, p < 0.001). After respon-ents attempted to compute the cost of the hospital stay, theeotb
elief that the simple plan was easier to understand, which waslready strong, did not change significantly; however, there was aery substantial shift toward preferring the simplified plan (meanhift = 0.99, s.d. = 3.88; t(412) = 4.17, p < 0.001).
Finally, we categorize the plan preference variable both beforend after respondents attempted to compute the cost of theospital stay, which could take on 11 values, into three rangespreference for the traditional plan, “not sure”, and preference forhe simplified plan). We then estimated ordered probit regressionsf respondent characteristics on this ordered preference outcomeTable 6). Belief that the simplified plan was easier to under-tand is a very strong predictor of preference for that plan prioro attempting the cost computations; after attempting the calcula-ions, actual success in doing so is an additional strong predictor ofreference for the simplified plan. After controlling for these twoariables, posterior preference for the simpler plan is greater foromen and those without a college degree.
. Discussion
Our analysis of the results from the two surveys highlights aumber of benefits of a simplified insurance plan design. The com-rehension study shows that people have a limited understandingf traditional health insurance. Only 14% of the sample was able tonswer correctly 4 multiple choice questions about the four basicomponents of traditional health insurance design: deductibles,opays, coinsurance and maximum out of pocket costs (‘MOOP’).imilarly, many respondents were unable to calculate the cost ofasic services covered by the traditional insurance plan. Most stri-ingly, only 11% were able to correctly answer a fill-in-the-blankuestion about the cost of a hospitalization.
Second, respondents reported that they would be somewhatore likely to engage in some cost-reducing behaviors – specifi-
ally, going to urgent care instead of the ER, and contacting theiroctor to ask for a generic drug – if they were covered by aimplified insurance plan than if they were covered by a tra-itional plan. One explanation for why we don’t find a strikingifference in choices between the traditional and simplified planay stem in part from the fact that people are already aware
hat traditional plans incorporate incentives for seeing in-networkroviders, avoiding the emergency room, and taking generic drugs,
ven if they can’t quantify the consequences of choosing one optionver the other. Indeed, the fear induced by such ambiguity – thathe more expensive options may be much more expensive – maye an even more potent motivator than the knowledge of actual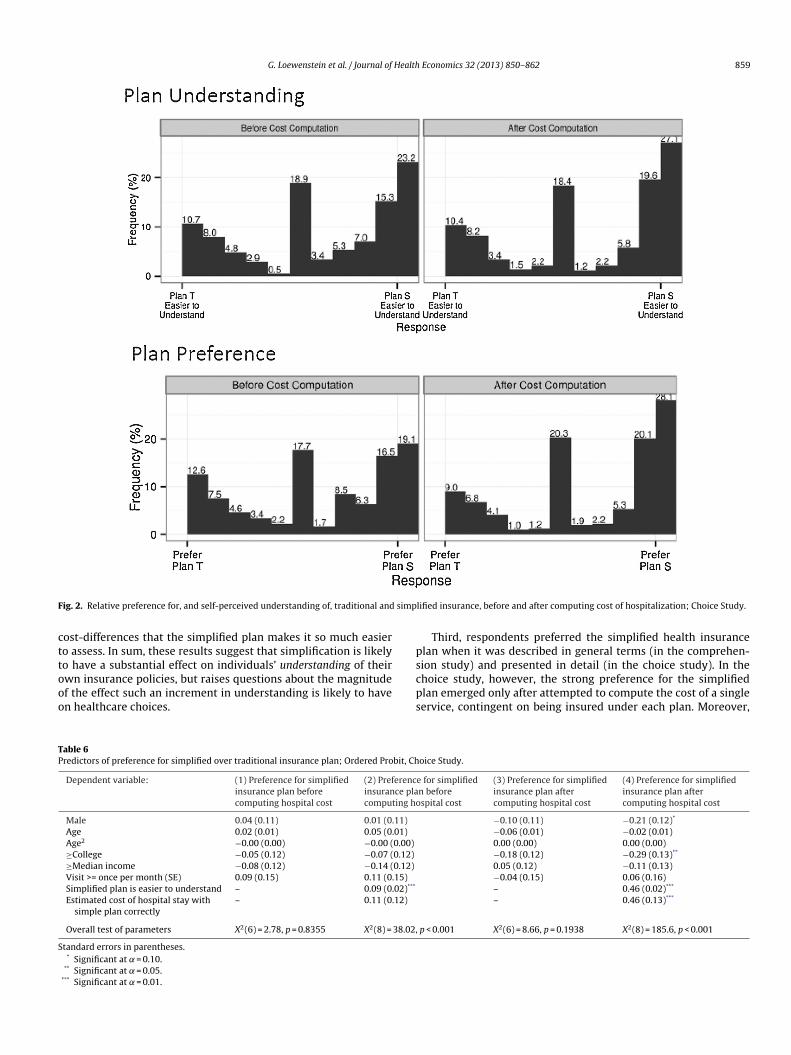
G. Loewenstein et al. / Journal of Health Economics 32 (2013) 850– 862 859
F simp
cttooo
ps
TP
S
ig. 2. Relative preference for, and self-perceived understanding of, traditional and
ost-differences that the simplified plan makes it so much easiero assess. In sum, these results suggest that simplification is likelyo have a substantial effect on individuals’ understanding of their
wn insurance policies, but raises questions about the magnitudef the effect such an increment in understanding is likely to haven healthcare choices.cps
able 6redictors of preference for simplified over traditional insurance plan; Ordered Probit, Ch
Dependent variable: (1) Preference for simplifiedinsurance plan beforecomputing hospital cost
(2) Preferencinsurance placomputing ho
Male 0.04 (0.11) 0.01 (0.11)
Age 0.02 (0.01) 0.05 (0.01)
Age2 −0.00 (0.00) −0.00 (0.00)
≥College −0.05 (0.12) −0.07 (0.12)
≥Median income −0.08 (0.12) −0.14 (0.12)
Visit >= once per month (SE) 0.09 (0.15) 0.11 (0.15)
Simplified plan is easier to understand – 0.09 (0.02)***
Estimated cost of hospital stay withsimple plan correctly
– 0.11 (0.12)
Overall test of parameters X2(6) = 2.78, p = 0.8355 X2(8) = 38.02,
tandard errors in parentheses.* Significant at = 0.10.
** Significant at = 0.05.*** Significant at = 0.01.
lified insurance, before and after computing cost of hospitalization; Choice Study.
Third, respondents preferred the simplified health insurancelan when it was described in general terms (in the comprehen-ion study) and presented in detail (in the choice study). In the
hoice study, however, the strong preference for the simplifiedlan emerged only after attempted to compute the cost of a singleervice, contingent on being insured under each plan. Moreover,oice Study.
e for simplifiedn beforespital cost
(3) Preference for simplifiedinsurance plan aftercomputing hospital cost
(4) Preference for simplifiedinsurance plan aftercomputing hospital cost
−0.10 (0.11) −0.21 (0.12)*
−0.06 (0.01) −0.02 (0.01)0.00 (0.00) 0.00 (0.00)−0.18 (0.12) −0.29 (0.13)**
0.05 (0.12) −0.11 (0.13)−0.04 (0.15) 0.06 (0.16)– 0.46 (0.02)***
– 0.46 (0.13)***
p < 0.001 X2(6) = 8.66, p = 0.1938 X2(8) = 185.6, p < 0.001

8 Health
bwsspmrisv
hcticiismsitlrdwidtgipv
bdibtfci2midwoo
slpm–oibidr
wi
ptaaoutt
sdaphcim
iwfiHtrfiittfsitu
A
oitCCuabfi
A
Diagnostic lab/test $0Primary care office visit $35
60 G. Loewenstein et al. / Journal of
ased in part on responses to the open-ended question abouthy they preferred the plan they expressed a preference for, it
eems that some respondents were put off by the high prices ofervices that the simplified plan made it easier to perceive. Thisoints to a potential pitfall or marketing a simplified plan; peopleay prefer the devil they don’t know in this context. Perhaps as a
esult of optimism bias or a dislike for being confronted by painfulnformation, consumers may be attracted by the traditional plan’shrouding of the prices they will have to pay should they requirearious medical services.
Inevitably, the research has limitations. Respondents may notave been very motivated to answer the comprehension questionsorrectly, since they were not incentivized to do so. More seriously,he choices respondents made in the choice survey were hypothet-cal, and may not well represent how respondents would behave ifonfronted with similar, real, choices. On the one hand, the qual-ty of the information they received was probably as good as mostnsured individuals face when they are making healthcare deci-ions, and the predominant multiple choice questions in the surveyay have made it easy for respondents to guess the correct answer,
o the results may overstate both the impact of the insurance pol-cy on medical choices as well as on ability to estimate costs. Onhe other hand, the hypothetical nature of the choices, and theack of incentives for responding correctly, may have decreasedespondents’ attentions to details, which could have attenuatedifferences between the surveys that might be greater in the realorld. In addition, some of the factors incorporated in the scenar-
os, such as recommendations from friends, the convenience of aoctor who is geographically closer, and the stressfulness of con-acting a doctor to change a prescription, seem likely to have areater impact in reality than in hypothetical choice, although thiss not so important for understanding the impact of the insuranceolicies since these factors were held constant between the twoersions of the survey.
Although simplified insurance might help consumers makeetter choices between policies, and perhaps better healthcareecisions given the policies they end up selecting, the overall
mpact of simplification is likely to be more subtle and complexecause employers are unlikely to be a static part of the equa-ion. Prior research on automatic enrollment in retirement plansound that it led workers to save more, but also led employers tout back on the match rate so as to maintain the same approx-mate payout (Soto and Butrica, 2013; Butrica and Karamcheva,012). Thus, the main net effect was to redistribute wealth fromore affluent workers to poorer workers who hadn’t been sav-
ng previously or receiving the match (arguably a good thing), butecreasing the match, as well as the savings rates, for more affluentorkers. The impact of health insurance will therefore depend not
nly on the responses of different groups of workers, but also thosef employers.
The impact of simplification is also likely to depend on thepecific form that simplification takes. Almost surely, the singleargest mistake that most insurance purchasers make is to purchaseolicies with overly low deductibles (Sydnor, 2010). Indeed, suchistakes are so severe that in some cases they violate dominance
e.g., when someone pays more than $250 to drop the deductiblen a medical insurance policy by less than $250. Based on this find-ng alone, it might seem that lowering deductibles to zero woulde lead to even more suboptimal choices, but this is not necessar-
ly a correct inference. If copayments are raised as deductibles areropped, this could decrease moral hazard – one of the factors that
aises the cost of low deductible policies.In addition, if all workers faced the same zero deductible, thisould eliminate adverse selection, at least on deductibles, which
s a major contributing factor to the low pricing of high deductible
Economics 32 (2013) 850– 862
olicies. If making choices simpler makes it easier for consumerso find good matches in coverage, however, is unlikely to help,nd might even have adverse effects, when it comes to the otherspects of adverse selection. For example, better decision makingn the part of consumers could lead to a greater concentration ofnhealthy consumers in high cost, high benefit, plans, which wouldend to raise the costs, and prices, for such plans, and, as a result,o reduce risk-sharing between healthier and sicker individuals.
Giving people choices between insurance options they under-tand is almost certainly a good thing; it is, arguably, inherentlyesirable for people to make healthcare decisions with a reason-ble understanding of what different options will cost. Yet, as therior discussion suggests, knowing exactly who will benefit or beurt by simplification is not at all easy to predict. Like most poli-ies, therefore, it would be best to examine the consequences ofnsurance simplification beginning with small scale field experi-
ents.While recognizing the potential problem of insurance complex-
ty, the ACA adopts a somewhat superficial approach to dealingith it that revolves around the standardization and simpli-ed presentation of information about insurance plan features.owever, presenting simplified information about something
hat is inherently complex introduces a risk of ‘smoothing over’eal complexities, in effect burying them in the now not-so-ne print. Rather than trying to explain inherently complex
nsurance plans in simple terms, therefore, a more fundamen-al approach would be to (1) design health insurance productshat are truly simple, and (2) require plans to offer identicaleatures that can be directly compared. In this paper, we havehown that it is possible to develop a cost-neutral simplifiednsurance product that is appealing to consumers. Hopefully,he market will recognize, and meet, the need for such prod-cts.
cknowledgements
We thank Tim Zautcke at Humana for assisting in the devel-pment of the surveys and for providing insight and expertise onnsurance product design, and Jonathan Steinhart for providing sta-istical analysis. Thanks also to Judi Israel Rosen and the Colchesteronsulting Group for creating the Behavioral Economics Academiconsortium, a collaborative group of nine academics from fiveniversities. The Consortium partners with major corporations todvance the field of behavioral economics and address complexusiness and social issues. This collaborative effort creates a uniqueorum to test concepts and put the insights of academic researchnto action.
ppendix A. The two insurance plans
CODE: A67Plan S
You pay (in network)
PHYSICIAN SERVICES (per visit)Preventive Services: preventive office visits,
preventive laboratory and radiology,preventive immunizations, preventive Papsmear, preventive mammography
$0
Specialist visit $60Therapies: chiropractor, speech, physical,
occupational$60
Urgent Care $75

Health
A
i0
R
A
B
B
B
B
B
C
CC
C
C
e
G. Loewenstein et al. / Journal of
Plan SYou pay (in network)
HOSPITAL SERVICES (per visit)Emergency Room $250Outpatient Surgery $700Inpatient Stay $350 per day, up to a
maximum of $1050.
OTHER MEDICAL SERVICES (per visit)Durable Medical Equipment and Prosthetics $375Ambulance $375Advanced Imaging (PET, MRI, MRA, CAT) $375
PRESCRIPTION MEDICATION BENEFIT (per 30day prescription)
$10 Generic/$50 Brand
Maximum Out-of-Pocket/Year – All feesabove apply towards maximumout-of-pocket. Once maximum hit, allcosts are covered.Single $5000Family $10,000
OUT OF NETWORK:If you go to an Out of Network physician, lab,or hospital, services are covered at 50% afteryou have paid $5000 as an Individual or$15,000 as a family.
Plan T
In Networkproviders
Out of Networkproviders
Coinsurance Values 80% 50%Office Visit Co pay $30 primary
care/$55specialist
Not applicable
Deductible- per calendar year- copays do not apply
Single $1500 $4500Family $3000 $9000
Out-of-Pocket Maximum- per calendar year
- Deductible and copays do notapplySingle $3000 $9000Family $6000 $18,000
PREVENTIVE SERVICESPreventive office visitsPreventive laboratory and radiologyPreventive Pap smearPreventive mammographyPreventive prostate screeningPreventive immunizationsPreventive flu/pneumonia
immunizationsPreventive endoscopy 100% 50% after
deductible
PHYSICIAN SERVICESOffice visit 100% after
office visitcopay
50% afterdeductible
Diagnostic laboratory and radiology 100% 50% afterdeductible
HOSPITAL SERVICESInpatient services 80% after
deductible50% afterdeductible
Emergency room visit (copay waivedif admitted)
100% after$300 copay
100% after$300 copay
Outpatient surgery and services 80% afterdeductible
50% afterdeductible
F
F
G
Economics 32 (2013) 850– 862 861
Plan T
In Networkproviders
Out of Networkproviders
OTHER MEDICAL SERVICESUrgent Care 100% after $75
copay50% afterdeductible
Spinal manipulations, adjustments,modalities, physical, occupational,cognitive, speech and audiologytherapy
100% afterspecialist copay
50% afterdeductible
Advanced imaging (PET, MRI, MRA,CAT, SPECT)
80% afterdeductible
50% afterdeductible
Ambulance 80% afterdeductible
80% afterin-networkdeductible
Durable medical equipment 80% afterdeductible
50% afterdeductible
Rx Benefit - Retail
$10/$40/$70/25%
70%afterappli-ca-blecopay-ment
- Level One: Low cost generic andbrand-name drugs.
- Level Two: Higher cost generic andbrand-name drugs.
- Level Three: Brand-name drugs thathave generic or brand-namealternatives on Levels One or Two.
- Level Four: High-technology drugs(certain brand-name drugs, andself-administered injectablemedications).
ppendix B. Supplementary data
Supplementary data associated with this article can be found,n the online version, at http://dx.doi.org/10.1016/j.jhealeco.2013.4.004.
eferences
baluck, J.T., Gruber, J., 2011. Heterogeneity in choice inconsistencies among theelderly: evidence from prescription drug plan choice. American EconomicReview 101, 377–381.
arseghyan, L., Molinari, F., O’Donoghue, T., Teitelbaum, J.C., 2013. The nature of riskpreferences: evidence from insurance choices (November 7, 2012). AmericanEconomic Review (Forthcoming).
erkman, N.D., Sheridan, S.L., Donahue, K.E., Halpern, D.J., Viera, A., Crotty, K., 2011.Health Literacy Interventions and Outcomes: An Updated Systematic Review(AHRQ 11-E006). Agency for Healthcare Research and Quality, U.S. Departmentof Health and Human Services, Rockville, MD.
ettinger, E.P., Long, B.T., Oreopolous, P., Sanbonmatsu, S., 2009. The role of simpli-fication and information in college decisions: results from the H&R Block FAFSAexperiment. NBER Working Paper 15361.
hargava, S., Manoli, D., 2012. Why are benefits left on the table? Assessing the roleof information, complexity, and stigma on take-up with an IRS field experiment.Working Paper. University of Chicago.
utrica, B.A., Karamcheva, N., 2012. Automatic Enrollment, Employee Compensa-tion, and Retirement Security. Center for Retirement Research at Boston CollegeWorking Paper No. 2012-25., http://dx.doi.org/10.2139/ssrn.2181649, Availableat SSRN: http://ssrn.com/abstract=2181649
hoi, J.J., Laibson, D., Madrian, B.C., 2009. Reducing the complexity costs of 401 (k)participation: the case of quick enrollment. In: Wise, D.A. (Ed.), Developmentsin the Economics of Aging. University of Chicago Press, Chicago, pp. 57–82.
onsumers’ Checkbook, http://www.checkbook.org/newhig2/hig.cfmonsumers Union, University of Maryland, American Institutes for Research, 2011
http://www.consumersunion.org/pub/core health care/018348.htmlronqvist, H., Thaler, R.H., 2004. Design choices in privatized social-security sys-
tems: learning from the Swedish experience. American Economic Review 94,424–428.
unningham, P.J., Denk, C.D., Sinclair, M., 2001. Do consumers know how their healthplan works? Health Affairs 20, 59–166.
Health (2008) http://phx.corporate-ir.net/phoenix.zhtml?c=201232&p=irol-newsArticle&ID=1090963
rank, R.G., Lamiraud, K., 2009. Choice, price competition and complexity in marketsfor health insurance. Journal of Economic Behavior & Organization 71, 550–562.
rank, R.G., Zeckhauser, R.J., 2009. Health insurance exchanges—making the marketswork New England. Journal of Medicine 361, 1135–1137.
abaix, X., Laibson, D., 2006. Shrouded attributes, consumer myopia, and informa-tion suppression in competitive markets. Quarterly Journal of Economics 121,505–540.

8 Health
G
H
H
H
H
H
H
H
H
I
K
M
M
N
O
S
S
62 G. Loewenstein et al. / Journal of
arnick, D.W., Hendricks, A.M., Thorpe, K.E., Newhouse, J.P., Donelan, K., Blendon,R.J., 1993. How well do Americans understand their health coverage? HealthAffairs 12, 204–212.
andel, B., 2011. Adverse selection and switching costs in health insurance markets:when nudging hurts. NBER Working Paper No. 17459.
andel, B.R., Kolstad, J.T., 2013. Health Insurance for Humans: Information Frictions,Plan Choice, and Consumer Welfare. Working Paper. University of Pennsylvania.
astings, J.S., Tejeda-Ashton, L., 2008. Financial literacy, information, and demandelasticity: survey and experimental evidence from Mexico. NBER Working PaperNo. 14538.
astings, J.S., Weinstein, J.M., 2008. Information, school choice, and academicachievement: evidence from two experiments. Quarterly Journal of Economics123, 1373–1414.
ealth Policy Brief http://www.consumersunion.org/pub/pdf/Consumer%20Difficulties%20Selecting%20Health%20Plans%20Jan%202012.pdf
eidhues, P., Koszegi, B., Murooka, T., 2012a. Exploitative innovation. Workingpaper. Central European University.
eidhues, P., Koszegi, B., Murooka, T., 2012b. Inferior products and profitable decep-tion. Working paper. Central European University.
eiss, F., McFadden, D., Winter, J., 2006. Who failed to enroll in Medicare Part D, andwhy? Early results. Health Affairs 25, 344–354.
yengar, S.S., Lepper, M.R., 2000. When choice is demotivating: can one desiretoo much of a good thing? Journal of Personality and Social Psychology 79,995–1006.
T
W
Economics 32 (2013) 850– 862
ling, J.R., Mullainathan, S., Shafir, E., Vermeulen, L., Wrobel, M., 2012. Comparisonfriction: experimental evidence from Medicare drug plans. Quarterly Journal ofEconomics 127, 199–235.
arquis, M.S., 1983. Consumers’ knowledge about their health insurance coverage,1983. Health Care Finance Review 5, 65–80.
eredith, L.S., Humphrey, N., Orlando, M., Camp, P., 2002. Knowledge ofhealth care benefits among patients with depression. Medical Care 40,338–346.
elson, D.E., Thompson, B.L., Davenport, N.J., Penaloza, L.J., 2000. What peoplereally know about their health insurance: a comparison of information obtainedfrom individuals and their insurers. American Journal of Public Health 90,924–928.
’Donoghue, T., Rabin, M., 2009. Doing it now or later. American Economic Review89 (1), 103–124.
oto, M., Butrica, B.A., 2013. Will automatic enrollment reduce employer con-tributions to 401(k) plans? The Urban Institute, Retirement Policy Program.Discussion Paper 09-04.
ydnor, J., 2010. (Over)insuring modest risks. American Economic Journal: AppliedEconomics 2, 177–199.
he Regence Group, 2008. Regence Survey Shows Steep Health Plan Learning Curve09/22/2008. http://news.regence.com/article display.cfm?article id=4454
inter, J., Balza, R., Caro, F., Heiss, F., Jun, B.H., Matzkin, R., McFadden, D., 2006.Medicare prescription drug coverage: consumer information and preference.Proceedings of the National Academy of Sciences 103, 7929–7934.