
Journal of Geophysical Research - Atmospheres , 120(21 ...
23
http://www.diva-portal.org This is the published version of a paper published in Journal of Geophysical Research - Atmospheres. Citation for the original published paper (version of record): Messori, G., Caballero, R. (2015) On double Rossby wave breaking in the North Atlantic. Journal of Geophysical Research - Atmospheres, 120(21): 11129-11150 http://dx.doi.org/10.1002/2015JD023854 Access to the published version may require subscription. N.B. When citing this work, cite the original published paper. Permanent link to this version: http://urn.kb.se/resolve?urn=urn:nbn:se:su:diva-124495
Transcript of Journal of Geophysical Research - Atmospheres , 120(21 ...

http://www.diva-portal.org
This is the published version of a paper published in Journal of Geophysical Research - Atmospheres.
Citation for the original published paper (version of record):
Messori, G., Caballero, R. (2015)
On double Rossby wave breaking in the North Atlantic.
Journal of Geophysical Research - Atmospheres, 120(21): 11129-11150
http://dx.doi.org/10.1002/2015JD023854
Access to the published version may require subscription.
N.B. When citing this work, cite the original published paper.
Permanent link to this version:http://urn.kb.se/resolve?urn=urn:nbn:se:su:diva-124495
On double Rossby wave breakingin the North AtlanticGabriele Messori1,2 and Rodrigo Caballero1
1Department of Meteorology and Bolin Centre for Climate Research, Stockholm University, Stockholm, Sweden, 2Now atMet Office Hadley Centre, Exeter, United Kingdom
Abstract We discuss the dynamical features associated with double Rossby wave breaking (DWB,concurrent cyclonic and anticyclonic breakings) over the North Atlantic, with a focus on the North AtlanticOscillation (NAO), the midlatitude jet stream, and surface wind extremes over continental Europe. Objectiveautomated algorithms for detecting wave breaking and determining the location, intensity, and direction of thejet are adopted. The analysis is performed on the European Centre for Medium-Range Weather ForecastsERA-Interim reanalysis and the Max Planck Institute Earth System Model (MPI-ESM). We find that DWB eventscan project onto both phases of the NAO, albeit showing no strong preference for either. Wave-breaking pairsoccurring in the northern North Atlantic project onto the positive NAO, while the opposite holds for pairsoccurring farther south. DWB also affects the direction and intensity of the jet stream. Events in the eastern halfof the basin (EWB) intensify and zonalize the jet, while events farther to the west (WWB) weaken the westerlyflow over Europe. An analysis of destructive wind storms over Europe in the last three decades suggeststhat these are typically associated with a very intense, zonal jet—similar to the case of EWB. Indeed, EWBcorresponds to an enhanced likelihood of destructive windstorms over the continent, although there is not aone-to-one correspondence. The MPI-ESMmodel does not capture this statistical relationship. On the contrary,WWB corresponds to a decreased likelihood of destructive weather.
1. Introduction
Rossby wave breaking (RWB) plays a fundamental role in shaping the atmospheric circulation of the midlati-tudes. Major modes of variability such as the North Atlantic Oscillation (NAO) and the Northern HemisphereAnnular Mode have been interpreted as the result of specific wave-breaking patterns [e.g., Benedict et al.,2004; Franzke et al., 2004; Riviere and Orlanski, 2007; Woollings and Hoskins, 2008; Strong and Magnusdottir,2008a, 2008b; Kunz et al., 2009; Drouard et al., 2013]. Benedict et al. [2004] and Franzke et al. [2004] identifiedthe positive NAO as the outcome of two successive anticyclonic Rossby wave-breaking (AWB) events, the firstover the Eastern Pacific and the second over the North Atlantic. The negative NAO was instead characterizedas an in situ development in the North Atlantic, related to cyclonic wave breaking (CWB). Woollings andHoskins [2008], related CWB in the North Atlantic to high-latitude atmospheric blocking; the authors envi-saged the positive NAO as the basic, unblocked state of the North Atlantic and the negative NAO as a perioddisplaying more frequent wave-breaking occurrences and a weakened zonal flow.
RWB events are identified in the upper troposphere but affect the flow at all tropospheric levels and play animportant role in the meridional transport of both tropical and subtropical air masses [Homeyer and Bowman,2013]. At the surface, AWB drives a positive sea level pressure (SLP) anomaly to the South of the breaking anda negative anomaly to the North, while the converse holds for CWB [Strong and Magnusdottir, 2008a]. Amidlatitude AWB (CWB) is therefore associated with an enhanced (reduced) SLP dipole over the Atlanticand a more northerly (southerly) jet than usual [Riviere and Orlanski, 2007]. Strong and Magnusdottir[2008a] found the relationship between RWB and the NAO to be strongly dependent on the meridionallocation of RWB, with AWB (CWB) centered around 50°N associated with the positive (negative) phase ofthe NAO, in agreement with previous studies [e.g., Benedict et al., 2004]. RWB events shifted 20° to the northor south were found to drive the opposite NAO polarity.
More recently, particular RWB patterns over the North Atlantic have also been associated with the developmentof extreme cyclones and destructive weather events over Europe. Hanley and Caballero [2012, hereafter HC12]computed composites of the large-scale flow evolution preceding 25 historical European windstorms and,
MESSORI AND CABALLERO DOUBLE ROSSBY WAVE BREAKING 11,129
PUBLICATIONSJournal of Geophysical Research: Atmospheres
RESEARCH ARTICLE10.1002/2015JD023854
Key Points:• Double wave breaking does notproject onto a particular phase ofthe NAO
• Double wave breaking in the easternAtlantic strengthens and zonalizesthe jet
• Double wave breaking in the easternAtlantic favors European windstorms
Supporting Information:• Texts S1–S4 and Figures S1–S9
Correspondence to:G. Messori,[email protected]
Citation:Messori, G., and R. Caballero (2015), Ondouble Rossby wave breaking in theNorth Atlantic, J. Geophys. Res. Atmos.,120, 11,129–11,150, doi:10.1002/2015JD023854.
Received 25 JUN 2015Accepted 17 OCT 2015Accepted article online 21 OCT 2015Published online 12 NOV 2015
©2015. American Geophysical Union.All Rights Reserved.

in 22 cases, found basin-scale AWB occurring in the southern half of the North Atlantic basin while CWB simul-taneously developed farther north. A simple schematic of this double-wave-breaking (DWB) process and itsdynamical impacts is provided in Figure 1. The DWB configuration results in a strong meridional potentialvorticity (PV) gradient, by virtue of the positive (negative) PV anomalies driven by the cyclonic (anticyclonic)WB. The relationship between PV and velocity, implied by PV inversion [Hoskins et al., 1985], is such that awesterly flow corresponds to a positive meridional PV gradient. A strongermeridional PV gradient will thereforebe in equilibriumwith a stronger westerly jet. An alternative interpretation is that AWB causes a poleward eddymomentum flux, while CWB achieves the opposite effect [Thorncroft et al., 1993; Riviere and Orlanski, 2007]. DWBthus results in a convergence of zonal momentum in the region between the two wave-breaking events,enhancing the westerly flow there. In either case, the final result is a strengthened and more zonally orientedjet stream over the North Atlantic. This strong jet can then act to intensify weather systems and steer themtoward the European continent, favoring destructive events (HC12). Gómara et al. [2014a] found that explosivecyclogenesis in the eastern North Atlantic is associated with CWB over eastern Greenland and AWB in thesubtropical part of the basin; though typically only one of the wave-breaking events is present at any giventime, the rare cyclones preceded by the simultaneous occurrence of both AWB and CWB feature particularlyhigh intensities and deepening rates. Finally, Pinto et al. [2014] identified an important link between DWB occur-rences and 4 months displaying cyclone clustering in the Euro-Atlantic sector.
If appropriately located, the superposed footprints of concurrent AWB and CWB may yield very intense SLPand surface wind anomalies, pointing to DWB as a feature of considerable dynamical interest. For example,when the SLP anomalies coincide with one of the NAO’s pressure centers, theymight lead to a strong positiveor negative phase of the oscillation, depending on their latitudinal location. Similarly, if DWB systematicallyintensifies and zonalizes the jet stream, the link with high-impact weather events might be broader thanthe set of historical storms discussed in HC12.
The literature has mostly focused on destructive events, verifying whether selected occurrences also dis-played DWB. Less attention has been given to DWB events as a whole, except for brief discussions inGómara et al. [2014a] and Pinto et al. [2014]. The question of whether DWB events can be good dynamicalpredictors for storminess over Europe has therefore been left largely open. Our aim here is to take a morecomprehensive perspective on DWB than in previous studies, by basing our analysis on the full complementof DWB events as opposed to specific sets of cyclones or windstorms. This enables us to explore the generalrelation between DWB and the large-scale flow across the North Atlantic, as well as further establishing its linkwith European windstorms. For these purposes, DWB will be simply defined as the simultaneous occurrenceof AWB and CWB in the North Atlantic basin, with the CWB to the north of the AWB. The analysis uses theERA-Interim data set and will focus on three specific aspects:
1. the interplay between DWB and the phase of the NAO;2. the impact of DWB on the jet stream; and3. the statistical relationship between DWB and surface wind extremes over Europe and, in particular, the
value of DWB as a predictor for destructive windstorms over the continent.
Figure 1. Schematic illustrating the impact of DWB on the zonal wind. The thin black lines show idealized PV contours. Thesimultaneous AWB and CWB result in a strengthened meridional PV gradient and a convergence of zonal momentum,leading to an intensified zonal jet. This, in turn, favors enhanced wind destructiveness downstream of the DWB. The blackstars show the nominal locations of the two WB events.
Journal of Geophysical Research: Atmospheres 10.1002/2015JD023854
MESSORI AND CABALLERO DOUBLE ROSSBY WAVE BREAKING 11,130

Windstorms are one of the leading sources of insured losses in Europe [Berz, 2005] and considerable effortshave been devoted to model-based forecasts of changes in their frequency and intensity under futureclimate conditions [e.g., Leckebusch et al., 2008; Donat et al., 2010; Pinto et al., 2012]. In order to validate theseforecasts, it is essential to evaluate how well climate models can reproduce the link between the large-scalecirculation and surface wind extremes in the past and current climates. In keeping with the scope of thisstudy, we briefly investigate the relationship between DWB and European wind extremes in the MaxPlanck Institute Earth System Model (MPI-ESM), as used in part of the CMIP5 simulations. These results arecompared to the ones obtained from the reanalysis data.
The analysis in the paper covers, in order, the geographical and temporal distributions of the DWB events(section 3); the link between DWB and the NAO (section 4); the influence of DWB on the jet stream’s tilt, mer-idional location, and intensity (section 5), and the link between severe windstorms and DWB (section 6).Separate supporting information is also available.
2. Data and Methods2.1. Reanalysis and Model Data
Unless specified, all the analyses are performed on the European Centre for Medium-Range WeatherForecasts ERA-Interim reanalysis data [Simmons et al., 2006]. One degree horizontal resolution, 6-hourly fieldsare considered. The analysis includes 33 winter (December, January, and February, DJF) time series, fromJanuary 1979 to December 2011.
All anomalies are computed relative to a moving 30 day mean. If 17 December 2000 is selected, the anomalywill be computed relative to themean of the period 2 December 2000—1 January 2001, for a total of 121 timesteps. This minimizes the impact of interseasonal and longer-term variability on the anomalies. An 8 day low-pass finite impulse recursive filter is then applied to the anomalies, to filter out the influence of individualsynoptic systems and focus exclusively on the supersynoptic impact of RWB on the large-scale flow. In orderto verify that none of the conclusions drawn in this paper were affected by the above methodology, theanomalies were recomputed following the methodology of Gómara et al. [2014b]. A detailed description ofthe latter and the relevant figures are provided in the supporting information.
The NAO pattern is computed as the leading empirical orthogonal function (EOF) of the 10 day mean SLP inthe region 20°N–90°N, 90°W–45°E. The red circles in Figures 2c and 2d mark the locations of the maximumand minimum values of the leading EOF, hereafter termed the NAO’s pressure centers. A high-frequencyNAO index (NAOI) is defined by projecting the NAO pattern onto the 6-hourly SLP time series and normalizingby the standard deviation. Positive (negative) NAO events are defined as periods where NAOI> 1(NAOI<�1) for more than a day. Lags are computed relative to the peak NAOI.
Part of the analysis on severe European windstorms (section 6) uses data from the MPI-ESM-P model. This is afully coupled Earth system model whose main components are the ECHAM6 atmospheric model [Stevenset al., 2013] and theMax Planck Institute OceanModel [Marsland et al., 2003; Jungclaus et al., 2013]. Themodelhas a T63 horizontal resolution (1.875°) with 47 vertical levels in the atmosphere and a nominal 1.5° resolutionwith 40 vertical levels in the ocean. The integration is run under fixed preindustrial (1850) boundary condi-tions, and we analyze 50 years at equilibrium. For further details on the model, the reader is referred toJungclaus et al. [2014].
2.2. Definition of Double Wave Breaking
Rossby wave breaking is detected using the algorithm presented in Barnes and Hartmann [2012], which iden-tifies the overturning of absolute vorticity contours on the 250 hPa pressure surface. First, the algorithmapplies a linear interpolation to the original data set and identifies the longest closed absolute vorticity con-tour of a given value which encircles the pole. Next, all latitudes where a single meridian intersects theselected contour 3 times are selected. These intersections are termed overturning points. All overturningpoints within 500 km of one another are considered to be part of the same overturning event. The centerof the event is the centroid, or geographical center, of all the overturning points forming part of that event.This procedure is iterated for contours with different absolute vorticity values; if several overturning eventshave centers within 2000 km of one another, they are grouped under a single wave-breaking episode. Thegeographical location of the wave-breaking episode is then defined as the average latitude and longitude
Journal of Geophysical Research: Atmospheres 10.1002/2015JD023854
MESSORI AND CABALLERO DOUBLE ROSSBY WAVE BREAKING 11,131

Figure 2. Climatological frequency of (a) cyclonic and (b) anticyclonic RWB during DJF and frequency of (c) cyclonic and (d) anticyclonic RWB during DWB events. Theunits are season�1 degree latitude�1 degree longitude�1. Note that the scales in Figures 2a and 2b, and 2c and 2d are different. The wave breaking is based on absolutevorticity at 250 hPa. The data covers ERA-Interim DJFs over the period 1979–2011. (e) Schematic of the different subcategories of DWB, indicating the location of theAWBs and CWBs in each case. The red box in Figure 2a denotes the full North Atlantic domain considered here; the black boxes show the eastern and westernsubdomains and the 45° and 55°N limits for the AWBs and CWBs, respectively. The red box in Figure 2b shows the domain used in the potential destructivenesscalculation. The black boxes in Figures 2c and 2d show the positive and negative NAO subdomains, respectively. The two red circles in the same panels show thelocations of the northern and southern NAO pressure centers.
Journal of Geophysical Research: Atmospheres 10.1002/2015JD023854
MESSORI AND CABALLERO DOUBLE ROSSBY WAVE BREAKING 11,132

of all the overturning events which are part of the episode, taking into consideration the spherical coordinatesystem. Episodes whose centers are located within 2000 km of one another on consecutive days are inter-preted as a single wave breaking lasting for more than 1 day. Note that the absolute vorticity field issmoothed before being processed: this is performed by expanding in spherical harmonics to T42 and thentruncating at T15. The algorithm further enforces a minimum 5° latitudinal extent for the overturning toqualify as a wave-breaking event, but no minimum temporal threshold is imposed. The results are similarto methods based on isentropic potential vorticity [Barnes and Hartmann, 2012].
The above algorithm provides an objective data set of WB instances, which we then use to identify DWB epi-sodes. The WB distributions and the different regions used to define DWB are summarized in Figure 2. Weconsider only WB events occurring within the North Atlantic domain (80°W–30°E and 20°–80°N, red box inFigure 2a) and require that AWB occurs within the part of the target domain south of 45°N, while CWB simul-taneously occurs north of 55°N. This ensures that AWB and CWB occur on the equatorward and polewardflanks of the climatological jet, respectively. Our analysis is therefore restricted to WB pairs which lead to ameridional convergence of zonal momentum into the jet, as discussed in section 1 above. SimultaneousAWB and CWB, where either occurs outside the above domains, are ignored. To verify that the fixed latitudi-nal thresholds successfully capture the desired DWB events, the calculation was repeated using a variablemeridional threshold for the AWB and CWB domains, based on the time-varying latitude of the jet stream.A full description of this methodology and the relevant figures are provided in the supporting information.Both techniques yield very similar results; here we report only results using the fixed-latitude method.
The twoWB events forming part of the DWBmust coexist for at least 1 day; for example, if an AWB persists for3 days and a CWB lasting for a single day is identified on the third day of the AWB’s life, that day qualifies asDWB. A more relaxed criterion whereby the two events can occur within 1 day of each other is also adopted.No temporal constraints on the duration of the individual WB events are imposed.
We further consider western and eastern subdomains spanning 80°–25°W and 25°W–30°E, respectively (boldblack boxes in Figure 2a), which we use to define several specific types of DWB. Eastern DWB (EWB) occurswhen both the CWB and AWB lie in the eastern subdomain. Similarly, western DWB (WWB) occurs when bothwave breakings lie in the western subdomain. The cases where one wave breaking occurs in the eastern por-tion of the basin and the other in the western portion are termed “misaligned breakings.” These can displayeither an AWB to the west and a CWB to the east (MA WWB) or, vice versa, an AWB to the east and a CWB tothe west (MA EWB). Note that the 45° and 55°N meridional thresholds still apply. Figure 2e provides a graphi-cal summary of the different DWB classes.
Finally, two sets of smaller domains are considered when investigating the link between DWB and the NAO.These are selected in an attempt to maximize the projection of the DWB SLP anomalies onto the NAO’scenters and are illustrated by the bold black boxes in Figures 2c and 2d. For the positive NAO, only DWBevents where the CWB occurs between 65° and 80°N and the AWB occurs between 45° and 55°N are consid-ered. This ensures that the CWB occurs to the north of the NAO’s low-pressure center and the AWB to thesouth. The southern bound of the CWB domain is actually just south of the NAO’s low-pressure center, butmore northerly domains did not yield a sufficient number of DWB events to analyze. The zonal extent ofthe domain is restricted to 50°W–0°, so that the largest SLP anomalies are roughly aligned with the NAOdipole. For the negative NAO, only events where the CWB occurs between 45° and 55°N and the AWB occursbetween 25° and 35°N are considered. This ensures that the CWB occurs to the north of the NAO’s high-pressure center of action and the AWB to the south. The zonal extent of the domain is again restrictedto 50°W–0°.
2.3. Jet Stream Indices
Two indices describing the state of the jet stream over the North Atlantic are used. Both consider an Atlanticdomain spanning 60° to 10°W and 35° to 80°N, and are computed for upper (200–400 hPa) and lower(700–925 hPa) levels. The first, the Jet Angle Index (JAI), quantifies the tilt of the jet. The zonal and meridionalcomponents of the low-pass filtered wind, averaged over either the upper or lower levels, are used to give thewind speed. Following Woollings et al. [2010], we apply a land mask to reduce the noise due to orography,which is especially strong at low levels. Only time steps with at least half of the meridians having a locationwith zonal wind above 8m s�1 are considered, andmaxima in wind speed along eachmeridian are identified.
Journal of Geophysical Research: Atmospheres 10.1002/2015JD023854
MESSORI AND CABALLERO DOUBLE ROSSBY WAVE BREAKING 11,133

If a given meridian has a secondary local windmaximum, such maximum is within 4m s�1 of the primary oneand is well separated (more than 5° latitude apart), then the meridian is ignored. Next, the best fit rhumb linefollowing wind speed maxima across the North Atlantic basin is computed. A rhumb line, or loxodrome, is anarc with a fixed bearing relative to the geographic North Pole. Mathematically, the bearing of a loxodromejoining the (lat, lon) points (φ0, λ0) and (φ1, λ1), measured clockwise from due North can be expressed as
β ¼ atan2 λ1 � λ0; ln tanπ4þ φ1
2
� �.tan
π4þ φ0
2
� �� �� �(1)
Here atan2 is the four-quadrant inverse tangent function. The rhumb line will cross all meridians along itspath at a fixed angle and is therefore well suited to define the bearing of the jet stream. The jet angle is thendefined as the complementary angle to the bearing of the rhumb line. Positive values indicate a northeast-ward flow, negative ones a southeastward flow.
The second index is the Jet Latitude Index (JLI), similar to the one first proposed byWoollings et al. [2010]. Thezonal component of the low-pass filtered wind, averaged over either the upper or lower levels, is used to givethe zonal wind speed. For each time step, the index then identifies the latitude of the strongest zonal flow,zonally averaged across the Atlantic domain. This is taken to be the reference latitude for the jet stream.The jet speed is defined as the zonal speed at the latitude identified by the JLI. The JLI is designed to com-plement the 2-D velocity maps discussed in the analysis, by focusing exclusively on the averaged zonal com-ponent of the jet. Further details on both the JAI and JLI, including a comparison of the JLI results to those ofWoollings et al. [2010] and a discussion of the choice of domain, are provided in the supporting information.
2.4. Destructive Days
Part of the analysis focuses on windstorms over continental Europe. The most destructive windstorms overthe 33 winters considered here are selected based on the Klawa and Ulbrich [2003] potential destructiveness(PD) index. The PD value at a given grid point for a specific time step is defined as
PD ¼ �vv98 � 1= Þ3; v > v98 0; v ≤ v98 (2)
Here v is the surface wind speed at the chosen grid point and time and v98 is the climatological 98th percen-tile of wind speed at the same location. This empirical expression is physically motivated by considerations ofsurface power dissipation and was found to provide an optimal fit to observed losses resulting from extremewindstorms in Germany [Klawa and Ulbrich, 2003]. The value of PD can thus be used as an approximatemetricfor the destructiveness of the wind at a given location. The algorithm is applied to all land points over adomain encompassing northern France, Germany, Benelux, and southern Denmark, with vertices at (49°N,5°W), (54°N, 11°E), (47°N, 12°E), and (46°N, 1°W). The domain is chosen to include the most economically pro-ductive and densely populated regions in Europe and is illustrated by the red quadrilateral in Figure 2b. Adomain-wide PD value is obtained by simply summing the values at all the individual grid points.
Since the algorithm uses the 98th percentile of climatological wind speed as a lower threshold, most days willhave zero destructiveness across the domain. Moreover, when considering days with nonzero destructive-ness, there are several instances where only one or two gridboxes within the domain exceed the 98th percen-tile of wind speed, often only by a small margin. To focus the analysis only on severe events, we classify a timestep as a destructive event if it displays winds in excess of the local 98th percentile over at least 20% of thegrid boxes within the domain. This provides an average of 8–9 days displaying a destructive event per winterin the reanalysis data and just over 7 days in the MPI-ESM-P model. Reasonable changes in this parameterhave been tested (10% and 30%), and the conclusions drawn here were not affected. For completeness, someof the results for the two alternative thresholds are included in the analysis. When only one set of results isdiscussed, this always refers to the 20% threshold definition.
To test that our threshold-based definition does indeed capture significant destructive events, part of the ana-lysis in the paper was repeated by ranking events based on their peak destructiveness. This is defined as themaximum domain-wide PD value, similarly to the methodology adopted in HC12. The destructive events arethen defined as the 50days displaying the largest peak destructiveness; reasonable variations in this numberwere tested. Note that, if several consecutive days rank in the top events, only the one displaying the largestPD value is retained. This ensures that the analysis does not consider the same weather system multiple times.
Journal of Geophysical Research: Atmospheres 10.1002/2015JD023854
MESSORI AND CABALLERO DOUBLE ROSSBY WAVE BREAKING 11,134

Table 1 provides a summary of all the geographical domains defined in this section.
The significance levels of all the results presented in the paper are estimated using a Monte Carlo approach.One thousand random samples, with the same number of members as the composite being tested for sig-nificance, are generated from the full 33 year data set. So, for example, to test a wind speed anomaly compo-site map based on 50 individual time steps, 1000 random samples of 50 wintertime wind speed anomalymaps are selected. Similarly, to test a JLI value resulting from the mean of 50 individual DWB events, 1000random samples of 50 wintertime JLI values are selected. The 95% confidence bounds are then derived fromthe distribution of the random samples.
3. Geographical and Temporal Distribution of Double Wave Breaking
The definition of DWB adopted here is purposefully loose and inclusive, so as to provide a comprehensiveoverview of the phenomenon. More restrictive definitions such as that in Gómara et al. [2014a] requiringthe RWB to exceed a minimum area threshold and to occur in specific geographical sectors have been tested,but it is found that they exclude a large number of events. Indeed, the discussion of DWB in Gómara et al.[2014a] focuses on an extremely limited number of cases (<1% of winter days).
With our definition, DWB is a relatively frequent occurrence, with approximately 12 DWB days per winteracross the whole basin (18 for the relaxed temporal overlap criterion), or one every 7.5 (5) days. Of these,around 6 (9) are WWB days, just under 2.5 (5) are EWB days, and the rest are misaligned events. Figures 2aand 2b show the wintertime climatology for cyclonic and anticyclonic wave-breaking events in the reanalysisdata, while Figures 2c and 2d display the frequencies on DWB days. AWB typically occurs in a band spanningthe southern half of the basin while CWB occurs farther to the north and with lower frequency. Both types ofWB show a relatively uniform zonal distribution across the basin. According to our definition of DWB, AWBmust occur to the south of 45°N and CWB to the north of 55°N, but Figures 2c and 2d show a considerablefrequency of WB events outside these limits. This is because the figures show all WB instances occurringon days displaying DWB. Often, such days will display more than two WBs across the Atlantic basin. The addi-tional WBs, not part of the DWB pair, can be located outside the specified domains.
While the two wave breakings must overlap by at least 1 day, no constraint is placed on the relative timing oftheir onset. It is therefore interesting to verify whether either of the two cyclonicities systematicallyprecedes the other. It is found that the AWB precedes the CWB on 47% of the cases; the CWB leads on16% of the cases and the two wave breakings begin on the same day in the remaining events. The AWBtherefore leads the development of the DWB almost 3 times as often as the CWB. This is likely linked tothe former’s longer-average duration (3.3 versus 1.7 days) and suggests that the CWB could be partlyentrained by the large, intense AWB to the south. If the analysis is repeated for the DWB pairs identifiedusing the variable threshold methodology (see section 2.2), the fractional split between the three casesremains almost unchanged.
Table 1. Summary of the Different Geographical Domains Used in the Analysis, as Defined in Section 2
Domain Geographical Boundaries Notes
NAO 20°–90°N, 90°W–45°EDWB AWB 20°–45°N, 80°W–30°E Figure 2aDWB CWB 55°–80°N, 80°W–30°E Figure 2aEWB 25°W–30°E Meridional extent as for DWB AWB
and DWB CWB, Figure 2aWWB 80°–25°W Meridional extent as for DWB AWB
and DWB CWB, Figure 2aDWB NAO+ AWB 45°–55°N, 50°W–0° Figure 2cDWB NAO+ CWB 65°–80°N, 50°W–0° Figure 2cDWB NAO- AWB 25°–35°N, 50°W–0° Figure 2dDWB NAO- CWB 45°–55°N, 50°W–0° Figure 2dJAI & JLI 35°–80°N, 60°–10°W Figure S6Destructive days (49°N, 5°W), (54°N, 11°E),
(47°N, 12°E), (46°N, 1°W)Vertices of a quadrilateral bounding
the domain, Figure 2b
Journal of Geophysical Research: Atmospheres 10.1002/2015JD023854
MESSORI AND CABALLERO DOUBLE ROSSBY WAVE BREAKING 11,135

4. Double Wave Breaking and the NAO
As noted in section 1, there is an extensive literature linking RWB and the NAO. In turn, there is a known con-nection between the NAO and extreme windstorms in Europe (e.g., HC12). The extent to which DWB projectsonto the NAO is an issue of interest in itself, and it may also yield insights into the mechanisms by which DWBultimately influences European windstorms. As also noted in section 1, RWB is associated with specific SLPanomalies; the location and orientation of the WB determines how these anomalies will project onto theNAO. This is illustrated schematically in Figure 3, which displays the composite SLP anomalies for severalthousand AWB and CWB events, centered such that they align with the NAO’s pressure centers [Strong andMagnusdottir, 2008a]. To obtain an optimal alignment between the SLP anomalies and the NAO’s pressurecenters, WB events projecting onto opposite phases of the NAO should be meridionally shifted by ~20°[Strong andMagnusdottir, 2008a]. A positive (negative) pressure anomaly develops on the southern (northern)flank of AWBs, while the converse holds for CWBs. If the cyclonic and anticyclonic components of the DWB arelocated such that their negative pressure anomalies overlap, they may lead to a strong positive or negativeNAO, depending on their latitudinal location. Cases where the pressure anomalies due to the two breakingsare misaligned will lead to a neutral projection onto the NAO.
We find that DWB events have roughly equal probabilities of leading to positive and negative NAO phases(Table 2). The mean NAOI 2 days after DWB is 0.05, statistically indistinguishable from zero, and an SLP compo-site over all DWB instances (not shown) displays no statistically significant anomalies over the NAO’s pressurecenters. Different lags (0 to 5 days following DWB) have been tested and all show similar results. Adoptinga variable meridional threshold for AWBs and CWBs (see section 2.2), does not lead to a significant projection.Indeed, even when the fixed meridional thresholds are removed, the mean locations of DWB pairs occurringduring positive and negative NAO phases do not display the large meridional shift one might expect. Wehave also examined the four different DWB subgroups separately (see section 2.2) and found that, on average,none project strongly onto either polarity of the NAO. Depending on the case, between 51% and 60% of theevents are found to match a positive NAO, while the mean NAOI values range from �0.03 to 0.14.
Next we investigate whether, byrestricting the geographical domainof DWB, it is possible to identify DWBevents that do project strongly ontothe NAO. These smaller domains,defined in section 2.2 and Table 1,are meant to identify the DWB pairsdriving SLP anomalies aligned withthe NAO’s centers of action. Due tothe limited area of the domains, the
Figure 3. Schematic plots illustrating composite SLP anomalies due to (a) cyclonic and (b) anticyclonic RWB. Continuous(dashed) contours represent positive (negative) anomalies. The shaded bands at 45° and 65°N mark the approximatelatitudes of the NAO’s pressure centers. The red dots mark the centroids of the two WBs, here centered around 50°N(adapted from Strong and Magnusdottir [2008a]; © American Meteorological Society, used with permission).
Table 2. Plus 2 Days Time Lag Mean and Standard Deviation of NAOIValues on All DWB Days and on DWB Days Within the Positive andNegative NAO Domainsa
Mean NAOI Standard Deviation
DWB Clim. (0.05) 0.97NAO+ Box 0.63 1.19NAO� Box �0.46 0.87
aValues in parentheses are not statistically different from the winter-time climatology at the 95% confidence level.
Journal of Geophysical Research: Atmospheres 10.1002/2015JD023854
MESSORI AND CABALLERO DOUBLE ROSSBY WAVE BREAKING 11,136

relaxed temporal criterion where the two WB events can occur within 1 day of one another is adopted toincrease our sample size. This results in almost three DWB events per winter. The mean and standard devia-tion of the NAOI values are shown in Table 2, while the associated composite SLP anomalies are shown inFigures 4a (positive NAO) and 4b (negative NAO).
For the positive NAO, likely candidates are WB pairs where the low SLP to the south of the CWB and to thenorth of the AWB coincides with the NAO’s low-pressure center; additionally, the high SLP to the south ofthe AWB will yield a positive anomaly over the high-pressure center. The selected DWB events have a mean2 day lag NAOI of 0.63. Note that, even though the NAOI presents a large standard deviation (σ = 1.19), themean value is statistically different from the climatological DWB one using a Monte Carlo test at the 95%level. As expected, the SLP pattern displays a large negative anomaly over the NAO’s low-pressure center;however, there is no positive anomaly over the high-pressure center.
A similar analysis can be performed for negative NAO events. Here likely candidates are DWBs where thenegative SLP anomalies of the twoWBs sum over the NAO’s high-pressure center. Additionally, the high pres-sure to the north of the CWB will yield a positive anomaly over the low-pressure center. These events have astatistically significant projection onto the negative NAO, with a mean NAOI value of �0.46 for a 2 day lagfollowing the DWBs. The SLP pattern displays a weak negative anomaly over the NAO’s high-pressure center,and a similarly weak positive anomaly over the low-pressure center.
The above analysis suggests that the relationship between DWB and the NAO is highly dependent on thegeographical location of the former. The large standard deviations seen in the NAOI (Table 2) further suggestthat DWB events driving well-aligned SLP anomalies which overlap the NAO’s centers of action are relativelyrare. These results are discussed further in section 7.
5. Double Wave Breaking and the Jet Stream
The DWB described in section 3 is a large-scale process, with individual events spanning a vast stretch of theNorth Atlantic basin. Previous studies have suggested that the occurrence of Rossby wave breaking, especiallyif associated with a positive NAO, has a strong influence on the jet stream [Riviere and Orlanski, 2007; Gómaraet al., 2014b; Pinto et al., 2014]. As discussed in section 1, DWB will generally lead to an increased meridional PVgradient in the region between the breakings and to an intensified midlatitude jet. Here we present a compre-hensive analysis of the impact of DWB on the jet stream, including its direction, meridional location, andintensity. We use the jet angle index (JAI) and jet latitude index (JLI) defined in section 2.3 above. While thejet latitude has been the subject of extensive analyses [e.g., Woollings et al., 2010; Hannachi et al., 2013;Woollings et al., 2014], less attention has been devoted to algorithms evaluating the jet’s bearing. The twoindices provide complementary information, since there is no a priori correspondence between the meridionalposition and the direction of the jet. The values are computed for both upper (200–400hPa) and near-surface(700–925hPa) levels. The lower level values allow for an easier comparison with jet analyses in the literature,while the upper level ones match the level at which the WB is diagnosed. Since the eddy-driven midlatitudejet is reasonably barotropic, the values found at upper levels showmany similarities to the surface ones. In orderto provide a complete overview of the changes in jet orientation, themean and upper and lower 5th percentilesof the JAI distributions are analyzed. The results are provided in Table 3.
Figure 4. Plus 2 days time lag composite SLP anomalies (hPa) for DWB days within the (a) positive and (b) negative NAOdomains. The red circles show the locations of the northern and southern NAO pressure centers. The white contoursbound anomalies exceeding the 95% confidence level derived from a random Monte Carlo sampling procedure.The data range is the same as in Figure 2.
Journal of Geophysical Research: Atmospheres 10.1002/2015JD023854
MESSORI AND CABALLERO DOUBLE ROSSBY WAVE BREAKING 11,137

The mean jet angle for the wintertime (DJF) season is found to be 16.4°, capturing the climatological southwestto northeast tilt of the North Atlantic circulation (see supporting information). The index also successfullycaptures the increase in the average jet tilt associated with the positive NAO [cf. Pinto and Raible, 2012]. Next,the angles for different subsets of DWB events are studied. All values are tested for statistical significance relativeto the wintertime climatological angle. The one exception is DWB occurring during positive NAO phases, whichis tested for significance relative to the positive NAO-only values. Since the maximum anomalies in the jet typi-cally lag the WB events by 1 to 3days, the values displayed in Table 3 correspond to an average over the 3daysfollowing the DWB events. The single-day values for the day of the DWB and each of the three following dayswere also analyzed individually, and the differences in JAI relative to the multiday mean were found to be small.
DWB events as a whole present a systematically smaller tilt than the wintertime climatology. In order toobtain a clearer picture, the DWB events are separated according to NAO phase and geographical location.The mean angle associated with DWB events which occur during positive NAO phases is relatively close tothat found for all positive NAOs. A small, albeit significant, increase in mean tilt is found at upper levels.Next, we consider DWB events occurring in the western (80.0°–25.0°W) and eastern (25.0°W–30.0°E)North Atlantic separately. EWB events tend to zonalize the jet relative to the DJF climatology, at both upperand lower levels. The median (not shown) and the 95th percentiles also show decreases, suggesting both asystematic shift of the upper 50th percentiles of the distribution and that large tilts are comparatively uncom-mon during EWB events. WWBs have no statistically significant effect on jet tilt. However, if only DWBs west of35°W are considered, the mean tilt is increased at both levels (not shown). This suggests that DWBs in the farwestern portion of the basin actively increase the mean jet tilt, while those occurring closer to the center ofthe basin leave it essentially unchanged.
Upper level wind speed composites over all DWB, EWB, and WWB events are shown in Figures 5a–5c, respec-tively. For conciseness, we only show plots at lag +2 days, which correspond to the strongest anomalies. Theanomalies associated with DWB events as a whole (Figure 5a) are relatively weak, with a tendency toward anintensified jet at the lower latitudes and a decrease of the wind speed north of approximately 55°N. This isconsistent with the smaller tilts detected by the algorithm. WWB (Figure 5b) drives a strengthened jet inthe western part of the basin and a weakened flow in the jet exit region. EWB (Figure 5c) also displays a band
Table 3. Jet Angle Index, Jet Latitude Index, and Jet Speed Values at Upper and Lower Levels for theWintertime Climatology and Different Subsets of Winter Daysa
Angle
Events Pressure Levels Mean 5th Percentile 95th Percentile Latitude Speed (m s�1)
(i) Wint. Clim. 700–925 hPa 16.4 �7.8 40.4 48.2 13.9200–400 hPa 14.8 �10.0 40.0 48.6 34.1
(ii) NAO+ 700–925 hPa 20.2 �2.6 (40.6) 49.8 15.5200–400 hPa 19.4 �4.4 (40.3) 50.0 36.4
(iii) DWB Clim. 700–925 hPa 14.8 (�10.4) (39.8) 47.1 (13.9)200–400 hPa (13.8) (�8.2) (39.0) 47.5 (34.2)
(iv) NAO+/DWB 700–925 hPa (19.5) 3.9 (40.2) 49.3 15.3200–400 hPa 20.3 3.0 (40.8) (49.9) 36.0
(v) WWB 700–925 hPa (15.8) (�8.1) (39.9) 47.1 (13.6)200–400 hPa (15.5) (�7.2) (40.3) (47.8) (33.7)
(vi) EWB 700–925 hPa 11.5 (�10.4) 30.6 46.4 14.7200–400 hPa 10.4 (�6.7) 35.1 46.5 35.2
(vii) MA DWB WWB 700–925 hPa (14.6) (�10.5) (40.6) 47.0 14.6EWB (14.8) (�18.9) (38.4) 46.9 (13.9)WWB 200–400 hPa (13.8) (�8.6) (39.8) 47.3 (35.3)EWB (13.7) (�10.0) (40.1) 47.1 (34.0)
(viii) Windstorms 700–925 hPa 12.3 (�12.3) 28.5 (48.4) 16.0200–400 hPa 12.3 (�8.8) 30.7 (49.2) 39.1
aThe values shown correspond to (i) the DJF climatology; (ii) positive NAO phases; (iii) all DWB events; (iv) DWB events occurring during a positive NAO phase; DWBevents occurring in the (v) western and (vi) eastern portions of the North Atlantic; (vii) misalignedDWBevents; (viii) destructive events. Case (vii) is further split dependingon the location of the AWBs. The values in brackets are not statistically different from the wintertime climatology at the 95% confidence level. Note that the values forDWBs occurring during a positive NAO phase were tested for statistical significance relative to the positive NAO-only value, as opposed to the wintertime climatology.
Journal of Geophysical Research: Atmospheres 10.1002/2015JD023854
MESSORI AND CABALLERO DOUBLE ROSSBY WAVE BREAKING 11,138

Figure 5. Composites of the 250 hPa horizontal wind speed anomaly (m s�1) at lag +2 days for (a) All DWB events,(b) Western, (c) Eastern, (d) misaligned WWB, and (e) misaligned EWB. Shadings show anomalies relative to the DJFclimatology; black contours show net values (starting from 15m s�1, interval 7.5 m s�1). Only anomalies exceedingthe 95% confidence level derived from a random Monte Carlo sampling procedure are shown. The data range is thesame as in Figure 2.
Journal of Geophysical Research: Atmospheres 10.1002/2015JD023854
MESSORI AND CABALLERO DOUBLE ROSSBY WAVE BREAKING 11,139
of enhanced flow in the western basin, but the largest anomalies are seen farther East, where an intensetripolar pattern develops. The flow is strengthened over continental Europe, and weakened elsewhere. Inparticular, there is a strong negative anomaly over the Nordic seas, effectively shifting the jet exit regionsouth of its climatological position. This results in a more zonal jet path, as detected by the algorithm.Note that if the more relaxed criterion whereby the two breakings can occur within 1 day of one another isconsidered, the tripolar anomaly pattern in the composite is weakened.
We turn next to the cases where the two RWB instances leading to the DWB are misaligned; that is, the caseswhere one is in the western portion of the basin and the other in the eastern portion. The upper level windspeed composites are shown in Figures 5d and 5e. Both misaligned cases show a modest decrease in meanjet tilt relative to the wintertime climatology, although the results are not statistically significant due to therelatively small sample sizes for these WB configurations. The western case displays a strengthening of thejet across most of the basin, with a moderate southward shift of the exit region relative to the climatologicalflow (cf. Figure S6b). A negative anomaly in the high latitudes is also present, and the overall effect is of aslightly more zonal than usual jet. The eastern AWB composite, on the contrary, shows very weak anomaliesacross the Atlantic domain. We therefore conclude that, regardless of level, most DWB configurations tend tosystematically zonalize the jet stream. The fact that some DWB subsets present opposite anomaly patterns(e.g., EWB and WWB), while others display stronger anomalies than the full DWB composite (e.g., EWB andMA WWB) suggests that the latter suffers from cancelation.
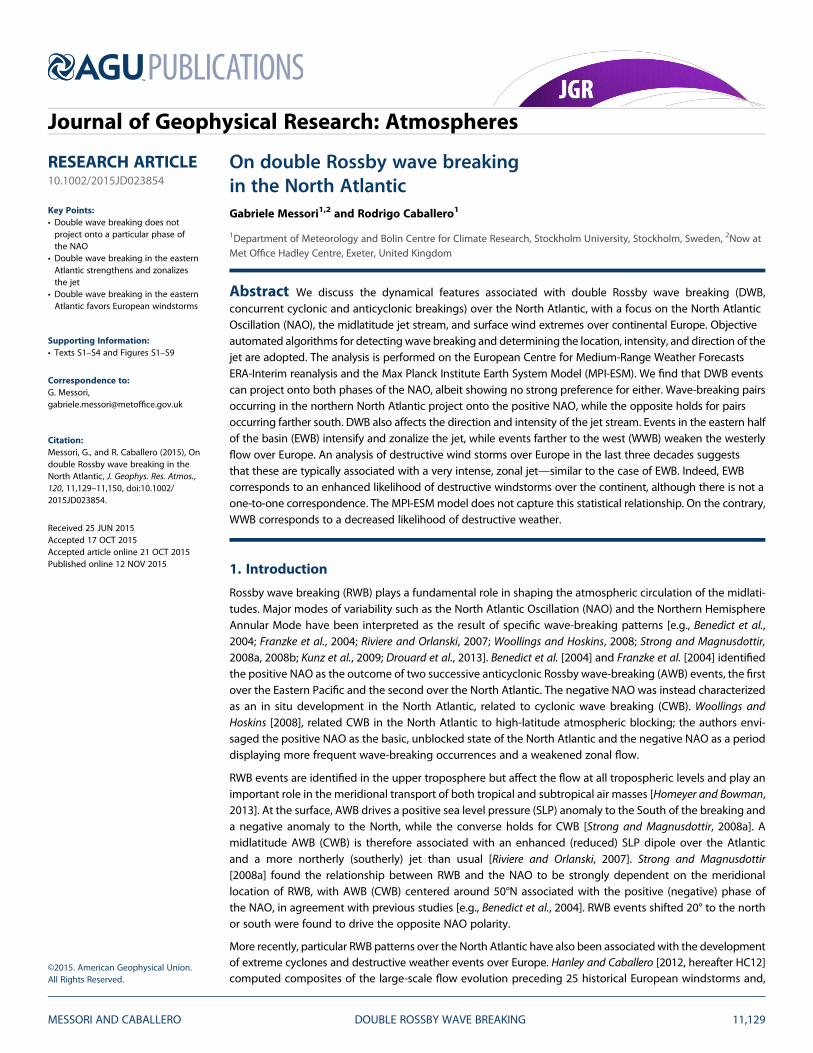
A similar analysis can be repeated for the JLI. Even though the distribution of latitude values is quite broad(the 5th and 95th near-surface percentiles for DJF are 36° and 64°N, respectively), most of the cases consid-ered in Table 3 display relatively similar means. This suggests that none of the selected WB configurationssystematically corresponds to either of the tails of the JLI distribution. At both upper and near-surface levels,the positive NAO case displays a slightly more northerly position than the wintertime climatology, while theDWB composites display a slightly more southerly location. In most cases, the mean latitudinal locations cor-relate well with the JAI values. Figure 6 illustrates the probability density estimates for the wintertime clima-tology (continuous curves), positive NAO (dash-dotted curves), and EWB (dashed curves) cases at both upperand near-surface levels. At upper levels (Figure 6a), all distributions cover a broad range of latitudes, with theNAO case displaying amarked peak in the upper half of the climatological JLI range. At the near-surface levels(Figure 6b), the wintertime climatology presents a trimodal character, similar to that found byWoollings et al.[2010] (see also Figure S8). The EWB climatology retains this trimodal structure, while the NAO distributionagain favors more northerly locations. Neither distribution projects onto a single peak, resulting in similarmean values. The relatively uniform nature of the JLI results will be discussed further in section 7.
Lastly, the jet stream’s speed is analyzed. This is defined as the zonally averaged zonal velocity at the latitudeidentified by the JLI (see section 2.3). The climatological low-level wintertime value is 13.9m s�1, withincreased values during positive NAO phases. This is in line with results in the literature (e.g., Woollings
et al. [2010] find a wintertime mean of 14m s�1). Both EWB events and MA WWB events display a small
Figure 6. Distribution of JLI values at (a) 200–400 hPa and (b) 700–925 hPa for the DJF climatology (bars), along with thekernel estimations of the PDF (continuous curves). Also shown are the kernel estimations for the positive NAO (dash-dottedcurves) and EWB (dashed curves) climatologies. The data range is the same as in Figure 2.
Journal of Geophysical Research: Atmospheres 10.1002/2015JD023854
MESSORI AND CABALLERO DOUBLE ROSSBY WAVE BREAKING 11,140

intensification of the jet, which for the EWB case is significant at both levels. These DWB types share a CWB inthe northeastern portion of the domain, suggesting that this might play a role in the intensification of the jet.This intensification agrees with the anomalies shown in the upper level velocity composites. EWB (Figure 5c)displays a positive anomaly centered over the eastern portion of the basin, while the misaligned DWB(Figure 5d) displays a strengthened flow across most of the basin. When computing the zonal mean flow,the effects of these geographically different positive anomalies are very similar. Note that caution shouldbe employed when comparing the magnitudes of the anomalies in the figures to the values shown inTable 3. The zonally averaged speeds do not necessarily relate to wind speed anomalies at fixed spatial loca-tions. Rather, they provide additional information relative to the velocity maps by focusing exclusively on theaveraged zonal component of the jet. We conclude that, as for the JAI, the EWB composite is the WB categorydisplaying the largest statistically significant anomalies and leads to an intensification of the jet over thedomain of interest.
6. Double Wave Breaking and Destructive Windstorms
Previous work has shown that wave-breaking configurations similar to the EWB pattern are conducive toexplosive cyclogenesis (Gómara et al. [2014a], based on a small fraction of Atlantic explosive cyclones) andcyclone clustering (Pinto et al., based on 4months displaying multiple cyclones over Western Europe), whileDWB precedes a large portion of the 25 most damaging storms which affected continental Europe during1958–2001 (HC12). However, in the latter study, no automated algorithm for the detection of the WB wasapplied. Here we present a more systematic analysis of the link between DWB and destructive wind stormsover Europe. This link is dynamically grounded in the flow anomalies associated with DWB, outlined insections 1 and 5 above. We also compare the results found for the reanalysis data to those from a 50 yearintegration of the MPI-ESM-P model.
6.1. Destructive Windstorms
Destructive events over continental Europe are selected, as described in section 2.4. These events projectweakly onto the positive NAO, with a mean NAOI value of 0.26. This is not surprising, since the positive phaseof the NAO displays more frequent and intense storms than the climatology and favors explosive cyclogen-esis [Gómara et al., 2014b], but also tends to increase the tilt of the jet stream. Figure 7 displays the upperlevel wind composites on the days leading up to destructive events. Note that, in comparing these to theDWB composites, a temporal lag between the two events should be considered. At day�6, there is an initialstrengthening of the jet stream. By day �4 a tripolar anomaly pattern has formed over the North Atlanticbasin, and the intensified winds extend over northern continental Europe. A strong negative anomaly devel-ops around Iceland, as a result of the meridional shift in the jet exit region. At lag �2 the jet is almost fullyzonalized and the exit region is over northern France. During the destructive event, the jet extends into east-ern Europe, and the positive anomaly over continental Europe peaks. This eastward extension agrees verywell with the wind pattern seen in HC12. The tripolar anomaly pattern which appears around lag �4 retainsthe same structure but is shifted farther east, following the intensified background flow. The more zonalconfiguration associated with the destructive events is also observed in sea level pressure composites (notshown) and is reflected in the JAI. The windstorms are found to correspond to a very zonal jet (12.3° at200–400 hPa) with a higher than average speed (Table 3). The values in the table represent an average overthe 12 h preceding and following the destructive event, for a total of five time steps. This matches the periodover which the jet attains its maximum zonality (Figure 7b). With the exception of eastern DWB, the destruc-tive events composite is the one that displays the lowest mean jet angle at both levels (Table 3). Moreover,the fact that the largest velocity anomalies extend over continental and into eastern Europe, outside thedomain of the JAI, actually leads the latter to overestimate the jet angle. The selected events thereforerepresent extreme cases not only in terms of their impacts on the continent, which is implicit in our selectionmethodology, but also in terms of the zonality and intensity of the large-scale atmospheric flow.
To further confirm the robustness of our analysis, the above calculations were repeated by considering thetop 50 days ranked by domain-wide destructiveness (see section 2.4). Both the orientation of the jet andthe velocity anomaly patterns (Figure S7) were found to be qualitatively similar. A minor difference is thatthe velocity anomalies on the day of peak destructiveness yield even lower JAI values (mean and medianangles at upper levels below 10°).
Journal of Geophysical Research: Atmospheres 10.1002/2015JD023854
MESSORI AND CABALLERO DOUBLE ROSSBY WAVE BREAKING 11,141

6.2. The Relationship With DWB
A comparison of the upper level wind anomalies in Figures 5c (EWB) and 7d (destructive events) highlights avery similar tripolar anomaly pattern over Europe, with a strengthening of the jet over the continent and aweakening of the flow to the north and south. However, it should be noted that the windstorm compositepresents a more marked eastward shift of the jet stream’s core and stronger positive anomalies over the con-tinent. Figure 8a displays the composite of absolute vorticity for destructive days, which further confirms thelink with EWB. A very marked large-scale anticyclonic breaking is seen in the southeastern Atlantic, while aweaker cyclonic inversion occurs over Iceland. Note that the absolute vorticity field has been filtered asdescribed in section 2.2.
None of the other WB composites show a similar wind anomaly structure. In fact, WWB (Figure 5b) actuallydisplays a tripolar anomaly pattern of the opposite sign. These considerations are in good agreement withthe results of the jet stream analysis presented in section 5. EWB results in an extremely zonal jet, which
Figure 7. Same as Figure 5 but for destructive events with lags of: (a) �6, (b) �4, (c) �2, and (d) 0 days.
Journal of Geophysical Research: Atmospheres 10.1002/2015JD023854
MESSORI AND CABALLERO DOUBLE ROSSBY WAVE BREAKING 11,142

matches the low JAI values found for the windstorm days. WWB, on the other hand, is the DWB configurationwith the largest jet tilts. Furthermore, both EWB and the destructive days are associated with a significantlyintensified jet.
In order to test this link more systematically, we verify whether eastern DWB increases the likelihood of theoccurrence of a destructive day above climatological values. For comparison, we also examine the effectsof conditioning on the positive NAO or on other DWB classes. To test the robustness of the results, we adoptdifferent definitions of destructive days as discussed in section 2.4. Following the analysis in section 5, a DWBevent is considered to overlap a destructive day if such a day occurs in any of the 3 days following the DWB.To provide a suitable comparison, the wintertime climatology is expressed both as the fraction of winter daysdisplaying a destructive event and as the fraction of 3 day intervals including at least one destructive event.Values for the different WB scenarios should be compared to the 3 day climatology, while the positive NAOphases should be compared to the single-day climatology.
For the single-day (3 day) wintertime climatology, between 6.1% (13.5%) and 12.3% (24.2%) of days qualify asdestructive, depending on the chosen threshold (Table 4). The positive NAO significantly increases the fre-quency of destructive days for all thresholds. Even though the jet stream is typically more tilted, positiveNAO phases correspond tomore frequent, more intense Atlantic storms, and it is therefore not surprising thatsome of these storms may lead to strong surface winds over the continent. DWB taken as a whole does notincrease the likelihood of a destructive day relative to the wintertime climatology. As could be surmised from
Figure 8. Minus 2 days time lag composites of 250 hPa absolute vorticity (s�1) for destructive days in (a) the ERA-Interimreanalysis data and (b) the MPI-ESM-P model. The black contours show net values (starting from 0.1 × 10�4 s�1, interval0.1 × 10�4 s�1). (c) Difference between the ERA-Interim and MPI-ESM-P values. The white contours bound anomaliesexceeding the 95% confidence level derived from a random Monte Carlo sampling procedure. The data range for thereanalysis is the same as in Figure 2. The model data cover 50 DJFs. The vorticity field is truncated at T15.
Journal of Geophysical Research: Atmospheres 10.1002/2015JD023854
MESSORI AND CABALLERO DOUBLE ROSSBY WAVE BREAKING 11,143

the upper level wind composites discussed in section 5, WWB actually decreases the likelihood of destructiveweather over the continent, almost halving the frequencies to between 7.7% and 13.1% of winter 3 dayperiods. EWB, on the other hand, displays the most frequent destructive days over Europe, with values signif-icantly higher than those of both the wintertime climatology and the other DWB cases. When themost severedestructive events are considered (30% column in Table 4), EWB almost doubles the climatological frequency.The fractional increase in destructive event frequency due to EWB is systematically larger than that associatedwith the positive NAO. There is relatively little overlap between the two sets, since only 15% of EWB instancescorrespond to an NAOI> 1. If only moderate or negative NAO phases are considered, the difference indestructive day frequency between EWB and the climatology is further enhanced (not shown). The contrast-ing effects of EWB and WWB can partly explain the weak impact DWB as a whole has on the frequency ofdestructive events. A note should be made regarding the misaligned DWB. The MA WWB case systematicallydisplays the second highest values in the table, following eastern DWB. Unfortunately, it is difficult to relatethis to the results of the JAI analysis, due to the limited statistical significance of the MA WWB results.
So far, we have tested whether the days immediately following the occurrence of DWB display destructiveevents. Next, we verify the inverse link, namely, how often destructive events are preceded by DWB. Thevalues in Table 4 imply that, given our definition of destructive days, most of them will not be preceded bya DWB. Indeed, there are approximately 12 DWB events and eight or nine destructive days every winter. Ifonly ~20% of the DWBs precede a destructive day, this corresponds to no more than two to three destructivedays per winter (or around 75 over the whole time series considered). The same reasoning holds for EWB,which best matches destructive days.
A further test can be performed by applying a more restrictive definition of destructive event, namely, the 50most destructive days in the full time series. These could in theory all be preceded by a DWB event, in view ofthe fact that around 75 destructive days are preceded by DWB over the whole time series. In reality, it is foundthat only 13 (20 if DWB is defined using the relaxed temporal overlap criterion) of the top 50 days arepreceded by a DWB; of these, 5 (6) correspond to an eastern DWB. If only the 25 most destructive days areconsidered, similar results are found: 6 (10) match DWB and 3 (3) match EWB.
6.3. A Comparison With Model Simulations
Previous studies on DWB have mainly focused on reanalysis data [e.g., HC12; Gómara et al., 2014a; Pinto et al.,2014], and it is unclear how well models can capture the link between this specific large-scale wave patternand surface wind extremes. Here we present a brief comparison of the above reanalysis results with theoutput from the MPI-ESM-P model (see section 2.1). The model was selected because it reproduces closelythe DWB frequencies seen in the ERA-Interim data (see supporting information). As is the case in manymodels, the jet stream is climatologically more zonal than in the reanalysis (Figure S6c), with a mean winter-time tilt of 12.8° at upper levels.
Table 4. Frequency of Destructive Days Over Continental Europe as a Fraction of Total Number of Daysa
Destructive Days
Definition 10% 20% 30%
(i) Wint. Clim. Single 12.3% 9.5% 6.1%3 day 24.2% 19.7% 13.5%
(ii) NAO+ 16.6% 13.7% 9.0%(iii) DWB Clim. (22.2%) (18.8)% (14.2%)(iv) WWB 13.1% 9.3% 7.7%(v) NAO+/DWB (27.4)% (24.2)% (17.9%)(vi) EWB 34.6% 33.3% 25.9%(vii) MA DWB WWB (28.7%) 27.1% 19.7%
EWB (19.8%) 13.5% (11.7%)
aA destructive day is one in which more than X% of the domain’s grid boxes display a nonzero destructiveness, whereX is either 10, 20, or 30. The values shown correspond to (i) the DJF climatology, both for single days and 3 day intervals;(ii) positive NAO phases; (iii) all DWB events; (iv) DWB events occurring during a positive NAO phase; DWB events occur-ring in the (iv) western and (v) eastern portions of the North Atlantic; (vii) misaligned DWB events. Case (vii) is further splitdepending on the location of the AWBs. The values in brackets are not statistically different from the wintertime clima-tology at the 95% confidence level. Note that the values for DWBs occurring during a positive NAO phase were tested forstatistical significance relative to the positive NAO-only value, as opposed to the wintertime climatology.
Journal of Geophysical Research: Atmospheres 10.1002/2015JD023854
MESSORI AND CABALLERO DOUBLE ROSSBY WAVE BREAKING 11,144

Figures 9a and 9b display the upper level wind and wind anomaly composites associated with destructiveevents and EWB, respectively, in the MPI model. The destructive events bear some qualitative similarity tothe reanalysis results (Figure 7d), but the modeled anomalies are weaker than those in the reanalysis, asdiscussed further in section 7. For the EWB, both the anomaly pattern and the zonalizing effect of EWB (whichreduces the jet’s tilt from 12.8° to 9.4°) are qualitatively similar to the reanalysis, but again with weakeramplitudes. This is consistent with the comparison of absolute vorticity composites over destructive days,illustrated in Figures 8a (reanalysis), 8b (model), and 8c (reanalysis-model). The model successfully capturesthe large-scale anticyclonic breaking in the southeastern Atlantic, albeit with significantly higher vorticityvalues in the overturning tongue, while it struggles to reproduce the weaker cyclonic inversion in thenorthern part of the domain. The resulting meridional gradient inversions are thus much weaker than inthe reanalysis.
The difficulties of the model in reproducing the ERA-Interim results are mirrored by the lack of a statisticallysignificant link between EWB and destructive days. The climatological frequency of destructive days over3 day intervals in the model is 17.3%, very close to the 19.7% found in the reanalysis. The EWB case, however,corresponds to a decreased frequency of destructive days (14.2%), and none of the other DWB cases consid-ered here correspond to a statistically significant frequency increase relative to the wintertime climatology.
7. Discussions
The role of DWB in affecting the jet stream is consistent with a simple PV view of the circulation, whereby thesharpened meridional PV gradient is instrumental in determining the location and strength of the jet. Thefact that EWB intensifies and zonalizes the jet, while WWB presents a similar tilt to the wintertime climatology,can be largely explained by a geographical argument. If DWB occurs near the jet entry region in the westernpart of the Atlantic basin (WWB), the effect on the direction of the jet will be weak, because no constraints arein place in the exit region farther to the East. EWB, on the contrary, will place a stronger dynamical constrainton the jet’s bearing, since the two wave breakings will effectively determine the location of the jet exit region.The sharpened PV gradient will also act to intensify the zonal flow over continental Europe. Previous studieshave indeed found that DWB in the eastern part of the Atlantic basin is effective in constraining the jet’s lati-tude [Pinto et al., 2014]. The location of the sharpened gradient over the eastern North Atlantic is typically
Figure 9. Composites of the 250 hPa horizontal wind speed (m s�1) for (a) destructive events, 0 days time lag and (b) EWBevents, +2 days time lag. Shadings show anomalies relative to the DJF climatology; black contours show net values (startingfrom 15m s�1, interval 7.5m s�1). Only anomalies exceeding the 95% confidence level derived from a random MonteCarlo sampling procedure are shown. The data cover 50 DJFs from the MPI-ESM-P model.
Journal of Geophysical Research: Atmospheres 10.1002/2015JD023854
MESSORI AND CABALLERO DOUBLE ROSSBY WAVE BREAKING 11,145

farther south than the climatological location of the jet, thus reducing its tilt. The reduction in tilt is associatedwith a small, yet significant, meridional shift of the jet. The average latitude of the low-level jet for EWB is46.4°, compared to a climatological position of 48.2° N. This shift compounds the zonalizing effect to bringthe jet exit region over Europe. This is again broadly consistent with Pinto et al. [2014] who found thatDWB events drive a moderate southward shift of the JLI distribution at low levels. One should, however, notethat the domains chosen in the two papers, and hence the resulting JLI distributions, are different. Other stu-dies have identified distinct preferred meridional locations of the jet, which are typically separated by 10° lati-tude or more [Woollings et al., 2010]. An analysis of the distribution of jet latitudes obtained from the JLIconfirms that the jet ranges over a wide latitudinal band and that none of the selected WB configurationssystematically corresponds to either of the tails of the JLI distribution. It should finally be noted that thechoice to focus on a domain excluding the Caribbean region has the advantage of giving more weight tothe behavior of the jet toward Europe, our region of interest for destructive windstorms, but will largely over-look changes in the location of the jet entry region and thus presumably underestimate the impact of WWB.
The zonalization and intensification of the jet associated with EWB is conducive to the occurrence of destruc-tive windstorms over Europe, by favoring the explosive intensification of storms [Rivière and Joly, 2006] andsteering Atlantic weather systems toward the continent. Statistically, EWB corresponds to a 43–92% increasein the frequency of destructive days over the continent, depending on the exact definition of the latter. Thepositive NAO phases also correspond to significantly higher than normal rates of destructive days over thecontinent, but the fractional increase is systematically lower than that found for the EWB (Table 4). In additionto this, the destructive events project weakly onto the positive NAO. These findings suggest that EWB is abetter statistical precursor to destructive European windstorm events than the NAOI. Studies focusing onexplosive cyclones in the North Atlantic have found that these are favored by positive NAO phases [Gómaraet al., 2014b]. The positive NAO, however, typically corresponds to a more tilted jet stream, which steersthe weather systems away from continental Europe.
The destructive events systematically display an anomalously intense jet, suggesting that in many cases addi-tional mechanisms for strengthening the jet must be at play. The JAI analysis shows that, while the positiveNAO increases the average jet tilt, there is a large variability and a small part of the positive NAO cases displayan extremely zonal jet. Positive NAO phases with a zonal jet orientation could therefore provide very favor-able conditions for destructive days over Europe. Interestingly, DWBwas found not to zonalize the jet if occur-ring during a positive NAO phase. This suggests that positive NAO/zonal jet events are possible candidatesfor the many destructive days not associated with a DWB.
Contrary to the above, WWB roughly halves the frequency of destructive windstorms over Europe. Previousanalyses have linked WWB with a statistically significant increase in the development of explosive cyclones[Gómara et al., 2014a]. However, WWB weakens the jet stream over Europe, thus reducing the likelihood thatsuch storms result in destructive events. The vorticity anomalies associated with WWB (not shown) suggestthat the latter might suppress anticyclonic wave activity in the eastern North Atlantic and are consistent witha reduced westerly flow over continental Europe. An alternative interpretation is that a selection of WWBevents will, by construction, exclude days when there is a large-scale WB in the eastern North Atlantic, unlessa separate WB event is also found farther west. The full wintertime climatology, on the opposite, will includeall EWB instances. A composite over WWB events is therefore likely to display a weaker wave activity in theeastern portion of the basin. The contrasting dynamical and statistical roles of EWB and WWB help to explainwhy DWB events as a whole display a weak link to destructive events over Europe.
The MPI model fails to capture the statistical relationship between EWB and windstorms. The jet in the modelis climatologically more zonal than in the reanalysis, such that on average the jet exit region is located overthe UK and France (Figure S6c). Therefore, an eastward extension of the jet over Europe does not require astrong zonalization of the flow, and the climatological jet is already well positioned to bring stormy weatherover the continent. This weakens the dynamical link between destructive events and EWB; in fact, while EWBdoes further strengthen and zonalize the jet, this does not lead to an increase in destructive winds over con-tinental Europe. The more zonal climatological jet also partly explains why the velocity anomalies for destruc-tive events in the model are weaker than in the reanalysis. In the model the location of the jet on these dayscorresponds to the climatological jet exit region, which is already characterized by a strong zonal flow. This isnot true of the reanalysis, where the jet instead shifts to a region which experiences a weak climatological
Journal of Geophysical Research: Atmospheres 10.1002/2015JD023854
MESSORI AND CABALLERO DOUBLE ROSSBY WAVE BREAKING 11,146

westerly flow. Many models struggle to fully capture the tilt of the Atlantic circulation, although the morerecent simulations show some improvement [e.g., Zappa et al., 2013]. The lack of correspondence betweenEWB and destructive days could therefore not be limited to the MPI-ESM model but might instead be a com-mon dynamical shortcoming of climate simulations.
The above discussion highlights the complex role played by DWB in affecting the large-scale circulationof the Euro-Atlantic sector. In view of this, one might naively expect DWB to have a strong connection withthe leading mode of climate variability in the region, namely, the NAO. The NAO has been repeatedly inves-tigated as a major driver of both Atlantic storminess and jet stream anomalies [e.g.,Woollings and Blackburn,2012; Pinto and Raible, 2012; Gómara et al., 2014b]. It has also been interpreted as the outcome of specific WBconfigurations [e.g., Benedict et al., 2004; Franzke et al., 2004; Riviere and Orlanski, 2007; Strong andMagnusdottir, 2008a, 2008b; Kunz et al., 2009; Drouard et al., 2013], and WB frequency over localized regionsof the North Atlantic has been found to account for a very high fraction of both the interannual and intra-seasonal NAOI variability [Strong and Magnusdottir, 2008a]. A strong projection onto the NAO requires theSLP anomalies associated with the WB to be positioned close to the NAO pressure centers. A priori one mightassume that DWB events will have a stronger footprint on the NAO than isolated AWBs or CWBs, due to thesum of the SLP anomalies associated with each individual breaking. Contrary to expectations, we find thatDWB events have a weak projection onto the NAO, regardless of their geographical location. DWB thereforehas significant impacts on the circulation of the Euro-Atlantic sector, but at the same time a feeble connectionto the NAO. This implies that DWB can be regarded as a largely independent predictor of destructive Europeanwindstorms relative to the NAO.
The present study has also tested the ability of the automated RWB detection algorithm described in Barnesand Hartmann [2012] to identify DWB. Previous studies have found a very strong correspondence betweenintense Atlantic storms and DWB: 22 out of the 25 most destructive storms affecting continental Europe dur-ing 1958–2001 in HC12 and 48% of intense clustered cyclone days in Pinto et al. [2014]. Our results show aweaker statistical link; destructive days are not systematically preceded by DWB events, with only 5 of the50most destructive windstorms over Europe being preceded by EWB. We ascribe these discrepancies primar-ily to the different techniques used to defineWB (a visual evaluation in HC12; an algorithm based on potentialtemperature on the 2 potential vorticity unit surface (Θ2PV) in Pinto et al. [2014]), the different geographicalconstraints placed on DWB and the different sets of Atlantic storms/destructive events considered.
The detection algorithm we adopt here applies a spectral smoothing to the absolute vorticity field andenforces a minimum longitudinal extent of the overturning regions prior to identifying the wave-breakingevents. Similar smoothing procedures are implemented in other wave-breaking detection algorithms [e.g.,Postel and Hitchman, 1999;Masato et al., 2012] to reduce the noise in the unfiltered fields. Even though a par-ticular day might present an area of disturbed vorticity, it is not always sufficiently prominent to be classifiedas a full-scale WB after the smoothing. This ensures that only large-scale, intense events are selected, whichare presumably those that will have a stronger influence on the atmospheric flow over the North Atlantic.However, it will also result in lower detection rates of high-latitude CWB, which is typically shallower thanthe AWB occurring in the southern part of the domain. The chosen smoothing and scale parameters mediatebetween these two competing considerations.
To illustrate the difficulty in unequivocally identifying large-scale wave-breaking events, we compare thesmoothed absolute vorticity field used by the algorithm to a different field commonly used to detect RWB:Θ2PV. A cyclonic (anticyclonic) WB will correspond to a tongue of anomalously low (high) Θ2PV or high (low)absolute vorticity, leading to a large-scale reversal of the respective meridional gradients—namely, a positiveΘ2PV gradient and a negative absolute vorticity gradient. Figure 10 displays the Θ2PV and absolute vorticityfields for two destructive windstorms. The wave-breaking regions are marked by boxes. Figures 10a and 10cshow the archetypal DWB destructive event, with both the AWB and CWB presenting strong, large-scaleΘ2PV and absolute vorticity gradient inversions over the North Atlantic basin. Figures 10b and 10d, on thecontrary, illustrate a typical weak CWB case. Figure 10b displays a narrow cyclonic inversion of the meridionalvorticity gradient to the east of Greenland, but the penetration of the subpolar air mass is relatively shallow.A second inversion is seen over Scandinavia. The truncated absolute vorticity field only captures an elongatedzonal vorticity anomaly, but smooths out the clear overturning structures seen in theΘ2PV field. In the detectioncode, neither of these features is therefore identified as a cyclonic wave breaking.
Journal of Geophysical Research: Atmospheres 10.1002/2015JD023854
MESSORI AND CABALLERO DOUBLE ROSSBY WAVE BREAKING 11,147

The algorithm therefore primarily identifies WB resulting in intense gradient reversals and may provide alower bound on the number of DWB events compared to alternative metrics. In terms of the results discussedin section 6, a larger number of DWB events would naturally lead to an increase in the number of destructiveevents preceded by DWB. However, it would not necessarily result in an increase in the fraction of DWBevents followed by destructive occurrences. In fact, weaker PV gradient inversions will presumably have aweaker effect on the large-scale circulation. The algorithm is therefore well suited to our analysis, and thereis no reason to expect the “missing” DWB events to have a closer relationship to destructive weather overEurope than the detected DWB.
8. Conclusions
We have studied the general relation between the large-scale flow and double Rossby wave breaking overthe North Atlantic. Double wave breaking is defined as the occurrence of simultaneous cyclonic and anticy-clonic wave breaking, with the former to the north of the climatological jet stream and the latter to the south.In the ERA-Interim reanalysis, this is a relatively common phenomenon, occurring approximately every7.5 days during the winter months (DJF). We adopted an objective detection method to diagnose both theoccurrence and cyclonicity of the wave breaking (section 2.2) and further applied automated algorithms todefine the bearing (Jet Angle Index, JAI) and meridional position (Jet Latitude Index, JLI, section 2.3) of theNorth Atlantic jet stream. The analysis focused on the following three points:
The interplay between DWB and the phase of the NAO. The present paper finds that DWB events as a whole donot preferentially project onto any particular phase of the NAO. To verify that the weak projection is not anartifice of the broad domain over which DWB is defined, the analysis is repeated over smaller geographicaldomains, designed to optimize the alignment of the WBs’ SLP anomalies with the NAO’s pressure centers.The DWB events within these restricted domains have statistically significant, albeit weak, projections onboth phases of the NAO. We therefore conclude that DWB events driving well-aligned SLP anomalies arerelatively rare and that DWB events as a whole do not constitute a good dynamical precursor to the NAO.As discussed in section 7 above, this is perhaps surprising in view of the link between individual WB eventsand the NAO and in light of the link between DWB, the jet stream, and storminess over Europe.
The impact of DWB on the jet stream. The North Atlantic jet stream is characterized by a climatologicalsouthwest to northeast tilt. The DWB pattern has a zonalizing effect on the jet, reducing its tilt relative tothe wintertime climatology. On the other hand, the tilt is typically enhanced during positive NAO phases.
Figure 10. ERA-InterimΘ2PV (K) and 250 hPa absolute vorticity (s�1) for (a, c) a destructive event for which DWB is detected;(b, d) a destructive event for which only AWB is detected. The boxes mark the locations of inversions in the climatologicalmeridional gradients. The white contours show net Θ2PV values (starting from 280 K, interval 10 K). The black contours shownet absolute vorticity values (starting from 0.4 × 10�4 s�1, interval 0.4 × 10�4 s�1). The vorticity field is truncated at T15.
Journal of Geophysical Research: Atmospheres 10.1002/2015JD023854
MESSORI AND CABALLERO DOUBLE ROSSBY WAVE BREAKING 11,148

As a result, DWB events which coincide with a positive NAO show no systematic change in the mean jet tilt.Further analysis reveals that DWB over the Eastern Atlantic and Europe leads to a strong zonalization and amoderate intensification of the jet, while DWB occurring farther west has a smaller effect on jet tilt andweakens the westerly flow over the continent. The influence of DWB on jet tilt therefore largely dependson the former’s geographical location, while the concomitant presence of a strong positive NAO phase seemsto overshadow the breakings’ zonalizing effect.
Concerning the jet’s meridional position, DWB generally displaces the jet to the south of its climatologicalposition, although the shifts found in this study for the various WB configurations are small. The upper leveljet ranges between 46.5° and 47.8°N for the different DWB cases, compared to a climatological position of48.6°N. In the case of EWB, this small meridional shift compounds the zonalization of the jet to bring thejet exit region over Europe.
The statistical relationship between DWB and surface wind extremes over Europe. Windstorms are a significantsource of both social and economic damage inWestern Europe [Berz, 2005]. The present study extends previousanalyses by using objective algorithms to detect DWB and define destructive windstorms and presents a moresystematic overview of the link between the two. Destructive weather affecting Europe coincides with a zonal,intense jet stream. DWB occurring in the eastern portion of the Atlantic basin zonalizes and intensifies thecirculation of the Euro-Atlantic sector, closely reproducing a “storm-like” large-scale pattern and resulting in a43–92% increase in the frequency of destructive days over the continent. This increase is larger than that ascribedto the NAO, suggesting that EWB is a better predictor for destructive events over Europe. Nonetheless, there isno one-to-one match between EWB and destructive windstorms, implying that it is neither a necessary nor asufficient condition for their occurrence. In contrast to this, DWB in the western North Atlantic decreases the like-lihood of destructive days over the continent by 43–53%. As for the jet stream, the relationship between DWBand destructiveness is therefore complex and strongly dependent on the geographical location of the former.
We further find that the MPI-ESM model partly captures the large-scale zonal flow anomalies driven by EWBbut does not reproduce the statistical link between EWB and destructive days over Europe. This is linked tothe failure of the model to reproduce the climatological wintertime tilt of the Atlantic circulation. Since thisbias is common to many models, the lack of correspondence between EWB and destructive events mightbe a common dynamical shortcoming in climate simulations.
The DWB analysis presented here is phenomenological and focuses on the impact of DWB on the large-scaleflow, while it does not attempt to determine the dynamical origin of the different DWB patterns. There is there-fore ample scope for future investigation. A first, promising path would be to focus on an idealized modelingapproach, along the lines of Franzke et al. [2004] andmore recentlyDrouard et al. [2013]. Open questions whichcould be addressed by such studies include the following: verifying whether the high-latitude CWB is facilitatedby poleward propagating wave activity triggered by the large-scale AWB and verifying whether any otherupstream dynamical precursors differentiate the zonalized and tilted jet cases. Answering the latter questionis particularly relevant for the development of an early warning framework for the specific large-scale condi-tions which favor destructive windstorms over continental Europe. In this context, it could be interesting toexplore the link between the DWB pattern and the zonal circulation associated with the storms and the persis-tent jet regimes described in Franzke et al. [2011], which show a degree of predictability.
A second natural development of the present study would involve applying the same tools and analysis tolongmodel runs, such as the multicentennial CMIP5 control simulations. These runs could provide the oppor-tunity to study the long-term variability of DWB and destructive storm occurrences and could also be used tofurther test the ability of simulations to correctly reproduce the complex links between DWB, jet stream tiltand location, and windstorms. The brief analysis presented here suggests that models might struggle toreproduce some of these links, warranting a more systematic and thorough study of the issue.
ReferencesBarnes, E. A., and D. L. Hartmann (2012), Detection of Rossby wave breaking and its response to shifts of the midlatitude jet with climate
change, J. Geophys. Res., 117, D09117, doi:10.1029/2012JD017469.Benedict, J. J., S. Lee, and S. B. Feldstein (2004), Synoptic view of the North Atlantic Oscillation, J. Atmos. Sci., 61, 121–144, doi:10.1175/
1520-0469(2004)061<0121:SVOTNA>2.0.CO;2.Berz, G. (2005), Windstorm and storm surges in Europe: Loss trends and possible counter-actions from the viewpoint of an international
reinsurer, Philos. Trans. R. Soc. A, 363, 1431–1440.
Journal of Geophysical Research: Atmospheres 10.1002/2015JD023854
MESSORI AND CABALLERO DOUBLE ROSSBY WAVE BREAKING 11,149
AcknowledgmentsERA-Interim reanalysis data are freelyavailable from the ECMWF at http://apps.ecmwf.int/datasets/. The MPI-ESM-P data are available upon request fromthe corresponding author. G. Messorihas been funded by the SwedishVetenskapsrådet, as part of the MILEXproject. We are grateful to E. A. Barnes forproviding the wave-breaking detectioncode and to J. H. Jungclaus for providingthe MPI-ESM-P data. We would also liketo thank M. Löfverström for his helpin describing the dynamical effect ofdouble wave breaking.

Donat, M. G., G. C. Leckebusch, J. G. Pinto, and U. Ulbrich (2010), European storminess and associated circulation weather types: Futurechanges deduced from a multi-model ensemble of GCM simulations, Clim. Res., 42(1), 27–43.
Drouard, M., G. Rivière, and P. Arbogast (2013), The North Atlantic Oscillation response to large-scale atmospheric anomalies in theNortheastern Pacific, J. Atmos. Sci., 70, 2854–2874, doi:10.1175/JAS-D-12-0351.1.
Franzke, C., S. Lee, and S. B. Feldstein (2004), Is the North Atlantic Oscillation a Breaking Wave?, J. Atmos. Sci., 61, 145–160, doi:10.1175/1520-0469(2004)061<0145:ITNAOA>2.0.CO;2.
Franzke, C., T. J. Woollings, and O. Martius (2011), Persistent circulation regimes and preferred regime transitions in the North Atlantic,J. Atmos. Sci., 68, 2809–2825, doi:10.1175/JAS-D-11-046.1.
Gómara, I., J. G. Pinto, T. Woollings, G. Masato, P. Zurita-Gotor, and B. Rodríguez-Fonseca (2014a), Rossby wave-breaking analysis of explosivecyclones in the Euro-Atlantic sector, Q. J. R. Meteorol. Soc., 140, 738–753, doi:10.1002/qj.2190.
Gómara, I., B. Rodríguez-Fonseca, P. Zurita-Gotor, and J. G. Pinto (2014b), On the relation between explosive cyclones affecting Europe andthe North Atlantic Oscillation, Geophys. Res. Lett., 41, 2182–2190, doi:10.1002/2014GL059647.
Hanley, J., and R. Caballero (2012), The role of large-scale atmospheric flow and Rossby wave breaking in the evolution of extremewindstorms over Europe, Geophys. Res. Lett., 39, L21708, doi:10.1029/2012GL053408.
Hannachi, A., E. A. Barnes, and T. Woollings (2013), Behaviour of the winter North Atlantic eddy-driven jet stream in the CMIP3 integrations,Clim. Dyn., 41(3–4), 995–1007.
Homeyer, C. R., and K. P. Bowman (2013), Rossby wave breaking and transport between the tropics and extratropics above the subtropicaljet, J. Atmos. Sci., 70(2), 607–626.
Hoskins, B. J., M. E. McIntyre, and A. W. Robertson (1985), On the use and significance of isentropic potential vorticity maps, Q. J. R. Meteorol.Soc., 111(470), 877–946.
Jungclaus, J. H., N. Fischer, H. Haak, K. Lohmann, J. Marotzke, D. Matei, U. Mikolajewicz, D. Notz, and J. S. von Storch (2013), Characteristics ofthe ocean simulations in the Max Planck Institute Ocean Model (MPIOM) the ocean component of the MPI-Earth system model, J. Adv.Model Earth Syst., 5, 422–446, doi:10.1002/jame.20023.
Jungclaus, J. H., K. Lohmann, and D. Zanchettin (2014), Enhanced 20th-century heat transfer to the Arctic simulated in the context of climatevariations over the last millennium, Clim. Past, 10, 2201–2213, doi:10.5194/cp-10-2201-2014.
Klawa, M., and U. Ulbrich (2003), A model for the estimation of storm losses and the identification of severe winter storms in Germany,Nat. Hazards Earth Syst. Sci., 3, 725–732.
Kunz, T., K. Fraedrich, and F. Lunkeit (2009), Synoptic scale wave breaking and its potential to drive NAO-like circulation dipoles: A simplifiedGCM approach, Q. J. R. Meteorol. Soc., 135(638), 1–19.
Leckebusch, G. C., A. Weimer, J. G. Pinto, M. Reyers, and P. Speth (2008), Extreme wind storms over Europe in present and future climate:A cluster analysis approach, Meteorol. Z., 17(1), 67–82.
Marsland, S. J., H. Haak, J. H. Jungclaus, M. Latif, and F. Roeske (2003), The Max-Planck-Institute global ocean/sea-ice model with orthogonalcurvilinear coordinates, Ocean Model., 5, 91–127.
Masato, G., B. J. Hoskins, and T. J. Woollings (2012), Wave-breaking characteristics of midlatitude blocking, Q. J. R. Meteorol. Soc., 138,1285–1296, doi:10.1002/qj.990.
Pinto, J. G., and C. C. Raible (2012), Past and recent changes in the North Atlantic Oscillation, WIREs Clim. Change, 3, 79–90, doi:10.1002/wcc.150.
Pinto, J. G., M. K. Karremann, K. Born, P. M. Della-Marta, and M. Klawa (2012), Loss potentials associated with European windstorms underfuture climate conditions, Clim. Res., 54(1), 1–20.
Pinto, J. G., I. Gómara, G. Masato, H. F. Dacre, T. Woollings, and R. Caballero (2014), Large-scale dynamics associated with clustering ofextratropical cyclones affecting Western Europe, J. Geophys. Res. Atmos., 119, 13,704–13,719, doi:10.1002/2014JD022305.
Postel, G. A., and M. H. Hitchman (1999), A climatology of Rossby wave breaking along the subtropical tropopause, J. Atmos. Sci., 56(3),359–373.
Rivière, G., and A. Joly (2006), Role of the low-frequency deformation field on the explosive growth of extratropical cyclones at the jet exit.Part II: Baroclinic critical region, J. Atmos. Sci., 63, 1982–1995.
Riviere, G., and I. Orlanski (2007), Characteristics of the Atlantic storm-track eddy activity and its relation with the North Atlantic Oscillation,J. Atmos. Sci., 64, 241–266.
Simmons, A., S. Uppala, D. Dee, and S. Kobayashi (2006), ERA-Interim: New ECMWF reanalysis products from 1989 onwards, ECMWF Newslett.,110, 25–35.
Stevens, B., et al. (2013), Atmospheric component of the MPI-M Earth system model: Echam6, J. Adv. Model Earth Syst., 5, 146–172,doi:10.1002/jame.20015.
Strong, C., and G. Magnusdottir (2008a), Tropospheric Rossby wave breaking and the NAO/NAM, J. Atmos. Sci., 65, 2861–2876, doi:10.1175/2008JAS2632.1.
Strong, C., and G. Magnusdottir (2008b), How Rossby wave breaking over the Pacific forces the North Atlantic Oscillation, Geophys. Res. Lett.,35, L10706, doi:10.1029/2008GL033578.
Thorncroft, C. D., B. J. Hoskins, and M. E. McIntyre (1993), Two paradigms of baroclinic-wave life-cycle behaviour, Q. J. R. Meteorol. Soc., 119,17–55.
Woollings, T., and M. Blackburn (2012), The North Atlantic jet stream under Climate change and its relation to the NAO and EA patterns,J. Clim., 25, 886–902, doi:10.1175/JCLI-D-11-00087.1.
Woollings, T., and B. Hoskins (2008), Simultaneous Atlantic–Pacific blocking and the Northern Annular Mode, Q. J. R. Meteorol. Soc., 134,1635–1646, doi:10.1002/qj.310.
Woollings, T., A. Hannachi, and B. J. Hoskins (2010), Variability of the North Atlantic eddy-driven jet stream,Q. J. R. Meteorol. Soc., 136, 856–868,doi:10.1002/qj.625.
Woollings, T., C. Czuchnicki, and C. Franzke (2014), Twentieth century North Atlantic jet variability, Q. J. R. Meteorol. Soc., 140(680), 783–791.Zappa, G., L. C. Shaffrey, and K. I. Hodges (2013), The ability of CMIP5 models to simulate North Atlantic extratropical cyclones, J. Clim., 26,
5379–5396, doi:10.1175/JCLI-D-12-00501.1.
Journal of Geophysical Research: Atmospheres 10.1002/2015JD023854
MESSORI AND CABALLERO DOUBLE ROSSBY WAVE BREAKING 11,150


