Journal of Fluid Mechanics Spreading dynamics of ... - …josseran/papier/Guillaume.pdf · Journal...
12
Journal of Fluid Mechanics http://journals.cambridge.org/FLM Additional services for Journal of Fluid Mechanics: Email alerts: Click here Subscriptions: Click here Commercial reprints: Click here Terms of use : Click here Spreading dynamics of drop impacts Guillaume Lagubeau, Marco A. Fontelos, Christophe Josserand, Agnès Maurel, Vincent Pagneux and Philippe Petitjeans Journal of Fluid Mechanics / FirstView Article / October 2012, pp 1 11 DOI: 10.1017/jfm.2012.431, Published online: 01 October 2012 Link to this article: http://journals.cambridge.org/abstract_S0022112012004314 How to cite this article: Guillaume Lagubeau, Marco A. Fontelos, Christophe Josserand, Agnès Maurel, Vincent Pagneux and Philippe Petitjeans Spreading dynamics of drop impacts. Journal of Fluid Mechanics, Available on CJO 2012 doi:10.1017/jfm.2012.431 Request Permissions : Click here Downloaded from http://journals.cambridge.org/FLM, IP address: 134.157.34.15 on 31 Oct 2012
-
Upload
nguyenduong -
Category
Documents
-
view
224 -
download
1
Transcript of Journal of Fluid Mechanics Spreading dynamics of ... - …josseran/papier/Guillaume.pdf · Journal...
Journal of Fluid Mechanicshttp://journals.cambridge.org/FLM
Additional services for Journal of Fluid Mechanics:
Email alerts: Click hereSubscriptions: Click hereCommercial reprints: Click hereTerms of use : Click here
Spreading dynamics of drop impacts
Guillaume Lagubeau, Marco A. Fontelos, Christophe Josserand, Agnès Maurel, Vincent Pagneux and Philippe Petitjeans
Journal of Fluid Mechanics / FirstView Article / October 2012, pp 1 11DOI: 10.1017/jfm.2012.431, Published online: 01 October 2012
Link to this article: http://journals.cambridge.org/abstract_S0022112012004314
How to cite this article:Guillaume Lagubeau, Marco A. Fontelos, Christophe Josserand, Agnès Maurel, Vincent Pagneux and Philippe Petitjeans Spreading dynamics of drop impacts. Journal of Fluid Mechanics, Available on CJO 2012 doi:10.1017/jfm.2012.431
Request Permissions : Click here
Downloaded from http://journals.cambridge.org/FLM, IP address: 134.157.34.15 on 31 Oct 2012

J. Fluid Mech., page 1 of 11. c© Cambridge University Press 2012 1doi:10.1017/jfm.2012.431
Spreading dynamics of drop impacts
Guillaume Lagubeau1, Marco A. Fontelos2, Christophe Josserand3†,Agnès Maurel4, Vincent Pagneux1 and Philippe Petitjeans5
1 LAUM, UMR CNRS 6613, Avenue Olivier Messiaen, 72085 Le Mans CEDEX 9, France2 Instituto de Ciencias Matematicas, (ICMAT, CSIC-UAM-UC3M-UCM), C/ Serrano 123,
28006 Madrid, Spain3 Institut D’Alembert, CNRS & UPMC (Universite Paris 06), UMR 7190, case 162, 4 place Jussieu,
75005 Paris, France4 Institut Langevin, LOA, UMR CNRS 7587, ESPCI, 10 rue Vauquelin, 75005 Paris, France
5 PMMH, UMR CNRS 7636, ESPCI, 10 rue Vauquelin, 75005 Paris, France
(Received 6 June 2012; revised 8 August 2012; accepted 29 August 2012)
We present an experimental study of drop impact on a solid surface in thespreading regime with no splashing. Using the space–time-resolved Fourier transformprofilometry technique, we can follow the evolution of the drop shape during theimpact. We show that a self-similar dynamical regime drives the drop spreading untilthe growth of a viscous boundary layer from the substrate selects a residual minimalfilm thickness. Finally, we discuss the interplay between capillary and viscous effectsin the spreading dynamics, which suggests a pertinent impact parameter.
Key words: drops, drops and bubbles, interfacial flows (free surface)
1. IntroductionDrop impact is characteristic of multiphase flows (Rein 1993). It is present for
instance in atomization processes (Eggers & Villermaux 2008), raindrop dynamics(Planchon & Mouche 2010), inkjet printing (Zable 1977) and micro-fabrication(Antkowiak et al. 2011), but it also involves most of the key issues of surface flows(Peregrine 1981). Depending on the dynamical properties and whether the impactedsurface is a thin liquid film, a thick liquid film or a solid substrate, drop impactcan lead to prompt splashing, corona splashes or rapid spreading. In particular, forimpact on a liquid film or bath, prompt splashes are observed for high impact speeds(Worthington 1908; Yarin & Weiss 1995), while the splash is suppressed for lowerspeeds, leading to vortex ring and cavity formation for a deep pool (Rein 1996)and crater-like deformation for a thin liquid film (Deegan, Brunet & Eggers 2008;Lagubeau et al. 2010). When the drop impacts on a dry solid substrate, differentoutcomes are also possible (Rioboo, Marengo & Tropea 2001): again, at high speed,splashing is observed, and it has recently been shown that such a splash could besuppressed by decreasing the surrounding gas pressure (Xu, Zhang & Nagel 2005),indicating a genuine influence of the gas. On the other hand, at lower velocity, thedroplet shape exhibits strong deformation at the substrate contact (Renardy et al.2003); then the drop spreads on the solid up to a maximum radius and eventually
† Email address for correspondence: [email protected]
2 G. Lagubeau and others
retracts due to capillary forces. Depending on the wetting properties, the retractioncan lead to an equilibrium spherical cap, a rebound of the drop (Bartolo, Josserand &Bonn 2005) or even singular jets (Bartolo, Josserand & Bonn 2006).
In this paper, we consider a drop of diameter D = 2R0 that impacts at velocity V0
on a flat solid surface. Drop behaviour is determined by two dynamical dimensionlessnumbers, the Reynolds number (Re), which balances inertia with viscous effects, andthe Weber number (We), which balances inertia with capillary effects:
Re= DV0
νand We= ρDV2
0
γ, (1.1)
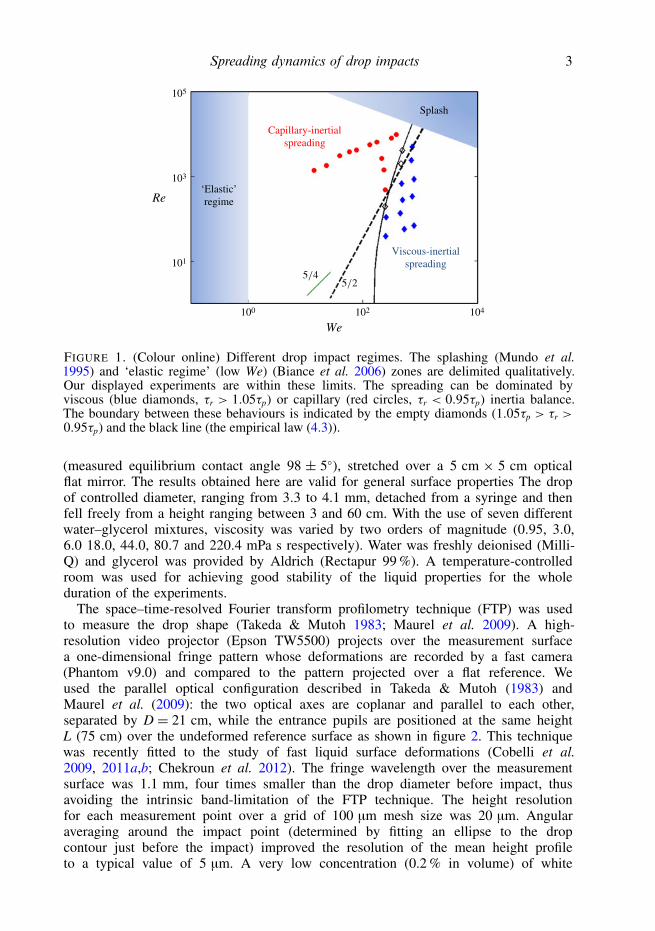
where ν, ρ and γ are the kinematic viscosity, the liquid density and the surfacetension coefficient respectively. The solid properties are only of marginal influence onthe spreading behaviour in the case of sufficiently high Weber number considered here(Clanet et al. 2004). The different regimes of impact dynamics are summarized infigure 1. Of particular interest is the spreading regime, where no splashing or jetting ispresent and where the surrounding gas can be neglected in the dynamics. This regimehas recently been investigated, and it has been shown that the drop spreads by forminga flat central area surrounded by a growing rim until the surface tension and/or theviscous forces finally stop this expansion (Clanet et al. 2004; Roisman 2009; Eggerset al. 2010; Schroll et al. 2010). The droplet relaxes to an equilibrium shape or toa partial/total rebound of the drop, depending on the wetting properties. For highvelocity, splashing is observed (Rioboo et al. 2001), while spreading is observed forsmaller velocities where capillary waves can make the drop bounce (Biance et al.2006), sometimes even leading to singular jets (Bartolo et al. 2006). A so-calledsplashing parameter K has been proposed to characterize the transition between thespreading (low K) and the splashing (high K) regime (Mundo, Sommerfeld & Tropea1995):
K =We√Re. (1.2)
In the spreading case, particular attention has been paid to the scaling of the maximumradial expansion where different regimes have been identified, depending on thebalance between inertia, capillarity and viscous forces (Roisman, Rioboo & Tropea2002; Clanet et al. 2004; Bartolo et al. 2005; Fedorchenko, Wang & Wang 2005). Animpact number P separating capillary-limited expansion (low P) from viscous-limitedexpansion (large P) has been defined. It can be written in the form P = WeReα,and we expect α < 0, in contrast to the splashing parameter K, since high P valuescorrespond to viscous-limited expansion. Nevertheless, since only intermediate valuesof impact number can be reached experimentally, in the capillary regime it has not yetbeen possible to discriminate between a model based on a capillary-selected pancakeexpansion Pw = WeRe−4/5 (Clanet et al. 2004) and one based on the surface energybalance Pe = WeRe−2/5 (Eggers et al. 2010). Finally, neither existing experimentsnor numerical simulations have been able to give a comprehensive scenario of thespreading dynamics. This is mainly due to a lack of precise interface measurementsexperimentally and the limitations of numerical simulations, for instance because ofthe difficulty of modelling the moving contact line.
2. Experimental setupWe studied the impact of a liquid drop on a flat hydrophobic surface, consisting
of Parafilm M, chosen for its low contact angle hysteresis and good hydrophobicity
Spreading dynamics of drop impacts 3
105
103
101
Re
We100 102 104
‘Elastic’regime
Capillary-inertialspreading
Viscous-inertialspreading
Splash
FIGURE 1. (Colour online) Different drop impact regimes. The splashing (Mundo et al.1995) and ‘elastic regime’ (low We) (Biance et al. 2006) zones are delimited qualitatively.Our displayed experiments are within these limits. The spreading can be dominated byviscous (blue diamonds, τr > 1.05τp) or capillary (red circles, τr < 0.95τp) inertia balance.The boundary between these behaviours is indicated by the empty diamonds (1.05τp > τr >0.95τp) and the black line (the empirical law (4.3)).
(measured equilibrium contact angle 98 ± 5), stretched over a 5 cm × 5 cm opticalflat mirror. The results obtained here are valid for general surface properties The dropof controlled diameter, ranging from 3.3 to 4.1 mm, detached from a syringe and thenfell freely from a height ranging between 3 and 60 cm. With the use of seven differentwater–glycerol mixtures, viscosity was varied by two orders of magnitude (0.95, 3.0,6.0 18.0, 44.0, 80.7 and 220.4 mPa s respectively). Water was freshly deionised (Milli-Q) and glycerol was provided by Aldrich (Rectapur 99 %). A temperature-controlledroom was used for achieving good stability of the liquid properties for the wholeduration of the experiments.
The space–time-resolved Fourier transform profilometry technique (FTP) was usedto measure the drop shape (Takeda & Mutoh 1983; Maurel et al. 2009). A high-resolution video projector (Epson TW5500) projects over the measurement surfacea one-dimensional fringe pattern whose deformations are recorded by a fast camera(Phantom v9.0) and compared to the pattern projected over a flat reference. Weused the parallel optical configuration described in Takeda & Mutoh (1983) andMaurel et al. (2009): the two optical axes are coplanar and parallel to each other,separated by D = 21 cm, while the entrance pupils are positioned at the same heightL (75 cm) over the undeformed reference surface as shown in figure 2. This techniquewas recently fitted to the study of fast liquid surface deformations (Cobelli et al.2009, 2011a,b; Chekroun et al. 2012). The fringe wavelength over the measurementsurface was 1.1 mm, four times smaller than the drop diameter before impact, thusavoiding the intrinsic band-limitation of the FTP technique. The height resolutionfor each measurement point over a grid of 100 µm mesh size was 20 µm. Angularaveraging around the impact point (determined by fitting an ellipse to the dropcontour just before the impact) improved the resolution of the mean height profileto a typical value of 5 µm. A very low concentration (0.2 % in volume) of white
4 G. Lagubeau and others
Cam
era
Video-
projector
2R0
V0
L
D
1.5
1.0
0.5
2 4 6 8
1.5
1.0
0.5
2 4 6
h (m
m)
2.0
02.0
0
h (m
m)
R (mm)8
(a) (b) (c)
(d )
0.1 0.2 0.3 0.4
h (mm)
0 0.5
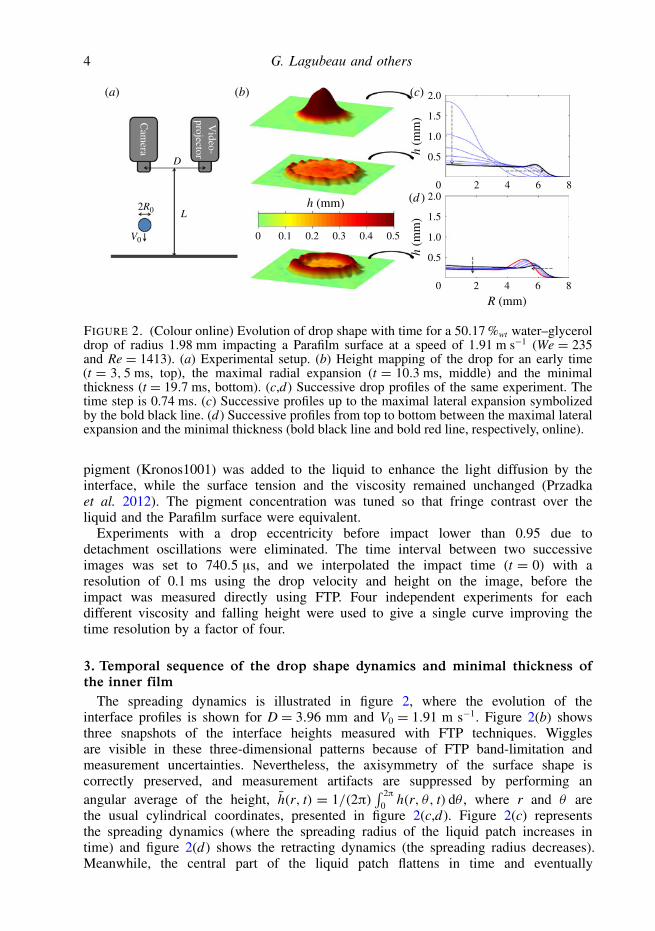
FIGURE 2. (Colour online) Evolution of drop shape with time for a 50.17 %wt water–glyceroldrop of radius 1.98 mm impacting a Parafilm surface at a speed of 1.91 m s−1 (We = 235and Re = 1413). (a) Experimental setup. (b) Height mapping of the drop for an early time(t = 3, 5 ms, top), the maximal radial expansion (t = 10.3 ms, middle) and the minimalthickness (t = 19.7 ms, bottom). (c,d) Successive drop profiles of the same experiment. Thetime step is 0.74 ms. (c) Successive profiles up to the maximal lateral expansion symbolizedby the bold black line. (d) Successive profiles from top to bottom between the maximal lateralexpansion and the minimal thickness (bold black line and bold red line, respectively, online).
pigment (Kronos1001) was added to the liquid to enhance the light diffusion by theinterface, while the surface tension and the viscosity remained unchanged (Przadkaet al. 2012). The pigment concentration was tuned so that fringe contrast over theliquid and the Parafilm surface were equivalent.
Experiments with a drop eccentricity before impact lower than 0.95 due todetachment oscillations were eliminated. The time interval between two successiveimages was set to 740.5 µs, and we interpolated the impact time (t = 0) with aresolution of 0.1 ms using the drop velocity and height on the image, before theimpact was measured directly using FTP. Four independent experiments for eachdifferent viscosity and falling height were used to give a single curve improving thetime resolution by a factor of four.
3. Temporal sequence of the drop shape dynamics and minimal thickness ofthe inner film
The spreading dynamics is illustrated in figure 2, where the evolution of theinterface profiles is shown for D = 3.96 mm and V0 = 1.91 m s−1. Figure 2(b) showsthree snapshots of the interface heights measured with FTP techniques. Wigglesare visible in these three-dimensional patterns because of FTP band-limitation andmeasurement uncertainties. Nevertheless, the axisymmetry of the surface shape iscorrectly preserved, and measurement artifacts are suppressed by performing anangular average of the height, h(r, t) = 1/(2π)
∫ 2π0 h(r, θ, t) dθ , where r and θ are
the usual cylindrical coordinates, presented in figure 2(c,d). Figure 2(c) representsthe spreading dynamics (where the spreading radius of the liquid patch increases intime) and figure 2(d) shows the retracting dynamics (the spreading radius decreases).Meanwhile, the central part of the liquid patch flattens in time and eventually

Spreading dynamics of drop impacts 5
0.75
0.50
0.25
1 2 3 4 5 6 7
2
1.00
0 8
1
3
FIGURE 3. (Colour online) Squares and left vertical axis: height hc of the top of the centralpoint of the drop surface as a function of time for We = 214 and Re = 2690. Circles andright vertical axis: radius of expansion R of the same drop. The solid line indicates the freefallregime. The red curve is the best fit of hc(t) = AD3/(V2
0 (t + t0)2) during the self-similar
regime and the black dash-dotted line corresponds to the plateau hp; τp (vertical dashed line)is the crossing time between the two latter regimes, and τr is the time of the maximal lateralexpansion with an error bar indicated by the black segment.
converges towards a constant film thickness hp (called the minimal film thickness lateron). Three distinct dynamical regimes of spreading can be identified in the detailedtime evolution of the film thickness at r = 0 (hc(t), shown in figure 3): the earlytime regime is a linear decrease corresponding to the freefall of the top of the drop.For large times, hc clearly tends to the constant hp. The transition between these tworegimes corresponds to an intermediate phase where the interface velocity decreases.Eventually, the drop retracts because of surface tension, a fourth dynamical regimethat is not considered here. For low Weber numbers (We < 40 while Re > 1000) noplateau is observed, since hc rebounds immediately after reaching its minimum value.These three regimes have in fact already been described theoretically and numerically(Roisman 2009; Eggers et al. 2010), and have the following features.Pressure impact. A strong pressure field is induced close to the impact region,
evidence of the deviation of the vertical velocity of the drop into a horizontalfield, similar to the pressure impulse observed in liquid impacts (Cooker & Peregrine1995). In this regime, the drop apex continues falling at the impact velocity V0 untilthe pressure impact reaches the top of the drop (approximately V0t = R0), in goodagreement with the linear decrease observed in figure 3.Self-similar inertial regime. The evolution of the drop can be modelled using a thin
film approximation, considering a potential flow matched with a boundary layer onthe solid surface. This theory shows that the drop shape h(r, t) exhibits a self-similarbehaviour followed by a viscous regime where the minimal thickness is limited bythe growth of the boundary layer. In order to keep the paper self-contained, werecall here the principal steps of these analytical works. After the impact and beforethe viscous-dominated regime, the flow inside the drop is described by a hyperbolic(potential) solution corresponding to a stagnation point induced by the impact, vr = r/tand vz = −2z/t, where vr and vz are the radial and vertical velocities. The time t can

6 G. Lagubeau and others
2.0
1.5
1.0
0.5
2 4 6
1.0
0.8
0.6
0.4
0.2
0 0.2 0.4 0.6 0.8 1.08
2.5
0 1.2
(a) (b)
FIGURE 4. (Colour online) (a) Series of drop profiles at times 1.14, 1.25, 1.34, 1.5, 1.52,1.62, 1.71 and 1.87 in the non-dimensionalized time unit for We = 255 and Re = 1470,each colour corresponding to one experiment. (b) Collapse of the same profiles using theself-similar variables h/hc and r
√hc/√Ω0, with hc the height of the centre of the drop and Ω0
its volume.
be replaced in this solution by t+ t0, where t0 accounts for the delay between the onsetof the impact with the self-similar regime (it is expected to be of the order of D/V0).The drop deforms while spreading on the surface, according to ∂th + vr∂rh = vz, andthis latter equation admits a self-similar generic solution:
h(r, t)= D3
V20 (t + t0)
2 H
(r
V0(t + t0)
). (3.1)
This self-similar behaviour is not expected to be valid at small times (a pressureimpact regime where hc decreases linearly) or large times (a viscous-dominant regimewith constant film thickness hp), but it is a good candidate for describing theintermediate regime. Such a law can be tested experimentally, after advantageouslyreformulating (3.1) as h(r, t) = hcG(r
√hc/√Ω0), in order to get rid of the unknown
parameter t0 (Ω0 being the drop volume). Figure 4 exhibits good collapse of thedrop shapes at different times (figure 4a) into a single curve (figure 4b) by plottingh(r, t)/hc as a function of r
√hc/√Ω0. As expected, we notice that the quality of the
collapse fails for large times, initially around the contact line. Moreover, (3.1) predictsthe central height of the drop to be
hc(t)= AD3
V20 (t + t0)
2 , (3.2)
where A = H(0) is a constant. This law is compared with the experimental resultscollated for different Re and We in figure 5, where the interface central height hc isshown as function of time on logarithmic scales. There, we observe the collapse of allthe curves for short times, and fitting this master curve with the theoretical law (3.2),we find A = 0.492 ± 0.030 and V0t0/D = 0.429 ± 0.033 (red curves in figures 3 and5). For larger times, the experiments deviate from the curve because of viscous effects,exhibiting the plateau regime where the height hc converges toward the constant valuehp. This process depends only on the Reynolds number, as shown in the inset offigure 5.Plateau regime. The end of film thinning was understood within the thin film
model as a viscous correction to the hyperbolic flow. When viscosity is accounted

Spreading dynamics of drop impacts 7
100
10–1
10–210–1 100 101 102
100
10–1
10–2100 101
FIGURE 5. (Colour online) Logarithmic plot of the evolution of hc with time fordifferent Reynolds numbers and similar Weber numbers (Re,We)= (9845, 382), (2061, 467),(705, 479), (140, 449) and (58, 539) respectively. Black solid line, ballistic regime; red dottedline, self-similar regime; black dotted lines, plateau regime (hp). The inset shows the evolutionof hc in time for similar Reynolds numbers but different Weber numbers (2690, 214) and(2440, 699).
for, a viscous boundary layer is found to grow from the substrate with a thicknesslv classically following lv ∼
√νt. Therefore, interpreting the asymptotic film thickness
hp as the merging of this boundary layer with the drop surface, we obtain for theasymptotic film thickness hp and the cross-over time tp (defined as the intersectiontime of the two asymptotic behaviours):
hp ∼ Re−2/5D and tp ∼ Re1/5D/V0. (3.3)
Notice that this scaling for hp is obtained by taking the particular (hyperbolic) internalflow inside the drop introduced above. Although this flow is physically pertinent,it should be compared to a simpler scaling considering the growth of a boundarylayer only over the typical impact time D/V0 which would give hp ∼ Re−1/2R0, whichexhibits an exponent in the Reynolds number very close to the other exponent (0.5versus 0.4)! This minimal film thickness is important in the context of coating orinkjet printing but no experimental evidence has been provided so far, in particularbecause the film thickness could not be measured to a high degree of accuracy. Onthe numerical side, full simulations of the Navier–Stokes equations with a free surfacecondition have not been able to discriminate clearly between the two scalings, inparticular because of numerical limitations related to the contact line dynamics (Eggerset al. 2010; Schroll et al. 2010). However, a simplified model of the impact dynamicsdeduced from the numerical simulations suggests that the −2/5 law (3.3) is valid(Eggers et al. 2010).
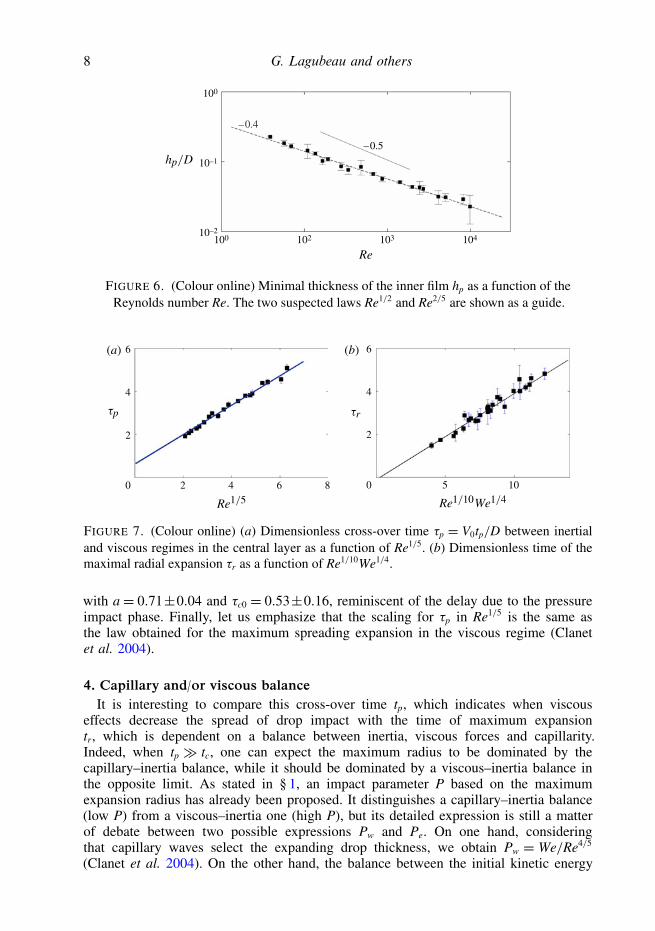
In our shape measurements, the slope of the inner region is below 1 % in theplateau regime so that hc gives an accurate measurement of hp. Figure 6 shows thevariation of hp with the Reynolds number, hp being computed as the mean value of hc
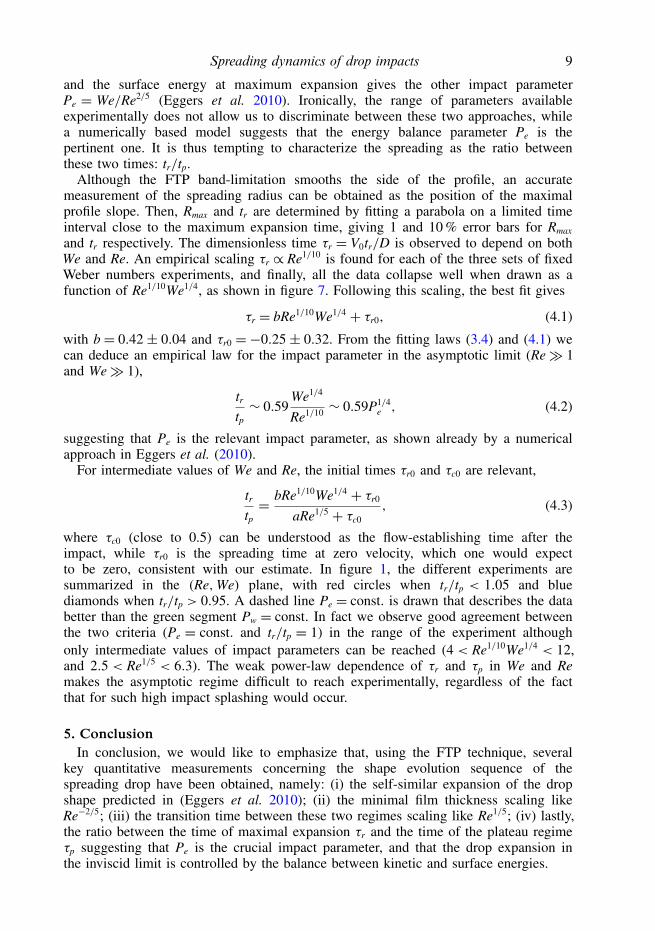
in the plateau regime. The best fit of the measures gives hc ∝ Re−0.422±0.028, in goodquantitative agreement with the 2/5 law. Similarly, figure 7 shows the dimensionlesscross-over time τp = V0tp/D as a function of Re1/5, in good agreement with thelaw (3.3). In fact, a linear fit gives
τp = aRe1/5 + τc0, (3.4)
8 G. Lagubeau and others
100
10–1
10–2
–0.4
–0.5
102100 103 104
Re
FIGURE 6. (Colour online) Minimal thickness of the inner film hp as a function of theReynolds number Re. The two suspected laws Re1/2 and Re2/5 are shown as a guide.
4
2
2 4 6 5 10
6
4
2
08
6
0
(a) (b)
FIGURE 7. (Colour online) (a) Dimensionless cross-over time τp = V0tp/D between inertialand viscous regimes in the central layer as a function of Re1/5. (b) Dimensionless time of themaximal radial expansion τr as a function of Re1/10We1/4.
with a= 0.71±0.04 and τc0 = 0.53±0.16, reminiscent of the delay due to the pressureimpact phase. Finally, let us emphasize that the scaling for τp in Re1/5 is the same asthe law obtained for the maximum spreading expansion in the viscous regime (Clanetet al. 2004).
4. Capillary and/or viscous balanceIt is interesting to compare this cross-over time tp, which indicates when viscous
effects decrease the spread of drop impact with the time of maximum expansiontr, which is dependent on a balance between inertia, viscous forces and capillarity.Indeed, when tp tc, one can expect the maximum radius to be dominated by thecapillary–inertia balance, while it should be dominated by a viscous–inertia balance inthe opposite limit. As stated in § 1, an impact parameter P based on the maximumexpansion radius has already been proposed. It distinguishes a capillary–inertia balance(low P) from a viscous–inertia one (high P), but its detailed expression is still a matterof debate between two possible expressions Pw and Pe. On one hand, consideringthat capillary waves select the expanding drop thickness, we obtain Pw = We/Re4/5
(Clanet et al. 2004). On the other hand, the balance between the initial kinetic energy
Spreading dynamics of drop impacts 9
and the surface energy at maximum expansion gives the other impact parameterPe = We/Re2/5 (Eggers et al. 2010). Ironically, the range of parameters availableexperimentally does not allow us to discriminate between these two approaches, whilea numerically based model suggests that the energy balance parameter Pe is thepertinent one. It is thus tempting to characterize the spreading as the ratio betweenthese two times: tr/tp.
Although the FTP band-limitation smooths the side of the profile, an accuratemeasurement of the spreading radius can be obtained as the position of the maximalprofile slope. Then, Rmax and tr are determined by fitting a parabola on a limited timeinterval close to the maximum expansion time, giving 1 and 10 % error bars for Rmax
and tr respectively. The dimensionless time τr = V0tr/D is observed to depend on bothWe and Re. An empirical scaling τr ∝ Re1/10 is found for each of the three sets of fixedWeber numbers experiments, and finally, all the data collapse well when drawn as afunction of Re1/10We1/4, as shown in figure 7. Following this scaling, the best fit gives
τr = bRe1/10We1/4 + τr0, (4.1)
with b= 0.42± 0.04 and τr0 =−0.25± 0.32. From the fitting laws (3.4) and (4.1) wecan deduce an empirical law for the impact parameter in the asymptotic limit (Re 1and We 1),
tr
tp∼ 0.59
We1/4
Re1/10 ∼ 0.59P1/4e , (4.2)
suggesting that Pe is the relevant impact parameter, as shown already by a numericalapproach in Eggers et al. (2010).
For intermediate values of We and Re, the initial times τr0 and τc0 are relevant,
tr
tp= bRe1/10We1/4 + τr0
aRe1/5 + τc0, (4.3)
where τc0 (close to 0.5) can be understood as the flow-establishing time after theimpact, while τr0 is the spreading time at zero velocity, which one would expectto be zero, consistent with our estimate. In figure 1, the different experiments aresummarized in the (Re,We) plane, with red circles when tr/tp < 1.05 and bluediamonds when tr/tp > 0.95. A dashed line Pe = const. is drawn that describes the databetter than the green segment Pw = const. In fact we observe good agreement betweenthe two criteria (Pe = const. and tr/tp = 1) in the range of the experiment althoughonly intermediate values of impact parameters can be reached (4 < Re1/10We1/4 < 12,and 2.5 < Re1/5 < 6.3). The weak power-law dependence of τr and τp in We and Remakes the asymptotic regime difficult to reach experimentally, regardless of the factthat for such high impact splashing would occur.
5. ConclusionIn conclusion, we would like to emphasize that, using the FTP technique, several
key quantitative measurements concerning the shape evolution sequence of thespreading drop have been obtained, namely: (i) the self-similar expansion of the dropshape predicted in (Eggers et al. 2010); (ii) the minimal film thickness scaling likeRe−2/5; (iii) the transition time between these two regimes scaling like Re1/5; (iv) lastly,the ratio between the time of maximal expansion τr and the time of the plateau regimeτp suggesting that Pe is the crucial impact parameter, and that the drop expansion inthe inviscid limit is controlled by the balance between kinetic and surface energies.

10 G. Lagubeau and others
Acknowledgements
C.J. acknowledges the financial support of the Agence Nationale de la Recherchethrough the grant DEFORMATION ANR-09-JCJC-0022-01, and G.L., A.M., V.P. andP.P. for its funding under Grant No. Tourbillonde ANR-08- BLAN-0108-02. We thankR. Schroll and J. Biello for useful comments.
R E F E R E N C E S
ANTKOWIAK, A., AUDOLY, B., JOSSERAND, C., NEUKIRCH, S. & RIVETTI, M. 2011 Instantfabrication and selection of folded structures using drop impact. Proc. Natl Acad. Sci. USA108, 10400–10404.
BARTOLO, D., JOSSERAND, C. & BONN, D. 2005 Retraction dynamics of aqueous drops uponimpact on nonwetting surfaces. J. Fluid Mech. 545, 329–338.
BARTOLO, D., JOSSERAND, C. & BONN, D. 2006 Singular jets and bubbles in drop impact. Phys.Rev. Lett. 96, 124501.
BIANCE, A., CHEVY, F., CLANET, C., LAGUBEAU, G. & QUERE, D. 2006 On the elasticity of aninertial liquid shock. J. Fluid Mech. 554 (1), 47–66.
CHEKROUN, M., MAUREL, A., LAGUBEAU, G., PAGNEUX, V., COBELLI, P., PRZADKA, A. &PETITJEANS, P. 2012 Space–time resolved experiments for water waves. Acta Polonica 120(61), 142–148.
CLANET, C., BEGUIN, C., RICHARD, D. & QUERE, D. 2004 Maximal deformation of an impactingdrop. J. Fluid Mech. 517, 199–208.
COBELLI, P., MAUREL, A., PAGNEUX, V. & PETITJEANS, P. 2009 Global measurement of waterwaves by Fourier transform profilometry. Exp. Fluids 46 (6), 1037–1047.
COBELLI, P., PAGNEUX, V., MAUREL, A. & PETITJEANS, P. 2011a Experimental study onwater-wave trapped modes. J. Fluid Mech. 666, 445–476.
COBELLI, P., PRZADKA, A., PETITJEANS, P., LAGUBEAU, G., PAGNEUX, V. & MAUREL, A. 2011bExperimental investigation of different regimes for water wave turbulence. Phys. Rev. Lett.107, 214503.
COOKER, M. & PEREGRINE, D. 1995 Pressure-impulse theory for liquid impact problems. J. FluidMech. 297, 193–214.
DEEGAN, R. D., BRUNET, P. & EGGERS, J. 2008 Complexities of splashing. Nonlinearity 21 (1),C1–C11.
EGGERS, J., FONTELOS, M., JOSSERAND, C. & ZALESKI, S. 2010 Drop dynamics after impact ona solid wall: theory and simulations. Phys. Fluids 22, 062101.
EGGERS, J. & VILLERMAUX, E. 2008 Physics of liquid jets. Rep. Prog. Phys. 71, 036601.FEDORCHENKO, A., WANG, A.-B. & WANG, Y.-H. 2005 Effect of capillary and viscous forces on
spreading of a liquid drop impinging on a solid surface. Phys. Fluids 17, 093104.LAGUBEAU, G., FONTELOS, M., JOSSERAND, C., MAUREL, A., PAGNEUX, V. & PETITJEANS, P.
2010 Flower patterns in drop impact on thin liquid films. Phys. Rev. Lett. 105, 184503.MAUREL, A., COBELLI, P., PAGNEUX, V. & PETITJEANS, P. 2009 Experimental and theoretical
inspection of the phase-to-height relation in Fourier transform profilometry. Appl. Opt. 48,380–392.
MUNDO, C., SOMMERFELD, M. & TROPEA, C. 1995 Droplet–wall collisions: experimental studiesof the deformation and breakup process. Intl J. Multiphase Flow 21, 151–173.
PEREGRINE, D. 1981 The fascination of fluid mechanics. J. Fluid Mech. 106, 59–80.PLANCHON, O. & MOUCHE, E. 2010 A physical model for the action of raindrop erosion on soil
microtopography. Soil Sci. Soc. Am. J. 74, 1092–1103.PRZADKA, A., CABANE, B., PAGNEUX, V., MAUREL, A. & PETITJEANS, P. 2012 Fourier transform
profilometry for water waves: how to achieve clean water attenuation with diffusive reflectionat the water surface? Exp. Fluids 52 (2), 519–527.
REIN, M. 1993 Phenomena of liquid drop impact on solid and liquid surfaces. Fluid Dyn. Res. 12,61–93.
Spreading dynamics of drop impacts 11
REIN, M. 1996 The transitional regime between coalescing and splashing drops. J. Fluid Mech. 306,145–165.
RENARDY, Y., POPINET, S., DUCHEMIN, L., RENARDY, M., ZALESKI, S., JOSSERAND, C.,DRUMRIGHT-CLARKE, M., RICHARD, D., CLANET, C. & QUERE, D. 2003 Pyramidal andtoroidal water drops after impact on a solid surface. J. Fluid Mech. 484, 69–83.
RIOBOO, R., MARENGO, M. & TROPEA, C. 2001 Outcomes from a drop impact on solid surfaces.Atomiz. Sprays 11, 155–165.
ROISMAN, I. 2009 Inertia dominated drop collisions. Part 2. An analytical solution of theNavier–Stokes equations for a spreading viscous film. Phys. Fluids 21, 052104.
ROISMAN, I., RIOBOO, R. & TROPEA, C. 2002 Normal impact of a liquid drop on a dry surface:model for spreading and receding. Proc. R. Soc. Lond. A 458 (2022), 1411–1430.
SCHROLL, R., JOSSERAND, C., ZALESKI, S. & ZHANG, W. 2010 Impact of a viscous liquid drop.Phys. Rev. Lett. 104, 034504.
TAKEDA, M. & MUTOH, K. 1983 Fourier transform profilometry for the automatic measurement of3-D object shapes. Appl. Opt. 22, 3977–3982.
WORTHINGTON, A. 1908 A Study of Splashes. Macmillan (reprinted in 1963).XU, L., ZHANG, W. & NAGEL, S. 2005 Drop splashing on a dry smooth surface. Phys. Rev. Lett.
94, 184505.YARIN, A. & WEISS, D. 1995 Impact of drops on solid surfaces: self-similar capillary waves, and
splashing as a new type of kinematic discontinuity. J. Fluid Mech. 283, 141–173.ZABLE, J. L. 1977 Splatter during ink jet printing. IBM J. Res. Dev. 21 (4), 315–320.