Durham E-Theses Removal of cadmium from polluted water by ...
Journal of Environmental & Analytical Toxicology - Open Access using online manuscript submission, review and tracking systems of Editorial Manager® for quality and quick review processing. Submit your manuscript at: http://www.omicsonline.org/submission/
OMICS Publishing Group5716 Corsa Ave., Suite 110, Westlake, Los Angeles, CA 91362-7354, USA, Phone: +1- 650-268-9744, Fax: +1-650-618-1414, Toll free: +1-800-216-6499
http://omicsonline.org/jeathome.php
Journal of Environmental & Analytical Toxicology
ISSN: 2161-0525
Manuel LerdauUniversity of Virginia,USA
Warren G. FosterMcMaster University
Canada
Lygia T. BudnikUniversity Medical Centre Hamburg
Germany
Ben-Zhan ZhuState Key Laboratory of
Environmental Chemistry and Ecotoxicology, China
Aijie WangHarbin Institute of Technology, China
Jinyong Peng Dalian Medical
University, China
Hiroyuki KataokaShujitsu University
Japan
Ken-ichiro InoueKitasato University
Japan
John Pierce WiseUniversity of Southern
Maine, USA
Yulong YinThe Chinese Academy
of Science, China
Steve N. GeorasUniversity of
Rochester,USA
Gasana Janvier Florida International
University, USAHuangyuan LI
Fujian Medical University, China
P KeohavongUniversity of
Pittsburgh, USA
Quentin FeltyFlorida International
University, USA
Manoj K ShuklaNew Mexico State
University, USA
Environmental & Analytical Toxicology is a multidisciplinary field of science concerned with the study of the harmful effects of various chemical, biological and physical agents on individual living organisms.
Environmental toxicology is concerned on studying the harmful effects at the population and ecosystem levels. It involves pathways, transformations, and effects of chemicals. Large exposures to chemicals can affect human health directly or indirectly by disrupting ecological systems that exist in rivers, lakes, oceans, streams, wetlands, forests and fields. It extends from individuals and populations of organisms to the ecosystem level.
K MakrisCyprus International
Institute, USA
John GodleskiHarvard School of
Public HealthUSA
Weimin GaoTexas Tech University
USA
A Kumari PatlollaJackson State University, USA
K P SinghTexas Tech University
USA
Gregory D. MayerTexas Tech University
USA
Brian K. ViaAuburn University
USA
Maobing TuAuburn University
USA
F Sanchez BayoUniversity of
Technology, Australia
Joachim Mutter Department of Environmental
Germany
April NealCollege Park, USA
Richard Ortega Bordeaux University
France
Jianfei JiangUniversity of
Pittsburgh, USA
U P KODAVANTIU.S. Environmental Protection Agency
USA
Berrin SerdarUniversity of Colorado
Anschutz, USA
F L Edwards Texas A&M University
USAWan Jin Jahng
Michigan Technologi-cal University, USA
R WusirikaPlant Biochemistry and
Genetics, USA
Million TadegeOklahoma State University, USA
Michael D. SmolenOklahoma State University, USA
A O IfelebueguCoventry University
UK
Charles E. FeigleyUniversity of South
Carolina, USA
Kumar Reddy HKwandong University
South Korea
Yongsheng ChenGeorgia Institute of Technology, USA

Open Access
Mehmood et al., 2:2http://dx.doi.org/10.4172/scientificreports.637
Research Article Open Access
Open Access Scientific ReportsScientific Reports
Open Access
Volume 2 • Issue 2 • 2013
Keywords: Drinking water; Water quality; Chemical contaminant; Microbial quality; Pakistan
IntroductionWater is essential for biochemical processes taking place in
every living organism and is basic requirement for human being but unfortunately, it is largely contaminated by physical, chemical and biological impurities that may include trace elements, pesticides, and detergents [1]. The presence of these contaminants in drinking water is a great threat to the public health causing number of diseases such as diarrhea, trachoma, nausea, abdominal pain and vomiting. The severe toxicity of these contaminants may also cause death [2]. Ground water, the source of drinking water for human beings around the World, is contributing about one-third in total water resources of Pakistan and is a major source of water supplies in major municipalities [3].
In Pakistan access to safe drinking water falls below satisfactory levels with only 25% of the population has sustainable access to quality drinking water [4-7]. Like many other countries in the world, Pakistan is also under great threat regarding availability of safe and clean drinking water. Polluted water is becoming the major cause in deteriorating the health related issues to the public in the country. Further the quality of ground water in the country is also no longer safe due to the manipulation of many external factors. The quantity of water available to public sector for drinking is of inferior quality. The old and rusty pipelines carrying drinking water are becoming more dangerous to the natural composition of the water. Insufficient water treatment measures and lack of any monitoring plan made this problem more severe [8].
Prevalence of waterborne diseases in Pakistan is mainly due to contamination of drinking water mostly with municipal sewage and industrial waste [7]. According to the Pakistan National Conservation Strategy report of 1992, about 40% of communicable diseases are waterborne [7]. Major diseases mostly connected with drinking water in Pakistan are diarrhea, gastroenteritis, typhoid, cryptosporidium infections, giardiasis intestinal worms, and some strains of hepatitis. According to International Union on Conservation of Nature (IUCN), 60% of infant deaths are caused by waterborne diarrhea in Pakistan, which is the highest in Asia. It is estimated that water related diseases
*Corresponding author: Nauman Khalid, Graduate School of Agricultural and Life Sciences, The University of Tokyo,1-1-1 Yayoi, Bunkyo-ku, Tokyo, 113-8657, Japan, Tel: 81-80-3385-0786; E-mail: [email protected]
Received November 22, 2012; Published February 04, 2013
Citation: Mehmood S, Ahmad A, Ahmed A, Khalid N, Javed T (2013) Drinking Water Quality in Capital City of Pakistan. 2: 637 doi:10.4172/scientificreports.637
Copyright: © 2013 Mehmood S, et al. This is an open-access article distributed under the terms of the Creative Commons Attribution License, which permits unrestricted use, distribution, and reproduction in any medium, provided the original author and source are credited.
AbstractThis study was designed to evaluate the quality of drinking water in selected areas of capital of Pakistan and
its adjacent city Rawalpindi. Drinking water samples collected from selected localities of Rawalpindi and Islamabad are analyzed for different water quality parameters such as pH, alkalinity, hardness, total dissolved solids, chloride, bicarbonates, sodium, potassium, calcium, magnesium, sulphates, phosphates, nitrates lead, copper, cadmium, cobalt, iron and zinc. Total viable count, coliforms, fecal coliforms and Escherichia coli were also part of the study. Analyzed samples provide information that the level of pH, alkalinity, lead, copper, nitrates, phosphates, cadmium, cobalt, iron, zinc, potassium, magnesium, sulfate, bicarbonates and chloride are under the limit specified by WHO and PSQCA. While some water quality parameters such as calcium, sodium, total dissolved solids, and hardness were found to be above the WHO and PSQCA specified limit in some regions of Rawalpindi and Islamabad. Total viable count test performed to analyze the microbial quality of water samples revealed that all the samples were heavily loaded by microbial growth and considered unsafe for drinking purposes. Presence of coliforms, fecal coliforms and Escherichia coli clearly revealed that water is not fit for drinking purpose in the twin cities of Pakistan.
Drinking Water Quality in Capital City of PakistanShahid Mehmood1, Asif Ahmad1, Anwaar Ahmed1, Nauman Khalid2* and Tariq Javed3
1Department of Food Technology, PMAS-Arid Agriculture University, Rawalpindi, Pakistan2Graduate School of Agricultural and Life Sciences, The University of Tokyo, Tokyo, Japan3Department of Chemistry, Islamia University Bahawalpur, Pakistan
cause annual national income losses of USD 380–883 million or approximately 0.6-1.44% of the GDP [7,9].
Pakistan ranked 80th in the world on availability of safe and clean drinking water to its people [10]. It has been estimated that if no improvements are made to ensure the availability of safe drinking water, only1000 m3 per capita will be available from onward to 2010 in the country [11]. Water samples collected from major cities of the country like Karachi, Faisalabad, Kasur, Gujrat and Rawalpindi revealed that the analyzed samples from these cities are unfit to drink [12]. In a study conducted by Sun et al. [13] related to Islamabad showed that, out of 271 samples collected, 77% were unsafe bacteriologically while 10.3% contained both bacteriological and physicochemical contamination. Amongst 196 of CDA (Capital Development Authority) samples, 5.1% were polluted bacteriologically while 3.6% contained both physicochemical and bacteriological contamination. The quality of water in the twin cities of Islamabad and Rawalpindi is no better than the rest of the country. 94% of the total samples were found heavily polluted with biological contamination and considered unfit to safe [14] while 34% have fecal contamination. Similarly a survey conducted by NIH Pakistan [15] confirmed that 75% of water in Islamabad and 87% of water in Rawalpindi are unsafe for human consumption [16]. Hashmi et al. [7] analyzed the drinking quality of highly populous area in Rawalpindi (Westridge and Tench) concluded that water is unfit for drinking. In Pakistan, the drinking water is getting contaminating and there are very few studies conducted in some areas concerning this issue. So there is dire need to analyze the drinking water to identify the potential harmful contaminants in these localities.
Citation: Mehmood S, Ahmad A, Ahmed A, Khalid N, Javed T (2013) Drinking Water Quality in Capital City of Pakistan. 2: 637 doi:10.4172/scientificreports.637
Page 2 of 6
Volume 2 • Issue 2 • 2013
burtz media (S&B) and presence of blackish colonies indicates fecal contamination [18].
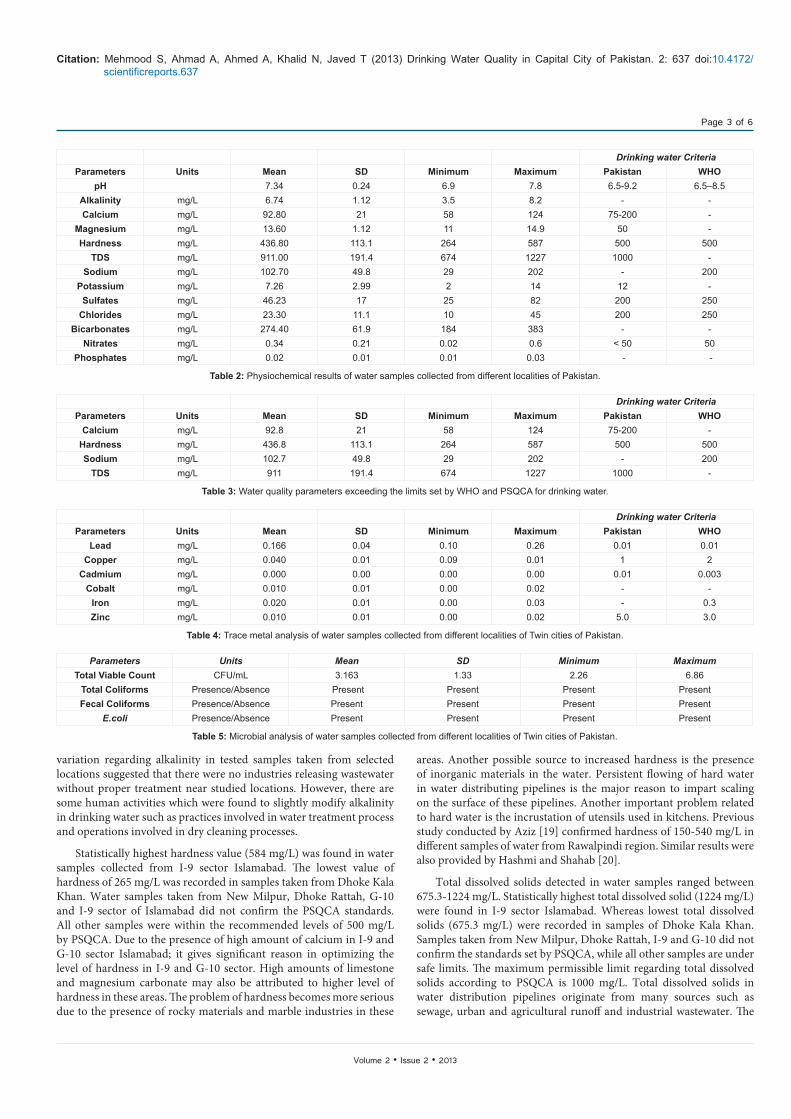
ResultsPhysico-chemical analysis
Trace metal analysis
Results of trace metal analysis from twin cities were presented in Table 4. The mean concentration of trace metals were copper (Cu) 0.04 mg/L, lead (Pb) 0.166 mg/L, cadmium (Cd) 0 mg/L, cobalt (Co) 0.01 mg/L, iron (Fe) 0.02 mg/L and zinc (Zn) 0.01 mg/L. It was noticed that concentration of trace metals were more in Rawalpindi areas as compare to Islamabad, while in Islamabad sample A5(I-9) showed higher concentration.
Microbial analysis
The results of microbial analysis were presented in Table 5. The mean value of total viable count was 3.613 cfu/mL, while coliforms and fecal coliforms were seen on all samples. E.coli was detected on samples A5, B1, B3 and B5, respectively.
DiscussionPhysico-chemical parameter on quality
The study assesses the drinking water quality in Twin cities of Pakistan. The pH values detected in water samples ranged between 7.1-7.5. Significantly highest pH (7.5) was found in samples collected from New Milpur, whereas lowest pH value (7.1) was recorded in Dhoke Kala Khan which was statistically significant from all other samples collected from Rawalpindi and Islamabad. The maximum permissible limit described by WHO for pH in drinking water ranged between 6.5-8.5. The pH values in all samples met the WHO requirements and considered safe for drinking purposes. Non-significant variation in tested samples in Islamabad locations was attributed to either better water supply system or it may be due to better purification facility available to Capital Development Authority. The small but non-significant variation in pH of drinking water is affected by the composition of all the constituents available in ionic forms, notably hydrogen and hydroxyl ions present in it. Similarity in pH values of samples taken from the selected locations indicated that water has almost same ionic composition in studied areas. These results are also in accordance with the earlier study conducted by Farooq et al. [6] in which the pH values varied from 7.02 to 7.30 and also with Hashmi et al. [7] in which pH values ranges from 7.03 to 7.73 in Westridge and Tench Bata in Rawalpindi.
The alkalinity in water samples ranged between 5.0-7.9 mg/L. Statistically, highest alkalinity (7.9 mg/L) was found in samples collected from I-9 sector Islamabad, whereas lowest alkalinity (5.0 mg/L) was recorded in samples collected from Dhoke Kala Khan. The safe limit proposed by Canadian Water Rules on alkalinity is 250 mg/L. All water samples were below the alkalinity limits for drinking purposes. The
Water supplies of Islamabad and Rawalpindi are mostly supplemented by ground water through more than 200 wells installed by the Capital Development Authority. The twin cities are facing water quality problem due to contamination through untreated sewage and industrial waste. This aims of present study were to access the quality of drinking water in twin cities, to access the level of contaminants in the drinking water samples of Rawalpindi and Islamabad and to compare quality of drinking water with World health standards (WHO) and Pakistan national standards (PSQCA).
Material and MethodsStudy area and sample collection
Water samples were collected in polyethylene bottles from different localities of Rawalpindi and Islamabad region (Twin cities) of Pakistan (Table 1). These two cities are highly populous and broad socio-economical features. Sampling was done in all major areas. Before taking the samples from each location the bottles were thoroughly washed with sample water and filled in such a way that no air bubbles entrapped in the bottle and according to the standard method described by Arnold et al. [17].
Instruments and reagents
The pH was analyzed using pH meter (Hanna instrument, H18418). Flame photometer (Model no. JENWAY PFP7), Atomic absorption spectrophotometer (GBC 932 plus), TDS meter were used as main instruments. Standard solutions were prepared with chemicals of analytical grade and distilled water is used for dilution of solutions.
Analytical procedures
Sodium and potassium in samples were determined by Flame photometer. Nitrate and phosphate were also determined by spectrophotometry. Calcium, magnesium, copper, lead, cadmium, cobalt, iron and zinc in water samples were analyzed using atomic absorption spectrophotometer. This method was also used in determination of alkalinity and carbonate in water samples. Chloride in samples was determined using mercuric nitrate method. Total dissolved solids were analyzed using TDS meter. All analysis was carried out in quadruplet (n=4).
Microbial analysis
Total viable count was determined on Potato Dextrose Agar (PDA) at 25°C and possible colonies were calculated on colony counter. Total coliforms were detected on Chromogenic Agar (CA). 10 mL of water treated in buffer peptone (BP) was filtered through 0.42 µm filter and incubated on CA for 24 hrs. Presence of pinkish colonies indicates the presence of coliforms, while a purple colony indicates presence of Escherichia coli. Total fecal coliforms were detected on slanetz and
City Sampling Area Sampling CodeIslamabad F-10 A1
G-6 A2 G-10 A3 H-9 A4 I-9 A5
Rawalpindi Dhok Kala Khan B1 Commerical Market B2 New Milpur B3 Pindora B4 Dhoke Rattah B5
Table 1: Sampling area of Twin cities of Pakistan.
Results of physic-chemical parameter determined in Twin cities were presented in tables 2 and 3. The results showed mean pH of 7.34, total dissolve solids 911 mg/L, total hardness 436.8 mg/L and alkalinity 6.74 mg/L from water samples of twin cities (Figure 1). The mean concentrations of cations are in order of sodium (Na) 102.7 mg/L, calcium (Ca) 92.8 mg/L, and magnesium (Mg) 13.6 mg/L, while anions are in order of bicarbonates (HCO3) 274.4 mg/L, sulphates (SO4
-2) 46.23 mg/L chlorides (Cl-) 23.3 mg/L, nitrates (NO3-) 0.34 mg/L and phosphates (PO4
-3) 0.02 mg/L.
Citation: Mehmood S, Ahmad A, Ahmed A, Khalid N, Javed T (2013) Drinking Water Quality in Capital City of Pakistan. 2: 637 doi:10.4172/scientificreports.637
Page 3 of 6
Volume 2 • Issue 2 • 2013
variation regarding alkalinity in tested samples taken from selected locations suggested that there were no industries releasing wastewater without proper treatment near studied locations. However, there are some human activities which were found to slightly modify alkalinity in drinking water such as practices involved in water treatment process and operations involved in dry cleaning processes.
Statistically highest hardness value (584 mg/L) was found in water samples collected from I-9 sector Islamabad. The lowest value of hardness of 265 mg/L was recorded in samples taken from Dhoke Kala Khan. Water samples taken from New Milpur, Dhoke Rattah, G-10 and I-9 sector of Islamabad did not confirm the PSQCA standards. All other samples were within the recommended levels of 500 mg/L by PSQCA. Due to the presence of high amount of calcium in I-9 and G-10 sector Islamabad; it gives significant reason in optimizing the level of hardness in I-9 and G-10 sector. High amounts of limestone and magnesium carbonate may also be attributed to higher level of hardness in these areas. The problem of hardness becomes more serious due to the presence of rocky materials and marble industries in these
areas. Another possible source to increased hardness is the presence of inorganic materials in the water. Persistent flowing of hard water in water distributing pipelines is the major reason to impart scaling on the surface of these pipelines. Another important problem related to hard water is the incrustation of utensils used in kitchens. Previous study conducted by Aziz [19] confirmed hardness of 150-540 mg/L in different samples of water from Rawalpindi region. Similar results were also provided by Hashmi and Shahab [20].
Total dissolved solids detected in water samples ranged between 675.3-1224 mg/L. Statistically highest total dissolved solid (1224 mg/L) were found in I-9 sector Islamabad. Whereas lowest total dissolved solids (675.3 mg/L) were recorded in samples of Dhoke Kala Khan. Samples taken from New Milpur, Dhoke Rattah, I-9 and G-10 did not confirm the standards set by PSQCA, while all other samples are under safe limits. The maximum permissible limit regarding total dissolved solids according to PSQCA is 1000 mg/L. Total dissolved solids in water distribution pipelines originate from many sources such as sewage, urban and agricultural runoff and industrial wastewater. The
Drinking water CriteriaParameters Units Mean SD Minimum Maximum Pakistan WHO
pH 7.34 0.24 6.9 7.8 6.5-9.2 6.5–8.5Alkalinity mg/L 6.74 1.12 3.5 8.2 - -Calcium mg/L 92.80 21 58 124 75-200 -
Magnesium mg/L 13.60 1.12 11 14.9 50 -Hardness mg/L 436.80 113.1 264 587 500 500
TDS mg/L 911.00 191.4 674 1227 1000 -Sodium mg/L 102.70 49.8 29 202 - 200
Potassium mg/L 7.26 2.99 2 14 12 -Sulfates mg/L 46.23 17 25 82 200 250
Chlorides mg/L 23.30 11.1 10 45 200 250Bicarbonates mg/L 274.40 61.9 184 383 - -
Nitrates mg/L 0.34 0.21 0.02 0.6 < 50 50Phosphates mg/L 0.02 0.01 0.01 0.03 - -
Table 2: Physiochemical results of water samples collected from different localities of Pakistan.
Drinking water CriteriaParameters Units Mean SD Minimum Maximum Pakistan WHO
Calcium mg/L 92.8 21 58 124 75-200 -Hardness mg/L 436.8 113.1 264 587 500 500Sodium mg/L 102.7 49.8 29 202 - 200
TDS mg/L 911 191.4 674 1227 1000 -
Table 3: Water quality parameters exceeding the limits set by WHO and PSQCA for drinking water.
Drinking water CriteriaParameters Units Mean SD Minimum Maximum Pakistan WHO
Lead mg/L 0.166 0.04 0.10 0.26 0.01 0.01Copper mg/L 0.040 0.01 0.09 0.01 1 2
Cadmium mg/L 0.000 0.00 0.00 0.00 0.01 0.003Cobalt mg/L 0.010 0.01 0.00 0.02 - -
Iron mg/L 0.020 0.01 0.00 0.03 - 0.3Zinc mg/L 0.010 0.01 0.00 0.02 5.0 3.0
Table 4: Trace metal analysis of water samples collected from different localities of Twin cities of Pakistan.
Parameters Units Mean SD Minimum MaximumTotal Viable Count CFU/mL 3.163 1.33 2.26 6.86
Total Coliforms Presence/Absence Present Present Present Present Fecal Coliforms Presence/Absence Present Present Present Present
E.coli Presence/Absence Present Present Present Present
Table 5: Microbial analysis of water samples collected from different localities of Twin cities of Pakistan.

Citation: Mehmood S, Ahmad A, Ahmed A, Khalid N, Javed T (2013) Drinking Water Quality in Capital City of Pakistan. 2: 637 doi:10.4172/scientificreports.637
Page 4 of 6
Volume 2 • Issue 2 • 2013
highest value of total dissolved solids detected in Islamabad regions may be due to the higher levels of inorganic compounds present in the water. Cemented storage tanks used to store the drinking water may also attribute to increase the level of total dissolved solids in these areas. There are no such evidences that by consuming water having total dissolved solids more than 1000 mg/L cause deleterious physiological reactions. However, excessive amount of total dissolved solids in drinking water may impart undesirable flavor and also scaling on water distribution pipelines .Higher level of TDS was also detected by Farooq et al. [6]. Similarly in Rawalpindi higher TDS of 209 to 1042 mg/L in different samples were identified by Aziz [19] (Figure 2).
Statistically, highest Na (199.6 mg/L) was found in Dhoke Rattah, while lowest Na (46.6 mg/L) was recorded in G-6 sector Islamabad which was statistically non-significant with Pindora. According to PSQCA, the maximum permissible limit for Na in drinking water is 200 mg/L. All tested water samples were under the safe limits. The research results of studied area revealed that presence of Na in water samples may also give indication of rock salts deposited nearby the selected localities. Improper sewage treatments also contributed to raise levels of Na during mixing into fresh water streams. Moreover industries discharging wastewater without any treatment also contributed to raise the level of Na as well as other mineral contents. Salts intrusion to the fresh water streams may become the reason to deviate the research results regarding Na in selected localities.
Statistically highest Ca concentration of 121 mg/L was found in water samples collected from I-9 sector Islamabad, whereas lowest value of Ca (63.6 mg/L) was recorded in samples collected from Dhoke Kala
Khan. According to PSQCA the maximum permissible limit for Ca in drinking water is 100 mg/L. Water samples taken from New Milpur, Dhoke Rattah, G-10 and I-9 did not confirm the PSQCA standards for Ca. All other samples were within limits of PSQCA. The highest Ca concentration detected in I-9 sector may be due to the presence of calcareous rocks found in underground and significant amount of which is being added into ground water used for drinking purposes. The presence or absence of limestone near selected locations may also be a detrimental factor in variable Ca values. Calcium is well known to cause hardness of water by the combined effect of other compounds.
The Mg detected in water samples ranged between 12.3-14.8 mg/L. Statistically highest level of Mg (14.8 mg/L) was found in water samples taken from I-9 sector of Islamabad whereas, lowest level of Mg (12.3 mg/L) was detected in G-6 sector Islamabad. The maximum permissible limit for Mg in drinking water is 250 mg/L according to the standards set by the PSQCA. All samples are considered in safe limits for drinking purposes. The amount of Mg detected in water samples did not confirm the any other external contamination. However, there are chances that highest amount of Mg detected in I-9 may due to the external factors such as presence of some rocky material contributing Mg to underground water. No health base guideline value regarding magnesium is set by WHO. However, according to PSQCA the maximum permissible limit for magnesium in drinking water is 150 mg/L.
Highest value (12.33 mg/L) of K was found in I-9 sector Islamabad, whereas the lowest value (5.1 mg/L) was detected in Commercial Market Rawalpindi. The PSQCA standard value for potassium in drinking water is 12 mg/L. all tested samples have lower value as prescribed by PSQCA, therefore water is fit for drinking purposes. The most important source of potassium in drinking water is the waste materials discharged by the industries located nearby the studied areas. K is important chemical used in manufacturing and processing industries and is continuously added to natural sources of drinking water. Ionic forms and salts are highly soluble in water, and it is very easy for potassium to become a drinking water pollutant. Moreover there may be other sources responsible for K excess in drinking water such as fertilizers. In ionic forms are soluble, therefore from the soils potassium can leach to the ground water.
The highest value (80.3 mg/L) of SO4-2 was observed in samples of
I-9 sector of Islamabad, while lowest value (26.3 mg/L) was recorded in samples collected from Pindora, Rawalpindi. The maximum permissible limit of sulfate according to the standards set by PSQCA is 250 mg/L. the range of sulfate in tested water samples was under acceptable limits. Research results showed that it was detected in high amounts in samples taken from I-9 sector of Islamabad. It may be due the leaching of gypsum to the ground water in that area. Sodium sulfate is another compound involved to release the sulfate in fresh streams of drinking water. Like many other compounds its amount in drinking water is also influenced by waste materials discharge by the industries. Sulfur compounds used in industries and being discharge through waste materials without any proper treatment is important factor in raising levels of sulfate in drinking water (Figure 3).
Statistically, highest value of 43.6 mg/L for Cl- in water samples were from Dhoke Rattah, while lowest value of 11 mg/L for Cl- was detected in samples taken from G-6 sector Islamabad. The maximum permissible limit for chloride in drinking water set by WHO is 250 mg/L. The chloride level detected in all samples was below the guidelines provided by the WHO, therefore all the samples are considered safe to drink with respect to chloride. The research results are in agreement with the
0
1
2
3
4
5
6
7
8
9
A1 A2 A3 A4 A5 B1 B2 B3 B4 B5
pH
Alkalinity mg/L
Figure 1: Variation of pH and Alkalinity in water samples from twin cities.
0
200
400
600
800
1000
1200
1400
A1 A2 A3 A4 A5 B1 B2 B3 B4 B5
Hardness mg/L
Total Dissolved Solids mg/L
Figure 2: Variation of TDS and hardness in water samples of Twin cities.
Citation: Mehmood S, Ahmad A, Ahmed A, Khalid N, Javed T (2013) Drinking Water Quality in Capital City of Pakistan. 2: 637 doi:10.4172/scientificreports.637
Page 5 of 6
Volume 2 • Issue 2 • 2013
findings of Jahangir [14] who also found normal level of chloride in drinking water samples taken from Rawalpindi and Islamabad regions.
Statistically, highest value (382 mg/L) of HCO3-1 was found in samples taken from I-9 sector of Islamabad, while lowest value (185.3 mg/L) was recorded in samples taken from Dhoke Kala Khan. There are no guidelines related to the HCO3
-1 in drinking water. But in general safe limit considered in drinking water is 500 mg/L. All the samples were found to be within safe limits. Research results revealed that alkalinity values detected in high amount in I-9 sector of Islamabad give reason to higher level of bicarbonates. Moreover bicarbonates values in drinking water are also deviated by weathering of rocks. Rocky materials are well known to have many minerals having calcium compounds which ultimately lead to increase the level of bicarbonates in drinking water. The variation in values of bicarbonates in studied locations may also due to the harness of water. No significant health effects are associated with consumption of drinking water containing high amount of bicarbonates.
Highest value (0.6 mg/L) of NO3-1 was found in water samples of A5
(I-9) Islamabad and B5 (Dhoke Rhatta). Similarly, highest (0.03 mg/L) of PO4
-3 was found in sample taken from Dhoke Rhatta (B5). The likely reasons for these higher values could be runoff from agricultural fields where ammonium nitrate, nitrophosphate and diamonium phosphate fertilizers were applied. In addition, applied sewage and industrial wastewater also contained higher concentrations of NO3
- and PO4-3
[21,22] (Figure 4).
Trace metals on quality
Statistically, highest value (0.025 mg/L) was found in samples taken from I-9 sector of Islamabad, while lowest value (0.010 mg/L) was recorded in Dhoke Kala Khan (B1). The maximum permissible limit for lead concentration in drinking water according to WHO is
0.05 mg/L and all values were below the WHO recommendations. The values detected were small because of the lead pipelines that are used to deliver the drinking water on domestic scale. Besides studied areas is located near the main roads containing high amounts of lead. The vehicle discharge containing lead compounds is directly or indirectly involved to pollute the drinking water sources. Lead is harmful for normal functioning of many organs of human body. No previous study on lead contamination in Twin cities has been reported so far.
The values of Cu detected in the water samples ranged between 0.02-0.08 mg/L. statistically, highest value (0.08 mg/L) of copper was observed in water samples taken from I-9 (A5) sector Islamabad, while lowest value (0.02 mg/L) of copper was detected in water samples taken from Commercial Market (B2) which was statistically non-significant from G-6 sector of Islamabad. The maximum permissible limit for copper in drinking water is 3 mg/L according to WHO. As in all tested samples the copper concentration was below the WHO guidelines. Cu concentration in the treated water often increases during distribution, particularly in the systems where an acidic pH exists or in the presence of high-carbonate waters with an alkaline pH. The guidelines are derived on the basis to be protective against the gastrointestinal effects of copper [23].
Cd was not detected in any samples from twin cities. The possible reason for this lies in fact that there was no tanning industries located in surrounding vicinity. Smoking is a significant additional source of cadmium exposure [23]. Cadmium accumulates primarily in the kidneys and has a long biological half-life of 10-35 years, in humans. For Pakistan a value of 0.01 would be appropriate, which is in accordance with the standards for most developing nations in Asia [23].
Higher value (0.02 mg/L) of Co, (0.03 mg/L) Fe and (0.02 mg/L) Zn were seen in water sample from A5 (I-9) from Islamabad and B5 (Dhoke Rhatta) from Rawalpindi. These values are well below then standards of both WHO and PSCQA. The results are well matched with previous study of Aziz [19] and Hashmi and Shahab [20]. They reported iron concentration in drinking samples from 0.03 to 1.53 mg/L in Islamabad and 0.03 to 0.07 mg/L in Rawalpindi, respectively (Figure 5).
Microbial quality
Statistically, highest value (6.86 cfu/ml) of total viable count in water samples taken from Dhoke Rattah, while lowest value (2.26 cfu/ml) of total viable count was detected in samples taken from Dhoke Kala Khan. According to WHO recommendations there should not be a single microbial growth per m/L of drinking water. The total
0
50
100
150
200
250
A1 A2 A3 A4 A5 B1 B2 B3 B4 B5
Magnesium mg/L
Potassium mg/L
Calcium mg/L
Sodium mg/L
Sulfate mg/L
Figure 3: Variation of different cations in water samples from Twin cities.
-50
0
50
100
150
200
250
300
350
400
450
500
B1 B2 B3 B4 B5 A1 A2 A3 A4 A5
Chloride mg/L
Sulfate mg/L
Bicarbonates mg/L
Nitrates mg/L
Phosphates mg/L
Figure 4: Variation of anions in drinking water samples form twin cities.
-0.01
0
0.01
0.02
0.03
0.04
0.05
0.06
0.07
0.08
0.09
0.1
B1 B2 B3 B4 B5 A1 A2 A3 A4 A5
Lead mg/L
Copper mg/L
Cadmium mg/L
Cobalt mg/L
Iron mg/L
Zinc mg/L
Figure 5: Variation of trace metals in different water samples from twin cities.

Citation: Mehmood S, Ahmad A, Ahmed A, Khalid N, Javed T (2013) Drinking Water Quality in Capital City of Pakistan. 2: 637 doi:10.4172/scientificreports.637
Page 6 of 6
Volume 2 • Issue 2 • 2013
viable count detected in all samples is above the guide lines provided by the WHO, therefore all the samples are considered unsafe to drink. The most important factor used for determination of water quality is dependent on microbial load present in the water. There are many reasons that are attributed to increase the level of total viable count in drinking water. Old and rusty sewage pipelines are good source for the growth of microbes. Moreover the organic material present in water provide food to these microbes. The highest value of total viable count detected in samples taken from Dhoke Rattah may be due to the mixing of fresh supply water with sewage water. The leakage of water supply pipelines also attributed to contaminate the drinking water with external pollutants. Further inadequate water treatment also gives reason for the survival of microbes.
Coliforms and fecal coliforms were seen on all samples. E.coli was detected on samples A5, B1, B3 and B5. The presence of E.coli clearly indicated that water was unfit for human consumption and the presence of these microbes led to different diseases that are easily seen in different communities in twin cities. The Total viable count was much lower than previously reported by Hashmi et al. [7]. They reported 4 CFU/mL to 108 CFU/mL from water samples of Westridge and Tech Bata of Rawalpindi. Ali and Ahmed [24] reported water quality from hand pumps and open wells in Punjab and concluded that these are highly contaminated with coliforms and E.coli. The infestation ranged up to 4000 coliforms/100mL and 166 E.coli colonies/100mL.
ConclusionThe research revealed that some samples collected from Rawalpindi
and Islamabad were not suitable for drinking purposes. Chemical parameters such as hardness, total dissolved solids and calcium were higher than the standards set by WHO and PSQCA for drinking water quality. Total viable count test performed to analyze the microbial quality of water samples revealed that all the samples were heavily loaded with microbial contaminants such as, coliforms, fecal coliforms and E.coli and the water was unfit of drinking. Therefore it is concluded that contamination in drinking water from some regions of Rawalpindi and Islamabad necessitates the need for efficient water treatment for chemical and microbial quality before it reaches the consumer.
References
1. Parent A, Fass S, Dincher ML, Reasoner D, Gatel D, et al. (2007) Control of Coliform Growth in Drinking Water Distribution Systems. Water and Environment Journal 10: 442-445.
2. Esrey S, Potash J, Roberts L, Shiff C (1991) Effects of improved water supply and sanitation on ascariasis, diarrhoea, dracunculiasis, hookworm infection, schistosomiasis, and trachoma. Bulletin of World Health Organization 69: 609-621.
3. Kausar R, Ahmad Z (2009) Determination of toxic inorganic elements pollution in ground waters of Kahuta Industrial Triangle Islamabad, Pakistan using inductively coupled plasma mass spectrometry. Environmental Monitoring and Assessment 157: 347-354.
4. Nils R (2005) in Nestle’s ‘Pure Life’, Nestle, Pakistan.
5. Rosemann N (2005) Drinking Water Crisis in Pakistan and the Issue of Bottled Water. The Case of Nestlé’s ‘Pure Life’. Swiss Coalition of Development Organisations.
6. Farooq S, Qazi IA, Qaiser S, Rasheed S (2008) Monitoring of Coliforms and chlorine residual in water distribution network of Rawalpindi, Pakistan. Environmental Monitoring and Assessment 140: 339-347.
7. Hashmi I, Farooq S, Qaiser S (2009) Chlorination and water quality monitoring within a public drinking water supply in Rawalpindi Cantt (Westridge and Tench) area, Pakistan. Environmental Monitoring and Assessment 158: 393-403.
8. (2005) Pakistan Council of Research and Water Resources, Islamabad.
9. (2003) UNDP, in “Water Crisis”, Karachi, p. 7 and 103.
10. Azizullah A, Khattak MNK, Richter P, Hader DP (2011) Water pollution in Pakistan and its impact on public health — A review. Environment International 37: 479-497.
11. PAK-EPA (2008) Ministry of Environment, Government of Pakistan, Islamabad.
12. Bhutta M, Ramzan M, Hafeez CA (2008) Pakistan Council for Research in Water Resources, Islamabad, Pakistan.
13. Sun O, Chung S, Nasir J, Saba N (2001) Islamabad, National Institute of Health & Korea International Cooperation Agency.
14. Jehangir M (2002) in The Network, The Network Consumer Protection Pakistan Islamabad.
15. (2012) Seasonal awerness and alert letter (SAAL) for epidemic prone infectious diseases in pakistan. National Institute of Health, Islamabad.
16. (2005) WB-CWRAS, World Bank, Washington, DC.
17. Arnold E, Lenore S, Andrew D (2005) Standard Method for the Examination of Water and Waste Water. American Public health Association, Washington, DC.
18. Anderson DA, Baron EJ, Breitschwerdt EB, Caliendo AM, Carroll KC, et al. (2007) Manual of Clinical Microbiology. ASM Press.
19. Aziz JA (2001) Drinking Water Quality in Punjab. Proceedings of the 68th annual session of the Pakistan Engineering Congress, Lahore 239-249.
20. Hashmi S, Shahab S (1991) Proceedings of the National Workshop on Water Sources: achievements and issues in the 20th century and challenges for the next millennium.
21. Zacharias I, Bertachas I, Skoulikidis N, Koussouris T (2002) Lakes & Reservoirs: Research and Management 7: 55-62.
22. Gupta G, Abd El-Hamid Z (2003) Water quality of lake Qarun, Egypt. International Journal of Environmental Studies 60: 651-657.
23. (2004) WHO, Guidelines for drinking-water quality World Health Organization, Geneva.
24. Ali W, Ahmad K, (1994) In WHO training course/workshop on GEMS/WATER quality monitoring, Amman, Jordan.


![Factory Fields: Agricultural Practices, Polluted Water …nationalaglawcenter.org/wp-content/uploads/assets/bibarticles/... · 2004] FACTORY FIELDS: AGRICULTURAL PRACTICES. POLLUTED](https://static.fdocuments.in/doc/165x107/5ab930517f8b9aa6018d87e5/factory-fields-agricultural-practices-polluted-water-factory-fields-agricultural.jpg)