Journal of Development Studies India's Public …web.iitd.ac.in/~reetika/PDS JDS 2011.pdf ·...
24
PLEASE SCROLL DOWN FOR ARTICLE This article was downloaded by: [Khera, Reetika] On: 8 March 2011 Access details: Access Details: [subscription number 934563146] Publisher Routledge Informa Ltd Registered in England and Wales Registered Number: 1072954 Registered office: Mortimer House, 37- 41 Mortimer Street, London W1T 3JH, UK Journal of Development Studies Publication details, including instructions for authors and subscription information: http://www.informaworld.com/smpp/title~content=t713395137 India's Public Distribution System: Utilisation and Impact Reetika Khera a a Centre for Development Economics, University of Delhi, Delhi, India First published on: 07 March 2011 To cite this Article Khera, Reetika(2011) 'India's Public Distribution System: Utilisation and Impact', Journal of Development Studies,, First published on: 07 March 2011 (iFirst) To link to this Article: DOI: 10.1080/00220388.2010.506917 URL: http://dx.doi.org/10.1080/00220388.2010.506917 Full terms and conditions of use: http://www.informaworld.com/terms-and-conditions-of-access.pdf This article may be used for research, teaching and private study purposes. Any substantial or systematic reproduction, re-distribution, re-selling, loan or sub-licensing, systematic supply or distribution in any form to anyone is expressly forbidden. The publisher does not give any warranty express or implied or make any representation that the contents will be complete or accurate or up to date. The accuracy of any instructions, formulae and drug doses should be independently verified with primary sources. The publisher shall not be liable for any loss, actions, claims, proceedings, demand or costs or damages whatsoever or howsoever caused arising directly or indirectly in connection with or arising out of the use of this material.
Transcript of Journal of Development Studies India's Public …web.iitd.ac.in/~reetika/PDS JDS 2011.pdf ·...

PLEASE SCROLL DOWN FOR ARTICLE
This article was downloaded by: [Khera, Reetika]On: 8 March 2011Access details: Access Details: [subscription number 934563146]Publisher RoutledgeInforma Ltd Registered in England and Wales Registered Number: 1072954 Registered office: Mortimer House, 37-41 Mortimer Street, London W1T 3JH, UK
Journal of Development StudiesPublication details, including instructions for authors and subscription information:http://www.informaworld.com/smpp/title~content=t713395137
India's Public Distribution System: Utilisation and ImpactReetika Kheraa
a Centre for Development Economics, University of Delhi, Delhi, India
First published on: 07 March 2011
To cite this Article Khera, Reetika(2011) 'India's Public Distribution System: Utilisation and Impact', Journal ofDevelopment Studies,, First published on: 07 March 2011 (iFirst)To link to this Article: DOI: 10.1080/00220388.2010.506917URL: http://dx.doi.org/10.1080/00220388.2010.506917
Full terms and conditions of use: http://www.informaworld.com/terms-and-conditions-of-access.pdf
This article may be used for research, teaching and private study purposes. Any substantial orsystematic reproduction, re-distribution, re-selling, loan or sub-licensing, systematic supply ordistribution in any form to anyone is expressly forbidden.
The publisher does not give any warranty express or implied or make any representation that the contentswill be complete or accurate or up to date. The accuracy of any instructions, formulae and drug dosesshould be independently verified with primary sources. The publisher shall not be liable for any loss,actions, claims, proceedings, demand or costs or damages whatsoever or howsoever caused arising directlyor indirectly in connection with or arising out of the use of this material.

India’s Public Distribution System:Utilisation and Impact
REETIKA KHERACentre for Development Economics, University of Delhi, Delhi, India
Final version received 30 March 2010
ABSTRACT This article studies the effectiveness of India’s Public Distribution System (PDS)as a food security intervention, using field survey data collected by the author in Rajasthan.Utilisation is low, and many households purchase wheat from the market at higher prices beforeexhausting PDS quotas. This ‘puzzle of under-purchase’ is analysed by extending the dual-pricingmodel to account for supply-side (for example, diversion) and demand-side (for example,transaction costs) constraints. Primary and secondary data as well as field observations suggestthat under-purchase is mainly due to supply constraints. I also find that the PDS affects thecomposition (away from more nutritious ‘coarse cereals’), rather than level, of cerealconsumption.
I. Introduction
The Public Distribution System (PDS) in India is an important public interventionfor enhancing food security. The PDS provides subsidised food grains (and otheressential commodities) through a network of ‘fair price shops’. Until 1992 access tothe PDS was, at least in theory if not in practice, universal. Corruption and highoperational costs were among the reasons that were used to justify the move to theRevamped Public Distribution System (based on a principle of geographic targeting)in tribal, arid, hill and remote areas in 1992 and then to a Targeted PublicDistribution System (TPDS) in 1997. Under the TPDS, households were classified asAbove Poverty Line (APL) or Below Poverty Line (BPL), based on the economicstatus of households. BPL households continued to receive subsidised food grainsthrough the TPDS whereas subsidies for APL households have been graduallyphased out.
The impact of these changes can be evaluated on several criteria includingselection into or exclusion from the TPDS, utilisation of PDS quotas, effect on theconsumption patterns and so on. Correct identification could mean that the
Correspondence Address: Reetika Khera, Centre for Development Economics, Delhi School of Economics,
University of Delhi, Delhi, 110007, India. Email: [email protected]
Journal of Development Studies,2011, 1–23, iFirst article
ISSN 0022-0388 Print/1743-9140 Online/11/000001-23 ª 2011 Taylor & Francis
DOI: 10.1080/00220388.2010.506917
Downloaded By: [Khera, Reetika] At: 01:55 8 March 2011

programme may have improved in terms of better targeted subsidies. Access tocheap food grain could make a more diversified and nutritious diet affordable forpoor households. Much depends, however, on the actual functioning of the PDS onthe ground.My fieldwork, conducted in Rajasthan, presented an intriguing picture of the
PDS. PDS grain was not much cheaper than market grain of similar quality.Further, in Rajasthan wheat is supplied through the PDS, but in six out of eightsample villages, the staple was maize or pearl millets (‘coarse cereals’). Yet, peoplewere desperate to have access to the PDS. Those who had APL cards complainedbitterly at being left out. Those with BPL cards made repeated trips to ration shopsthat were often quite far and queued in order to enjoy this small subsidy. In spite ofthis, they rarely got their full entitlement of 35kg. Having spent some time at rationshops, I noticed that they were often cheated by their PDS dealer. Those who wereaware of being cheated often complained to me, but did not protest in front of thePDS dealer.1
This article presents evidence related to the utilisation and impact of the PDSin Rajasthan. I find that though BPL cards have generally been given to thepoorer households in the sample, utilisation is low. Among those who have accessto the TPDS, one-third of the sample households do not utilise their quota at alland another half do not utilise their quota fully. Further, many of thesehouseholds purchase the same items from the market at higher prices. This puzzleof ‘under-purchase’ (purchasing less than one’s entitlement and yet purchasingfrom the market at a higher price) from the PDS is examined using a ‘dual-pricing’ model.The dual-pricing model provides a framework within which government
intervention in the wheat market and its associated problems can be analysed.However, in order to account for under-purchase from the PDS and related patterns,the standard dual-pricing model needs to be extended to take into account additionalfactors such as transaction costs, uncertainty, and quality variations. Possiblereasons for under-purchase from PDS in Rajasthan are examined in this extendedframework.There could be various reasons for low utilisation levels. Demand-side bottlenecks
include cash-flow problems (that is, households may not have cash when foodgrain isavailable in government ration shops), inappropriate foodgrains being suppliedthrough the PDS, and so on. There are also supply-side constraints in the form ofdiversion to the open market or just irregular functioning of ration shops. Variousaspects of the survey data, including the responsiveness of PDS purchases to marketprices, support the supply hypothesis – that is, households just buy what is suppliedto them. This is further corroborated by secondary data on diversion and fieldobservations. I estimate the extent of fraudulent diversion of PDS foodgrains for salein the open market, using official data on offtake and National Sample Survey dataon PDS purchase. I also present insights from field observations on how and whydiversion takes place.The article also examines the impact of the PDS on consumption patterns. While
the PDS does not have much impact on the level of cereal consumption, it seems toaffect the composition of cereal consumption. Specifically, the TPDS tilts cerealconsumption of households towards wheat (which is sold at a subsidised price
2 R. Khera
Downloaded By: [Khera, Reetika] At: 01:55 8 March 2011

through the TPDS), away from coarse cereals. This is possibly a matter of concern,since coarse cereals are generally more nutritious than wheat.
II. The Data
The field survey used in this article was part of a larger study aimed at studying thegovernment’s interventions for food security during a severe and prolonged droughtin Rajasthan (see Khera (2006) for details). Data were collected from a randomsample of 388 households in eight villages by means of a household and a villagequestionnaire. Apart from the background characteristics of the households andindividuals, the household questionnaire also included data on the severity of thedrought, coping strategies, the public distribution system, and food-for-workprogrammes. As I lived in the sample village or a neighbouring village during thefieldwork, data collection was supplemented by group discussions and informaldiscussions with various people in the villages, including village level functionaries.The village questionnaire was used to gather information on public (and other)amenities in the village and included a section for the PDS dealer.
Since the survey could not cover large parts of the state it was carried out in fourdistricts, purposely selected to reflect regional variations. The sample districts wereBarmer, Bikaner, Jaipur and Udaipur. These districts not only give a fair geographicspread, but also reflect agro-climatic variations and differing levels of development indifferent parts of Rajasthan.
Within each district, two villages were selected at random, using probabilityproportional to size sampling (after excluding villages with a population below 800or above 1,500).2 The sample villages are Biramsar, Dulmera Station, BaasriJogiyan, Sukaliya Morda, Kharad and Badli and Biroti.3 From these a randomsample of 400 households was chosen from the voter list of the village prepared bythe district authorities.
There were two rounds of fieldwork. The ‘baseline’ survey was conducted in May–December 2002 in all but one village (fieldwork in the remaining village wascompleted in February 2003). The ‘main’ survey was conducted in August–November 2003. The reference period for this round was from August 2002 to July2003 (that is, the previous 12 months).4
III. PDS: Targeting and Utilisation
Starting with a short discussion on who has access to the PDS, this section takes alook at the pattern of purchase of PDS grain by households that do have access. Thedistribution of ration cards is based on official guidelines issued in 1997. Theseguidelines had two sections. The first section pertains to those assets and consumerdurables, the ownership of which automatically disqualifies households fromeligibility for BPL cards. These include television sets, refrigerators, fans, two- orfour-wheelers, threshers, tractors, power tillers and more than five acres ofoperational landholdings. Families in which someone has a regular (salaried) jobor who live in pukka houses are also automatically disqualified. The second section ofthe questionnaire is for those households that have not been eliminated by the first setof criteria. This section of the questionnaire looks at their consumption expenditures.
India’s Public Distribution System 3
Downloaded By: [Khera, Reetika] At: 01:55 8 March 2011
Access
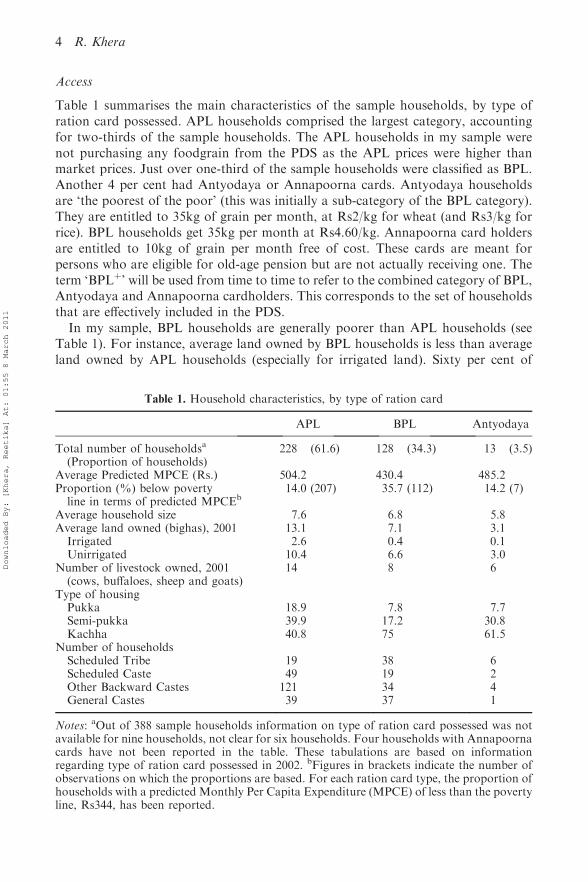
Table 1 summarises the main characteristics of the sample households, by type ofration card possessed. APL households comprised the largest category, accountingfor two-thirds of the sample households. The APL households in my sample werenot purchasing any foodgrain from the PDS as the APL prices were higher thanmarket prices. Just over one-third of the sample households were classified as BPL.Another 4 per cent had Antyodaya or Annapoorna cards. Antyodaya householdsare ‘the poorest of the poor’ (this was initially a sub-category of the BPL category).They are entitled to 35kg of grain per month, at Rs2/kg for wheat (and Rs3/kg forrice). BPL households get 35kg per month at Rs4.60/kg. Annapoorna card holdersare entitled to 10kg of grain per month free of cost. These cards are meant forpersons who are eligible for old-age pension but are not actually receiving one. Theterm ‘BPLþ’ will be used from time to time to refer to the combined category of BPL,Antyodaya and Annapoorna cardholders. This corresponds to the set of householdsthat are effectively included in the PDS.In my sample, BPL households are generally poorer than APL households (see
Table 1). For instance, average land owned by BPL households is less than averageland owned by APL households (especially for irrigated land). Sixty per cent of
Table 1. Household characteristics, by type of ration card
APL BPL Antyodaya
Total number of householdsa
(Proportion of households)228 (61.6) 128 (34.3) 13 (3.5)
Average Predicted MPCE (Rs.) 504.2 430.4 485.2Proportion (%) below povertyline in terms of predicted MPCEb
14.0 (207) 35.7 (112) 14.2 (7)
Average household size 7.6 6.8 5.8Average land owned (bighas), 2001 13.1 7.1 3.1Irrigated 2.6 0.4 0.1Unirrigated 10.4 6.6 3.0
Number of livestock owned, 2001(cows, buffaloes, sheep and goats)
14 8 6
Type of housingPukka 18.9 7.8 7.7Semi-pukka 39.9 17.2 30.8Kachha 40.8 75 61.5
Number of householdsScheduled Tribe 19 38 6Scheduled Caste 49 19 2Other Backward Castes 121 34 4General Castes 39 37 1
Notes: aOut of 388 sample households information on type of ration card possessed was notavailable for nine households, not clear for six households. Four households with Annapoornacards have not been reported in the table. These tabulations are based on informationregarding type of ration card possessed in 2002. bFigures in brackets indicate the number ofobservations on which the proportions are based. For each ration card type, the proportion ofhouseholds with a predicted Monthly Per Capita Expenditure (MPCE) of less than the povertyline, Rs344, has been reported.
4 R. Khera
Downloaded By: [Khera, Reetika] At: 01:55 8 March 2011
BPLþ households owned less than five acres of land, whereas only 4 per cent owned25 acres. Similarly, 30 per cent of BPLþ households were Scheduled Tribe (ST)households. Since STs comprised only 17 per cent of all households, they were ‘over-represented’ among BPLþ cardholders, in the factual sense that their share of BPLþ
cards was higher than their share in the population. The data point to an ‘over-representation’ of disadvantaged groups in the BPLþ category: those with little land,low levels of education, a low standard of living, etc., are more likely to be includedin the PDS.
To supplement the other markers of sustained economic disadvantage mentionedabove, we have also attempted to devise an indicator of economic status independentof the drought conditions that prevailed at the time of the survey. A two-stageprocedure is used for this purpose. The first step involves identifying the correlates ofmonthly per capita expenditure (MPCE) based on household-level data from thefifty-fifth round of the National Sample Survey (NSS) pertaining to 1999–2000.Using ordinary least squares (OLS), we can estimate the coefficients for thepredictors of MPCE (household characteristics such as land owned, education,gender of household head, etc.). The second stage combines these estimatedcoefficients with the characteristics of the sample households to calculate their‘predicted MPCE’.5 As Table 1 shows, predicted MPCE is lower for BPL households(Rs 430) than for APL households (Rs 504), confirming that BPL households aregenerally poorer than APL households. Given that inclusion and exclusion errors inthe selection of BPL households has been a concern, the findings here are significant.The data here suggest that the selection of households may not be as faulty as hasbeen claimed in many non-governmental organisation (NGO) and media reports.6
Utilisation
To what extent do BPLþ families utilise their PDS quota? Sample data show thatmany BPLþ households do not buy their entire quota of grain. On average, BPLþ
households bought 12.6kg of wheat from the PDS each month, as opposed to theirfull entitlements of 35kg per month. Many of the households that did not purchasetheir full quota were purchasing substantial quantities of grain from the openmarket, at prices higher than the official PDS price. This pattern does not fit in the‘dual pricing’ models commonly used to analyse the PDS. Section 2 focuses onpossible reasons for the co-existence of under-purchase from the PDS with marketpurchases.
In this section, we look at the utilisation of the PDS both in terms of theproportion of BPLþ households buying from the PDS and in terms of averagepurchases by BPLþ households. We shall also examine the impact of the PDS on thelevel and composition of foodgrain consumption.
We start with a comparison of the level, and composition, of cereal consumptionamong BPLþ and APL households. Average per capita consumption (kg) offoodgrains per month is not very different for BPLþ and APL households (seeTable 2a). It is 17.9kg for BPLþ households and only 300 grams less (17.6kg) forAPL households.
Further, on average, BPLþ households consume 10.5kg of coarse cereals percapita per month whereas APL households consume 11.0kg of coarse cereals
India’s Public Distribution System 5
Downloaded By: [Khera, Reetika] At: 01:55 8 March 2011

per capita per month. In the case of wheat alone, BPLþ households consume 7.4kgper capita per month and APL households consume slightly less, 6.6kg per capita permonth. The share of wheat in total cereal consumption among BPLþ households (41per cent) is higher than the share of wheat for APL households (38 per cent). This istrue for each of the survey districts (see Table 2a). To the extent that households withBPLþ cards are actually the poorer households, one would expect their consumptionof coarse cereals to be greater than that of APL households (since coarse cerealsare ‘inferior goods’ in India). This is not the case. The PDS seems to be increasingthe total cereal consumption of BPLþ households only marginally, while shiftingcereal consumption away from coarse cereals towards wheat (more on this insection 3).Moving on to utilisation levels of PDS quota, we find that BPLþ households were
purchasing only 37 per cent of their entitlement on average. Each BPLþ household isentitled to 35kg per month but the average monthly purchase was only 13kg in 2002–2003. Table 2b tabulates the proportion of households that buy the entire share ofPDS wheat, none of their PDS quota and those that buy some share of their PDSquota.Table 2b shows that only 13 per cent of BPLþ households used their entire PDS
quota of wheat in 2002–2003. Not a single one of these was a ST household. Morethan one-third of all BPLþ households bought nothing from the PDS. More thanhalf of such households (i.e. not buying at all from the PDS in 2003) were ScheduledCaste (SC) households; more than half were small and marginal farmers. Theremaining 50 per cent of BPLþ households bought something from the PDS but lessthan their full quota.
Table 2b. Distribution of BPLþ households, by use of PDS
Purchase from PDS 2001 2003
Bought nothing from PDS (Z¼0) 13.8 36.1Bought something from PDS (Z40 & Z5Z*) 56.6 50.7Bought full PDS quota (Z¼Z*) 29.7 13.0
Table 2a. Consumption of cereals (kg/capita/month)
BPLþ households APL households
All cereals Wheat1 All cereals Wheat
Barmer 22.3 5.0 (52) 25.8 3.3Bikaner 17.9 12.7 (34) 15.6 8.4Jaipur 15.9 10.4 (7) 15.6 7.5Udaipur 15.1 6.6 (49) 13.3 4.8All districts 17.9 7.4 (45) 17.6 6.6
Note: 1Figure in brackets gives the share of total wheat consumption that is bought from thePDS.
6 R. Khera
Downloaded By: [Khera, Reetika] At: 01:55 8 March 2011
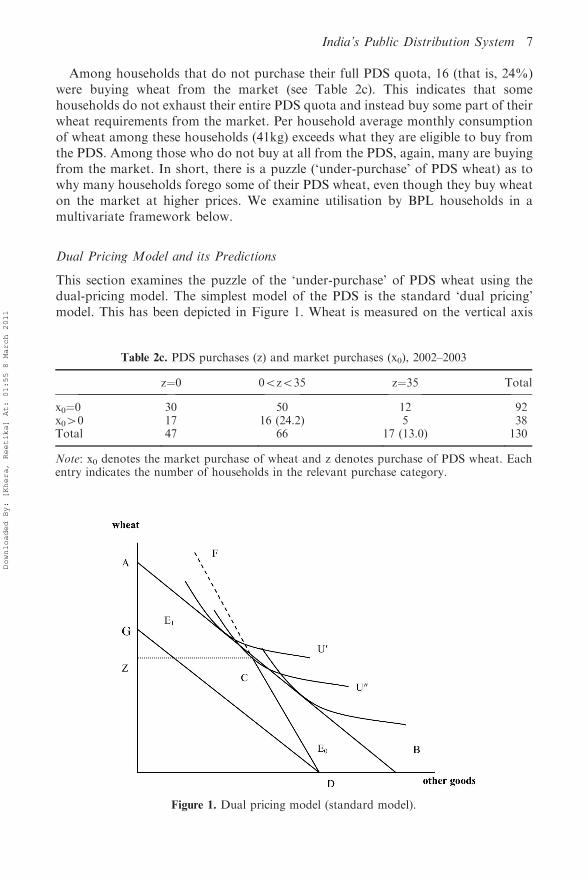
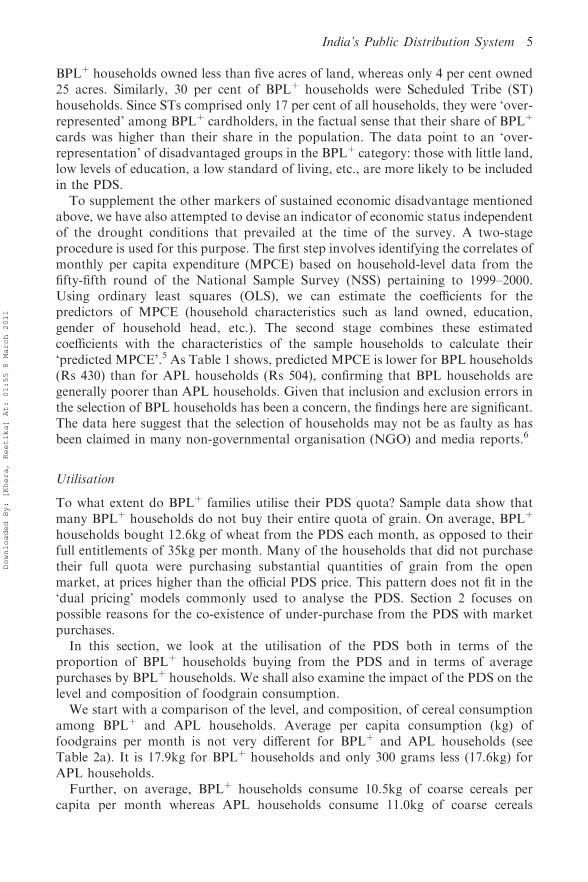
Among households that do not purchase their full PDS quota, 16 (that is, 24%)were buying wheat from the market (see Table 2c). This indicates that somehouseholds do not exhaust their entire PDS quota and instead buy some part of theirwheat requirements from the market. Per household average monthly consumptionof wheat among these households (41kg) exceeds what they are eligible to buy fromthe PDS. Among those who do not buy at all from the PDS, again, many are buyingfrom the market. In short, there is a puzzle (‘under-purchase’ of PDS wheat) as towhy many households forego some of their PDS wheat, even though they buy wheaton the market at higher prices. We examine utilisation by BPL households in amultivariate framework below.
Dual Pricing Model and its Predictions
This section examines the puzzle of the ‘under-purchase’ of PDS wheat using thedual-pricing model. The simplest model of the PDS is the standard ‘dual pricing’model. This has been depicted in Figure 1. Wheat is measured on the vertical axis
Table 2c. PDS purchases (z) and market purchases (x0), 2002–2003
z¼0 05z535 z¼35 Total
x0¼0 30 50 12 92x040 17 16 (24.2) 5 38Total 47 66 17 (13.0) 130
Note: x0 denotes the market purchase of wheat and z denotes purchase of PDS wheat. Eachentry indicates the number of households in the relevant purchase category.
Figure 1. Dual pricing model (standard model).
India’s Public Distribution System 7
Downloaded By: [Khera, Reetika] At: 01:55 8 March 2011

and other goods on the horizontal axis. In the absence of any subsidy, the budgetconstraint would be DG. If the government provides wheat at a subsidised price(say q) up to a certain quantity (say z*), the slope of the budget constraint (from D)is initially steeper, up to C, where there is a kink; thereafter the slope of the budgetconstraint is given by the market price (say p0).If ‘resale’ of the subsidised commodity is possible and costless, the effective
budget constraint is AB. The household would face exactly the same budgetconstraint if it enjoyed an income transfer equivalent to (B-D) and had to buy allits wheat from the open market. In other words, the PDS is equivalent to animplicit transfer of (B-D) and it is easy to show that B-D¼ (p0-q).z* (thedifference between market price and subsidised price, multiplied by maximumquantity).If resale is not possible, the same reasoning applies provided that the utility-
maximising choice involves consuming more than z*. Indeed, if the householdwants to consume more than z*, the no-resale constraint is not binding since thehousehold has no reason to sell something it wants to consume. The choice madewhen the household faces the kinked budget constraint ACD is exactly the sameas the choice it would make if it faced the budget constraint AB (which applieswhen resale is allowed); and this choice involves no resale. Therefore, here againthe PDS boils down to an implicit income transfer equal to B-D. It is only whenresale is not possible and the utility-maximising consumption of wheat is less than(or equal to) z* that the PDS ceases to work as a straightforward, implicitincome transfer.Formalising this argument based on the revealed preference approach, Deaton
(1984) shows that under the ‘no resale’ assumption a household buys:
a) less than its quota if
g x; q; pð Þ < z �
b) from the open market (in addition to the PDS quota) if
g xþ p0 � qð Þz�; p0; pð Þ > z �
andc) exactly its quota if
g xþ p0 � qð Þz�; p0; pð Þ � z� � g x; q; pð Þ
where z*, q and p0 are as before, p is the price of the non-food good and g is theMarshallian demand function for wheat.7
This model, however, does not explain why some households buy wheat from theopen market even when they are not using their full PDS quota. It also overlookssome important features of the PDS in Rajasthan (or for that matter in most ofIndia). These include: (1) transaction costs (for example, repeated trips to the rationshop); (2) diversion of wheat by the dealers for sale in the open market; (3) quality
8 R. Khera
Downloaded By: [Khera, Reetika] At: 01:55 8 March 2011

differences between PDS and open-market wheat; and (4) liquidity constraints(associated with the fact that the PDS quota has to be bought in a singleinstalment).8 Bringing these considerations in the model, aside from making it morerealistic, can help to explain the co-existence of PDS ‘under-purchase’ with marketpurchases.
Transaction costs are the result of uncertainty regarding when PDS dealers will lifttheir quota, the commodity that will be supplied, frequency of supplies, and lack ofawareness regarding entitlements under the PDS. For instance, villagers living in far-flung hamlets cannot find out beforehand whether the PDS shop will be open on anyparticular day, and whether the commodity they want to purchase will be available.Several trips (and consequent loss of wages) may be required to the ration shopbefore they can actually purchase wheat. Distance to the PDS shop also increasestransaction costs.
The liquidity constraint is yet another problem that villagers faced in purchasingthe full quota. The total cost of a month’s PDS quota is Rs161 which can be difficultto arrange at short notice. Given that the entire quota has to be bought in one‘instalment’, villagers often forego some part of their quota.
To capture some of these factors, the basic utility-maximisation problem of thedual-pricing model can be extended as follows:Max U(x0þ z,x)
s.t. (1) m� pxþ p0x0þ (qþ c).z (budget constraint)(2) z� 0 (non-negative PDS purchases)(3) z� (1-a).z* (quantity constraint on PDS purchases)(4) x0� 0 (no resale)
where x0 and x denote market purchases of food and non-food commodities(respectively); p0 and p are the corresponding prices; q is the official issue price ofPDS wheat; c is the ‘transaction cost’ (per unit) associated with PDS purchases; z* isthe official PDS entitlement; z denotes actual purchases from the PDS; m is lump-sum income; and a is the proportion of PDS wheat ‘diverted’ to the open market bythe ration dealer. The simpler model considered earlier can be seen as a special caseof this extended model, where c¼ 0 and a¼ 0.
Diagrammatically, transaction costs (captured in the parameter c) lead to an anti-clockwise ‘swing’ the lower portion of the budget constraint (CD in Figure 1),making it flatter, with D remaining where it is and C moving horizontally to the left.‘Diversion’ (captured in the parameter a) effectively lowers z*. For the time being, cand a are treated as exogenous. This seems appropriate when we consider theconsumption decisions of a particular household. Later on, we shall discuss how cand a might vary across households, or in response to market prices and othervariables.
There are three possible outcomes:
Að Þ z ¼ 0 no PDS purchaseð Þ:
This is always the case when qþ c4 p0, that is, transaction costs are such that PDSwheat is effectively more expensive than open-market purchase. In this case,
India’s Public Distribution System 9
Downloaded By: [Khera, Reetika] At: 01:55 8 March 2011

consumers have no reason to buy from the PDS. If qþ c5 p0, this outcome can ariseonly if a¼ 1 or x0¼ z¼ 0 (no consumption of wheat at all). Both are unlikely.
ðBÞ z ¼ z � full PDS purchaseð Þ
This requires qþ c� p0 (PDS cost no higher than market cost) and a¼ 0 (nodiversion). These conditions, however, are not sufficient, since a household maychoose not to buy the full PDS quota even if the PDS price is lower than the marketprice. In that case, however, it would not purchase from the market (x0¼ 0).
ðCÞ 0 < z < z � partial PDS purchaseð Þ
This, in turn, can happen in two ways:
(C1) a4 0, z¼ (1-a).z* and x0� 0 (quantity constraint on PDS)(C2) a� 0, z5 (1-a).z* and x0¼ 0 (voluntary under-purchase).
Thus, in this extended model, under-purchase may happen for two reasons. First, thehousehold may face a quantity constraint, because the dealer is diverting some of thewheat for open-market sale. Second, the household may not be interested inpurchasing the full quota, for example, because cheaper cereal substitutes (such asbajra) are available on the market.In the first case, the household may or may not purchase wheat from the market.
In the second case, there are no open-market purchases. In other words, in thisextended model the only way to explain the co-existence of PDS under-purchase andopen-market purchases is by invoking the notion of diversion-driven quantityconstraint in the PDS.
Figure 2. Dual pricing model (with non-linear transaction costs).
10 R. Khera
Downloaded By: [Khera, Reetika] At: 01:55 8 March 2011

Note, however, that non-linear transaction costs can also explain this ‘puzzle’.Indeed, if c rises with the quantity purchased (instead of being constant), theconsumer is likely to buy from the PDS up to the point where qþ c¼ p0, and beyondthat, to buy from the open market. This situation is illustrated in Figure 2. Suppose acard holder gets only 20kg on her first visit to the ration shop and getting theremaining quota of wheat requires a second trip. Such additional trips amount toraising the transaction costs.
The next question is whether it is possible to distinguish empiricallybetween C1 and C2, that is, whether ‘partial purchase’ from the PDS is dueto quantity constraints or voluntary under-purchase. If transaction costs arelinear (c is constant), the obvious way to distinguish between the two is to checkwhether or not x0¼ 0, that is, whether partial PDS purchase co-existswith market purchases. However, if transaction costs are non-linear (a plausiblehypothesis), this ‘test’ breaks down. An alternative approach is explored in thenext section.
IV. Data Analysis and Results
Using a multivariate framework, we explore two questions in the following sections.One, what effect does the PDS have on the level and composition of cerealconsumption, and two, what accounts for under-purchase of PDS wheat.
Variables Used in the Analysis
Table 3 lists the variables used in the analysis: consumption and purchase of cereals,prices and household characteristics. As we saw earlier, the average per capitaconsumption of all cereals and wheat for all households and BPL households is verysimilar. Market prices of cereals were collected during both field surveys. This is avillage level variable and is assumed to be constant across households in a village.The difference between the market price and the PDS price of wheat (‘diff’) was small– Rs1.1/kg on average.
Land owned by the household (in bighas), and ‘predicted’ MPCE (discussedearlier) have been included as measures of economic status of the household. Besidesthis, the type of housing has also been included as a marker of wealth – theproportion of households living in concrete houses (‘pukka’), semi-pukka and mudhouses (‘kachha’).
The proportion of households in which any member had a ‘regular’ job (‘reget’) isvery small in the sample – only 5 per cent. Further, the years of education of the mosteducated member of the household (‘mosteduc’) has also been included on the righthand side. As Table 3 reports, the mean of ‘mosteduc’ is six years. Finally there arefour caste dummies: Scheduled Castes (‘SC’), Scheduled Tribes (‘ST’), Jats and otherbackward castes (‘OBC’).
Level and Composition of Cereal Consumption
Patterns of PDS purchases and cereal consumption were discussed above. We notedfor instance that per-capita cereal consumption is approximately 2 per cent higher
India’s Public Distribution System 11
Downloaded By: [Khera, Reetika] At: 01:55 8 March 2011

for BPLþ households than for other households. It is worth taking a closer look atwhat influences the total consumption of cereals. In particular we are interested inthe question of whether access to the PDS has a statistically significant impact on thelevel or composition of cereal consumption.Table 4 presents OLS regressions of per capita cereal consumption, and per capita
wheat consumption, on various household and village characteristics. The dependentvariable is per-capita cereal consumption, in the first two columns, and per-capitawheat consumption, in the last two. On the right hand side, we have included villageand caste dummies, predicted MPCE, and education level of the most educatedperson in the family. In columns (a) and (c) we have added a dummy variable forpossession of a BPLþ card, and in columns (b) and (d), the actual purchase of PDSwheat.In columns (b) and (d), PDS purchases are treated as ‘exogenous’ as far as
households are concerned. This is consistent with the supply hypothesis, but not with
Table 3. Variables: Definition and mean
VariableDefinition and unit of
measurement
Mean
Allhouseholds
BPLhouseholds
Per capita cerealconsumption
Per capita consumption of allcereals (kg/month/person)
17.6 17.9
Per capita wheatconsumption
Per capita consumption ofwheat (kg/month/person)
6.9 7.0
PDS purchase ofwheat (‘WPDS03’)
Monthly purchase of wheatfrom PDS (kg/month/household)
4.7 12.6
Price difference (‘diff’) Difference between marketprice of wheat and PDS priceof wheat
– 1.1
Predicted MPCE (mpce2) Calculated using NSS 55thround data
475.1 430.4
Land (‘land’) Land owned, in bighas 26.4 17.9Type of house (‘htype’) ¼1 for pukka homes 2.4 2.6
¼2 for semi-pukka¼3 for kachha homes
Years of education(‘mosteduc’)
Years of education of thatmember of the householdwith most education
6.0 4.7
‘Regular’ employment(‘Reget’)
¼1 if any member of thehousehold has a regular job;0 otherwise
4.9 3.1
ScheduledCastes (‘SC’)
Dummy, ¼1 for Scheduledcastes; 0 otherwise
18.9 14.8
Scheduled Tribes (‘ST’) Dummy, ¼1 for Scheduledcastes; 0 otherwise
16.8 29.7
Other backwardcastes (‘OBC’)
Dummy, ¼1 for Otherbackward castes; 0 otherwise
33.2 25.0
Jats (‘Jats’) Dummy, ¼1 for Jats; 0otherwise
9.8 1.6
12 R. Khera
Downloaded By: [Khera, Reetika] At: 01:55 8 March 2011

the demand hypothesis (see next section), and the results should be interpreted in thislight.
Considering ‘cereal consumption’ first, the regressions indicate that predictedMPCE is significant in increasing per capita cereal consumption. Even if we control
Table 4. Per capita consumption of cereals and wheat
OLS: Per capita consumption(kg/month) of
Cereals Wheat
(a) (b) (c) (d)
BPL 0.56(0.50)
– 3.186***(3.55)
–
Wheat fromPDS(Wpds03)
– 0.042(0.90)
– 0.107***(2.6)
Years of education(mosteduc)
70.785***(76.39)
70.781***(76.03)
70.244***(72.58)
70.300***(72.89)
Land (in bighas) 0.013(0.84)
0.016(0.99)
70.021***(72.10)
70.194*(71.89)
Predicted MPCE(mpce2)
0.025***(7.76)
0.025***(7.49)
0.014***(6.46)
0.014***(5.87)
Scheduled Castes(SC)
1.295(0.98)
0.704(0.52)
70.067(70.07)
70.692(70.67)
Scheduled Tribes(ST)
71.584(70.91)
71.887(71.06)
70.684(70.65)
70.214(70.19)
Other OBCs(newobc)
2.448*(1.80)
2.351*(1.73)
1.81*(1.69)
1.52(1.39)
Jat(jat)
3.047*(1.90)
2.756*(1.76)
0.841(0.63)
0.204(0.16)
Village dummiesNegative andsignificant
Biroti, Baasri,Biram,Morda,Dulmera,Badli
Biroti, Baasri,Morda,Dulmera,Badli
– –
Positive andsignificant
– – Biroti, Biram,Baasri,Morda,Dulmera
Biroti, Biram,Baasri,Morda,Dulmera
Constant 12.72***(5.38)
12.75***(5.82)
74.12**(72.59)
72.42(71.62)
Observations 326 320 326 320F-stat 10.64 9.29 14.03 11.88R-squared 0.41 0.40 0.32 0.30
Notes: * significant at 10 per cent; ** significant at 5 per cent; *** significant at 1 per cent.Absolute value of t statistics, based on robust SE, in parentheses.Note on variables: ‘BPL’ is a dummy variable that takes the value 1 if the household has a BPLration card; wpds03 refers to the purchase of PDS wheat in 2002–2003; mpce2 refers to the‘predicted’ monthly per capita consumption expenditure. Other variables are defined as inTable 3.
India’s Public Distribution System 13
Downloaded By: [Khera, Reetika] At: 01:55 8 March 2011

for occupation (using occupation dummies), ownership of land, the influence ofpredicted monthly per capita expenditure remains positive and significant.On the other hand, higher levels of education appear to be associated with lower
levels of cereal consumption. This could be on account of two reasons. First, better-educated individuals may have less energy-intensive occupations and thereforeconsume less. For instance, educated persons are more likely to have access toregular employment where one would expect lower levels of physical activity.However, when occupational dummies are included, none of them are significantwhereas education remains negative and significant.Second, it is possible that education leads to a ‘diversification’ of diets away from
cereals towards more nutritious foods such as vegetables, dairy products, etc.Unfortunately it is not possible to test this hypothesis with the available data, since Idid not collect much information on non-cereal consumption.The most interesting findings however emerge from comparing the first two
columns in Table 4 with the last two columns. Comparing columns (a) and (c) tostart with, we find that the possession of a BPL card boosts per-capita wheatconsumption, but not per-capita cereal consumption. This suggests that access to thePDS ‘tilts’ cereal consumption away from coarse cereals towards wheat, withoutraising the level of cereal consumption. The same pattern emerges from acomparison of columns (b) and (d): higher PDS purchases are associated withhigher levels of wheat consumption, but not cereal consumption. This is disturbingbecause it suggests that access to the PDS squeezes consumption of coarse cerealswhich have a better nutritional content than fine cereals such as wheat and rice.9
Under-purchase and Quantity Constraints
In Section 2 we distinguished between two possible reasons for PDS under-purchase.First, under-purchase may be voluntary, and therefore driven by demand factorssuch as high transaction costs, the availability of coarse cereals, and so on. Second,PDS under-purchase may be due to supply-driven quantity constraints: householdsjust buy whatever is made available to them at the ration shop. For convenience weshall refer to these as the ‘demand hypothesis’ and ‘supply hypothesis’, respectively.One way of distinguishing between these hypotheses is to focus on the relation
between PDS purchases and the market price of wheat. If under-purchase is demand-driven, we would expect that household characteristics matter, and also a positiverelation between market price and PDS purchases: the more expensive wheat is onthe open market, the stronger the incentive to ‘switch’ from market purchases toPDS purchases. On the other hand, if PDS purchases are supply-driven, twoopposing effects operate as far as price responsiveness is concerned – the higher themarket price of wheat, the larger the profits PDS dealers can make by diverting PDSwheat to the open market. However, when price difference increases there is alsomore incentive for households to demand their rations.Panel 1 of Table 5 reports the OLS coefficients of a regression of per capita wheat
consumption (for all households and for BPL households only) on demand sidevariables. Suppose that the reason for under-purchase is that households areindifferent at the margin between PDS wheat and coarse cereals (such as bajra) thatare available on the market at a lower price. We would then expect that income
14 R. Khera
Downloaded By: [Khera, Reetika] At: 01:55 8 March 2011

Table
5.Dem
and-driven
‘under-purchase’
OLS:Per
capitaconsumptionof
wheat(kg/m
onth)
Wheatpurchase
from
PDS(m
onthly/hh)BPL
households
Panel
1Panel
2Panel
3:Quantile
regressions
Allhouseholds
BPL
households
OLS
Tobit
25th
quantile
50th
quantile
75th
quantile
Price
difference
(‘diff’)
––
17.03***
(2.41)
29.3***
(2.23)
1.69
(0.19)
17.93
(1.40)
32.77***
(2.30)
Squaredprice
difference
(‘diff_sq’)
––
75.87***
(2.71)
711.05***
(2.44)
70.86
(0.34)
75.67
(1.47)
710.39***
(2.22)
PredictedMPCE
(mpce2)
0.01***
(4.71)
0.02***
(5.30)
0.01
(0.79)
0.01
(0.71)
0.0
(0.0)
0.02
(1.22)
0.01
(0.35)
Years
ofeducation(‘mosteduc’)
70.34***
(3.36)
70.32***
(2.66)
0.22
(0.60)
0.42
(0.79)
0.02
(0.04)
0.30
(0.70)
0.26
(0.47)
Land(inbighas)
70.03***
(4.30)
70.04***
(2.76)
70.04
(0.72)
70.09
(1.21)
0.0
(0.06)
70.07
(0.57)
70.11
(0.87)
ScheduledCastes
(SC)
70.53
(0.55)
0.11
(0.08)
72.48
(0.65)
75.49
(71.02)
70.11
(0.02)
70.81
(0.10)
2.04
(0.35)
ScheduledTribes
(ST)
71.78**
(2.07)
71.52
(1.30)
74.86*
(1.67)
78.20
(1.50)
70.49
(0.13)
73.85
(0.82)
73.69
(0.65)
Typeofhouse
(‘htype’)
72.15***
(3.94)
73.29***
(4.51)
75.32***
(2.74)
77.26***
(72.61)
72.69
(0.97)
76.08
(1.45)
78.03***
(2.56)
‘Regular’em
ployment(‘Reget’)
6.50**
(2.20)
0.75
(0.48)
710.27*
(1.67)
716.84
(71.26)
0.60
(0.08)
719.16*
(1.70)
711.47
(0.88)
Constant
10.91***
(8.27)
16.84***
(7.79)
14.87*
(1.66)
11.45
(0.87)
7.89
(0.90)
10.02
(0.55)
19.22
(1.32)
Observations
372
122
98
98
98
Fstatistic/Pseudo-R
28.20
0.19
3.86
24.35
0.02
0.17
0.24
Notes:Absolute
valueoftstatistics,basedonrobust
SE,in
parentheses.*significantat10per
cent;**significantat5per
cent;***significantat1
per
cent.
Note
onvariables:‘D
iff’isthedifference
betweenmarket
price
andPDSprice
ofwheat(p
0-q);‘m
osteduc’refers
totheyears
ofeducationofthemost
educatedhousehold
mem
ber;‘land’refers
tothelandowned
(inbighas)bythehousehold;‘SC’,‘ST’are
dummyvariablesthattakethevalue1ifthe
household
isa‘ScheduledCaste’or‘ScheduledTribe’respectively;‘htype’refers
tothetypeofhousing;‘regular’isadummyvariablethattakes
the
value1ifahousehold
mem
ber
hasaregularjob.
India’s Public Distribution System 15
Downloaded By: [Khera, Reetika] At: 01:55 8 March 2011

increases are associated with an increase in PDS purchases, as households switchfrom coarse cereals (considered ‘inferior goods’ in India) to wheat. However, asPanel 1 of Table 5 indicates, even though wheat consumption does respond tohousehold characteristics such as education, land ownership, caste, and variousindicators of economic status, PDS purchases do not (Panel 2).In Panel 2 of Table 5, we look at PDS purchase (z) of wheat by BPL households,
using OLS and Tobit regressions. The reason for using a Tobit regression is that theobservations on the dependent variable, z, are censored.10 The first important pointto note about the results in Panel 2 is that the coefficient on none of the demand sidevariables (except type of housing) is significant. The only other coefficients that aresignificant in these regressions are the price variables (‘diff’ and ‘diff_sq’), which arepositive and negative respectively (discussed below).In the last three columns of Table 5 (Panel 3), I report the results of a quantile
regression of PDS purchase on the same demand side variables. The purpose of theseregressions is to look at what affects PDS purchase at different parts of itsdistribution. For the 25th quantile, the results show that none of the coefficients aresignificant – z is independent of household characteristics and price differences. Theprice coefficients for the median regression are similar to the OLS regression (whichis around the mean). However, in the median regression this result is not significant.It is only in the regression on the 75th percentile that the price difference issignificant.Consider the coefficients of ‘diff’ and ‘diff_sq’. The coefficient on ‘diff’ is positive
and significant, but negative and significant on ‘diff_sq’. This means that up to apoint, as the difference between PDS and market price increases, z increases.Thereafter PDS purchase decline with rising differences. Using the OLS estimates,the stationary point is at Rs2.89 (and at Rs2.63 in the case of the Tobitcoefficients).These findings should be interpreted in the light of the fact that two opposite
effects mentioned earlier: when PDS prices are much lower than market prices itmeans, on the one hand, that ‘diverting’ wheat from the PDS to the open market isparticularly lucrative for PDS dealers. On the other hand, it is also means that BPLhouseholds have a strong incentive to ensure that they get their full rations. As itturns out, PDS purchases by BPL households decline when the price differences are‘large’, suggesting that for large price differences the first factor dominates. This isprobably a reflection of the poor bargaining power that BPL households inRajasthan have vis-a-vis the ration dealers when the incentive to cheat increases. Insuch situations it is plausible that many BPL households just buy whatever thedealers give them, not protesting for fear of jeopardising future transactions with thesame PDS dealer. In other words, this means that the ‘supply hypothesis’ holds forBPL households in Rajasthan.The results in Table 5 suggest that (a) household characteristics do not matter, as
far z is concerned and (b) to the extent that z responds to the difference betweenmarket and PDS price of wheat, it initially increases with price difference, but thenhas a negative relationship with the price difference.Finally, it should be noted that even though a clear conceptual distinction can be
made between the demand hypothesis and the supply hypothesis, in practice acombination of the two is likely to be at work. For instance, consider the fact that ST
16 R. Khera
Downloaded By: [Khera, Reetika] At: 01:55 8 March 2011

households are consistently found to buy less wheat from the PDS than otherhouseholds. Within the ‘supply hypothesis’ framework, this could be interpretedas a reflection of the fact that ST households are particularly easy to cheat. Butthe same finding can also be interpreted in the ‘demand hypothesis’ framework,for example, in terms of the fact that ST households have a higher propensity toconsume coarse cereals than other households (partly as a matter of food habitsand partly because they often grow coarse cereals). In practice both factors arelikely to be at work. In this case, the two hypotheses are consistent with, andindeed reinforce, each other. Though it is hard to go any further in disentanglingthe demand and supply effects with the given data, the result that PDS purchaseresponds to price and not household characteristics combined with the sign onthe price variable suggests that the supply hypothesis holds. Further evidencefrom secondary data (the extent of diversion of PDS grain) and from fieldobservations (how and why ration dealers divert the grain) on the supplyhypothesis is presented below.
Corruption
Returning to the supply hypothesis, the extent of ‘diversion’ of PDS grain can bescrutinised from secondary data. There is evidence at the aggregate level that whatconsumers buy from the PDS is much less than what is officially supplied to them bythe central government.
The Ministry of Food and Consumer Affairs publishes monthly data on ‘offtake’of wheat and rice under the PDS. The term ‘offtake’ refers to the actual amountdelivered by the Food Corporation of India to state governments for the purpose ofdistribution through the PDS.
On the other hand, the NSS provides us with information on the quantities of PDSwheat and rice that are actually purchased by households. Using NSS data on per-capita monthly purchase of wheat and rice from the PDS, we can calculate theaggregate purchase of PDS foodgrain in each state. This total purchase can becompared with the corresponding ‘offtake’ figure for that state.11 If there is nosiphoning off, purchase figures should match ‘offtake’ figures. The difference betweenofftake and purchase gives us an estimate of the ‘diversion’ of PDS foodgrains to theopen market.12
Table 6 reports the estimated proportions of wheat and rice that were ‘diverted’from the PDS in 2001–2002, in each major state and for the country as a whole. Itturns out that two-fifths of the official PDS offtake failed to reach the consumers in2001–2002. There is, however, a sharp contrast between rice and wheat in thisrespect. Less than one-fifth (18.2%) of PDS rice was diverted, compared with morethan two-thirds (67%) of PDS wheat. This is associated with a clear north–southdivide in the performance of the PDS. In the primarily ‘rice-eating’ southern states,the proportion of foodgrain diverted ranged between 11 and 48 per cent. ‘Wheat-eating’ states are concentrated in the northern region, where diversion of foodgrainranged between 43 and 88 per cent.
The greater overall diversion of wheat than rice can be interpreted in two ways:one, that wheat is more profitable to divert than rice, or two, that there are otherfactors associated with regional characteristics which reduce the probability of
India’s Public Distribution System 17
Downloaded By: [Khera, Reetika] At: 01:55 8 March 2011

diversion of rice. In a given state, the diversion of rice is actually higher than that ofwheat in several cases (for example, Chhattisgarh, Madhya Pradesh and UttarPradesh). This suggests that the contrasts are essentially inter-state rather than grain-specific. Many southern states provide an additional subsidy (over and above thesubsidy provided by the central government) on PDS grain.13 So far as theprofitability of diversion is concerned, there are two factors which pull in oppositedirections. The larger subsidy increases the incentives for ration dealers to indulge inblack-marketing, but it also increases the incentives for PDS consumers to make surethat they get their share of PDS grain. What seems to be happening is that in thesouthern states the latter force is stronger, that is, consumers are more vociferousand unwilling to let go of their share of PDS benefits.14
Yet another fact to keep in mind is that the southern states generally have higherlevels of government accountability as well as a better record of implementingdevelopment programmes and welfare schemes. It is possible that the general social,cultural and other conditions that have created these relatively favourable standardsof governance in the southern states have also enabled them to run the PDS moreeffectively, and in particular, to avoid large-scale corruption.As part of my fieldwork, I interviewed the ration dealers in the sample villages.
These interviews led to interesting insights into the supply side of the PDS. After a
Table 6. Diversion of PDS grain, 2001–2002
Estimated proportion of grain ‘stolen’ from the PDS(%)
Rice Wheat Total
Andhra Pradesh 12 n/aa 11Orissa 21 n/aa 21Gujarat 36 27 30Himachal Pradesh 26 44 31Chhattisgarh 46 33 43Madhya Pradesh 51 46 47Karnataka 47 54 48Maharashtra 40 53 48J&K 54 79 61Delhi 72 65 67West Bengal 42 84 67Uttar Pradesh 77 67 70Assam 69 98 75Rajasthan n/aa 76 76Jharkhand 72 83 79Bihar 77 92 88INDIA 18b 67 39b
Notes: aNot applicable (zero or negligible offtake). bLower bound: some underestimation isinvolved due to lack of data on ‘local procurement’ of rice (outside the FCI system) in TamilNadu and a few other states.Source: Unpublished calculations by Dreze and Khera (2005). These estimates are obtained by‘matching’ official data on PDS offtake from the Food Corporation of India (FCI) withNational Sample Survey (NSS) data on household purchases from the public distributionsystem.
18 R. Khera
Downloaded By: [Khera, Reetika] At: 01:55 8 March 2011

brief description of how foodgrains are diverted by ration shop owners, I discuss theproblems faced by them in running the ration shop honestly.15
Ration dealers employ a simple mechanism for siphoning off PDS grain:irrespective of the actual quantity sold, in the official records the full quota (35kg)is recorded as being sold. The dealer either gets someone else to sign for them in theregister or coerces the ration card holder to sign or card holders who are illiterate arejust asked to put their thumbprint on these falsified records.
The wheat that is thus siphoned off from the month’s PDS quota, is either sold inUdaipur or in Gujarat where it fetches Rs6.50 per kg (as opposed to the governmentprice of Rs4.60 per kg). The ration dealer gets PDS wheat for Rs4.53 per kg. Bydiverting PDS wheat to the open market, the dealer makes up for the meagrecommission of 7 paise per kg. Thus, the dealer makes Rs1.97 per kg of PDS wheatand Rs4.50 per kg of Antyodaya wheat.16 With 35 Antyodaya cardholder in hispanchayat, the dealer can earn Rs2362.5 (15kg from each Antyodaya householdgives him 525kg to divert to the open market). In addition, the dealer has 200 BPLcardholders. This means that approximately 30 quintals of BPL wheat are siphonedoff, earning him a profit of Rs5910. Transporting the wheat to Gujarat (just acrossthe border), costs Rs300 per small truck. This gives a total of Rs7972.5 net of thetransport costs, from the black market.
However, the ration dealers are not entirely to blame. In Table 7 below, I havetried to reconstruct the balance sheet of this ration dealer from whom we got detailedinformation on costs and income from the ration shop. The last row of Table 7shows that if the dealer were to run the shop honestly he would make just over Rs100per month. Note that this ‘balance sheet’ does not include some other costs incurred
Table 7. Balance sheet of a ration dealer in Rajasthan
Rate Total
(a) CostsLabour (at most 2 labourers for 4 days) Rs 50/day Rs 400.0Rent for shopLoading and unloading
Rs 200/month Rs 200.0
Wheat Rs 2/sack Rs 200.0Sugar Rs 5/sack Rs 60.0
Transport (Bribe to the transporter) Rs 16/km Rs 160.0TOTAL Rs 1020.0(b) IncomeEarning from commission
Wheat Rs 0.07/kg Rs 390.0Sugar Rs 0.08/kg Rs 96.0Kerosene Rs 0.11/litre Rs 292.6
Sale of50kg sacks Rs 3.00/katta Rs 300.0100kg sacks Rs 10.00/bori Rs 60.0
TOTAL Rs 1138.6NET INCOME (a-b) Rs 118.6
Note: iThe dealer is paid only Rs8–9/km for transport whereas the actual cost is close toRs25/km. See Khera (2006)
India’s Public Distribution System 19
Downloaded By: [Khera, Reetika] At: 01:55 8 March 2011

by the ration dealer (such as the bribes that have to be paid to various officials in theFood Corporation of India (FCI) storage from where the grain is lifted).Part of the reason for such low incomes is the very low commission income that
dealers earn. Their main source of legitimate income is the sale of the gunny bags inwhich the wheat and sugar are supplied. Sugar is supplied in ‘boris’ (100kg gunnybags), whereas wheat is supplied in ‘kattas’ (50kg gunny bags). These sell for Rs10and Rs3 respectively.The main problems mentioned by dealers include: one, low commissions and
volume. Commissions paid to dealers are very small (for example, it was 7 paise perkg of wheat). Further, the introduction of the TPDS has meant that the volumehandled by ration dealers has shrunk by approximately 70 per cent. Two, corruption:at every step ration dealers have to pay some speed money – getting a license (forexample, one dealer claimed having paid Rs1300 unofficially), having the suppliesreleased from godowns. Most dealers complained that they are also cheated inweights – for every drum of 220 litres, they receive only 215 litres. Sacks of wheat aresometimes made wet so that they weigh more than the actual weight. Three, delaysand uncertainty: one ration dealer deposited money for wheat in July but had notreceived the supply of wheat till early October. If the quota is not lifted by aparticular date, he is fined Rs300. On the other hand, supplies to the godown areirregular and there is no mechanism for informing him when supplies arrive. Four,transportation losses: loss of grain and sugar in transport are not compensated for.Sacks of wheat and sugar arrive torn and leaking. Five, the ‘door to door’ deliverysystem: officially, the government is supposed to bear the transportation cost.However, in practice, dealers also end up paying transporters some money. This ispartly because the government does not have adequate trucks for the supplies. Thesupplies of each rationed good may have to be lifted from a different place. Dealershave to spend a considerable amount following up on supplies (four trips eachcosting Rs30 in one case).To some extent at least, however, these bribes are extracted from the PDS dealers
because it is known that dealers will ‘recover’ these eventually.
V. Conclusion
This article sheds light on various aspects of the working of the Targeted PublicDistribution System in Rajasthan. I find that access to the PDS is limited: only aboutone-third of the households have access to the PDS. Though there are conceptualproblems (such as uniform criteria for the entire country and a static view of ahousehold’s economic status) with the official criteria used for the selection of BPLhouseholds, I find that those who have BPL cards are among the poorer householdsin the sample.Turning to ‘utilisation’ of PDS quotas the picture is not so bright. Among those
who have access to the PDS (the ‘BPLþ’ households), utilisation levels are low.Utilisation is low both in terms of the proportion of households actually buyingsome grain from the PDS and also in terms of the quantity of grain they buy. Only13 per cent of BPL households in my sample were purchasing their full quota ofgrain. Worse, nearly one-third of the BPL households did not buy any grain from thePDS. Among those who did purchase grain from the PDS, the average monthly
20 R. Khera
Downloaded By: [Khera, Reetika] At: 01:55 8 March 2011

purchase was only 12.6kg, compared with a monthly entitlement of 35kg. In otherwords, BPLþ households were buying less than half of what they are entitled to, evenwhen they were buying.
Given that PDS prices are lower than market prices, one would expect that thePDS quota would be exhausted before buying costlier open market wheat. Asomewhat counter-intuitive finding is that some households forego some share oftheir entitlement and buy from the open market instead. We have distinguishedbetween two possible reasons for ‘under-purchase’ of PDS grain: the demandhypothesis and the supply hypothesis respectively. One way of distinguishingbetween these two hypotheses is to look at the relation between market price andPDS purchases. Operating within the limitations of econometric analysis, we findthat PDS purchase is sensitive to market price of wheat. There is an interestingrelationship between market price of wheat and purchase of wheat from the PDS –so long as the difference between the market and the PDS price is less than Rs2.6–2.9/kg, BPL households buy more as the market price increases. Increase in thedifference beyond this, reduces what BPL households buy indicating that the supply-hypothesis holds.
We also looked at evidence of corruption in the public distribution system fromsecondary data. At the all-India level, 67 per cent of wheat is siphoned off to theopen market. The levels of diversion of PDS grain are generally much higher in northIndia than in south India. As the discussion in Section 3 shows, ration dealers are notentirely to blame: commissions are low, corruption at a higher level is rampant andthe costs of running ration shops end up exceeding revenues generated. Thus,corruption has become a requirement of economic survival for the PDS dealers.
I also explore the effect of access to the PDS on the level and composition ofcereals of sample households. I find that access to the PDS does not have astatistically significant effect on total cereal consumption. However, access to thePDS significantly increases wheat consumption. It is not surprising that access tosubsidised wheat increases its share in the total cereal consumption. However, it isdisturbing that the increase in the share of wheat in total cereal consumption iscoming at the cost of coarse cereals. This is disturbing because coarse cereals aretypically more nutritious than wheat.
The TPDS in Rajasthan leaves much to be desired in terms of access, and whetherthe poor are able to utilise their quotas. However, the record of the PDS is notuniformly poor so as to warrant a junking of the entire system. As mentioned earlier,the PDS performs better in some of the southern states. Though BPL households inRajasthan may not gain much from the PDS, the situation is quite different in otherstates. These regional variations need to be probed further. Further, several field-based studies have observed that Antyodaya households appear to be moresuccessful in ‘demanding’ their PDS entitlements than BPL households, even thoughthe incentive to divert wheat from the Antyodaya quota is higher (and thesehouseholds often do not have much bargaining power).17 This is reflected even in mysample: the average purchase of PDS wheat by Antyodaya households in the sampleis 20.3kg compared with just 12.6kg for BPL households.
The recently elected government proposes to enact at Right to Food law in India.As the PDS is likely to form the backbone of such a law, understanding the contrasts
India’s Public Distribution System 21
Downloaded By: [Khera, Reetika] At: 01:55 8 March 2011
within the PDS, including the seemingly better performance of the Antyodayaprogramme, assumes immediate relevance.
Acknowledgements
Fieldwork in Rajasthan would not have been possible without funding from theUNDP and help from a number of people: host families in the survey villages; theNGOs who put me in touch with these families in these and other districts andmembers of the Akal Sangharsh Samiti. Thanks are due to Arudra Burra, JeanDreze, Bharat Ramaswami, Ben Rogaly, Rohini Somanathan and MadhuraSwaminathan for helpful discussions and comments on earlier drafts. I also thankan anonymous referee for extremely helpful suggestions to improve the article. Thisarticle builds on earlier work presented in my PhD thesis, ‘Public Intervention forFamine Prevention’, submitted to the Delhi School of Economics.
Notes
1. As a result, I was ‘requested’ by ration dealers to stop my fieldwork and leave the village on two
occasions.
2. A simple random sample of villages, irrespective of size, would give rise to bias in the estimates of
population characteristics. To get unbiased sample estimates for the population, employing
probability proportional to size sampling is recommended (see Deaton 1997: 15). Tiny (population
below 800) and large villages (above 1,500) were avoided to facilitate the fieldwork.
3. Birothi was the last accessible village on the road to the initial sample village which was inaccessible
due to flooding of the river. It is a replacement village.
4. Fieldwork was conducted to collect data on employment programmes and the PDS. The reference
period for data collection was based on the employment cycle of employment programmes.
Consumption data used in this article are from the main survey. Since there were only 16 households
less in the main survey compared to the baseline survey, issues related to attrition are ignored.
5. This approach assumes that the relationship estimated for Rajasthan as a whole using NSS data also
holds, approximately at least, in the sample villages. ‘Predicted MPCE’, estimated in this way, is at
best a statistical proxy for actual MPCE, and should be interpreted as such. Note that the predicted
MPCE is the pre-drought figure, unaffected by transfers to households during the drought.
6. Some studies have highlighted the conceptual problems with selection criteria (see Indrakant, 2000;
Swaminathan and Mishra, 2001; Hirway, 2003; Khera, 2008) raising concerns regarding targeting
errors.
7. See Deaton (1984) for a proof based on the revealed preference approach.
8. A fifth important feature of the PDS is uncertainty, for example, regarding opening hours of the ration
shop, the price that is likely to be charged, the quality of PDS wheat and so on. To some extent these
can be viewed as transaction costs.
9. See Gopalan et al. (1982) for further details.
10. The results of a Heckman two-step regression, to account for the fact that the sub-sample of BPL
households may not be a random sample, are not reported here for two reasons. First, the results are
similar to the OLS and Tobit results, and second, this procedure is not recommended in the case of
small samples (see Wooldridge, 2002; Kennedy, 2003: 291).
11. Since offtake figures are available on a monthly basis, aggregate offtake can be calculated for the same
reference period as in the NSS data.
12. The difference between offtake and purchase can only be accounted for by diversion and spoilage
because ration shops are not allowed to maintain stocks.
13. For instance, in Andhra Pradesh the government provides rice to all PDS cardholders at Rs5.50 per kg
which is below the central issue prices of Rs5.65 for BPL cardholders and Rs8.30 for APL cardholders.
Instead of providing 35kg per family per month, in Andhra Pradesh the entitlements are 4kg per
person per month.
22 R. Khera
Downloaded By: [Khera, Reetika] At: 01:55 8 March 2011

14. See Nag (1988) and Dreze (2004) for some independent evidence of this point.
15. I have relied on interviews with the ration shop owners in sample and non-sample villages. Another
telling fact is that I was ‘requested’ by ration dealers to leave the village in two instances during
fieldwork.
16. There is no commission for Antyodaya wheat.
17. See Dreze (2002), and Jain and Shah (2005).
References
Deaton, A. (1984) Household surveys as a data base for the analysis of optimality and disequilibrium.
Sankhya, the Indian Journal of Statistics, Series B, 46, pp. 1–23.
Deaton, A. (1997) The Analysis of Household Surveys: A Microeconometric Approach to Development
Policy (Baltimore: Johns Hopkins University Press).
Dreze, J. (2002) Ending destitution, The Hindu, 27 July.
Dreze, J. (2004) Democracy and the right to food. Economic and Political Weekly, 39(17), 24–30 April.
Dreze, J. and Khera, R. (2005) Diversion of grain from the PDS, unpublished calculations, Mimeo, Centre
for Development Economics, Delhi School of Economics.
Gopalan, C., Ramasastry B.V. and Balasubramanian, S.C. (1982) Nutritive Value of Indian Foods
(Hyderabad: National Institute of Nutrition, ICMR).
Hirway, I. (2003) Identification of BPL households for poverty alleviation programmes. Economic and
Political Weekly, 38(45), 8–14 November.
Indrakant, S. (2000) Food security and public support: a study of Andhra Pradesh, in: N. Krishnaji and
T.N. Krishnan (eds) Public Support for Food Security: The Public Distribution System in India (New
Delhi: Sage Publications).
Jain, J. and Shah, M. (2005) Antyodaya Anna Yojana and mid-day meals in MP. Economic and Political
Weekly, 40(48), 26 November–2 December, pp. 5076–5088.
Kennedy, P. (2003) A Guide to Econometrics (Cambridge, MA: MIT Press).
Khera, R. (2006) Public intervention for famine prevention. Doctoral dissertation, Delhi School of
Economics, University of Delhi, Delhi.
Khera, R. (2008) Access to the targeted public distribution system: a case study in Rajasthan. Economic
and Political Weekly, 43(44), 1 November.
Nag, M. (1988) The Kerala formula. World Health Forum, 9, pp. 258–262.
Swaminathan, M. and Mishra, N. (2001) Errors of targeting, public distribution of food in a Maharashtra
village, 1995–2000. Economic and Political Weekly, 30 June.
Wooldridge, J. (2002) Econometric Analysis of Cross Section and Panel Data (Cambridge, MA: MIT
Press).
India’s Public Distribution System 23
Downloaded By: [Khera, Reetika] At: 01:55 8 March 2011