
Journal of Consumer Research, Inc.eprints.aston.ac.uk/17612/1/Shining_in_the_Center.pdf · Journal...
20
Journal of Consumer Research, Inc. Shining in the Center: Central Gaze Cascade Effect on Product Choice Author(s): A. Selin Atalay, H. Onur Bodur, and Dina Rasolofoarison Reviewed work(s): Source: Journal of Consumer Research, (-Not available-), p. 000 Published by: The University of Chicago Press Stable URL: http://www.jstor.org/stable/10.1086/665984 . Accessed: 09/05/2012 11:38 Your use of the JSTOR archive indicates your acceptance of the Terms & Conditions of Use, available at . http://www.jstor.org/page/info/about/policies/terms.jsp JSTOR is a not-for-profit service that helps scholars, researchers, and students discover, use, and build upon a wide range of content in a trusted digital archive. We use information technology and tools to increase productivity and facilitate new forms of scholarship. For more information about JSTOR, please contact [email protected]. The University of Chicago Press and Journal of Consumer Research, Inc. are collaborating with JSTOR to digitize, preserve and extend access to Journal of Consumer Research. http://www.jstor.org
Transcript of Journal of Consumer Research, Inc.eprints.aston.ac.uk/17612/1/Shining_in_the_Center.pdf · Journal...

Journal of Consumer Research, Inc.
Shining in the Center: Central Gaze Cascade Effect on Product ChoiceAuthor(s): A. Selin Atalay, H. Onur Bodur, and Dina RasolofoarisonReviewed work(s):Source: Journal of Consumer Research, (-Not available-), p. 000Published by: The University of Chicago PressStable URL: http://www.jstor.org/stable/10.1086/665984 .Accessed: 09/05/2012 11:38
Your use of the JSTOR archive indicates your acceptance of the Terms & Conditions of Use, available at .http://www.jstor.org/page/info/about/policies/terms.jsp
JSTOR is a not-for-profit service that helps scholars, researchers, and students discover, use, and build upon a wide range ofcontent in a trusted digital archive. We use information technology and tools to increase productivity and facilitate new formsof scholarship. For more information about JSTOR, please contact [email protected].
The University of Chicago Press and Journal of Consumer Research, Inc. are collaborating with JSTOR todigitize, preserve and extend access to Journal of Consumer Research.
http://www.jstor.org
000
� 2012 by JOURNAL OF CONSUMER RESEARCH, Inc. ● Vol. 39 ● December 2012All rights reserved. 0093-5301/2012/3904-0013$10.00. DOI: 10.1086/665984
Please use DOI when citing. Page numbers are not final.
Shining in the Center: Central GazeCascade Effect on Product Choice
A. SELIN ATALAYH. ONUR BODURDINA RASOLOFOARISON
Consumers’ tendency to choose the option in the center of an array and the processunderlying this effect is explored. Findings from two eye-tracking studies suggestthat brands in the horizontal center receive more visual attention. They are morelikely to be chosen. Investigation of the attention process revealed an initial centralfixation bias, a tendency to look first at the central option, and a central gazecascade effect, progressively increasing attention focused on the central optionright prior to decision. Only the central gaze cascade effect was related to choice.An offline study with tangible products demonstrated that the centrally located itemwithin a product category is chosen more often, even when it is not placed in thecenter of the visual field. Despite widespread use, memory-based attention mea-sures were not correlated with eye-tracking measures. They did not capture visualattention and were not related to choice.
Consumers are exposed to horizontally presented arraysof products in various contexts, such as lunch combos
pictorially presented in the menu of a fast food restaurant,rows of snack bars in a vending machine, a selection ofbottled drinks at a buffet, or a selection of suggested moviesfrom an online service provider (see fig. 1). One of thedocumented effects when choosing from an array of prod-ucts is horizontal centrality: the option located in the centeris more likely to be chosen. For instance, Christenfeld(1995) demonstrated that people chose the middle optionin a number of different contexts, including choice of abathroom stall in a public restroom, choice of a toilet paperdispenser in the restroom, and choice among a row of
A. Selin Atalay ([email protected]) is assistant professor, department of mar-keting, HEC Paris, 1 Rue de la Liberation, 78351 Jouy-en-Josas (France).H. Onur Bodur ([email protected]) is associate professor, marketingdepartment, Concordia University, 1455 De Maisonneuve Blv. W., Montreal,QC, H3G 1M8 (Canada). Dina Rasolofoarison ([email protected])is assistant professor, marketing group, Aston Business School, Aston Triangle,Birmingham, B4 7ET (UK). The authors would like to thank Hans Baumgartner,Bianca Grohmann, Tim Heath, Mirko Kremer, Julien Schmitt, and Marc Van-huele for their feedback on this work. The authors are grateful to RajdeepGrewal, Margaret G. Meloy, and Rik Pieters for their guidance. The authorsthank the CMBBR labs for resources and support and Kimberly Duval, Yi Li,and Shiva Taghavi for their assistance in data collection.
Laura Perrachio served as editor and James Bettman served as associate editorfor this article.
Electronically published May 3, 2012
arbitrary symbols. In the same study, when choosingamong rows of a product displayed on a supermarket shelf,the middle option was preferred 71% of the time. Similarly,Shaw et al. (2000) showed that in making a choice amongan array of three alternatives, individuals consistently pre-ferred the middle option. This effect was replicated withhighlighters, surveys, and chairs.
Location-driven choice patterns have implications forretail shelf management and point-of-purchase decisions,among other consumer choice contexts. In efforts to un-derstand point-of-purchase decisions, researchers have fo-cused on the drivers (Chandon et al. 2009; Janiszewski 1998;van der Lans, Pieters, and Wedel 2008a, 2008b), strategies(Pieters and Warlop 1999), and stages (Clement 2007; Russoand Leclerc 1994; Russo and Rosen 1975) of the visualsearch process and have concluded that the ability of a brandto capture and hold consumer attention can be a source ofcompetitive advantage. In fact, using eye-tracking meth-odology, van der Lans et al. (2008a) demonstrated that com-petitive advantage on the shelf is generated mostly by in-store factors rather than out-of-store factors (e.g., searchgoals) with a ratio of 2 : 1. Similarly, Chandon et al. (2009)demonstrated that, at the point of purchase, the brand’s hor-izontal centrality on the shelf has a strong positive effecton brand choice. These findings call for a closer investi-gation of the effects of location on the visual search anddecision-making processes and its relevance to choice.
The current article, in two computer-based eye-tracking stud-ies and an offline lab experiment, progressively investigates

000 JOURNAL OF CONSUMER RESEARCH
Please use DOI when citing. Page numbers are not final.
FIGURE 1
ARRAY OF MOVIE SUGGESTIONS (FROM NETFLIX.COM)
how horizontal location affects choice. Visual attention is linkedto choice. Interestingly, other research corroborates the impactof horizontal centrality on choice (Valenzuela and Raghubir2009) but argues against an attention-based explanation. It issuggested that inferences made about the option in the hor-izontal center determine choice. Therefore, the current pro-ject investigates whether horizontal centrality affects (1)how much attention a brand gets, (2) the inferences madeabout the brand, and (3) whether these factors are relatedto the impact of horizontal shelf location on choice. Resultssuggest that the indirect impact of horizontal centrality onchoice is through visual attention. The indirect impact ofhorizontal centrality on choice through brand inferences wasnot significant. A gaze likelihood analysis (Shimojo et al.2003) was conducted to understand how visual attention isrelated to choice. The relationship between visual attentionand choice is not a result of an initial tendency to fixateon the center but is related to accelerated fixations in thefinal seconds of the gaze duration. The brand in the centerbenefits from a disproportionately more prominent gazecascade, which is coined the central gaze cascade effect.Given the widespread use of memory-based self-reportedmeasures of attention, the effects of horizontal centralityon self-reported measures of attention were also investi-gated. The results suggested that memory-based attentionmeasures and eye-tracking measures may be related to dif-ferent constructs. More specifically, in the current studies,memory-based attention measures (unaided recall, aidedrecall, and multi-item attention measures) did not capturevisual attention and were not related to choice. These find-ings were replicated (study 1B) with shelf displays shiftedoff the center of the visual field (i.e., the computer screen),confirming that the higher attention paid to the centrally
located option is not due to a tendency to look more atthe center of the computer screen. Extending the findingsto an offline choice context (study 2), it was confirmedthat the centrally located item within a product categoryis chosen more often even when it is not placed in thecenter of the shelf or the visual field. Taken together, find-ings emphasize the relationship between horizontal loca-tion, visual attention, and choice, as well as the criticalrole of eye-tracking measures in understanding the visualsearch and choice processes. Other possible explanations,including initial fixation bias, leader-driven primacy,leader-driven search focus, and marketplace metacogni-tions are discussed.
EXPLANATIONS FOR THE HORIZONTALCENTRALITY EFFECT ON CHOICE
Research in visual perception (Locher and Nodine 1973,1989) demonstrated that individuals have a propensity tolook longer at the axis of symmetry when exposed to asymmetric picture. To investigate whether the preferencefor symmetry leads to the horizontal centrality effect onchoice, Shaw et al. (2000) conducted an experiment inwhich participants were asked to choose a chair among arow of chairs that were all empty (balanced) or occupiedon one end (unbalanced). The preference for the chair in themiddle was prevalent in both conditions, ruling out the pref-erence for symmetry as an explanation. Shaw et al. (2000) alsoproposed increased attention as an alternative explanation be-cause the middle option is at the center of the perceptual field.Findings for the attention explanation, using a recall task tomeasure attention, were not conclusive; a call was made foradditional research (Shaw et al. 2000). In recent eye-tracking

CENTRAL GAZE CASCADE EFFECT 000
Please use DOI when citing. Page numbers are not final.
studies, Chandon et al. (2007, 2009) found that brands locatedin the (vertical and horizontal) center of a shelf display arenoted more and chosen more often, supporting an attention-based explanation. Valenzuela and Raghubir (2009) proposedthe center-stage effect as an alternative explanation. Accordingto Valenzuela and Raghubir (2009), consumers hold the laybelief that in retail contexts the products placed in central po-sitions are more popular, reflecting the overall quality of theproduct, which leads consumers to systematically prefer itemsin the center.
Note that Chandon et al. (2007, 2009) focused on visualattention as the explanation for horizontal centrality, but theydid not measure inferences made about the chosen brand.Valenzuela and Raghubir (2009, 2010) reported that the im-pact of horizontal location on choice is mediated by brandinferences but not by attention. They obtained these resultswith memory-based attention measures (e.g., recall). Extantresearch in eye tracking demonstrated that memory-basedself-reported measures do not reflect attention accurately inthe context of brand choice (Aribarg, Pieters, and Wedel2010; Chandon et al. 2007, 2009), and they concluded thatattention and recall are distinct constructs. In the context ofprint advertisement, Aribarg et al. (2010) documented thatconsumers falsely report having attended to a given ad whenthey have not. In short, the choice or lack of measures andthe distinction between the constructs can be the source ofinconsistent explanations provided for the horizontal cen-trality effect on choice. The current research investigatesthe role of each factor in explaining why horizontal cen-trality impacts choice, using multiple measures that tap ondifferent conceptualizations of attention (visual attention andmemory based) and inferences.
While the connection between inferences and choice isintuitive, could one expect horizontal centrality to lead tochoice through visual attention, independent of consciousand articulated brand inferences? Although this question hasnot been addressed specifically, the connection between ar-ticulated, conscious inferences and choice has been ques-tioned. First, individuals are not always able to identify andreport the processes that lead to their choices (Johansson etal. 2005; Nisbett and Wilson 1977). When asked to explainthe reasons why they have made a specific choice, individ-uals often provide reports on their cognitive processes thatare simply attributions made post choice (Nisbett and Wilson1977). These attributions tend to be biased such that havingmade a choice changes a person’s preferences (Sharot, Ve-lasquez, and Dolan 2010) to avoid or reduce dissonanceeffects (Festinger 1957). Second, individuals may makechoices without “declarative knowledge” or conscious in-ferences (Bechara et al. 1997; Shiv et al. 2005). Johanssonet al. (2005) presented participants with their choice andasked them to explain the reasons for their choice. In reality,participants were presented with the alternative they had notchosen and led to believe that it was their choice. Partici-pants failed to realize this change, pointing to a choice recallfailure. They also provided confabulatory reports whenasked to describe the reasons behind their choices. Congru-
ent with the somatic marker hypothesis, individuals observeand interpret their own choices to generate emotions thatserve as markers that affect their subsequent judgments (Be-chara and Damasio 2005; Bechara et al. 1997; Simion andShimojo 2006). These findings point to choice without ar-ticulated inferences.
More relevant to the link between visual attention andchoice, research in visual perception identified a crucial roleof visual attention in the final moments of the choice taskthat shapes individual’s preference for the eventually chosenalternative, independent of the effects of memory or priorpreferences (Shimojo et al. 2003; Simion and Shimojo 2006).Shimojo et al. (2003) provided gaze pattern analyses that helpin understanding the visual attention process behind choice.They found that the role of attention on preference for theeventually chosen option is rapid and concentrated in the finalfew seconds of the choice task. This reduces the utility ofmemory-based self-reported attention measures to understandthe process (Glaholt and Reingold 2011). Given the low sam-pling, speed, and accuracy of memory-based self-reports ofattention and the problems in introspective reports of choiceprocesses, more objective and accurate process measures arenecessary to understand the choice process (Russo 2011).Next, visual attention and its use as a process measure arediscussed.
VISUAL ATTENTION, CENTRALITY,AND CHOICE
Process tracing is critical in understanding the elements ofdecision making. Methods examining the process of infor-mation acquisition and decision making (see Kuhlberger,Schulte-Mecklenbeck, and Ranyard [2011] for an over-view), ranging from think-aloud procedures and verbal pro-tocols to skin conductance tests, have been used. Eye-track-ing procedures and Mouselab have been used to identify thestages, motivators, and determinants of the decision-makingprocess (Coupey, Bodur, and Brinberg 1998; Payne et al.1992; Pieters and Warlop 1999; Russo 2011; Wedel andPieters 2000; Willemson, Bockenholt, and Johnson 2011).In retail contexts, Chandon et al. (2007, 2009) suggest theuse of eye movements as an indicator of attention as theyare sensitive and objective.
In general, physiological response measures (Krugman1965) such as eye-tracking procedures are a reliable andobjective measurement of visual attention (Christianson etal. 1991; Deubel and Schneider 1996; Krugman et al. 1994;Rosbergen, Pieters, and Wedel 1997; Tsal and Lavie 1993;van der Heijden 1992; Wedel and Pieters 2000). Researchin neurology supports the link between attention and eyemovements (Kustov and Robinson 1996; Mohler and Wurtz1976). Eye movements on scenes are composed of fixationsand saccades (Rayner 1998). Fixations are the brief momentsin which the eye is stable and information is extracted fromthe scene. Saccades are movements of the eyes that lastabout 20–40 milliseconds (Matin 1974; Rayner 1998; Pie-ters and Wedel 2008). During a saccade, vision is suppressed
000 JOURNAL OF CONSUMER RESEARCH
Please use DOI when citing. Page numbers are not final.
(Matin 1974; Rayner 1998), and the eye is redirected to anew fixation (van der Lans et al. 2008b). A fixation lastsabout 200–400 milliseconds on average and in generalranges between 50 milliseconds to a second (Pieters andWarlop 1999; Rayner 1998). Eye fixations are instrumentalin acquiring information from the perceptual field (Anstis1974; Sanders and Donk 1996). For example, in reading,typically, relevant information is acquired during the first50–70 milliseconds of a fixation (Rayner 1998), while inviewing web pages visual attention can be assessed within50 milliseconds (Lindgaard et al. 2006). Recent research inad perception documented that an ad can be perceived in asingle fixation of less than 100 milliseconds. Consumers canidentify what they are looking at (an ad vs. editorial material)even when the information presented is deliberately blurred(Pieters and Wedel 2012). These findings are consistent withresearch in visual perception. In brief, with 90% accuracy,briefly presented images of natural scenes (e.g., beach, for-est) can be identified (Castelhano and Henderson 2008;Rousselet, Joubert, and Fabre-Thorpe 2005). Grill-Spectorand Kanwisher (2005) found that 65 milliseconds wereneeded to identify an object with accuracy, while there wereno differences in detection and categorization at 17, 33, 50,68, or 167 milliseconds. Individuals were accurate in de-tecting and categorizing typical objects in each time frame.Both reached a ceiling of 90% accuracy after 80 millisec-onds of single exposure. The sequence of fixations (gazepattern) also provides information about the visual searchprocess (van der Lans et al. 2008b). In this respect, visualattention is a systematic process that is accessed via thestudy of eye movements: eye fixations, saccades, and gazepatterns and durations (Christianson et al. 1991; van derHeijden 1992; van der Lans et al. 2008b).
Visual Attention and Choice
Attention is involved in all marketing efforts (Milosavljevicand Cerf 2008). Visual attention, captured through eye move-ments, is a significant predictor of brand choice (Maughan,Gutnikov, and Stevens 2007; Pieters and Warlop 1999). Recentevidence suggests that looking at an item for longer can leadto higher choice likelihood (Armel, Beaumel, and Rangel 2008;Krajbich, Armel, and Rangel 2010). In a binary choice taskbetween familiar options, individuals were more likely tochoose the snack food option that they looked at more, aftercontrolling for preexisting preferences for each option (Krajbichet al. 2010).
In visual research, Shimojo et al. (2003) demonstratedthat just prior to the choice there is a progressively increasingbias in the likelihood that the observer’s gaze will be di-rected toward the chosen stimulus; they termed this the gazecascade effect. Particularly, individuals display an “ava-lanche of fixations on the to-be-chosen object” in the finalseconds of the gaze duration (Changizi and Shimojo 2008,1512). In explaining this effect, Simion and Shimojo (2006)argue that the gaze pattern is intrinsically involved in pref-erence formation by way of a dual process with a feedbackloop: the more the individuals look at a stimulus, the more
they like it, and the more they like it the more they look atit. This dual process shapes the preference for the eventuallychosen option. Although the gaze cascade effect addressesthe link between choice and final gaze patterns, no argumenthas been made about the role of the location of the choiceoptions, namely, horizontal centrality on the gaze cascadeeffect.
Centrality Bias in Visual Attention
In general, eye fixations are directed at the informativeelements of a scene (Antes 1974; Buswell 1935; Mack-worth and Morandi 1967; Parkhurst, Law, and Niebur2002; Russo 2011; Yarbus 1967). When a scene appears,the natural initial response is to look at the center of it;this has been called the central fixation bias (Tatler 2007;Tatler, Baddeley, and Gilchrist 2005). The central fixationbias occurs regardless of how the informative features ofthe scene are distributed (Tatler 2007). Two main reasonsmotivate this bias. First, the center of the scene is uncon-sciously considered the optimal location to extract infor-mation as individuals expect to find informative elementsat this location even when there is none. This is referredto as the photographer bias and is observed when indi-viduals have had no previous exposure to the scene (Tsenget al. 2009). Second, there is a predisposition, called theorbital reserve, that is an innate preference for eye move-ments that place the pupils in the central position (lookingstraight ahead) rather than elsewhere (Pare and Munoz2001). This causes a re-centering bias to emerge as soonas the pupils leave the central position. Independent of thecause, individuals are predisposed to look at the center ofa given visual field (Ho-Phuoc, Guyader, and Guerin-Du-gue 2010). Therefore, the tendency to look more at thecenter could explain the horizontal centrality effect onchoice. The current research investigates the links betweencentral fixation bias, gaze cascade effect, and horizontalcentrality in a consumer choice context. Note that the hor-izontal centrality effect is relevant when the number ofalternatives is greater than two, yet earlier research dem-onstrating the gaze cascade effect focused on binary choicesets.
METHODOLOGY
Overview
Using an eye-tracking methodology, studies 1A and 1Bexplored the effect of horizontal centrality on choice like-lihood and how this effect is linked to increased visual at-tention and/or inferences. These studies also examined theprocess of visual attention and how it is involved in thechoice process. Study 2 extended the generalizability of thefindings to an offline context.
CENTRAL GAZE CASCADE EFFECT 000
Please use DOI when citing. Page numbers are not final.
Pretest
In order to test the effect of horizontal centrality on brandchoice, a number of steps were taken to control for extra-neous factors that could affect brand choice, such as brandfamiliarity, experience with product category, or visual fea-tures of each brand in the display. A pretest was conductedto develop a planogram, resembling a retail store shelf dis-play, with brands that are not different from each other interms of brand familiarity, purchase likelihood, and brandinferences, such as quality or expertise.
In order to eliminate brand familiarity, fictitious brandnames were created. A search of secondary data confirmedthat none of these or similar brand names were used in fast-moving consumer goods (FMCG) markets available to thetarget population at the time of data collection. The brandswere presented in box packages that included the brandname and product information.
To improve external validity and to create realistic dis-tinctions among the brands, as in retail environments, adifferent background color was used for each brand package.Brighter areas (packages with higher luminance) may in-crease the readability of brand information (van der Lanset al. 2008a). A pretest was conducted to select differentbackground colors and to eliminate potential effects of thebackground color on readability. Participants completed thepretest (N p 58) as part of a larger unrelated PC-basedstudy using SSiWeb. Ten different colors were developedusing the HSL (hue, saturation, luminosity) color format,changing only the hue dimension of the color to assure thatall colors were matched on color contrast. Each color patchwas presented with the brand name and attribute informa-tion, as they would appear in the planogram, using the samefont color (black). Participants were asked to rate the read-ability of the information on each patch on a 7-point scale(1 p easy to read, 7 p difficult to read). After comparingthe readability scores of each color, three colors that did notvary on readability (all t ! .84, p 1 .10) were chosen, andthese were applied as background colors for each brand.
STUDY 1A
Participants
Sixty-seven undergraduate students at HEC Paris partic-ipated in this study for extra credit. After eliminating fourparticipants due to technical problems in eye tracking andincomplete measures, the analyses were conducted with theremaining participants (N p 63). The average age was 20.4(SD p 0.8), and 54% were females.
Design and Procedure
Each participant was seated in front of a Tobii 1750 eye-tracker. The Tobii 1750 eye-tracker screen is 17 incheswide, with a resolution of 1,280 # 1,024 pixels and afrequency of 50 hertz (hz; i.e., the screen is refreshed 50times per second). As participants view the stimuli shown
on the screen, a discreet infra-red camera—located belowthe screen—records participants’ eye gaze unobtrusively.This camera tracks the exact location of eye fixations onthe screen at any moment. Prior to any recording, the eye-tracking device is calibrated. In the calibration phase, eachparticipant is asked to follow a series of blue dots movingalong the screen. Participants can wear reading glasses orcontact lenses. They are free to move their heads freelywithin a region of 30 centimeters # 15 centimeters # 20centimeters and a distance of 60 centimeters from thescreen. There are no physical restrictions on head gear.After the calibration phase, participants reviewed the stim-uli. Viewing time was not constrained. Vitamin supple-ments and meal replacement bars were used as the stimuli.Each participant reviewed two product categories, made achoice, and responded to a questionnaire. The order of theproduct categories was randomized.
Stimuli
Participants were presented with two separate planograms(3# 3 matrix design). The brands were organized in col-umns to isolate the effect of horizontal position. Each brandhad an equal number of facings (three). Specifically, therewere three variants of each brand. The presentation of eachbrand was counterbalanced across columns to isolate theeffect of horizontal centrality from potential brand effects.The brand names used were fictitious: Priorin, Alpecin, andLabrada for vitamins, and Bega, Niran, and Salus for mealreplacement bars.
Participants were asked to carefully review each producton the screen as if these were on the store shelf and to hitthe enter key when they were done reviewing and were readyto make a choice. Once the participants hit the enter key,the stimulus disappeared from the screen, ensuring that anyfurther visual processing is stopped, and participants indi-cated their choice. Upon completion of the choice task, asurvey measuring evaluations of the brands was adminis-tered.
More specifically, participants were asked to indicate theoption they chose by checking the box that matched theposition of the product on a 3 # 3 matrix that mirrored theplanogram. Participants were also asked to write the nameof the brand they chose. This was followed by the mea-surement of the inferences made about each brand, includingthe ones not chosen. The inference measures were adoptedfrom earlier research that found that the effect of horizontalcentrality on choice is through brand inferences (Valenzuelaand Raghubir 2009). These measures were obtained at thebrand level instead of the brand-variant level. Consumersare more likely to form inferences about brands rather thanvariants (Cowley and Mitchell 2003; Keller 1993). In ad-dition, obtaining measures for all nine brand variants in theplanogram would significantly increase the demands on theparticipants and hinder the quality of the measures.
More specifically, the inference measures included quality(1 p low quality and 9 p high quality), popularity (1 plow and 9 p high), and attractiveness (1 p not at all and

000 JOURNAL OF CONSUMER RESEARCH
Please use DOI when citing. Page numbers are not final.
9 p extremely) ratings. Participants were next asked toindicate how much “market share” each brand had in theproduct category and how much “retail space” they wouldallocate to each if they were a store manager, using a con-stant sum scale. These two measures assessed whether par-ticipants thought other consumers would find the brand at-tractive (Valenzuela and Raghubir 2009). Participants alsoindicated how much attention they think each brand andpackage captured, using two items, both on 9-point scales(1 p no attention and 9 p full attention).
In addition to this interval-level brand-specific attentionmeasure, to compare memory-based attention measures withvisual attention measures, unaided and aided recall measuresrelated to the choice task were included following the in-ference measures. First, an unaided recall measure askedparticipants to write the name of the brand they chose. Next,an aided recall measure asked participants to check thebrand they chose from the list of brands provided. Finally,participants responded to questions related to product cat-egory familiarity, marketplace metacognitions (i.e., lay be-liefs about shelf location), purchase history, and demo-graphics.
Results
Horizontal centrality had an impact on visual attention.The brands in the horizontal center received more frequenteye fixations, and overall they were looked at longer (totalduration) over the course of the entire search process. Toensure information acquisition per each fixation, fixationsthat lasted less than 100 milliseconds were eliminated (Pie-ters and Wedel 2012). The results did not change whenfixations below a 200-millisecond cutoff were eliminated.This is consistent with Pieters and Wedel’s (2012) findingthat information extracted from a fixation does not improveabove 100-millisecond fixations.
Overall, on each alternative in the planogram, there weremore than two fixations; each brand variant was noted andreexamined. Next, the distributional properties of fixation fre-quency and duration data were observed. Given the count na-ture of fixation frequency, Freeman-Tukey transformation wasused to satisfy normality assumption (Bar-Lev and Enis 1988;Freeman and Tukey 1950). For total fixation duration, a naturallog transformation was used (Willemsen et al. 2011). After thetransformations, both visual and formal tests of the transformedvariables indicated that the normality assumption was satisfied.These transformed measures were used in the subsequent anal-yses.
Results of an ANOVA revealed a significant effect ofhorizontal centrality on visual attention captured by the eye-tracking measures and choice but not on the brand inferencesthat were measured or memory-based attention measures( p 1 .10). Specifically, in total, brands in the horizontalcenter received more frequent eye fixations (60.9 vs. 48.7;F(1, 375) p 13.47, p ! .01, partial h2 p .035). Overall,they were also looked at longer, as indicated by the totalduration of fixations on each brand (15.1 seconds vs. 12.6seconds; F(1, 375) p 5.37, p ! .05, partial h2 p .021). A
logistic regression analysis with choice as the dependentvariable and left (1 p left, 0 p right) and center (1 pcenter, 0 p otherwise) as the independent variables (b p.76, Wald x2(df p 1) p 8.01, p ! .01) revealed that beingin the horizontal center improved the choice likelihood.Overall, horizontal centrality increased choice frequency by18.0%. A brand located in the center had a choice frequencyof 45.3%, whereas a brand that was not in the center hada choice frequency of 27.3%. Being at the left or right ofthe display did not affect choice (b p �1.61, Wald x2 (dfp 1) p .32, p 1 .10). To verify that the brand names didnot lead to any biased evaluations, brand name was includedas a control variable, and brand name did not have an effecton choice (p 1 .10).
Next, a multiple mediation analysis was conducted toexamine if attention and/or brand inferences were involvedin the process of the horizontal centrality effect on choice.A multiple mediation analysis was conducted with multiplemediators included in a single model using a nonparametricbootstrapping strategy (Preacher and Hayes 2008). Brandchoice (1 p brand chosen, 0 p otherwise) was the depen-dent variable. The independent variables related to horizon-tal shelf location were center and left.
As explained earlier, various brand inference measureswere collected upon completion of the choice task. An ex-ploratory factor analysis revealed that the brand inferencemeasures loaded on two separate dimensions. Quality, pop-ularity, and attractiveness of the brand represented one di-mension, and market share and retail space allocation of thebrand represented a second dimension, explaining 76% ofthe total variance in inferences. The first dimension reflectsindividual inferences, while the latter reflects consumers’inferences about how the market would evaluate the brand.Two composite inference indexes were created by averagingthese items: individual inferences and market-level infer-ences. Both individual inferences (a p .81) and market-level inferences (r p .75) were included in the mediationanalysis as separate mediators. Visual attention, measuredusing the total duration of eye fixations on each brand, wasincluded as the third mediator. Finally, the two self-reporteditems that assessed the attention each brand captured wereaveraged into a composite score as the memory-based mea-sure of attention (r p .90). This index was included as thefourth mediator.
The multiple mediation analysis was conducted usingSPSS macro modules with bootstrapping of 5,000 samples(Preacher and Hayes 2004). Horizontal centrality signifi-cantly increased the total duration of fixations on the brand(a path, b p.20, t p 2.04, p ! .05; see table 1). There wasno significant effect of horizontal centrality on individualinferences, market-based inferences, or memory-based mea-sures of attention (a′ path, all p 1 .10). More relevant resultsof the test are bootstrapping results for the indirect effects.The indirect effect of horizontal centrality on choice throughvisual attention (total duration of fixations on the brand) wassignificant (p ! .05), indicated by a 95% confidence intervalthat did not include zero. However, the indirect effects of

CENTRAL GAZE CASCADE EFFECT 000
Please use DOI when citing. Page numbers are not final.
TABLE 1
STUDIES 1A AND 1B: MEDIATION OF THE HORIZONTAL LOCATION–BRAND CHOICE RELATIONSHIP
Study 1A Study 1B
Coefficient t-value p-value Coefficient t-value p-value
A. Horizontal center r mediators (a paths):Attention (eye tracking) .20
(.10) 2.04 ! .05.25
(.13) 1.90 .06Attention (self-reports) .04
(.21) .20 .84.44
(.26) 1.67 .10Brand inferences (individual) .03
(.17) .19 .85.27
(.20) 1.29 .20Brand inferences (market) �.66
(.17) �.56 .572.67
(1.60) 1.67 .10B. Mediators r brand choice (b paths):
Attention (eye tracking) .33(.15) 2.22 ! .05
.53(.27) 2.01 ! .05
Attention (self-reports) �.10(.10) �1.04 .30
�.05(.13) �.37 .71
Brand inferences (individual) .32(.12) 2.61 ! .01
.13(.17) .75 .45
Brand inferences (market) .04(.01) 3.23 ! .01
.09(.02) 4.32 ! .01
C. Center r brand choice (c′ path)Center .88
(.24) 3.63 ! .01.60
(.36) 1.66 .10D. Center r brand choice (c path)
Center .84(.23) 3.66 ! .01
.76(.32) 2.36 ! .05
E. Boot sampling results for indirect effects (a # b paths)
Data Bootstrap Bias SE 95% CI
Study 1A:Attention (eye tracking) .066 .068 .002 .047 [ .01, .19]Attention (self-report) �.005 �.007 �.002 .034 [�.11, .04]Brand infererences (individual) .011 .012 .001 .063 [�.11, .16]Brand infererences (market) �.024 �.025 �.001 .047 [�.14, .06]
Study 1B:Attention (eye tracking) .130 .147 .017 .107 [.01, .41]Attention (self-report) �.022 �.027 �.001 .080 [�.26, .09]Brand infererences (individual) .034 .035 .001 .078 [�.07, .28]Brand infererences (market) .253 .274 .021 .187 [�.06, .68]
NOTE.—Dependent variable is brand choice. Attention is represented by natural log transformed total duration of fixations on the brand. Results withtotal number of fixations (fixation frequency) using 100-millisecond or 200-millisecond minimum cutoff levels are similar. Measures of fit for the modelmeasures for study 1A are McFadden p .101, CoxSnell p .120, Nagelkerke p .167. Measures of fit for study 2B are McFadden p .180, CoxSnellp .205, and Nagelkerke p .285. Standard errors are in parentheses.
horizontal centrality on choice through individual-level in-ferences, market-level inferences, and memory-based atten-tion were not significantly different from zero (at p ! .05;see table 1). When the same mediation analysis was repli-cated with total number of fixations on the brand (fixationfrequencies) as the visual attention measure, the results weresimilar. Combined, these findings showed that the positiveimpact of horizontal centrality on choice is related to visualattention but not the brand inferences assessed in the currentstudy. The results also suggested that self-reported measuresof attention are not related to choice. Comparison of visual-and memory-based attention measures are revisited later.
Participants also indicated their likelihood of purchasingeach brand. The same multiple mediation analysis was re-peated with purchase likelihood as the dependent variable.The results were similar to those with brand choice. Hori-
zontal centrality had a significant impact on visual attention,as measured by the total duration of fixations on the brand(p ! .05) but not on brand inferences or memory-basedattention (both p 1 .05). The bootstrapping results revealedthat the indirect effect of horizontal centrality on choicethrough total duration of fixations on the brand was signif-icant (p ! .05). Neither individual-level nor market-levelinferences nor memory-based attention revealed a signif-icant indirect effect of horizontal centrality on choice. Theresults with purchase likelihood as the dependent variableusing the same mediators were consistent when the totalnumber of fixations on the brand was used to capture visualattention.
The mediation analysis was repeated with left as the in-dependent variable. There were no significant effects of lefton any of the mediator variables with vitamins and meal

000 JOURNAL OF CONSUMER RESEARCH
Please use DOI when citing. Page numbers are not final.
replacement bars (all p 1 .10). The indirect effects based onbootstrapping results were not significant. The results withleft as the independent variable were similar when eithertotal duration or total number of fixations on the brand wereused to capture visual attention and when choice or purchaseintention was used as the dependent variable. These resultsfurther demonstrate that the horizontal center of the plan-ogram, not the edges, receive more visual attention.
Although the mediation analyses revealed that the visualattention that a brand receives is related to the effect ofhorizontal centrality on choice, it is not clear how. Twoexplanations about the visual attention process, both relatedto the timing of visual attention, are plausible. It could bethe initial fixations clustered in the center of the display and/or the final fixations that merge into a gaze cascade thatinstantiate the observed choice for the item located in thehorizontal center. Earlier research in eye tracking has iden-tified that people have a tendency to focus on the centrallocation in a scene in the first few fixations before they lookat other locations as the initial central fixation provides anoptimal location for extracting the maximum amount of in-formation from the display (Tatler 2007). Thus, initially, thecenter of any display gets more visual attention. This couldbe related to choice. Shimojo et al. (2003) pointed to anotherattention bias in the visual search process that is not a func-tion of the location of the options. They showed that in thefinal moments of visual search, visual attention on the cho-sen alternative is heightened, presenting a progressively in-creasing gaze bias toward the chosen stimulus (gaze cascadeeffect). Increased visual attention on the chosen option atthe end of the gaze duration could also be involved in thechoice process. Both of these biases may explain the roleof visual attention on choice. The gaze patterns were ana-lyzed to investigate the predictions.
GAZE PATTERN ANALYSESAND RESULTS
Gaze patterns are informative of the visual attention processas they represent the temporal pattern of fixations, includingvery short fixations (e.g., 20 milliseconds). The initial anal-yses revealed, overall, a higher level of visual attention onthe centrally located brand through the entire gaze duration(total duration and number of fixations). To understandwhether this pattern is due to initial or final tendencies tofocus visual attention on the centrally located brand, thefollowing analyses addressed two questions: (1) Is there agreater tendency to focus on the horizontal center (comparedto left or right) in the initial few seconds and/or final fewseconds of the gaze? (2) Does the higher visual attentionon the horizontal center in the initial or final few secondsof the gaze duration drive the effect of attention on brandchoice?
Based on the gaze likelihood analysis introduced by Shi-mojo et al. (2003), likelihood curves for fixating on eachcolumn of the display (i.e., the brand at the left, center, andright of the display) were developed. This analysis consisted
of dividing the overall gaze duration into time bins and an-alyzing the position of the gazes within each bin. The pro-portion of gazes on a certain horizontal area (left, center, orright) in each sample (time bin) was plotted to form a like-lihood curve over the duration of the gaze. Participants’ eyemovements were recorded at a rate of 50 samples per second;therefore, each time bin covered 20 milliseconds. Detectionand categorization of visual stimuli is accurate in fixations asbrief at 17 milliseconds (Grill-Spector and Kanwisher 2005),and overall categorization accuracy is ensured between 20–100 milliseconds (Loftus and Harley 2004; Loftus and Mc-Lean 1999). Therefore the use of a 20-millisecond time binallows accounting for each fixation in which informationwould have been extracted. Guided by Shimojo et al. (2003),each sampling point was coded such that one indicated thatthe participant’s gaze was directed at the focal column andzero indicated that the gaze was directed elsewhere on theplanogram. The likelihood of fixating on the focal columnat each sampling point was obtained by averaging thesevalues across participants. The likelihood curves of fixatingon each column in the initial and final 5 seconds (250 sam-pling points each) of the gaze duration were plotted for eachproduct category. Note that Shimojo et al. (2003) focusedon a shorter time period (1.5–2 seconds) as the overall gazeduration was much shorter in their choice context (on av-erage 3 seconds) compared to the average gaze duration inthe current study (more than 35 seconds in both categories).This is due to task differences; the task in Shimojo et al.(2003) was to choose between two options, whereas partic-ipants were exposed to nine options in the current study.Moreover, the use of a 5-second interval is more informativeand consistent with other research on gaze patterns (Glaholtand Reingold 2009; Simion and Shimojo 2006). Figure 2presents the resulting likelihood curves. Note that, to ac-count for the possible impact of sampling points on thepattern of results, the same gaze pattern analyses were rep-licated with 40 milliseconds, 100 milliseconds, and 200 mil-liseconds bins. In each case, the results were similar.
As demonstrated in figure 2, the likelihood of fixating onthe (horizontal) central brand (compared to the brand on thehorizontal edges) was higher at the beginning of the gazefor both product categories, consistent with the central fix-ation bias (Tatler 2007). This effect was particularly prev-alent in the first 0.5 second of the gaze. In order to testwhether this difference was significant, the total number ofgaze positions within the first 5 seconds of the gaze durationthat were focused on the central brand were compared withthe total number of gaze positions focused on those brandson the left and right edges of the display (see table 2, panelA). Both contrasts (center vs. left and center vs. right) weresignificant (both p ! .01). This verified that an initial centralfixation bias is prevalent. When the first 0.5 second wasremoved and the analyses were replicated, the initial centralfixation bias was much less prominent. Orienting oneselfmay be the reason for the initial fixations. When the contrastswere tested for other initial time bins, specifically for thefirst 0.5, 1, 2, 3, and 4 seconds, the results were similar.

FIG
UR
E2
ST
UD
Y1A
:LIK
ELI
HO
OD
OF
LOO
KIN
GA
TE
AC
HC
OLU
MN
DU
RIN
GT
HE
INIT
IAL
AN
DF
INA
L5
SE
CO
ND
S
NO
TE.—
The
likel
ihoo
dto
look
atth
ece
ntra
l,le
ft,an
drig
htco
lum
nsis
repr
esen
ted
byth
ebo
ld,s
olid
,and
dash
edlin
e,re
spec
tivel
y.
000 JOURNAL OF CONSUMER RESEARCH
Please use DOI when citing. Page numbers are not final.
TABLE 2
STUDY 1A: COMPARISON OF GAZE LIKELIHOODS
Panel A
First 1 second First 3 seconds First 5 seconds
Product category/contrastMean
difference t-value dfMean
difference t-value dfMean
difference t-value df
Meal bar:PCenter – PLeft .104* 1.93 (50) .032* 1.63 (150) .050*** 4.10 (250)PCenter – PRight .310*** 7.36 (50) .182*** 10.78 (150) .141*** 12.65 (250)
Vitamin:PCenter – PLeft .067* 1.71 (50) .102*** 6.58 (150) .045*** 4.25 (250)PCenter – PRight .276*** 9.17 (50) .127*** 8.05 (150) .031** 2.54 (250)
Panel B
Last 1 second Last 3 seconds Last 5 seconds
Meandifference t-value df
Meandifference t-value df
Meandifference t-value df
Meal bar:PCenter – PLeft .253*** 9.43 (50) .267*** 19.86 (150) .179*** 15.99 (250)PCenter – PRight .267*** 9.44 (50) .267*** 22.03 (150) .209*** 22.21 (250)
Vitamin:PCenter – PLeft .244*** 10.27 (50) .229*** 21.92 (150) .202*** 23.68 (250)PCenter – PRight .266*** 11.50 (50) .245*** 25.17 (150) .208*** 25.90 (250)
NOTE.—The mean differences represent the mean difference between the probability to look at column x (Px) and column y (Py). Results with thefirst and last 0.5, 2, and 4 seconds are similar and significant. Degrees of freedom (df) for the t-values are in parentheses.
*p ! .10.**p ! .05.***p ! .01.
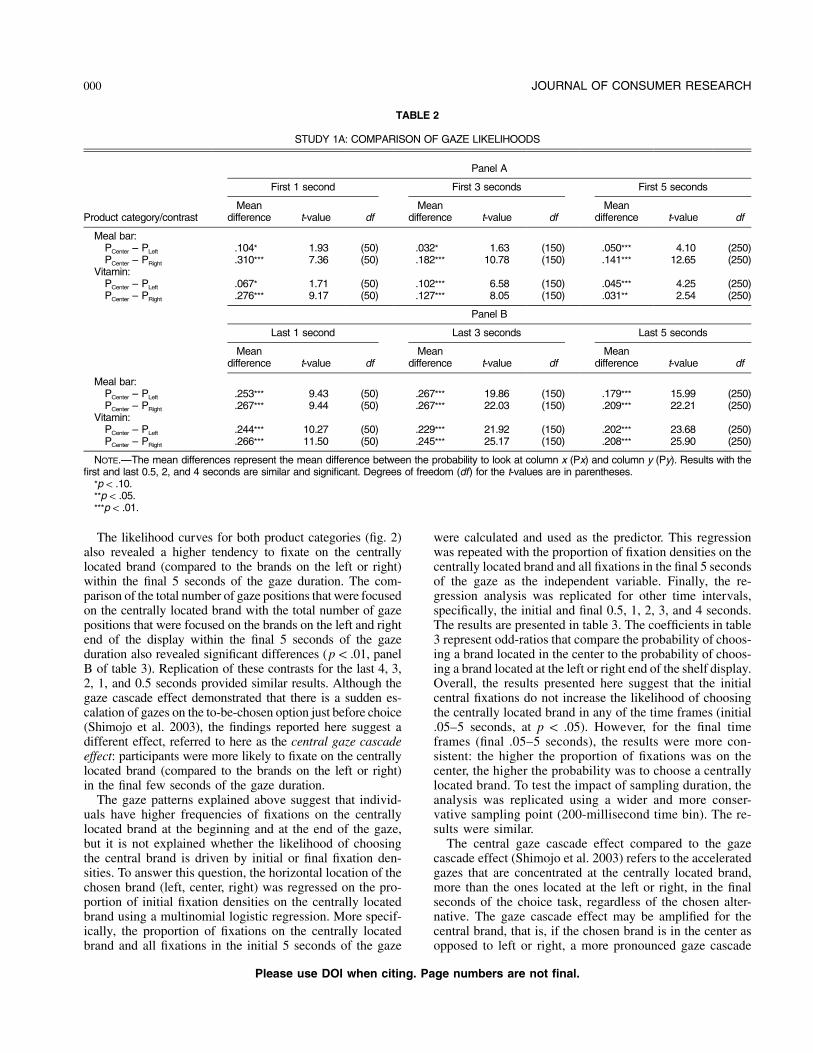
The likelihood curves for both product categories (fig. 2)also revealed a higher tendency to fixate on the centrallylocated brand (compared to the brands on the left or right)within the final 5 seconds of the gaze duration. The com-parison of the total number of gaze positions that were focusedon the centrally located brand with the total number of gazepositions that were focused on the brands on the left and rightend of the display within the final 5 seconds of the gazeduration also revealed significant differences (p ! .01, panelB of table 3). Replication of these contrasts for the last 4, 3,2, 1, and 0.5 seconds provided similar results. Although thegaze cascade effect demonstrated that there is a sudden es-calation of gazes on the to-be-chosen option just before choice(Shimojo et al. 2003), the findings reported here suggest adifferent effect, referred to here as the central gaze cascadeeffect: participants were more likely to fixate on the centrallylocated brand (compared to the brands on the left or right)in the final few seconds of the gaze duration.
The gaze patterns explained above suggest that individ-uals have higher frequencies of fixations on the centrallylocated brand at the beginning and at the end of the gaze,but it is not explained whether the likelihood of choosingthe central brand is driven by initial or final fixation den-sities. To answer this question, the horizontal location of thechosen brand (left, center, right) was regressed on the pro-portion of initial fixation densities on the centrally locatedbrand using a multinomial logistic regression. More specif-ically, the proportion of fixations on the centrally locatedbrand and all fixations in the initial 5 seconds of the gaze
were calculated and used as the predictor. This regressionwas repeated with the proportion of fixation densities on thecentrally located brand and all fixations in the final 5 secondsof the gaze as the independent variable. Finally, the re-gression analysis was replicated for other time intervals,specifically, the initial and final 0.5, 1, 2, 3, and 4 seconds.The results are presented in table 3. The coefficients in table3 represent odd-ratios that compare the probability of choos-ing a brand located in the center to the probability of choos-ing a brand located at the left or right end of the shelf display.Overall, the results presented here suggest that the initialcentral fixations do not increase the likelihood of choosingthe centrally located brand in any of the time frames (initial.05–5 seconds, at p ! .05). However, for the final timeframes (final .05–5 seconds), the results were more con-sistent: the higher the proportion of fixations was on thecenter, the higher the probability was to choose a centrallylocated brand. To test the impact of sampling duration, theanalysis was replicated using a wider and more conser-vative sampling point (200-millisecond time bin). The re-sults were similar.
The central gaze cascade effect compared to the gazecascade effect (Shimojo et al. 2003) refers to the acceleratedgazes that are concentrated at the centrally located brand,more than the ones located at the left or right, in the finalseconds of the choice task, regardless of the chosen alter-native. The gaze cascade effect may be amplified for thecentral brand, that is, if the chosen brand is in the center asopposed to left or right, a more pronounced gaze cascade

CENTRAL GAZE CASCADE EFFECT 000
Please use DOI when citing. Page numbers are not final.
TABLE 3
STUDY 1A: IMPACT OF CENTRAL COLUMN FIXATIONS ON THE PROBABILITY OF CHOOSING THE CENTRALLY LOCATED BRAND
A. Initial gaze
Odd-ratios (Exp(b))First
5 secondsFirst
4 secondsFirst
3 secondsFirst
2 secondsFirst
1 secondFirst
0.5 second
Meal bar:Central / left .310 .250 .445 .390 .453 .778Central / right 1.772 1.473 2.956 3.007 2.899 2.733*R2 .030 .034 .050 .071 .101 .082
Vitamins:Central / left 1.039 1.002 1.021 2.295 1.579 .930Central / right 2.151 2.435 2.871 4.567 1.753 .820R2 .008 .013 .025 .052 .015 .002
B. Final gaze
Last5 seconds
Last4 seconds
Last3 seconds
Last2 seconds
Last1 second
Last0.5 second
Meal bar:Central / left 8.979** 4.789* 3.312 3.403* 6.088*** 3.950**Central / right 8.208** 4.588** 4.026* 6.009** 5.901*** 3.126**R2 .134 .094 .084 .151 .243 .162
Vitamins:Central / left 10.033*** 6.820*** 6.369*** 5.238*** 3.947** 3.700**Central / right 3.839* 2.722 4.038** 4.052** 3.117* 1.951R2 .191 .153 .172 .176 .138 .132
*p ! .10.**p ! .05.***p ! .01.
may be prominent. The central gaze cascade effect and thegaze cascade effect may be operating additively.
To understand the role of each effect, the data were rean-alyzed using both chosen and not chosen brands in the dataand gaze likelihood in the last 5 seconds of the gaze durationas the dependent variable. Specifically, choice (whether thebrand was chosen p 1 or not p 0), central location (centerp 1, other p 0), and choice # central location interactionwere used as the independent variables. Gaze likelihood wasused as the dependent variable, following an arcsine trans-formation to satisfy normality assumption, as in Willemsonet al. (2011). In brief, finding only a significant impact ofchoice but not center would indicate that the effect is merelya gaze cascade effect (as in Shimojo et al. 2003). Findingonly a significant interaction effect would indicate that theobserved effects are the result of an amplified gaze cascadeeffect for the central location. The analysis revealed that thefindings are driven by both the horizontal location of the brand(b p .14, t p 2.60, p ! .01) and whether the brand waschosen (b p .33, t p 6.03, p ! .01). The interaction effectof choice and central location was not significant (p 1 .10).Results were similar when the analyses were repeated for thelast 4, 3, 2, 1 and .05 seconds of the gaze duration.
Overall, the gaze analyses revealed: (1) there is a highertendency to fixate on the centrally located brand in the firstfew and last few seconds of the gaze duration; (2) however,the cascading central fixations observed in last few seconds,but not the initial central fixations, increase the likelihood ofchoosing a brand located in the center. Additional multiple
mediation analyses provided further support. When the visualattention measures in the earlier mediation analysis were re-placed by the total number of fixations (fixation frequency)in the first 5 and final 5 seconds of the gaze duration, againthe indirect effect of horizontal location on choice was sig-nificant through visual attention in the final 5 seconds andnot in the initial 5 seconds. Repeating the mediation analysisfor other time periods (4, 3, 2, 1, .05 seconds) revealed similarresults. Once again, to account for the possible impact ofsampling points on the results, the analyses were repeatedwith a more conservative bin (200 milliseconds). The resultswere similar.
Overall, the analysis of the visual attention process suggeststhat the initial search process, namely, the central fixationbias, does not explain why individuals are more likely tochoose the centrally located brand. (3) More importantly, theresults suggest a central gaze cascade effect: individuals aremore likely to progressively focus on the horizontal centerof the shelf display in the final few seconds of the gazeduration. The central gaze cascade effect operates in additionto the gaze cascade effect and improves the likelihood ofchoosing the central brand.
MEMORY-BASED ATTENTION RESULTS
Earlier research demonstrated that although horizontal cen-trality increased choice likelihood, it did not affect recall,used as a measure of memory-based attention (Valenzuelaand Raghubir 2009, 2010). It is generally agreed that at-

000 JOURNAL OF CONSUMER RESEARCH
Please use DOI when citing. Page numbers are not final.
tention precedes awareness, such that it is possible that astimulus is attended to, but has not reached awareness, andthus it is not recalled or reflected in memory-based measuresof attention (Rosbergen et al. 1997). Furthermore, individ-uals are also known to forget what they have attended to(Milosavljevic and Cerf 2008). Nonetheless, preattentivelyor unconsciously processed stimuli, in other words, evenshort subliminal stimuli exposures of a few milliseconds,can impact preference and choice even when they are notrecalled (Fitzsimons et al. 2002). The effects could be byway of priming (Bargh 2002; Shah and Kruglanski 2002)or mere exposure (Janiszewski 1993; Zajonc 1980). Recentresearch comparing visual attention measures and memory-based attention measures suggested that individuals are poorin recalling which ads (Aribarg et al. 2010) or products theyviewed (Chandon et al. 2009). These findings suggest thatvisual- and memory-based attention are distinct constructs(Aribarg et al. 2010; Chandon et al. 2007, 2009).
Recall that in the current study unaided and aided choicerecall measures were administered upon completion of thechoice task and the inference measures. The accuracy of theunaided recall measure was poor: 44.9% and 55.2% forvitamins and meal replacement bars, respectively. The poorperformance of the unaided choice recall measure can bedue to the use of fictitious brand names and lack of famil-iarity. Consistent with this reasoning, the aided recall mea-sure performed better: 73.9% and 71% (for vitamins andmeal replacement bars, respectively). Additionally, in thecurrent study, memory-based attention was measured usingtwo items that provide a more sensitive self-reported atten-tion measure beyond recall. The composite score based onthese two items had a low significant correlation with thetotal duration of the fixations on the brand (r p .154, p !
.01) and total number of fixations on the brand (r p .183,p ! .01). Recall that these variables were included in themediation analysis reported earlier and that the analyses re-vealed no significant effect of horizontal centrality on theself-reported measures of memory based attention. Similarly,horizontal centrality also had no significant impact on unaidedand aided choice recall measures (p 1 .10). To see the con-vergence between the visual- and memory-based attentionmeasures, the unaided recall measure was regressed on thetotal duration of fixations on the chosen brand. The coefficientof the total duration of fixations was not significant for vi-tamins or meal replacement bars (both p 1 .10). When theanalyses were repeated with aided recall as the dependentvariable, the results were similar for both product categories.The above regressions were repeated with the total numberof fixations (frequency) on the brand as the measure of visualattention, and again none of the coefficients were significant(all p 1 .10).
STUDY 1BStudy 1A revealed that horizontal centrality is a predictorof brand choice. The effect is related to increased visualattention that the brands in the horizontal center get as op-posed to inferences made about them. In other words, visual
attention captured by eye-tracking measures was involvedin predicting the effect of horizontal centrality on choice,while the individual- and market-level inferences measuredin the current study were not. Although the horizontal centerseems to be a hub for visual attention, it is looked at moreboth during the initial and final phases of the search process;only the final gazes that were progressively directed moreat the center facilitated choice. Additionally, visual attentionmeasures did not converge with the memory-based attentionmeasures, corroborating earlier work that reported that in-dividuals cannot accurately recall and report their visualsearch processes.
Study 1B was conducted to investigate whether the ef-fect of horizontal central location on choice and the centralgaze cascade effect is explained by horizontal centralityof the brand or by centrality on the computer screen. In abrief eye-tracking study using meal replacement bars asthe stimulus, study 1B extended the design of study 1Aby introducing planograms that were shifted off the centerof the computer screen (left and right). These planogramswere reduced in size and shifted to the left or right of thescreen by 50%, such that the centrally located brand inthe array was not located in the center of the screen. Inother words, the center of the computer screen on whichthe stimuli were shown did not correspond to the centerof the product array that was displayed. The design, pro-cedures, and measures were similar to those of study 1Ain that brand location on the shelf and the direction of theshift were counterbalanced.
Participants
Sixty-four undergraduate students at HEC Paris partici-pated for extra credit (average age was 22.33 [SD p 1.46)];57.4% were females).
Results
The data transformations and analysis procedures weresimilar to those of study 1A. The horizontal location in thearray was coded into two dummy variables, center and left.The direction of the shift on the computer screen was alsocoded into a dummy variable (1 p left, 0 p right). At theaggregate level, the brand in the horizontal center of theproduct array received overall more frequent eye fixations(57.38 vs. 49.30; F(1, 189) p 4.67, p ! .05, partial h2 p.024), as well as longer total duration of fixations (14.5 vs.12.5 seconds; F(1, 189) p 3.60, p ! .10, partial h2 p .019),than the brands at the edges. As in study 1A, for eachanalysis, reported results converged when a 200-millisecondcutoff was used to qualify a fixation. Furthermore, a brandwas more likely to be chosen when it was in the center ofthe product array (44.4%) than at the left (23.8%) or right(31.7%) of it (x2(2) p 6.47, p ! .05) even when the displaywas shifted, regardless of the direction of the shift (left orright). The preference for the central option in the array wasrobust. As in study 1A, for each analysis conducted, totalduration and number of fixations provided converging re-

CENTRAL GAZE CASCADE EFFECT 000
Please use DOI when citing. Page numbers are not final.
sults; therefore, for parsimony, the subsequently reportedresults use total duration of fixations as the objective mea-sure of visual attention.
A multiple mediation analysis, as in study 1A, using anonparametric bootstrapping strategy (Preacher and Hayes2008) was conducted. Brand choice (1 p brand chosen,0 p not chosen) was the dependent variable, and hori-zontal centrality in the array was the independent variable.Individual brand inferences, market-level brand inferences,memory-based self-reported attention, and visual attentionbased on eye-tracking measures were included as media-tors. The direction of the shift (left/right) of the planogramon the computer screen and the brand name were includedas covariates; however, they had no significant effect onbrand choice or purchase likelihood (all p 1 .10). The resultsconverged with findings from study 1A. The impact of hor-izontal central location within the product array on brandchoice was related to total duration of fixations on the brand(p ! .05) and not related to either individual- or market-level brand inferences or self-reports of attention (all p 1
.05). When the same mediation analysis was repeated usingpurchase intention as the dependent variable, the total du-ration of fixations on the brand again was the only variablethat was related to the effect of horizontal centrality withinthe product array on choice (p ! .05). The findings weresimilar when the mediation analyses were replicated usingtotal fixation frequencies on the brand as the measure ofvisual attention and brand choice or purchase intentions asthe dependent variable (p ! .05). The results verify that thecentrally located option in an array is preferred more andthat it gets more attention. The increased visual attention isinvolved in subsequent choice. Each mediation analysis re-sult reported converged when a 200-millisecond cutoff wasused to qualify a fixation.
The gaze patterns were analyzed to verify that the centralgaze cascade effect emerges (as in study 1A) and is involvedin the choice-making process. Overall, the gaze analysesrevealed that for all final time frames (final 0.5–5 seconds)the central gaze cascade effect is prevalent and robust, con-verging with the results of study 1A. The center of theproduct array received a higher and progressively increasingproportion of fixations in the last moments of the gaze du-ration prior to choice (PCenter – PLeft p .167; t(1, 250) p25.61, p ! .01, and PCenter – PRight p .098; t(1, 250) p 15.33,p ! .01, for the final 5 seconds). The probability of selectingthe centrally located brand was higher as a function of thesefinal gazes focused at the center.
Discussion
The results from study 1B converged with the results fromstudy 1A. The findings were robust even when the plano-gram was shifted off the center of the computer screen.Overall, the results verified that the centrally located itemin a horizontal array gets more visual attention and that thecentral gaze cascade effect that emerges in the final momentsof the gaze duration is involved in the choice-making pro-cess. Study 2 replicates the findings related to the impact
of horizontal centrality on choice in a more realistic offlinechoice context.
STUDY 2
In retail contexts, products are surrounded not only by prod-ucts from the same category but also by products fromdifferent categories. Consequently, the centrally locatedproduct in the array of products in a particular product cat-egory may not necessarily be in the center of the shelf spaceand the consumers’ visual field. It is important to understandwhether a product placed in the center of an array of productswithin a category, but to the right or left side of the shelf,would still be chosen more often. Testing this notion wasthe primary purpose of study 2. Replicating the earlier find-ings in a different choice context with tangible product pack-ages also eliminates common method as an alternative ex-planation in the previous computer-based studies.
Participants
Eighty-four undergraduate students at Concordia Uni-versity participated for extra credit. Average age was 22.21(SD p 4.41); 51.2% were females.
Design and Procedures
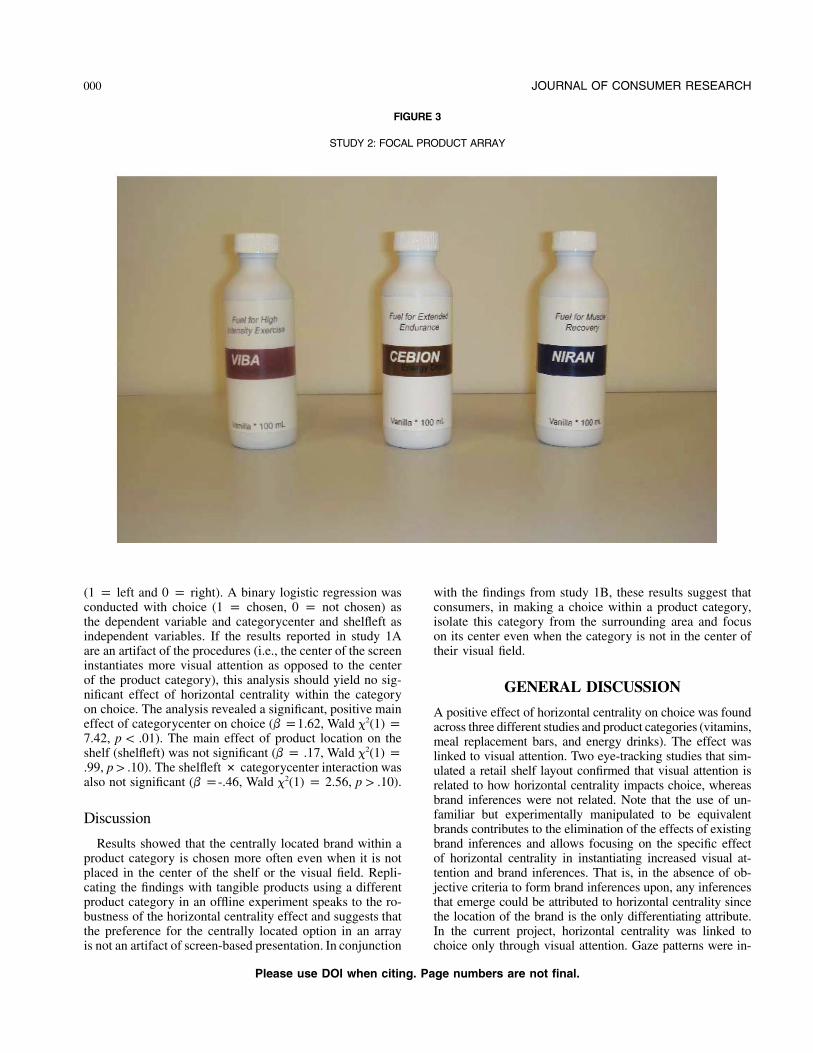
Study 2 was a 3 (product location within category: left,center, right) # 2 (product category location on the shelf:left, right) between-subjects experiment. The focal productcategory, energy drinks, was presented in a horizontal shelflayout in an array of three alternatives. The three brands ofenergy drinks (Cebion, Niran, and Viba) were fictitious.They were created for the purposes of the current study;each brand had one feature attribute (i.e., high intensity,extended endurance, muscle recovery; see fig. 3). Both thebrands in the array and the featured attributes for each brandwere rotated to eliminate any brand- and/or attribute-basedeffects. To manipulate the location of the product categoryon the shelf (left or right), filler products from other cate-gories were included on the same shelf, such that the focalproduct category was either on the left or right side of thedisplay. Data were collected one participant at a time. Par-ticipants were positioned in the middle of the display suchthat the category that they were asked to choose from wasto their right or left. Participants remained positioned in themiddle of the display as they completed the choice task.They were asked to carefully review and choose one of thethree energy drinks. More specifically, participants were notallowed to reorient themselves such that the energy drinkswould be in the center of their visual fields.
Results
The horizontal location of the brand within the productcategory was coded into categorycenter (1 p center and 0p otherwise). The location of the product category on theshelf with respect to the filler items was coded into shelfleft
000 JOURNAL OF CONSUMER RESEARCH
Please use DOI when citing. Page numbers are not final.
FIGURE 3
STUDY 2: FOCAL PRODUCT ARRAY
(1 p left and 0 p right). A binary logistic regression wasconducted with choice (1 p chosen, 0 p not chosen) asthe dependent variable and categorycenter and shelfleft asindependent variables. If the results reported in study 1Aare an artifact of the procedures (i.e., the center of the screeninstantiates more visual attention as opposed to the centerof the product category), this analysis should yield no sig-nificant effect of horizontal centrality within the categoryon choice. The analysis revealed a significant, positive maineffect of categorycenter on choice (b p1.62, Wald x2(1) p7.42, p ! .01). The main effect of product location on theshelf (shelfleft) was not significant (b p .17, Wald x2(1) p.99, p 1 .10). The shelfleft # categorycenter interaction wasalso not significant (b p-.46, Wald x2(1) p 2.56, p 1 .10).
Discussion
Results showed that the centrally located brand within aproduct category is chosen more often even when it is notplaced in the center of the shelf or the visual field. Repli-cating the findings with tangible products using a differentproduct category in an offline experiment speaks to the ro-bustness of the horizontal centrality effect and suggests thatthe preference for the centrally located option in an arrayis not an artifact of screen-based presentation. In conjunction
with the findings from study 1B, these results suggest thatconsumers, in making a choice within a product category,isolate this category from the surrounding area and focuson its center even when the category is not in the center oftheir visual field.
GENERAL DISCUSSION
A positive effect of horizontal centrality on choice was foundacross three different studies and product categories (vitamins,meal replacement bars, and energy drinks). The effect waslinked to visual attention. Two eye-tracking studies that sim-ulated a retail shelf layout confirmed that visual attention isrelated to how horizontal centrality impacts choice, whereasbrand inferences were not related. Note that the use of un-familiar but experimentally manipulated to be equivalentbrands contributes to the elimination of the effects of existingbrand inferences and allows focusing on the specific effectof horizontal centrality in instantiating increased visual at-tention and brand inferences. That is, in the absence of ob-jective criteria to form brand inferences upon, any inferencesthat emerge could be attributed to horizontal centrality sincethe location of the brand is the only differentiating attribute.In the current project, horizontal centrality was linked tochoice only through visual attention. Gaze patterns were in-
CENTRAL GAZE CASCADE EFFECT 000
Please use DOI when citing. Page numbers are not final.
vestigated to understand the process. The analysis of the gazepatterns revealed that the tendency to progressively look moreat the central option right before choice (central gaze cascadeeffect) was involved in the choice process and the preferencefor the centrally located brand. The choice of the centrallylocated brand was not due to the initial tendency to fixate inthe center or a common method artifact. The effect of hori-zontal centrality on visual attention and choice was robustwhen the product category was not in the center of the shelfdisplay and the visual field.
Although the current research seems to contradict pastresearch that did not find any effect of horizontal centralityon attention (Shaw et al. 2000; Valenzuela and Raghubir2009), note that in those studies’ memory-based attentionmeasures were used to assess attention. Corroborating thesefindings, memory-based attention measures did not correlatewith visual attention measures, and they failed to capturethe effect of horizontal centrality on brand choice. Usingrecall as the only measure of attention is acknowledged asa problem by Valenzuela and Raghubir (2009). The resultsfrom the current studies converge with research that distin-guish eye-tracking-based measures of visual attention andmemory-based measures of attention (Aribarg et al. 2010;Chandon et al. 2009; Deng and Kahn 2009; Pieters andWedel 2008).
Overall, findings revealed that increased visual attention,received as a result of horizontal central location, is involvedin brand choice. Although counterintuitive, this finding isnot unprecedented. Recent research in neuroscience reportedthat higher visual attention can lead to higher choice like-lihood (Krajbich et al. 2010). Controlling for past experienceand familiarity through experimental design and presentinga choice task among nondominated options, the current re-search provided similar results and contributed to the un-derstanding of the effects of visual attention on choice. Inthe current study, the effect of horizontal centrality on choicewas not related to brand inferences captured by the measuresincluded. Note that these results do not suggest that infer-ences are not related to choice but that the indirect effectof horizontal centrality on choice is not through articulatedinferences captured in the current studies.
As in earlier research that documented that the center of ascene gets more attention (Tatler 2007; Tatler, Baddeley andGilchrist 2005; Tseng et al. 2009), participants were more likelyto look at the items located in the center both at the beginningand the end of the visual search process. However, additionalmediation analyses revealed that the initial central fixations donot explain choice. Instead, progressively increasing gazes onthe center of the display in the final seconds of the visual searchprocess are related to choice. Further analyses showed that theobserved visual attention pattern in the final seconds of thesearch process is not solely driven by the increase of gazes onthe to-be-chosen alternative (gaze cascade effect) but is drivenby the horizontal central location (central gaze cascade effect).The increased fixation tendency on the central option in thefinal moments of the gaze duration is an additive outcome ofthe central gaze cascade effect (central location) and the gaze
cascade effect (choice). This finding reiterates that the causalinferences about visual attention and choice should be madecautiously.
What motivates the observed patterns of visual attention?Potential explanations were explored. The accelerated gazesdirected at the center can be due to a feedback loop that isinstantiated by the tendency to look at the center of thedisplay at the initial phases of the visual search process. Inother words, the central fixation bias could initiate a feed-back loop that leads to an amplified gaze cascade effect forthe central option in the final stages of the decision. In orderto test this explanation, the proportion of fixation densitieson the central brand during the final 5 seconds was regressedon the proportion of fixation densities on the central brandduring the initial 5 seconds, using data from studies 1A and1B. Results showed no impact of the initial fixations on thecentral gaze cascade effect (all p 1 .10) with either data set.The data did not support this explanation at any of the timeframes (initial and final 0.5, 1, 2, 3, 4, and 5 seconds).
Other process-tracing research has also identified an in-creasing pattern of attention in the final stages of the decisionprocess, similar to the results reported here. Recently Will-emson et al. (2011) traced attention, using Mouselab, andargued that increasing attention focused on the chosen op-tion in the final stages of the decision process may reflectconscious and ongoing comparisons to a reference option.This process suggests dynamic value construction (Lichten-stein and Slovic 2006) through comparison. According tothe value construction perspective, an option within thechoice set emerges as an initial “leader,” and the emergenceof the initial leader leads to two types of effects: (a) leader-driven primacy and (b) a leader-focused search. Once abrand is identified as the early leader in a choice contextbetween two brands, in leader-driven primacy, the biasedevaluation of the attributes provide support for the leaderand bias choice (Carlson, Meloy, and Russo 2006). In otherwords, new information is collected and distorted such thatthere is a biased and more favorable evaluation of the lead-ing option (Brownstein 2003; Montgomery 1983; Mont-gomery and Svenson 1983; Russo, Meloy, and Medvec1998; Willemson et al. 2011). In leader-focused search, pre-decision information search is biased in favor of the initialleader not to support and differentiate the leader (the initialpreference) but to save effort in evaluating alternatives par-ticularly when preferences are weak (Carlson and Guha2011). Leader-focused search is marked by increased pref-erence for information about the leader regardless of thevalence of information or the credibility of the informationsource (Carlson and Guha 2011).
Based on the value construction perspective, an alterna-tive explanation in the current context is that brands locatedin the horizontal center of the array may have an advantagein emerging as the initial choice leader, leading to biases ininformation search as observed in leader-driven primacy(Carlson et al. 2006) and leader-focused search processes(Carlson and Guha 2011). Both processes would predict thatthe initial leader will receive more visual attention, will be

000 JOURNAL OF CONSUMER RESEARCH
Please use DOI when citing. Page numbers are not final.
evaluated more favorably, and will be recalled better. In thecurrent research, the brand in the center was chosen moreoften and received more visual attention; however, it wasnot evaluated more favorably, as captured by the inferencemeasures included or recalled more often. Although not ex-plicitly designed to test this prediction, this mixed findingsuggests that leader-driven explanations for horizontal cen-trality require further exploration. Identifying the role ofhorizontal centrality on how a leader emerges and whatmotivates predecisional distortion is beyond the scope ofthe current article. Future work could manipulate the un-derlying mechanisms, such as goal of consistency (Carlsonand Russo 2001; Russo et al. 2008; Simon, Krawczyk, andHolyoak 2004) and the goal of saving cognitive resources(Carlson and Guha 2011), to better understand how leader-driven effects are involved in linking attention to horizontalcentrality and choice.
A top-down structure of visual search process based onmarketplace metacognitions (lay beliefs) could provide analternative explanation. Neider and Zelinsky (2006) pointedto how scene contexts guide eye movements during visualsearch processes and argued that the scene context causesa top-down biasing of the visual search behavior. They sug-gested that “scene constraints are grounded in semanticknowledge of the world (e.g., knowing that parked cars donot float in the air), and as such are likely to be representedand accessed differently than implicitly learned configuralinformation” (614). Recall that Valenzuela and Rahgubir(2009) documented that consumers hold lay beliefs abouthow retail environments are organized (i.e., they believethat more popular options are placed in the center). There-fore, one could expect consumers’ context-specific knowl-edge to lead them to focus more on the center of a displayin the final seconds of the search process. To test this ex-planation, an additional measure in study 1A, representingconsumer’s contextual knowledge, was examined. Partici-pants had rated “On the supermarket shelf, I believe thatmost popular products are placed always in the middle” onthe same 9-point scale as used in study 1A. Overall, theparticipants held this belief, as revealed by a mean of 5.8,significantly above the scale midpoint (t(62) p 3.99, p !
.01). Correlations of this belief with the proportion of fix-ation densities on the central brand for all time intervals,specifically, the initial and final .05, 1, 2, 3, 4 and 5 seconds,were computed. There were no significant correlations (allp 1 .10), suggesting that the retail-specific semantic knowl-edge regarding centrality did not explain the central gazecascade effect. Additional research is required to furtherunderstand why the central gaze cascade is prevalent.
A unique aspect of the current work is that the brandsincluded in all three studies were fictitious. They were allunfamiliar to the participants, and as established by the pre-tests, they were not different from each other in terms ofquality and packaging. That is, none of the options domi-nated, and diagnostic information other than shelf locationwas eliminated. Given that participants had never seen thebrands presented in this research, the eye fixations could
not have been a result of previous exposure or other mem-ory-based factors such as previous purchase. The uniqueeffects of horizontal shelf location were isolated. Therefore,the studies presented here provide a much less confoundedaccount of the horizontal centrality effect on attention andchoice. Horizontal centrality leads to higher brand choicebecause items in the center of a display get more attention,although they are not evaluated more favorably. Note thatconsumers are more likely to draw inferences about brandsusing irrelevant, nondiagnostic information, such as theirlay beliefs, if and when the brands are unfamiliar (Bron-iarczyk and Alba 1994; Raghunathan, Naylor, and Hoyer2006). As such, using unfamiliar brands allows for a strongertest of the link between shelf location and brand inferences.By eliminating preexisting preferences, use of unfamiliarbrands also contributes to understanding the effect of visualattention at the point of purchase. Future studies could rep-licate and extend the findings presented here using familiarbrands and account for the effects of out-of-store elementsto show the comparative effect of shelf location. The useof familiar brands can also contribute to the understandingof the effect of familiarity and memory on visual attention.
Finally, the impact of horizontal left (or right) locationon visual attention and choice is ambiguous in the previousliterature. Nisbett and Wilson (1977) found that the right-most option in an array was preferred. Ducrot and Pynte(2002), on the other hand, argued that items to the left ofcenter are noticed more than those items to the right. Theeffects of the horizontal edges on the visual search andchoice process were also examined. In the current studies,there was no significant advantage of horizontal left or rightlocation on choice.
In summary, new directions to understand the impact ofhorizontal centrality on choice as well as visual attention andsearch processes were presented. Given the findings, marketersneed to consider where their product is placed on the retailshelf both online and offline. Results have implications for anycontext in which options are presented in a horizontal array.One interesting implication, contrary to common belief, is thatthe brands that are first in display (in left-to-right or right-to-left direction of search) are not at an advantage. Further researchis needed to investigate the generalizability and the robustnessof the horizontal centrality effect in different contexts, withother product categories and choice options, and with differentlevels of top-down as well as bottom-up effects. Similarly, thereare other dependent variables of interest that may be influencedby horizontal centrality (e.g., satisfaction with choice) that mayextend the long-term effects of point-of-purchase factors. Inthe current studies, consumers, in making a choice within aproduct category, isolated the focal category from the sur-rounding such that they focused on its center even when thecategory was not in the center of their visual field. Note, how-ever, if it is not possible to visually differentiate the focal prod-uct category from the surrounding, this effect may not emergeas observed here. This alternative presentation style should beinvestigated in future work, possibly in a field study.

CENTRAL GAZE CASCADE EFFECT 000
Please use DOI when citing. Page numbers are not final.
REFERENCES
Anstis, Stuart M. (1974), “A Chart Demonstrating Variations inAcuity with Retinal Position,” Vision Research, 14 (July),589–92.
Antes, James R. (1974), “The Time Course of Picture Viewing,”Journal of Experimental Psychology, 103 (July), 62–70.
Aribarg, Anocha, Rik Pieters, and Michel Wedel (2010), “Raisingthe BAR: Bias Adjustment of Recognition Tests in Advertis-ing,” Journal of Marketing Research, 47 (June), 387–400.
Armel, K. Carrie, Aurelie Beaumel, and Antonio Rangel (2008),“Biasing Simple Choices by Manipulating Relative VisualAttention,” Judgment and Decision Making, 3 (June), 396–403.
Bargh, John A. (2002), “Losing Consciousness: Automatic Influ-ences on Consumer Judgment, Behavior, and Motivation,”Journal of Consumer Research, 29 (September), 280–85.
Bar-Lev, Shaul K., and Peter Enis (1988), “On the Classical Choiceof Variance Stabilizing Transformations and an Applicationfor a Poisson Variate,” Biometrika, 75 (4), 803–4.
Bechara, Antoine, and Antonio Damasio (2005), “The SomaticMarker Hypothesis: A Neural Theory of Economic Decision,”Games and Economic Behavior, 52 (August), 336–72.
Bechara, Antoine, Hanna Damasio, Daniel Tranel, and Antonio Da-masio (1997), “Deciding Advantageously before Knowing theAdvantageous Strategy,” Science, 275 (February), 1293–95.
Broniarczyk, Susan M., and Joseph W. Alba (1994), “The Impor-tance of the Brand in Brand Extension,” Journal of MarketingResearch, 31 (May), 214–28.
Brownstein, Aaron L. (2003), “Biased Predecision Processing,”Psychological Bulletin, 129 (4), 545–68.
Buswell, Guy Thomas (1935), How People Look at Pictures: AStudy of the Psychology of Perception in Art, Chicago: Uni-versity of Chicago Press.
Carlson, Kurt A., and Abhijit Guha (2011), “Leader-FocusedSearch: The Impact of an Emerging Preference on InformationSearch,” Organizational Behavior and Human Decision Pro-cesses, 115 (1), 133–41.
Carlson, Kurt A., Margaret G. Meloy, and J. Edward Russo(2006), “Leader-Driven Primacy: How Attribute Order CanAffect Consumer Choice,” Journal of Consumer Research,32 (March), 513–18.
Carlson, Kurt A., and J. Edward Russo (2001), “Biased Interpre-tation of Evidence by Mock Jurors,” Journal of ExperimentalPsychology: Applied, 7 (2), 91–103.
Castelhano, Monica S., and John M. Henderson (2008), “TheInfluence of Color on Perception of Scene Gist,” Journal ofExperimental Psychology: Human Perception and Perfor-mance, 34 (3), 660–75.
Chandon, Pierre, J. Wesley Hutchinson, Eric T. Bradlow, and ScottYoung (2007), “Measuring the Value of Point-of-PurchaseMarketing with Commercial Eye-Tracking-Data,” in VisualMarketing: From Attention to Action, ed. Michel Wedel andRik Pieters, New York: Erlbaum, 225–58.
——— (2009), “Does In-Store Marketing Work? Effects of theNumber and Position of Shelf Facings on Brand Attentionand Evaluation at the Point of Purchase,” Journal of Mar-keting, 73 (November), 1–17.
Changizi, Mark A., and Shinsuke Shimojo (2008), “A FunctionalExplanation for the Effects of Visual Exposure on Prefer-ence,” Perception, 37 (10), 1510–19.
Christenfeld, Nicholas (1995), “Choices from Identical Options,”Psychological Science, 6 (January), 50–55.
Christianson, Sven-Ake, Elizabeth F. Loftus, Hunter Hoffman, andGeoffrey R. Loftus (1991), “Eye Fixations and Memory forEmotional Events,” Journal of Experimental Psychology:Learning, Memory, and Cognition, 17 (July), 693–701.
Clement, Jesper (2007), “Visual Influence on In-Store Buying De-cisions: An Eye-Track Experiment on the Visual Influence ofPackaging Design,” Journal of Marketing Management, 23(9–10), 917–28.
Coupey, Eloıse, H. Onur Bodur, and David Brinberg (1998), “Pre-decision Processes in Consumer Choice: Effects of PriorKnowledge on Aspects of Decision Structuring,” in Advancesin Consumer Research, Vol. 25, ed. Joseph W. Alba andJ. Wesley Hutchinson, Provo, UT: Association for ConsumerResearch, 226–32.
Cowley, Elizabeth, and Andrew A. Mitchell (2003), “The Mod-erating Effect of Product Knowledge on the Learning andOrganization of Product Information,” Journal of ConsumerResearch, 30 (December), 443–54.
Deng, Xiaoyan, and Barbara E. Kahn (2009), “Is Your Product onthe Right Side? The ‘Location Effect’ on Perceived ProductHeaviness and Package Evaluation,” Journal of MarketingResearch, 46 (December), 725–38.
Deubel, Heiner, and Werner X. Schneider (1996), “Saccade TargetSelection and Object Recognition: Evidence for a CommonAttentional Mechanism,” Vision Research, 36 (12), 1827–37.
Ducrot, Stephanie, and Joel Pynte (2002), “What Determines theEyes and Space Elasticity?” Perception and Psychophysics,64 (7), 1130–43.
Festinger, Leon (1957), A Theory of Cognitive Dissonance, Ev-anston, IL: Row & Peterson.
Fitzsimons, Gavan, J., J. Wesley Hutchinson, Patti Williams, Jo-seph W. Alba, Tanya L. Chartrand, Joel Huber, Frank R.Kardes, Geeta Menon, Priya Raghubir, J. Edward Russo,Baba Shiv, and Nader T. Tavassoli (2002), “Non-consciousInfluences on Consumer Choice,” Marketing Letters, 13 (3),269–79.
Freeman, Murray, and John W. Tukey (1950), “TransformationsRelated to the Angular and the Square Root,” Annals of Math-ematical Statistics, 21 (4), 607–11.
Glaholt, Mackenzie G., and Eyal M. Reingold (2009), “TimeCourse of Gaze Bias in Visual Decision Tasks,” Visual Cog-nition, 17 (8), 1228–43.
——— (2011), “Eye Movement Monitoring as a Process TracingMethodology in Decision Making Research,” Journal of Neu-roscience, Psychology, and Economics, 4 (May), 125–46.
Grill-Spector, Kalanit, and Nancy Kanwisher (2005), “Visual Rec-ognition: As Soon as You Know It Is There, You Know WhatIt Is,” Psychological Science, 16 (2), 152–60.
Ho-Phuoc, Tien, Nathalie Guyader, and Anne Guerin-Dugue(2010), “A Functional and Statistical Bottom-Up SaliencyModel to Reveal the Relative Contributions of Low-LevelVisual Guiding Factors,” Cognitive Computation, 2 (4),344–59.
Janiszewski, Chris (1993), “Preattentive Mere Exposure Effects,”Journal of Consumer Research, 20 (December), 376–92.
——— (1998), “The Influence of Display Characteristics on Vi-sual Exploratory Search Behavior,” Journal of Consumer Re-search, 25 (December), 290–301.
Johansson, Petter, Lars Hall, Sverker Sikstrom, and Andreas Olsson(2005), “Failure to Detect Mismatches between Intention andOutcome in a Simple Decision Task,” Science, 310 (October),116–19.
Keller, Kevin Lane (1993), “Conceptualizing, Measuring, and
000 JOURNAL OF CONSUMER RESEARCH
Please use DOI when citing. Page numbers are not final.
Managing Customer-Based Brand Equity,” Journal of Mar-keting, 57 (January), 1–22.
Krajbich, Ian, Carrie Armel, and Antonio Rangel (2010), “VisualFixations and the Computation and Comparison of Value inSimple Choice,” Nature Neuroscience, 13 (October), 1292–98.
Krugman, Dean M., Richard J. Fox, James E. Fletcher, Paul M.Fisher, and Tina H. Rojas (1994). “Do Adolescents Attendto Warnings in Cigarette Advertising? An Eye Tracking Ap-proach,” Journal of Advertising Research, 34 (November/December), 39–52.
Krugman, Herbert E. (1965), “The Impact of Television Advertis-ing: Learning without Involvement,” Public Opinion Quar-terly, 29 (Fall), 349–56.
Kuhlberger, Anton, Michael Schulte-Mecklenbeck, and Rob Ran-yard (2011), “Introduction: Windows for Understanding theMind,” in Handbook of Process Tracing Methods for DecisionResearch, ed. Michael Schulte-Mecklenbeck, Anton Kuhber-ger, and Rob Ranyard, New York: Psychology Press, 43–64.
Kustov, Alexander A., and David L. Robinson (1996), “SharedNeural Control of Attentional Shifts and Eye Movements,”Nature, 384 (7), 74–77.
Lichtenstein, Sarah, and Paul Slovic (2006), The Construction ofPreference, New York: Cambridge University Press.
Lindgaard, Gitte, Gary Fernandes, Cathy Dudek, and Judith Brown(2006), “Attention Web Designers: You Have 50 Millisecondsto Make a Good First Impression,” Behavior and InformationTechnology, 25 (2), 115–26.
Locher, Paul J., and Calvin F. Nodine (1973), “Influence of Stim-ulus Symmetry on Visual Scanning Patterns,” Perception andPsychophysics, 13 (3), 408–12.
——— (1989), “The Perceptual Value of Symmetry,” Computersand Mathematics with Applications, 17 (4–6), 475–84.
Loftus, Geoffrey R., and Erin M. Harley (2004), “How DifferentSpatial-Frequency Components Contribute to Visual Infor-mation Acquisition,” Journal of Experimental Psychology:Human Perception and Performance, 30 (1), 104–18.
Loftus, Geoffrey R., and Jennifer E. McLean (1999), “A FrontEnd to a Theory of Picture Recognition,” Psychonomic Bul-letin and Review, 6 (3), 394–411.
Mackworth, Norman H., and Anthony J. Morandi (1967), “TheGaze Selects Informative Details within Pictures,” Attention,Perception, and Psychophysics, 2 (11), 547–52.
Matin, Ethel (1974), “Saccadic Suppression: A Review and anAnalysis,” Psychological Bulletin, 81 (December), 899–917.
Maughan, Lizzie, Sergei Gutnikov, and Rob Stevens (2007), “LikeMore, Look More. Look More, Like More: The Evidencefrom Eye-Tracking,” Journal of Brand Management, 14(April), 335–42.
Milosavljevic, Milica, and Moran Cerf (2008), “First Attention,Then Intention: Insights from Computational Neuroscience ofVision,” International Journal of Advertising, 27 (3), 381–98.
Mohler, Charles W., and Robert H. Wurtz (1976), “Organizationof Monkey Superior Colliculus: Intermediate Layer Cells Dis-charging before Eye Movements,” Journal of Neurophysiol-ogy, 39 (4), 745–65.
Montgomery, Henry (1983), “Decision Rules and the Search fora Dominance Structure: Towards a Process Model of DecisionMaking,” in Analysing and Aiding Decision Processes, ed.Patrick C. Humphreys, Ola Svenson, and Anna Vari, Am-sterdam: North-Holland, 343–69.
Montgomery, Henry, and Ola Svenson, (1983), “A Think Aloud
Study of Dominance Structuring in Decision Processes,” inAspiration Levels in Bargaining and Economic Decision Mak-ing, ed. Reinhard Tietz, Berlin: Springer-Verlag, 383–99.
Neider, Mark B., and Gregory J. Zelinsky (2006), “Scene ContextGuides Eye Movements during Visual Search,” Vision Re-search, 46 (2006), 614–21.
Nisbett, Richard E., and Timothy DeCamp Wilson (1977), “TellingMore Than We Can Know: Verbal Reports on Mental Pro-cesses,” Psychological Review, 84 (March), 231–59.
Pare, Martin, and Douglas P. Munoz (2001), “Expression of aRecentering Bias in Saccade Regulation by Superior Colli-culus Neurons,” Experimental Brain Research, 137 (3–4),354–68.
Parkhurst, Derrick, Klinton Law, and Ernst Niebur (2002), “Mod-eling the Role of Salience in the Allocation of Overt VisualAttention,” Vision Research, 42 (January), 107–23.
Payne, John W., James R. Bettman, Eloıse Coupey, and Eric J.Johnson (1992), “A Constructive Process View of DecisionMaking: Multiple Strategies in Judgment and Choice,” ActaPsychologica, 80 (1–3), 107–41.
Pieters, Rik, and Luk Warlop (1999), “Visual Attention duringBrand Choice: The Impact of Time Pressure and Task Mo-tivation,” International Journal of Research in Marketing, 16(February), 1–16.
Pieters, Rik, and Michel Wedel (2008), “Informativeness of EyeMovements for Visual Marketing: Six Cornerstones,” in Vi-sual Marketing: From Attention to Action, ed. Michel Wedeland Rik Pieters, New York: Erlbaum, 43–72.
——— (2012), “Ad Gist: Ad Communication in a Single EyeFixation,” Marketing Science, 31 (February), 59–73.
Preacher, Kristopher J., and Andrew F. Hayes (2004), “SPSS andSAS Procedures for Estimating Indirect Effects in SimpleMediation Models,” Behavior Research Methods, Instru-ments, and Computers, 36 (November), 717–31.
——— (2008), “Asymptotic and Resampling Strategies for As-sessing and Comparing Indirect Effects in Multiple MediatorModels,” Behavior Research Methods, 40 (August), 879–91.
Raghunathan, Rajagopal, Rebecca Walker Naylor, and Wayne D.Hoyer (2006), “The Unhealthy p Tasty Intuition and Its Ef-fects on Taste Inferences, Enjoyment and Choice of FoodProducts,” Journal of Marketing, 70 (October), 170–84.
Rayner, Keith (1998), “Eye Movements in Reading and Infor-mation Processing: 20 Years of Research,” Psychological Bul-letin, 124 (November), 372–422.
Rosbergen, Edward, Rik Pieters, and Michel Wedel (1997), “VisualAttention to Advertising: A Segment-Level Analysis,” Jour-nal of Consumer Research, 24 (December), 305–14.
Rousselet, Guillaume A., Olivier R. Joubert, and Michele Fabre-Thorpe (2005), “How Long to Get the ‘Gist’ of Real-WorldNatural Scenes?” Visual Cognition, 12 (6), 852–77.
Russo, J. Edward (2011), “Eye Fixations as a Process Trace,” inHandbook of Process Tracing Methods for Decision Re-search, ed. Michael Schulte-Mecklenbeck, Anton Kuhberger,and Rob Ranyard, New York, Psychology Press, 43–64.
Russo, J. Edward, Kurt A. Carlson, Margaret G. Meloy, and KevynYong (2008), “The Goal of Consistency as a Cause of In-formation Distortion,” Journal of Experimental Psychology:General, 137 (August), 456–70.
Russo, J. Edward, and France Leclerc (1994), “An Eye-FixationAnalysis of Choice Processes for Consumer Nondurables,”Journal of Consumer Research, 21 (September), 274–90.
Russo, J. Edward, Margaret G. Meloy, and Victoria H. Medvec

CENTRAL GAZE CASCADE EFFECT 000
Please use DOI when citing. Page numbers are not final.
(1998), “Predecisional Distortion of Product Information,”Journal of Marketing Research, 35 (November), 438–52.
Russo, J. Edward, and Larry D. Rosen (1975), “An Eye FixationAnalysis of Multialternative Choice,” Memory and Cognition,3 (3), 267–76.
Sanders, Andries F., and Mieke Donk (1996), “Visual Search,” inHandbook of Perception and Action: Attention 3, ed. AndriesFrans Sanders and Odmar Neumann, London: AcademicPress, 43–77.
Shah, James Y., and Arie W. Kruglanski (2002), “Priming againstYour Will: How Accessible Alternatives Affect Goal Pursuit,”Journal of Experimental Social Psychology, 38 (4), 384–96.
Sharot, Tali, Cristina M. Velasquez, and Raymond J. Dolan (2010),“Do Decisions Shape Preference? Evidence from BlindChoice,” Psychological Science, 21 (September), 1231–35.
Shaw, Jerry I., Jon E. Bergen, Chad A. Brown, and Maureen E.Gallagher (2000), “Centrality Preferences in Choices amongSimilar Options,” Journal of General Psychology, 127(April), 157–64.
Shimojo, Shinsuke, Claudiu Simion, Eiko Shimojo, and ChristianScheier (2003), “Gaze Bias Both Reflects and Influences Pref-erence,” Nature Neuroscience, 6 (December), 1317–22.
Shiv, Baba, Antoine Bechara, Irwin Levin, Joseph W. Alba, JamesR. Bettman, Laurette Dube, Alice Isen, Barbara Mellers, AleSmidts, Susan J. Grant, and A. Peter McGraw (2005), “De-cision Neuroscience,” Marketing Letters, 16 (3–4), 375–86.
Simion, Claudiu, and Shinsuke Shimojo (2006), “Early Inter-actions between Orienting, Visual Sampling, and DecisionMaking in Facial Preference,” Vision Research, 46 (Octo-ber), 3331–35.
Simon, Dan, Daniel C. Krawczyk, and Keith J. Holyoak (2004),“Construction of Preferences by Constraint Satisfaction,” Psy-chological Science, 15 (5), 331–36.
Tatler, Benjamin W. (2007), “The Central Fixation Bias in SceneViewing: Selecting an Optimal Viewing Position Indepen-dently of Motor Biases and Image Feature Distributions,”Journal of Vision, 7 (November), 1–17.
Tatler, Benjamin W., Roland J. Baddeley, and Iain D. Gilchrist(2005), “Visual Correlates of Fixation Selection: Effects ofScale and Time,” Journal of Vision, 45 (March), 643–59.
Tsal, Yehoshua, and Nilli Lavie (1993), “Location Dominance inAttending to Color and Shape,” Journal of Experimental Psy-chology: Human Perception and Performance, 19 (1), 131–39.
Tseng, Po-He, Ran Carmi, Ian G. M. Cameron, Douglas P. Munoz,and Laurent Itti (2009), “Quantifying Center Bias of Observ-ers in Free Viewing of Dynamic Natural Scenes,” Journal ofVision, 9 (July), 1–16.
Valenzuela, Ana, and Priya Raghubir (2009), “Position-Based Be-liefs: The Center-Stage Effect,” Journal of Consumer Psy-chology, 19 (April), 185–96.
——— (2010), “Are Consumers Aware of Top-Bottom but Notof Left-Right Inferences? Implications for Shelf Space Po-sitions,” Working Paper, Marketing Department, Baruch Col-lege, City University of New York, NY 10010.
van der Heijden, A. H. C. (1992), Selective Attention in Vision,New York: Routledge.
van der Lans, Ralf, Rik Pieters, and Michel Wedel (2008a), “Com-petitive Brand Salience,” Marketing Science, 27 (September),922–31.
——— (2008b), “Eye-Movement Analysis of Search Effective-ness,” Journal of the American Statistical Association, 103(June), 452–61.
Wedel, Michel, and Rik Pieters (2000), “Eye Fixations on Adver-tisements and Memory for Brands: A Model and Findings,”Marketing Science, 19 (4), 297–312.
——— (2008), “Informativeness of Eye Movements for VisualMarketing: Six Cornerstones,” in Visual Marketing: FromAttention to Action, ed. Michel Wedel and Rik Pieters, NewYork: Erlbaum, 43–72.
Willemson, Martijn C., Ulf Bockenholt, and Eric J. Johnson (2011),“Choice by Value Encoding and Value Construction: Pro-cesses of Loss Aversion,” Journal of Experimental Psychol-ogy: General, 140 (3), 303–24.
Yarbus, Alfred L. (1967), Eye Movements and Vision, New York:Plenum.
Zajonc, Robert B. (1980), “Feeling and Thinking: Preferences NeedNo Inference,” American Psychologist, 35 (February) 151–71.


