Journal of CO Utilization - UAntwerpen
15
CO 2 conversion in a gliding arc plasma: Performance improvement based on chemical reaction modeling S.R. Sun a,b , H.X. Wang a, *, D.H. Mei c , X. Tu c , A. Bogaerts b, * a School of Astronautics, Beihang University, 100191, Beijing, China b Research Group PLASMANT, Department of Chemistry, University of Antwerp, Universiteitsplein 1, B-2610 Antwerp, Belgium c Department of Electrical Engineering and Electronics, University of Liverpool, Liverpool L69 3GJ, United Kingdom A R T I C L E I N F O Article history: Received 14 November 2016 Received in revised form 10 December 2016 Accepted 20 December 2016 Available online xxx Keywords: CO 2 conversion Gliding arc Energy efficiency A B S T R A C T CO 2 conversion into value-added chemicals is gaining increasing interest in recent years, and a gliding arc plasma has great potential for this purpose, because of its high energy efficiency. In this study, a chemical reaction kinetics model is presented to study the CO 2 splitting in a gliding arc discharge. The calculated conversion and energy efficiency are in good agreement with experimental data in a range of different operating conditions. Therefore, this reaction kinetics model can be used to elucidate the dominant chemical reactions contributing to CO 2 destruction and formation. Based on this reaction pathway analysis, the restricting factors for CO 2 conversion are figured out, i.e., the reverse reactions and the small treated gas fraction. This allows us to propose some solutions in order to improve the CO 2 conversion, such as decreasing the gas temperature, by using a high frequency discharge, or increasing the power density, by using a micro-scale gliding arc reactor, or by removing the reverse reactions, which could be realized in practice by adding possible scavengers for O atoms, such as CH 4 . Finally, we compare our results with other types of plasmas in terms of conversion and energy efficiency, and the results illustrate that gliding arc discharges are indeed quite promising for CO 2 conversion, certainly when keeping in mind the possible solutions for further performance improvement. © 2016 Elsevier Ltd. All rights reserved. 1. Introduction CO 2 is a major greenhouse gas contributing to global warming [1]. Hence, in recent years the conversion of CO 2 into value-added chemicals or new fuels is gaining much interest, using a variety of conversion methods [2–9]. A novel methodology that shows great promise is based on plasma technology [10]. Plasma is an ionized gas, which is typically created by applying electric power to a gas. It is a highly reactive chemical cocktail, consisting of neutral gas molecules, but also various radicals, atoms, ions and electrons. We can make a distinction between thermal and non-thermal plasmas. In a thermal plasma, all species have the same energy and are in so- called thermal equilibrium with each other. In a non-thermal plasma, the electrons have much higher energy than the other plasma species. Indeed, the applied electric power mostly heats the electrons, due to their small mass, and they can activate the gas molecules by electron impact excitation, ionization and dissociation collisions. Hence, the gas itself does not have to be heated in order to be activated. In this way, thermodynamically unfavorable reactions, like CO 2 conversion, can proceed with reasonable energy cost, at mild operating conditions (ambient pressure and temperature). Besides thermal and non-thermal plasmas, there is also an intermediate group of so-called warm plasmas, with somewhat higher gas temperature, and an electron temperature that is somewhat lower than in typical non-thermal plasmas. Indeed, in non-thermal plasmas the electrons typically have energy of about 2–3 eV, while in warm plasmas they typically have energy of about 1 eV. The latter is more suitable for vibrational excitation of CO 2 molecules, which is known to be the most energy efficient pathway for CO 2 dissociation [10]. This selective excitation to the vibrational modes, but also the selective excitation of other degrees of freedom, forms the basis of the non- equilibrium character of plasma, which will enhance the chemical selectivity. As mentioned above, in the context of CO 2 conversion, especially the selective electron impact excitation to the vibra- tional levels can optimize the energy efficiency. Indeed, it requires only a limited amount of electron energy to populate the lowest vibrational levels of CO 2 , and subsequently, the vibrational levels exchange energy among each other, gradually populating the * Corresponding authors. E-mail addresses: [email protected] (H.X. Wang), [email protected] (A. Bogaerts). http://dx.doi.org/10.1016/j.jcou.2016.12.009 2212-9820/© 2016 Elsevier Ltd. All rights reserved. Journal of CO 2 Utilization 17 (2017) 220–234 Contents lists available at ScienceDirect Journal of CO 2 Utilization journa l homepage : www.e lsevier.com/loca te/jcou
Transcript of Journal of CO Utilization - UAntwerpen

Journal of CO2 Utilization 17 (2017) 220–234
CO2 conversion in a gliding arc plasma: Performance improvementbased on chemical reaction modeling
S.R. Suna,b, H.X. Wanga,*, D.H. Meic, X. Tuc, A. Bogaertsb,*a School of Astronautics, Beihang University, 100191, Beijing, ChinabResearch Group PLASMANT, Department of Chemistry, University of Antwerp, Universiteitsplein 1, B-2610 Antwerp, BelgiumcDepartment of Electrical Engineering and Electronics, University of Liverpool, Liverpool L69 3GJ, United Kingdom
A R T I C L E I N F O
Article history:Received 14 November 2016Received in revised form 10 December 2016Accepted 20 December 2016Available online xxx
Keywords:CO2 conversionGliding arcEnergy efficiency
A B S T R A C T
CO2 conversion into value-added chemicals is gaining increasing interest in recent years, and a gliding arcplasma has great potential for this purpose, because of its high energy efficiency. In this study, a chemicalreaction kinetics model is presented to study the CO2 splitting in a gliding arc discharge. The calculatedconversion and energy efficiency are in good agreement with experimental data in a range of differentoperating conditions. Therefore, this reaction kinetics model can be used to elucidate the dominantchemical reactions contributing to CO2 destruction and formation. Based on this reaction pathwayanalysis, the restricting factors for CO2 conversion are figured out, i.e., the reverse reactions and the smalltreated gas fraction. This allows us to propose some solutions in order to improve the CO2 conversion,such as decreasing the gas temperature, by using a high frequency discharge, or increasing the powerdensity, by using a micro-scale gliding arc reactor, or by removing the reverse reactions, which could berealized in practice by adding possible scavengers for O atoms, such as CH4. Finally, we compare ourresults with other types of plasmas in terms of conversion and energy efficiency, and the results illustratethat gliding arc discharges are indeed quite promising for CO2 conversion, certainly when keeping inmind the possible solutions for further performance improvement.
© 2016 Elsevier Ltd. All rights reserved.
Contents lists available at ScienceDirect
Journal of CO2 Utilization
journa l homepage : www.e l sev ier .com/ loca te / jcou
1. Introduction
CO2 is a major greenhouse gas contributing to global warming[1]. Hence, in recent years the conversion of CO2 into value-addedchemicals or new fuels is gaining much interest, using a variety ofconversion methods [2–9]. A novel methodology that shows greatpromise is based on plasma technology [10]. Plasma is an ionizedgas, which is typically created by applying electric power to a gas. Itis a highly reactive chemical cocktail, consisting of neutral gasmolecules, but also various radicals, atoms, ions and electrons. Wecan make a distinction between thermal and non-thermal plasmas.In a thermal plasma, all species have the same energy and are in so-called thermal equilibrium with each other. In a non-thermalplasma, the electrons have much higher energy than the otherplasma species. Indeed, the applied electric power mostly heatsthe electrons, due to their small mass, and they can activate the gasmolecules by electron impact excitation, ionization and
* Corresponding authors.E-mail addresses: [email protected] (H.X. Wang),
[email protected] (A. Bogaerts).
http://dx.doi.org/10.1016/j.jcou.2016.12.0092212-9820/© 2016 Elsevier Ltd. All rights reserved.
dissociation collisions. Hence, the gas itself does not have to beheated in order to be activated. In this way, thermodynamicallyunfavorable reactions, like CO2 conversion, can proceed withreasonable energy cost, at mild operating conditions (ambientpressure and temperature). Besides thermal and non-thermalplasmas, there is also an intermediate group of so-called warmplasmas, with somewhat higher gas temperature, and an electrontemperature that is somewhat lower than in typical non-thermalplasmas. Indeed, in non-thermal plasmas the electrons typicallyhave energy of about 2–3 eV, while in warm plasmas they typicallyhave energy of about 1 eV. The latter is more suitable forvibrational excitation of CO2 molecules, which is known to bethe most energy efficient pathway for CO2 dissociation [10]. Thisselective excitation to the vibrational modes, but also the selectiveexcitation of other degrees of freedom, forms the basis of the non-equilibrium character of plasma, which will enhance the chemicalselectivity. As mentioned above, in the context of CO2 conversion,especially the selective electron impact excitation to the vibra-tional levels can optimize the energy efficiency. Indeed, it requiresonly a limited amount of electron energy to populate the lowestvibrational levels of CO2, and subsequently, the vibrational levelsexchange energy among each other, gradually populating the
S.R. Sun et al. / Journal of CO2 Utilization 17 (2017) 220–234 221
higher levels (i.e., so-called vibrational-vibration relaxation orladder climbing), up to the dissociation limit. In this way, onlylimited amount of energy must be spent for dissociation of the CO2
molecules. This is in contrast to the situation where CO2
dissociation occurs upon electron impact electronic excitation,as is the case in non-thermal plasmas, where the electrons havesomewhat higher energy. Indeed, it requires about 7–10 eV toelectronically excite the CO2 molecules to a dissociative level. Thisenergy is much more than the OC¼O bond energy (5.5 eV), whichmeans that some electron energy is just lost, i.e., waste of energy.The selective excitation of the CO2 vibrational levels is thus crucialto maximize the energy efficiency. In the 1970s and 1980s, CO2
dissociation by various types of non-equilibrium plasmas wasalready extensively studied both theoretically and experimentally,with emphasis on selective vibrational excitation [11–16]. Morerecently, the research on plasma-based CO2 conversion gainedrenewed interest, and several groups were studying the perfor-mance of various types of plasma reactors, including dielectricbarrier discharges (DBDs) [17–34], microwave plasmas [35–41],ns-pulsed [42] and spark discharges [43–47], as well as gliding arc(GA) discharges [48–60].
Computer modeling can be very useful in gaining a betterunderstanding of the decomposition process of CO2, since it candeal with a huge number of chemical reactions in plasma and it canclarify our understanding of the complex processes related to CO2
decomposition. Moreover, computer simulations can provide datawhich are difficult to measure, such as the densities of individualvibrational levels, reaction rates, etc, and it also can help to identifythe most important chemical reaction processes or parameters.Therefore, in order to improve the performance of various types ofplasma reactors for CO2 decomposition, computer modeling can bevery useful, as it allows to obtain better insight in the underlyingmechanisms. To date, a number of computer models have beendeveloped for DBD and microwave plasma [17–19,23,39], but toour knowledge, no theoretical modeling on the conversion andenergy efficiency of CO2 in a GA discharge has been published yet,although this type of plasma is very promising in terms ofconversion and energy efficiency, and many experiments havebeen performed to study pure CO2 splitting [48–50] as well as thecombined conversion of CO2 with CH4, i.e., dry reforming, to yieldsyngas and other useful products, such as methanol andformaldehyde [51–55].
A GA discharge is a non-stationary arc discharge between twodiverging electrodes submerged in a gas flow. The arc is ignited atthe shortest electrode distance and pushed by the gas flow towardsthe diverging electrode region. The arc length grows together withthe voltage, when the arc length exceeds its critical value, a fasttransition into a non-equilibrium regime occurs. Subsequently, thearc glides under non-equilibrium conditions [61–64]. Therefore,for most prospective plasma chemical applications, for example,the decomposition of CO2, the GA discharges simultaneously hasthe advantages of high electron temperature and high electrondensity for high reactor productivity and a high degree of non-equilibrium to support selective chemical processes, like vibra-tional excitation (see above).
One of the main research efforts in plasma-based CO2 splitting,not only in GA discharges but also in the other plasma reactors, is tomaximize the conversion and energy efficiency. A GA plasmaexhibits a rather high energy efficiency, i.e., for dry reforming ofmethane (DRM), a maximum energy efficiency of around 60% wasachieved at an input power of 165 W and a feed gas flow rate of7.5 L/min, at a conversion in the range of 8–16% [53]. For pure CO2
splitting, a maximum conversion of 18% was obtained at a low gasflow rate of 0.8 L/min and a high discharge power of about 200 W[49], but the corresponding energy efficiency was only about 14%.For a vortex-flow GA, a maximum energy efficiency of 43% was
reported for pure CO2 splitting, at a high gas flow rate of 27 L/min,but the estimated conversion under this condition was only about5% [48].
Usually, the increase of conversion upon increasing dischargepower or decreasing gas flow rate is accompanied by a reduction inthe energy efficiency, due to the higher values of the specificenergy input (SEI), and vice versa, the energy efficiency isenhanced at high gas flow rate or lower discharge power, but atthe expense of the conversion. Therefore, a number of experimentshave been performed in literature, for example, by adding someauxiliary gases [49,56], by varying the GA discharge structure [57–59] or by combination with a catalyst [57,60], to pursue the mostpromising conversion and energy efficiency simultaneously in a GAplasma. The addition of N2 as auxiliary gas on the CO2 conversionhas been investigated in [49], and the CO2 conversion was reportedto reach values up to 35% at a N2 concentration of 95%, which ishigher than the conversion of 15–18% reported for pure CO2. At thesame time, the power (or energy) efficiency was found to increaseby about a factor three compared to pure CO2. In [56] CH4 wasadded as the auxiliary gas, yielding a maximum CO2 conversion of34.5%, which is again larger than the value obtained (12.3%) whenonly pure CO2 was supplied, and showing an energy efficiency ofabout 70%. In addition, the reactor geometry can also have asignificant effect on the conversion. For instance, a micro-scale GAreactor is characterized by a higher power density, and thus, in thecase of CH4 conversion, a higher conversion of 32% was observed[57], while in a conventional GA reactor, a lower conversion of 18%and 8% was obtained in pure CH4 and in a CH4/He mixture,respectively [55]. Besides a classical GA between two flat electro-des, a rotating GA plasma also exhibits good performance for bothconversion and energy efficiency, due to the enlarged reactionregion [58,59]. The conversion of CH4 reaches 36%, correspondingto the energy efficiency of 26.7% for dry reforming of methane in arotating GA discharge [58]. Finally, a combination of a GA dischargewith catalysts is also promising to improve the conversion andenergy efficiency, and furthermore, it has an important influenceon the product selectivity. In [57], a CH4 conversion of about 50%was achieved in a GA plasma with Ni-loaded catalyst. Moreover,the combination of a GA plasma with catalysts in a heat-insulatedreactor has shown to yield a dramatic rise in energy efficiency (upto 86%) with a CH4 conversion of 92% and a CO2 conversion of 20%[60].
From these experimental results, it seems that GA dischargesare indeed promising for CO2 conversion. However, the chemicalmechanisms of the conversion are still not fully understood. Webelieve that a thorough understanding of these chemical mecha-nisms is indispensable to further improve the performance of theGA plasma in terms of conversion and energy efficiency. Thisthorough understanding can be obtained by computer simulations.The latter will also allow us to elucidate the restricting factors inthe conversion, which is needed to provide possible solutions onhow to improve the conversion and energy efficiency, based on theCO2 splitting chemical kinetics mechanisms.
Building a two-dimensional (2D) [65] or three-dimensional(3D) model [66] for CO2 conversion in a GA discharge is anextremely challenging task in view of computation time, due to thecomplex CO2 chemistry. Indeed, from our experience withmodeling a DBD and MW plasma [17–19,39], we expect thatbesides ground state neutral species, also ions, electronicallyexcited and especially vibrationally excited CO2 molecules play amajor role in the conversion process, so these species should beincluded in the model for a GA plasma as well. Therefore, we focushere on the detailed chemical reaction kinetics of CO2 splitting in aGA discharge, including the vibrationally and electronically excitedstates, by means of a zero-dimensional (0D) chemical reactionkinetics model [67,68].

222 S.R. Sun et al. / Journal of CO2 Utilization 17 (2017) 220–234
In order to apply a 0D model to the GA plasma conditions andgeometry, we need to make several assumptions. The latter will bebased on the specific experimental setup for which experimentaldata are obtained to validate our model, as presented in Section 2.Furthermore, we already have experience in building 2D and 3Dmodels for argon in a GA [65,66], and the knowledge obtained fromthese models will be used as input in the present 0D model. A briefexplanation about the 0D model, as well as the chemical reactionsconsidered in the model are given in Section 3, while the detailedmodel assumptions for the GA discharge are discussed in Section 4.The modeling results will be presented in Section 5, including thecomparison with experimental data to validate the model, and ananalysis of the chemical reaction mechanisms. By means of thecomputer simulations, validated by experiments, we will be able toelucidate the main chemical reactions contributing to the CO2
destruction and formation and to identify the restricting factors,which will allow us to suggest possible improvements in terms ofCO2 conversion and energy efficiency in a GA discharge. Finally, theconversion and energy efficiency obtained in this work will becompared with the best results reported in literature for a GAplasma, as well as for other plasma types, to place our results in abroader perspective on plasma-based CO2 conversion.
2. Experimental setup of the GA reactor
A schematic diagram of the experimental GA reactor is shown inFig. 1 [69,70]. A pair of semi-ellipsoidal electrodes (50 mm long,30 mm wide and 5 mm thick) is fixed in an insulating bracket andsymmetrically placed on both sides of a gas nozzle in a cylindricalcontainer, with diameter of 160 mm and height of 191 mm. Bothelectrodes are connected to a neon transformer (SIET, 230 V/10 kV,50 Hz). The discharge ignites at the shortest interelectrodedistance, and subsequently the arc is pushed by the gas flowalong the electrodes until it extinguishes when the distancebetween both electrodes becomes too large, after which a new arcis established at the shortest interelectrode distance. Thus, the arccycle repeats itself. The shortest interelectrode distance can bevaried from 1 mm to 5 mm, in order to change the amount of gaspassing through the electrodes. In our experiments and simu-lations, an interelectrode distance of 2, 2.5 and 3 mm is considered.CO2 (99.8%, BOC UK) gas is injected into the reactor through the gasnozzle at the bottom of the reactor, and the gas leaving the reactorat the outlet (see Fig. 1) is a mixture of CO2, partially converted intoCO and O2. These gases are analyzed by a two-channel gaschromatograph (Shimadzu 2014), which is equipped with a flame
Fig. 1. Schematic illustration of the experimental GA reactor.
ionization detector (FID) and a thermal conductivity detector(TCD). The CO2 conversion is defined as:
XCO2 ð%Þ ¼ CO2; inlet � CO2; outlet
CO2; inlet� 100% ð1Þ
while the energy efficiency is determined by
hð%Þ ¼ XCO2 ð%Þ � DHðkJ=molÞSEIðkJ=LÞ � 22:4ðL=molÞ � 100% ð2Þ
SEIðkJ=LÞ ¼ PowerðkWÞFlow rateðL=minÞ � 60ðs=minÞ ð3Þ
where DH is the reaction enthalpy of pure CO2 decomposition(279.8 kJ/mol) and the input power is recorded by a power meter(Maplin, L61AQ).
3. Description of the 0D model and chemical reactionsconsidered in the model
The model used for this study is a 0D chemical kinetics model,called ZDPlaskin [71]. In this model, the time-evolution of thespecies densities is calculated by balance equations, taking intoaccount the various production and loss terms by chemicalreactions. Because the model is 0D, transport processes are notconsidered explicitly, but the transport of the arc and the effect ofthe gas flowing through the GA reactor are accounted for, asexplained in Section 4 below. The coupled ordinary differentialequations are expressed in the following form:
dni
dt¼
X
j
½ðaRij � aLijÞkjY
l
nLl � ð4Þ
where ni is the density of species i, aRij and aLij are the right-hand sideand left-hand side stoichiometric coefficients of species i in thereaction j, kj is the reaction rate constant and nL
l is the density of thelth reactant of reaction j. Energy is supplied to the plasma electronsby the applied electric field, and the electron temperature iscalculated by the Boltzmann equation solver using the local fieldapproximation for different reduced electric field values E/N (seebelow). This reduced electric field is calculated at each time step, tokeep the desired power density due to the changing gascomposition as a function of time.
In this model, we don’t calculate the gas temperature self-consistently, but we assume a certain gas temperature as input,based on experimental measurements from literature, and we alsodiscuss the influence of gas temperature on the conversion andenergy efficiency in Section 5.3. In [58] the gas temperature wasmeasured for the dry reforming of methane process in a rotatinggliding arc reactor. The dependence of the gas temperature on theapplied voltage was investigated for a CH4/CO2 mixture of 3/7. Byincreasing the applied voltage from 7 kV to 10 kV, the gastemperature only increased by 10%, i.e., from 1080 K to 1180 K.This implies that the GA discharge maintains high selectivity inchanneling the energy into products rather than into loss byenthalpy. Therefore, the gas temperature is assumed in our modelto be 1200 K in the arc region, based on these measurements, andwhen the gas leaves the arc column, the gas temperature isassumed to drop to 500 K, which is measured at the outlet in ourexperiments.
The chemical species considered in this model are presented inTable 1. These species include various neutral molecules in theground state, as well as in several electronically and vibrationallyexcited levels, various radicals, positive and negative ions, and theelectrons. In total, 72 species are taken into account. The symbols

Table 1Species included in the model, besides the electrons.
Ground state molecules CO2, CO, O2, O3
Radicals C2O, C2, C, OElectronic states CO2(e), CO(e1), CO(e2), CO(e3), CO(e4), O2(e1), O2(e2)Vibrational states CO2(Va), CO2(Vb), CO2(Vc), CO2(Vd), CO2(V1)� � �CO2(V21),
CO(V1)� � �CO(V10), O2(V1), O2(V2), O2(V3), O2(V4)Positive ions CO2
+, CO+, CO4+, O2
+, O+, O4+, C2O2
+, C2O3+, C2O4
+,C2+,C+
Negative ions CO3�, CO4
�, O2�, O�, O3
�, O4�
S.R. Sun et al. / Journal of CO2 Utilization 17 (2017) 220–234 223
“V” and “e” between brackets for CO2, CO and O2 represent thevibrationally and electronically excited levels of these species,respectively. Special attention is paid to the vibrational levels ofCO2, and more specifically to the levels of the asymmetric stretchmode, denoted here as V(1–21), as they are expected to play animportant role in energy-efficient CO2 conversion, based on ourexperience for a MW plasma [67,68,72]. More details about all theexcited levels, and an explanation about the meaning of thenotations in Table 1, can be found in [67,68].
The chemical reactions used in the model include electronimpact reactions, vibrational energy transfer reactions, andchemical reactions between the various neutral species and thevarious charged species, which are presented in detail in [67,68]and updated in [73]. For the electron impact reactions, a cross-section database, adopted from LxCat [74], is given as input to theBoltzmann equation solver BOLSIG+ [75], which calculates theelectron energy distribution function (EEDF) for different values ofreduced electric fields. Subsequently, the rate constants of thevarious electron impact reactions can be obtained from this EEDFand the cross sections. Note that for electron impact excitation-dissociation, the excitation cross section by Phelps with 7 eVthreshold is adopted, as recommended in [76].
For the vibrational energy transfer reactions, three types can bedistinguished: (i) vibrational energy transfer to the translationaldegrees of freedom, i.e., VT relaxation, (ii) vibrational energytransfer between the symmetric and asymmetric mode levels ofCO2, i.e., VV’ relaxation, and (iii) vibrational energy transfer amongtwo molecules in the same mode of vibration, i.e., VV relaxation.The rate constants of the heavy particle reactions are assumed tobe only a function of the gas temperature and are adopted from theliterature (see details in [67,68,72,73]).
The calculated CO2 conversion is defined as follows:
XCO2 ð%Þ ¼ ð1 � anCO2 ;totðtrÞnCO2 ;totð0Þ
Þ � 100% ð5Þ
where nCO2,tot is the total calculated CO2 density (including groundstate and excited levels), tr denotes the gas residence time (definedin Section 4 below) and 0 stands for the start of the simulation,corresponding to the position of the gas inlet. In the model theconcentration of the species only varies as a function of time. Thistemporal variation can, however, easily be translated into a spatialvariation in the GA reactor, i.e., when the gas molecules travel fromthe inlet to the outlet, by means of the gas flow rate. In other words,the variation of the species concentrations as a function of time (inthe model) is the same as the variation as a function of position (inreality).
Because the CO2 gas is gradually converted into CO and O2
molecules when travelling through the GA reactor, the number ofmolecules will increase, or in other words, the gas volume willexpand for the same inlet gas flow rate. Therefore, a correctionfactor (a) has to be incorporated, to account for this gas expansion.This correction factor is expressed as the ratio of the gas speciesfluxes at the exit vs the inlet [77]. Because CO2 is partiallyconverted into CO and O2, there will be more molecules at the exit
compared to at the inlet, yielding a value of a > 1, depending on theactual conversion.
To calculate the energy efficiency of the CO2 conversion, wedefine the specific energy input (SEI):
SEIðeV=moleculeÞ ¼ PðWÞeQnðs�1Þ ð6Þ
Where e links the units of J to eV (1 eV = 1.6 � 10�19 J), Qn is theparticle flow rate (in number of molecules per second), defined byEq. (7):
Qnðs�1Þ ¼ pðPaÞkBðJ=KÞTgasðKÞ106ðcm3=m3Þ
� Qgasðcm3=sÞ ð7Þ
Furthermore, P is the plasma power (W), p is the gas pressure(Pa), kB is the Boltzmann constant (J/K), Tgas is the gas temperature(K), and Qgas is the inlet gas flow rate (expressed here in cm3 s�1).The factor 106 is used to transfer the units of m3 to cm3.
Subsequently, the energy efficiency (h) is calculated as:
hð%Þ ¼ XCO2 ð%Þ �DHðeV = moleculeÞSEIðeV = moleculeÞ ð8Þ
With DH the reaction enthalpy for CO2 splitting (CO2! CO + 1/2O2), i.e., 279.8 kJ/mol (see also previous section) or 2.9 eV/molec.
4. Application of the 0D model to a GA discharge
Although it is reported in literature that the arc undergoes atransition from thermal to non-thermal regime when dragged bythe gas flow to larger interelectrodes gap [61], this typically appliesto a GA operating at higher currents than the conditions understudy here. Indeed, at the conditions under study here, both our 2Dand 3D simulations [65,66], as well as the experiments [69,70],indicate that the gliding arc is only in the non-thermal regime fromthe ignition at the shortest gap. Therefore, in this simulation, we donot consider the transition from thermal to non-thermal region,and we treat the GA as a non-thermal plasma. The 0D model isapplicable to the non-equilibrium region, and although a 0D modelcannot describe the increase of arc length from short arc at theshortest gap to long arc at a larger gap, we can use the timeevolution of the plasma parameters as input, which are related tothe increase of arc length during the arc downstream movement.
As mentioned above, a 0D model only calculates the speciesdensities as a function of time, and transport processes are notexplicitly considered. Nevertheless, the transport of the arcthrough the GA reactor can be mimicked by translating thetemporal behavior, as calculated in the model, into a spatialbehavior, corresponding to the position in the reactor, by means ofthe gas flow rate. We thus need to specify how the spatialvariations in the reactor, more specifically for the power density,can be translated into temporal variations, to be used as input inthe model. The power density is assumed to be constant in theregion between the electrodes where the arc is formed (cf. Fig. 1above; also called “arc time” in the model). This constant value isjustified, although we know that the arc length increases with time

Fig. 3. Calculated electron temperature (red line; right y-axis) and electron density(blue line; left y-axis) as a function of time during (and after) the arc. (Forinterpretation of the references to colour in this figure legend, the reader is referredto the web version of this article.)
Fig. 4. Time-evolution of the electron density, calculated with our 2D model for anargon GA discharge, illustrating how the arc expands when it travels from short tolarger interelectrode distance, as well as the back-breakdown event, where a newbreakdown occurs following a shorter path between both electrodes [66].
224 S.R. Sun et al. / Journal of CO2 Utilization 17 (2017) 220–234
and position, but in reality also the electric power increases withtime and position, so the electric power per unit length can beconsidered constant during the arc movement. Moreover, theradius of the plasma string will also remain constant during the arcmovement, as observed in experiments [78,79], so the powerdensity can indeed be considered constant.
Furthermore, it is reported in literature that the gliding arc is aplasma string with a diameter of about 1 mm, surrounded by aweakly ionized zone [78,79]. This can also be clearly seen from our3D calculation results in Fig. 2.
Thus, in our 0D model the arc volume is seen as a cylinder with adiameter of about 1 mm, and the power density in the arc zone (i.e.,the region between the electrodes) is calculated as the plasmapower divided by the arc volume. We apply the same power as inthe experiments, i.e., between 70 and 100 W (see Section 5 below).The arc diameter will slightly increase with plasma power, andthus we assume the arc radius to be 0.5, 0.525, 0.55 and 0.575 mmin our model, at a power of 70, 80, 90 and 100 W, respectively.Therefore, the initial arc volume is calculated to be 1.96 � 10�3,2.17 � 10�3, 2.38 � 10�3 and 2.59 � 10�3 cm3 for these powervalues, respectively, yielding a power density of 3.56 � 104,3.69 � 104, 3.78 � 104 and 3.85 �104W/cm3 in the plasma powerrange of 70–100 W. When a power density of 3.85 �104W/cm3 isapplied, the electron density calculated in our 0D model is around(4.5–5) � 1012 cm�3 in the arc zone, as shown in Fig. 3, which iscomparable to the electron density measured in a low current(0.1 A) air gliding arc [80]. Note that the electron density plotted inFig. 2 is about 1014 cm�3 for a low current GA plasma, but this wasobtained in argon, and it is expected that the electron density in aCO2 discharge is lower, due to electron attachment and theformation of negative ions [81]. Finally, this power density yields acalculated electron temperature of 1.8–2.0 eV, as also presented inFig. 3, and this is also in agreement with the experimentallymeasured electron temperature range of 1–2 eV [58,82]. In theregion beyond the electrodes (cf. Fig. 1, called the “relaxation time”in our model), the power density is zero, and thus, both theelectron density and electron temperature also drop to zero, as isclear from Fig. 3.
Furthermore, it is known that only a small fraction of the inletgas (10–20%) can pass through the discharge zone in aconventional GA [83–85]. Our previous 2D modeling results [66]have pointed out that the velocity of the moving arc differs to someextent from the gas flow velocity, due to the phenomenon of back-breakdown, which is characteristic for a conventional GAdischarge. This process is illustrated in Fig. 4, and it results in asomewhat larger fraction of the gas that can pass through the arcand be treated, compared to the situation where the arc would
Fig. 2. Illustration of a typical electron density profile in one arc, calculated with our 3D mthe left figure, to illustrate the interior of the arc. In the right figure, the electrodes betweeof the arc are given.
move with the same velocity as the gas flow velocity. Therefore, inour model, the fraction of the treated gas is assumed to be 20%, andthe inlet gas is divided in two parts, i.e., 80% will not be processedand 20% passes through the arc zone. The final gas composition atthe outlet will be the result of the two flows mixing downstream ofthe discharge.
The gas processing time in the arc is assumed to be 8 ms, whichis deduced from the voltage signal in the experiments, i.e., the arcvoltage suddenly drops after 8 ms, indicating that a new arc cycleoccurs [69,70]. After this, the treated gas leaves the arc region, and
odel for an argon GA discharge [66]. Note that the right figure is the cross section ofn which the arc is formed are schematically illustrated (cf. Fig.1), and the dimensions

Fig. 6. Experimental and calculated values of CO2 conversion and energy efficiency(a), and electron density and plasma power in the GA discharge (b), as a function ofthe shortest interelectrode gap, for a gas flow rate of 6.5 L/min.
S.R. Sun et al. / Journal of CO2 Utilization 17 (2017) 220–234 225
enters the relaxation zone, as shown in Fig. 1 above. Subsequently,the new arc will process the new incoming gases at the shortestinterelectrode gap, and this process repeats itself.
Besides the gas processing time, we also need to define the totalgas residence time in the reactor. The gas flow rate is fixed at 6.5 L/min. This yields an average axial gas flow velocity of 11 m/s, assimulated by the so-called k-v RANS turbulent modelingtechnique in a 3D model. Based on the reactor length of 191 mm(see Fig. 1 above), the calculated average gas flow time along thereactor length is about 17.4 ms. As this is an average, and somemolecules might spend a longer time in the reactor, we set the totalgas residence time in our calculations as 30 ms, which is sufficient,because the gas composition does not change with time anymore,as will be shown in Section 5.2, so it has no influence on theconversion.
To summarize, the simulation is divided in two phases, asshown in Fig. 1, i.e., the arc processing phase and a relaxationphase. In the first phase, the electrons are heated by the electricfield and they activate the gas molecules. This applies to the gaspassing through the arc column (see above). In the second phase,which starts at 8 ms, the power deposition goes to zero, and as aresult, also the electron density and temperature drop to zero (seeFig. 3), and the reacting species are given time to relax toequilibrium.
5. Results and discussion
5.1. CO2 conversion and energy efficiency
A comparison between the calculated and measured CO2
conversion and energy efficiency as a function of discharge powerand shortest interelectrode gap is illustrated in Figs. 5 and 6,respectively. The conversion is typically between 6 and 10%, for thedifferent conditions investigated, while the corresponding energyefficiency is around 20–40%. These values will be benchmarkedagainst other results from literature, for various types of plasmareactors, in Section 5.4 below.
As is clear from Fig. 5, the calculated and measured CO2
conversion increase with increasing electrical power. As expected,a higher electrical power yields a higher electron density, and thusa higher density of vibrationally excited states of CO2, whichpromotes the CO2 dissociation, as will be shown in the next section.The measured and calculated energy efficiency, on the other hand,slightly drop with increasing power. This can be explained fromEqs. (2) and (8) above. Indeed, the energy efficiency rises linearlywith the conversion, but is also inversely proportional to the SEI.Hence, if the conversion rises less rapidly than the SEI (which is
Fig. 5. Experimental and calculated values of CO2 conversion and energy efficiencyas a function of plasma power, at a gas flow rate of 6.5 L/min and a shortestinterelectrode gap of 2.5 mm.
determined by the power, keeping the flow rate constant), this willresult in a drop in the energy efficiency as a function of the SEI. As isclear from Fig. 5, an increase in the plasma power by a factor 1.4results in a rise in the conversion by only a factor 1.2. Hence, thisexplains why the energy efficiency slightly drops upon increasingpower (or SEI). A good agreement is reached between experimen-tal and calculated data, although the calculated energy efficiency isslightly lower than the experimental values. In fact, the agreementbetween calculations and experiments is already very satisfactory,certainly in view of the fact that the coupling interaction of the gasflow with the arc is a complex process in a GA discharge, whichcannot be fully captured by a 0D model.
The influence of the shortest interelectrode gap on thecalculated and measured conversion and energy efficiency ispresented in Fig. 6(a). A larger interelectrode gap results in a dropin both the experimental and calculated conversion, while theenergy efficiency drops only slightly in the experiments andremains more or less constant in the calculated results.
This drop in conversion can be explained because a largerinterelectrode gap results in a slight increase of the arc volume, andin a decrease of the plasma power measured from the electricalsignals, thus resulting in a somewhat lower electron density, asboth shown in Fig. 6(b). This lower electron density results in adrop in electron impact reaction rates, explaining the drop in CO2
conversion. As the energy efficiency depends on the conversion

226 S.R. Sun et al. / Journal of CO2 Utilization 17 (2017) 220–234
and the power (or SEI; cf. Eqs. (2) and (8) above), which both dropupon larger interelectrode gap, this also explains why the energyefficiency drops only slightly or remains more or less constant.
We can conclude from Figs. 5 and 6 that our model shows thesame trends as the experimental data, for different conditions, andalso the absolute values are in reasonable agreement. Therefore,we believe that the model is sufficiently realistic to be used toelucidate the underlying chemical mechanisms of CO2 splitting,which will be presented in the next section.
5.2. Reaction products and chemical reaction pathway analysis for CO2
conversion
In this section, the underlying plasma chemistry mechanismsfor the CO2 conversion in the GA discharge will be discussed.Indeed, a better insight into the dominant chemical reactionsmight help to steer the process to improve the CO2 conversion andenergy efficiency.
The time evolution of the most important neutral speciesdensities is presented in Fig. 7. The densities of CO2, CO, and O2
represent the total densities, including the electronic and vibra-tionally excited states. At the initial stage, i.e., in the first 0.1 ms, thedensities of CO and O increase together (see Fig. 7(a)), due to theelectron impact dissociation reaction CO2+ e ! CO + O + e. Afterabout 0.1 ms, the density of the O atoms rises more slowly than theCO density, and at the same time, the density of the O2 moleculesrises, because the O atoms recombine into O2 molecules. A smallfraction of the O atoms will also recombine with O2 molecules,
Fig. 7. Time evolution of the most important neutral species densities, at a plasmapower of 70 W, a gas flow rate of 6.5 L/min and a shortest interelectrode gap of2.5 mm. Panel (a) shows the details in the first 0.5 ms, while panel (b) shows theoverall evolution in the arc phase and relaxation phase.
yielding the production of O3, but their density is several orders ofmagnitude lower, as is clear from Fig. 7.
After the gases have passed through the arc region, therelaxation phase begins, as indicated by the black dashed verticalline in Fig. 7(b). Strikingly, the O atom density abruptly decreases,while the O2 and O3 densities increase, indicating that the O atomsare rapidly converting into O3 and O2. Furthermore, also the CO2
density, which showed a decreasing trend in the arc phase, nowrecovers to more or less its initial value, due to the sudden drop ofgas temperature to 500 K after leaving the arc zone at constantpressure. Indeed, inside the arc phase, the CO2 density drops fromthe initial value of 6.1 �1018 cm�3 to 3.1 �1018 cm�3, yielding aconversion of 34%, taking into account the gas expansion factor atconstant pressure. However, immediately after the arc phase, itrises again due to the gas temperature drop, and then staysconstant in the relaxation phase. This means that the relaxationphase does not contribute to the CO2 conversion, not in the positivedirection (contributing to more CO2 dissociation), nor in thenegative direction (i.e., the reverse – recombination – reactionsbetween CO and O atoms are also negligible in the relaxation phasedue to the low temperature; see below). Finally, by mixing with the80% untreated CO2 gas, the overall CO2 conversion over one arccycle is only limited to 6.8% at the conditions under study (cf. alsoFig. 5 above). The product distribution at the end of the relaxationphase, being mainly CO and O2, at a ratio of 2.05, is the same as forthe experimentally measured products at the outlet, and was alsoreported by others in literature [49]. The underlying chemistry ofthe conversion process will be discussed in the reaction pathwayanalysis below.
The most important reactions responsible for the CO2 conver-sion, integrated over the entire gas residence time, are presented inFig. 8. As mentioned above, the conversion only takes place duringthe arc phase, because the temperature in the relaxation phase istoo low, and the power (and electron density and temperature)have dropped to zero. The main reaction in the entire power rangeis electron impact dissociation of vibrationally excited states of CO2
into CO and O, with a relative contribution of about 61–67%,slightly decreasing upon increasing power. Besides, electronimpact dissociation of ground state CO2 into CO and O, as wellas CO2 dissociation upon collision with ions, also contribute eachby about 10%. Furthermore, upon increase of the plasma power,also the dissociation of vibrationally excited states of CO2 uponcollision with any neutral species (M) or specifically with the Oatoms, become slightly more important, reaching a contributionup to 10% and 7%, respectively, at a plasma power of 100 W. The
Fig. 8. Relative contributions of the most important reactions responsible for theCO2 conversion, integrated over the entire gas residence time, as a function ofplasma power.

Fig. 9. Normalized vibrational distribution functions of the asymmetric mode ofCO2 at the end of the arc phase (t = 8 ms) and different values of the plasma power. Fig. 10. Relative contribution of the most important formation processes of CO2,
integrated over the entire gas residence time, as a function of plasma power.
Fig. 11. Reactions pathways illustrating the CO2 splitting (a) and formation (b)mechanisms. The thickness of the arrow lines corresponds to the importance of thereactions. The conversion reactions between O, O2 and O3 are also indicated in (b),with blue arrow lines. (For interpretation of the references to colour in this figure
S.R. Sun et al. / Journal of CO2 Utilization 17 (2017) 220–234 227
specific CO2 destruction processes will be shown in detail in thereaction pathway analysis below.
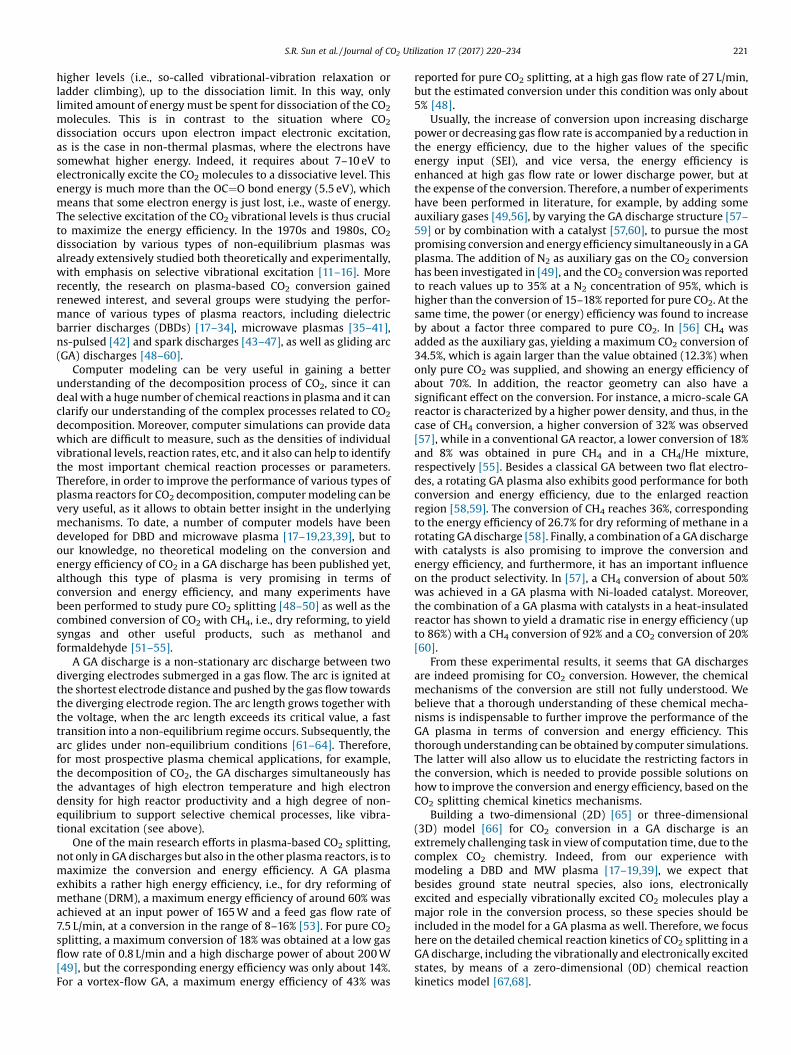
It is clear that the vibrational levels of CO2 play a crucial role inthe CO2 splitting process. In Fig. 9, the normalized vibrationaldistribution functions (VDFs) of the asymmetric mode of CO2,obtained at a time of 8 ms (i.e., the end of the arc phase), aredepicted for four different power values.
The populations of the higher vibrational levels slightlyincrease with the plasma power, and this explains why the CO2
conversion increases with plasma power, since the dissociation ofCO2 upon collision with any neutral species (M) or with the Oatoms mainly proceeds through these higher vibrational levels.Indeed, these higher asymmetric mode vibrational levels (V(11)–V(21)) account for 99.9% and 98.5% of the dissociation of CO2 uponcollision with any neutral species (M) and with the O atoms,respectively, at a plasma power of 100 W. Moreover, the electrondensity also increases with rising power, and all this explains thehigher CO2 conversion upon rising power. Note that electronimpact dissociation of the vibrationally excited states of CO2
mainly proceeds from the lower asymmetric mode levels and fromthe symmetric mode levels, which have a high enough density forthis process to occur. In fact, the symmetric mode vibrational levels(V(a)–V(d) in Table 1) account for 73% of the total electron impactvibrational dissociation in our model, while the relative contri-butions of the lowest three asymmetric mode vibrational levels (V(1)–V(3)) amount to 21%, and the other asymmetric modevibrational levels only account for 6% at a plasma power of100 W. Although the higher asymmetric mode vibrational levelsonly play an important role in the dissociation of CO2 upon impactwith any neutral species (M) or with the O atoms, which only havea small contribution to CO2 conversion at the conditions understudy (i.e., up to 10 and 7%, respectively; cf. Fig. 8 above), the highervibrational levels are still quite important for CO2 conversion in aGA discharge, and their importance also depends on the dischargeconditions, which will be shown in Section 5.3.
Besides dissociation of CO2, some of the reactions plotted inFig. 8 also occur in the opposite direction, giving rise to theformation of CO2 again. The most important reactions for CO2
formation are plotted as a function of plasma power in Fig. 10. Thereaction of CO (either in the ground states or in vibrationallyexcited states) with O atoms and a third body (M) is thepredominant production process of CO2, with a relative contribu-tion to the overall CO2 formation amounting to 85% at all plasmapowers investigated. Furthermore, the reaction of O atoms withCO3
� ions also plays a non-negligible role in the CO2 formation,contributing for about 10% in the entire power range. Other
reactions that play a minor role towards CO2 formation (<5%)include CO recombination with ions, and to a lower extent also therecombination between positive and negative ions, and O atomrecombination with ions (not shown in Fig. 10). These reactionpaths will be presented in detail in Fig. 11 below. Note that thereverse reactions, especially the three-body recombination of COwith O atoms, have a detrimental effect on the CO2 conversion.Indeed, when this reaction rate becomes large enough, it willinhibit further CO2 dissociation. This might happen at the end ofthe arc phase, when a considerable fraction of the CO2molecules isalready converted into CO and O.
From the above analysis, we can compose an overall reactionscheme of CO2 splitting and formation, as presented in Fig. 11. Thisallows us to identify in more detail the reactions that should betargeted in our aim to further improve the CO2 conversion. Thedominant CO2 loss mechanism is dissociation upon collision withelectrons (e), forming CO and O, as appears from the thickest arrow
legend, the reader is referred to the web version of this article.)

Fig. 12. Calculated CO2 conversion, energy efficiency and VT relaxation rate as afunction of gas temperature inside the arc, at a plasma power of 70 W, a gas flow rateof 6.5 L/min and a shortest interelectrode gap of 2.5 mm.
Fig. 13. Normalized vibrational distribution functions of the asymmetric mode ofCO2 in the GA discharge at t = 8 ms, for different gas temperature values inside thearc, at a plasma power of 70 W, a gas flow rate of 6.5 L/min and a shortest
228 S.R. Sun et al. / Journal of CO2 Utilization 17 (2017) 220–234
line, and as could also be deduced from Fig. 8 above. In Fig. 11, nodistinction is made between CO2 molecules in the ground state orvibrationally excited levels, but it is clear from Figs. 8 and 9 that themajor contribution arises from the CO2 lower asymmetric andsymmetric mode vibrational levels. Another important lossmechanism is dissociation of CO2 upon collision with any heavyspecies (M), forming CO and O; see also Fig. 8 above. The other lossprocesses illustrated in Fig. 11 represent CO2 dissociation uponimpact with O atoms and dissociative electron attachment,forming CO and O2, or CO and O�, respectively, as well as severalreactions with ions, as shown in detail in Fig. 11(a). Among theseion reactions, the most important loss mechanism is dissociationof CO2 upon collision with negative ions O� (and M atoms), formingCO3
�. All these ion reactions together contribute for only about 10%to the CO2 loss, as indicated in Fig. 8.
Most of the ions, however, also contribute to the CO2 formation,as described in detail in Fig. 11(b), so the net role of the ionreactions in the CO2 loss or formation is not very important. Theions playing a role in the CO2 formation include O�, C2O3
+ andC2O4
+, reacting with CO to form CO2, as well as CO4� and CO3
�,reacting with O atoms to CO2. However, the contribution of theseions to the CO2 formation is again only about 10–15%, as indicatedin Fig. 10 above. If we want to improve the CO2 conversion, it isbetter to intervene in the dominant CO2 formation process, beingthe recombination reactions of CO with O atoms and a third body(M) (cf. the thickest arrow lines in Fig. 11(b)), which has acontribution of about 85% (cf. Fig. 10). This will be elaborated in thenext section.
During the arc phase, the O atom density is very large, as shownin Fig. 7, but in the relaxation phase, the O atom density abruptlydecreases, and there is almost no O measured at the reactor outlet.Hence, the above recombination reaction between CO, O and athird body will only be substantial during the arc phase. The reasonwhy the O atom density becomes negligible in the relaxation phaseis because the gas temperature sharply drops to 500 K when thegas leaves the arc zone and enters the relaxation zone. As aconsequence, the rate coefficient of the three-body reactionbetween O atoms and O2 molecules, forming O3, increases, as itis strongly temperature dependent:
k ¼ 6:11 � 10�34ðTg=300Þ�2:6cm6s�1. Hence, this three-body reac-tion of O with O2 becomes the most important loss process for theO atoms, which can also be deduced from the sharp increase of theO3 density, presented in Fig. 7(b) above. Furthermore, two O atomswill also recombine into the formation of O2, as illustrated inFig. 11(b).
From this analysis we can conclude that a lower gastemperature inside the arc phase could reduce the density of Oatoms by converting them to O3 and O2, which may prevent thereverse reaction of O and CO into CO2, and thus improve the CO2
conversion. Therefore, in the following section, we will firstlyinvestigate the influence of gas temperature in the arc on theconversion and energy efficiency of CO2, before elaborating onother possible ways to improve the CO2 conversion.
5.3. How to improve the CO2 conversion and energy efficiency in a GAdischarge?
5.3.1. Effect of the gas temperatureFrom the discussions above, it is clear that, in order to increase
the CO2 conversion, we have to inhibit or reduce the formation ofCO2 upon recombination between CO and O, and the most obviousand direct method would be to lower the gas temperature insidethe arc, so that O recombines faster into O3 (cf. above). Moreover, alower gas temperature will result in a lower reaction ratecoefficient of the three-body recombination of CO and O.
Therefore, we investigate here the effect of different gastemperature values inside the arc, on the conversion and energyefficiency of CO2.
As is obvious from Fig.12, in the gas temperature range of 1000–1500 K, the conversion and energy efficiency of CO2 decreasedramatically with increasing gas temperature. At a gas tempera-ture of 1000 K, both the conversion and energy efficiency are veryhigh, reaching up to 18% and almost 96%, respectively. This can beexplained from the reduced reverse reaction of CO and O into CO2,because the O atoms more easily recombine with O2 and O3 at lowtemperature (see above), but also from the VDF, plotted in Fig. 13(see discussion below).
When the gas temperature inside the arc increases to 1200 Kand further to 1500 K, both the conversion and energy efficiencyexhibit a significant drop to 5% and 18% respectively. When furtherincreasing the temperature to 2000 K, the conversion and energyefficiency are virtually unaffected, but a further increase from2000 K to 2500 K, and even to 3000 K results in a significant rise inthe CO2 conversion up to 16.5% at 3000 K, while the energyefficiency rises only slightly, i.e., up to 29.3% at a gas temperature of3000 K. In this high gas temperature range, the slight increase ofthe energy efficiency at high gas temperatures, i.e., 2500 and3000 K, is caused by the increase of the CO2 conversion. At high gastemperature, the SEI value also increases, i.e., every molecule isgetting more energy, but when the CO2 conversion rises morerapidly than the SEI, this will result in an increase of the energyefficiency as a function of the gas temperature (cf. Eq. (8) above).
interelectrode gap of 2.5 mm.

Fig. 14. Calculated CO2 conversion and energy efficiency as a function of powerdensity, at a gas flow rate of 6.5 L/min and a shortest interelectrode gap of 2.5 mm.
S.R. Sun et al. / Journal of CO2 Utilization 17 (2017) 220–234 229
From Fig. 12, we can see that when the gas temperature rises from1500 to 2000 K, the conversion rises only to some extent, so theenergy efficiency slightly drops. However, when increasing the gastemperature to 2500 and 3000 K, the conversion rises significantly,resulting in a slight increase of the energy efficiency. The plasma isin the high gas temperature only a heater, i.e., a provider of therequired high temperature [10]. Hence, in this regime theadvantages of the selective, non-equilibrium vibrational excitationof CO2 are suppressed. In Fig. 12 we also plot the VT relaxation rate(CO2v2 + M ! CO2v1 + M); see blue curve and right y-axis. We canclearly see that the VT rate increases with gas temperature,resulting in a lower density of high vibrational levels at high gastemperatures.
Fig. 13 presents the effect of gas temperature on the normalizedVDF of the asymmetric mode of CO2. At 1000 and 1100 K, the VDFlooks strikingly different from the VDFs at the higher temper-atures, with much higher densities of the higher vibrational levels.When the gas temperature rises to 1200 K and higher, the VDFdrops steeply towards higher vibrational levels. From the slope ofthe VDFs, we can deduce a so-called vibrational temperature,assuming a Maxwellian distribution (N � exp(-eE/kTvib) [72]). At1000 and 1100 K, there is not a single slope in the VDF, illustratingthat the VDF does not follow a Maxwellian distribution, whichpoints towards thermal non-equilibrium. Instead, three slopes canmore or less be distinguished, and the corresponding vibrationaltemperatures are 25000 K, 6600 K and 1280 K for the gastemperature of 1000 K, while they are 22000 K, 6200 K, 1237 Kfor the gas temperature of 1100 K. These values are much largerthan the gas temperature of 1000 and 1100 K, especially for the firstand second group of levels, thus indeed clearly pointing towardsthermal non-equilibrium. At the higher gas temperatures, the VDFscan be represented by an exponentially decaying function, andfrom the slopes in Fig. 13, we can deduce vibrational temperaturesof 7000 K, 5900 K, 5000 K, 4400 K and 4800 K, at the gas temper-atures of 1200 K, 1500 K, 2000 K, 2500 K and 3000 K, respectively.Hence, the ratio of Tvib/Tg decreases from 5.8 to 1.6. Thus, it is clearthat the VDFs indeed become close to thermal equilibrium uponhigher gas temperature.
Our calculations predict that the lower asymmetric mode levelsand the symmetric mode levels, which have a higher density, aremainly contributing to the CO2 dissociation at a temperature of1200 K and above. In the gas temperature range of 1200–2000 K,electron impact dissociation of vibrationally excited states of CO2 isthe main loss process, in which the lower asymmetric mode levelsand the symmetric mode levels play the most important role.When further increasing the gas temperature from 2000 K to2500 K, and even to 3000 K, the dissociation of vibrationallyexcited states of CO2 upon collision with the O atoms becomesmore and more important, and again the lower asymmetric modelevels and the symmetric mode levels play the most importantrole. If we take the gas temperature of 3000 K as an example, wecan conclude that the dissociation of the vibrationally excitedstates of CO2 upon collision with O atoms is the most importantsplitting process. The relative contributions of the symmetricmode vibrational states to the CO2 dissociation amount to 72%,while the lowest five vibrational levels of the asymmetric mode (V(1)–V(5)) account for 20%, the intermediate asymmetric modevibrational levels V(6)–V(10) account for 6%, and the highestasymmetric mode levels V(11)–V(21) contribute for only 2% to thisCO2 dissociation process.
On the other hand, at a gas temperature of 1000 K, dissociationof the high vibrationally excited states of CO2 upon collision withany neutral species (M) is the predominant CO2 dissociationprocess, which is the most energy-efficient mechanism, and in thiscase, the highest asymmetric mode levels V(11)–V(21) contributefor 99.9% to the total vibrational dissociation. This explains why the
energy efficiency at 1000 K is much higher than at a higher gastemperature. The energy efficiency of the thermal process islimited because the energy inserted in the plasma is equallydistributed over all degrees of freedom of the plasma-chemicalsystem, while only a few of them are important for the CO2
dissociation. At 1000 K, the energy is selectively used to populatethe higher vibrational levels, which are important for the CO2
dissociation, so this clearly demonstrates that it is important tokeep the temperature inside the arc low, in order to achieve thehighest energy efficiency. The latter can be realized in practice byusing a high frequency GA discharge, in which the arc does not haveenough time to be heated to a high value. Indeed, for instance in[86] a higher conversion was observed when the frequency of theGA increased from 15 to 20 kHz.
5.3.2. Effect of the power densityAs we already showed in Section 5.2, at a gas temperature of
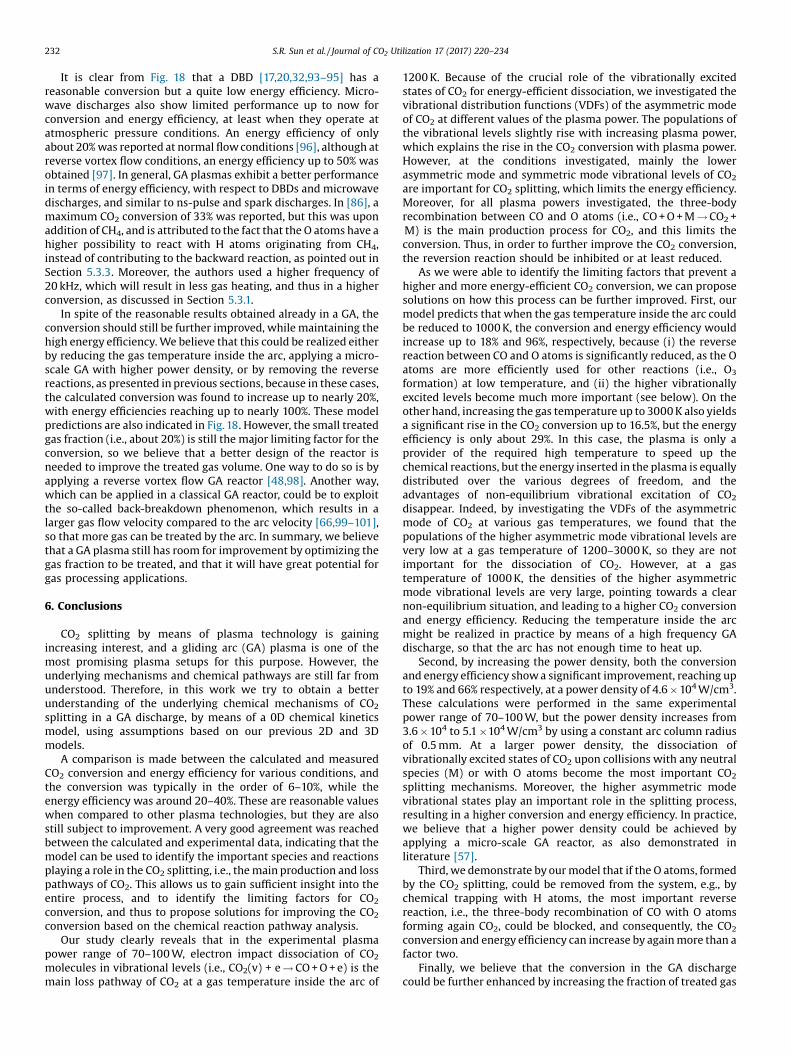
1200 K, the higher asymmetric mode vibrational levels are not veryimportant in a GA discharge at the power conditions underinvestigation, and the CO2 conversion only slightly increases from6.8% to 8.4% when the power rises from 70 to 100 W. So thequestion arises whether these higher asymmetric mode vibration-al levels are really not important in a GA discharge at this commontemperature of 1200 K, and whether or how we could furtherimprove the conversion in this power range. In order to answerthese questions, we performed calculations using the same plasmapower of 70–100 W, but with a constant arc radius of 0.5 mm for allpower values. In this case, the obtained power densities are3.56 � 104, 4.07 � 104, 4.58 � 104 and 5.09 � 104W/cm3, respec-tively. Thus, in this section, we present the effect of somewhatlarger power densities on the CO2 conversion and on the VDF.
Fig. 14 illustrates that the CO2 conversion rises significantlyfrom 6.8% to 19.8% in the same power range of 70–100 W. It shouldbe noted that the conversion is limited to a maximum of 20% by thetreated gas fraction. The energy efficiency also first increases from30% to 66% in the power density range of 3.6–4.6 � 104W/cm3,while further increasing the power density to 5.1 �104W/cm3
yields a slight drop in the energy efficiency to 61%. The latter iscaused by the fact that the conversion rises to a lower extent thanthe SEI. However, these results clearly reveal that both theconversion and energy efficiency are greatly improved at theselarger power density conditions. In practice, a large power densitycan be achieved in a micro-scale GA reactor, and it was indeedexperimentally demonstrated [57] that such a micro-scale GAreactor results in a higher conversion. On the other hand, it shouldalso be realized that the amount of gas that can be treated in amicro-scale GA reactor is more limited. However, we believe that
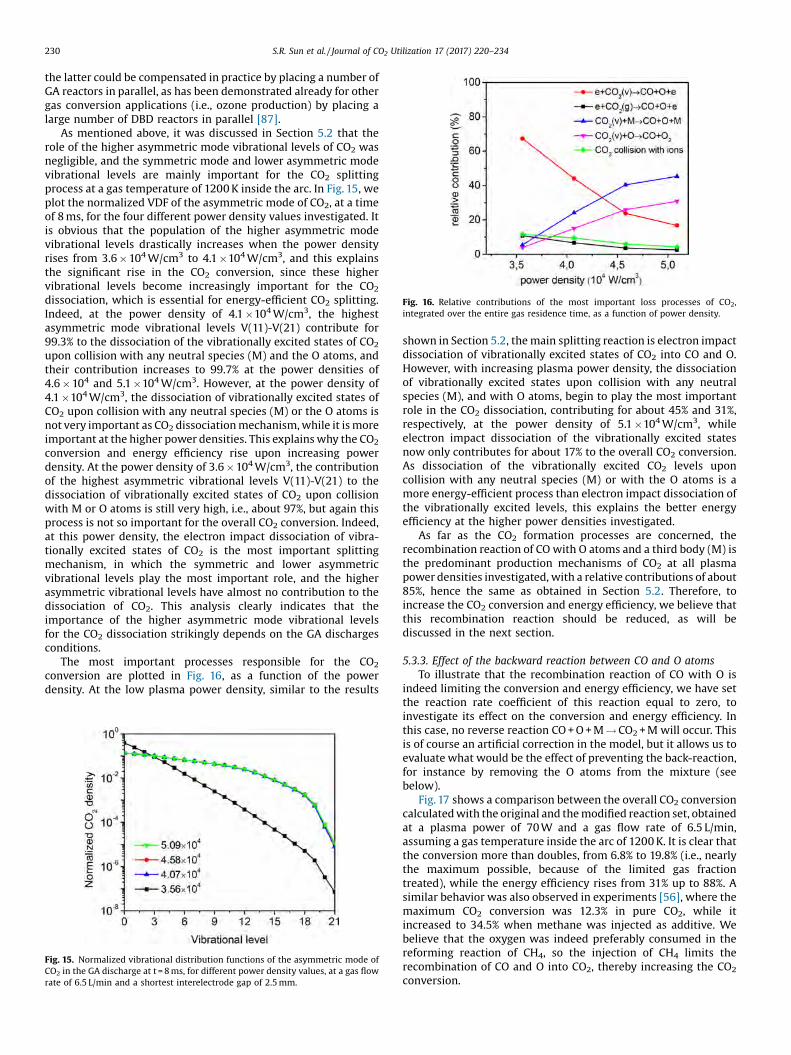
Fig. 16. Relative contributions of the most important loss processes of CO2,integrated over the entire gas residence time, as a function of power density.
230 S.R. Sun et al. / Journal of CO2 Utilization 17 (2017) 220–234
the latter could be compensated in practice by placing a number ofGA reactors in parallel, as has been demonstrated already for othergas conversion applications (i.e., ozone production) by placing alarge number of DBD reactors in parallel [87].
As mentioned above, it was discussed in Section 5.2 that therole of the higher asymmetric mode vibrational levels of CO2 wasnegligible, and the symmetric mode and lower asymmetric modevibrational levels are mainly important for the CO2 splittingprocess at a gas temperature of 1200 K inside the arc. In Fig. 15, weplot the normalized VDF of the asymmetric mode of CO2, at a timeof 8 ms, for the four different power density values investigated. Itis obvious that the population of the higher asymmetric modevibrational levels drastically increases when the power densityrises from 3.6 � 104W/cm3 to 4.1 �104W/cm3, and this explainsthe significant rise in the CO2 conversion, since these highervibrational levels become increasingly important for the CO2
dissociation, which is essential for energy-efficient CO2 splitting.Indeed, at the power density of 4.1 �104W/cm3, the highestasymmetric mode vibrational levels V(11)-V(21) contribute for99.3% to the dissociation of the vibrationally excited states of CO2
upon collision with any neutral species (M) and the O atoms, andtheir contribution increases to 99.7% at the power densities of4.6 � 104 and 5.1 �104W/cm3. However, at the power density of4.1 �104W/cm3, the dissociation of vibrationally excited states ofCO2 upon collision with any neutral species (M) or the O atoms isnot very important as CO2 dissociation mechanism, while it is moreimportant at the higher power densities. This explains why the CO2
conversion and energy efficiency rise upon increasing powerdensity. At the power density of 3.6 � 104W/cm3, the contributionof the highest asymmetric vibrational levels V(11)-V(21) to thedissociation of vibrationally excited states of CO2 upon collisionwith M or O atoms is still very high, i.e., about 97%, but again thisprocess is not so important for the overall CO2 conversion. Indeed,at this power density, the electron impact dissociation of vibra-tionally excited states of CO2 is the most important splittingmechanism, in which the symmetric and lower asymmetricvibrational levels play the most important role, and the higherasymmetric vibrational levels have almost no contribution to thedissociation of CO2. This analysis clearly indicates that theimportance of the higher asymmetric mode vibrational levelsfor the CO2 dissociation strikingly depends on the GA dischargesconditions.
The most important processes responsible for the CO2
conversion are plotted in Fig. 16, as a function of the powerdensity. At the low plasma power density, similar to the results
Fig. 15. Normalized vibrational distribution functions of the asymmetric mode ofCO2 in the GA discharge at t = 8 ms, for different power density values, at a gas flowrate of 6.5 L/min and a shortest interelectrode gap of 2.5 mm.
shown in Section 5.2, the main splitting reaction is electron impactdissociation of vibrationally excited states of CO2 into CO and O.However, with increasing plasma power density, the dissociationof vibrationally excited states upon collision with any neutralspecies (M), and with O atoms, begin to play the most importantrole in the CO2 dissociation, contributing for about 45% and 31%,respectively, at the power density of 5.1 �104W/cm3, whileelectron impact dissociation of the vibrationally excited statesnow only contributes for about 17% to the overall CO2 conversion.As dissociation of the vibrationally excited CO2 levels uponcollision with any neutral species (M) or with the O atoms is amore energy-efficient process than electron impact dissociation ofthe vibrationally excited levels, this explains the better energyefficiency at the higher power densities investigated.
As far as the CO2 formation processes are concerned, therecombination reaction of CO with O atoms and a third body (M) isthe predominant production mechanisms of CO2 at all plasmapower densities investigated, with a relative contributions of about85%, hence the same as obtained in Section 5.2. Therefore, toincrease the CO2 conversion and energy efficiency, we believe thatthis recombination reaction should be reduced, as will bediscussed in the next section.
5.3.3. Effect of the backward reaction between CO and O atomsTo illustrate that the recombination reaction of CO with O is
indeed limiting the conversion and energy efficiency, we have setthe reaction rate coefficient of this reaction equal to zero, toinvestigate its effect on the conversion and energy efficiency. Inthis case, no reverse reaction CO + O + M ! CO2 + M will occur. Thisis of course an artificial correction in the model, but it allows us toevaluate what would be the effect of preventing the back-reaction,for instance by removing the O atoms from the mixture (seebelow).
Fig. 17 shows a comparison between the overall CO2 conversioncalculated with the original and the modified reaction set, obtainedat a plasma power of 70 W and a gas flow rate of 6.5 L/min,assuming a gas temperature inside the arc of 1200 K. It is clear thatthe conversion more than doubles, from 6.8% to 19.8% (i.e., nearlythe maximum possible, because of the limited gas fractiontreated), while the energy efficiency rises from 31% up to 88%. Asimilar behavior was also observed in experiments [56], where themaximum CO2 conversion was 12.3% in pure CO2, while itincreased to 34.5% when methane was injected as additive. Webelieve that the oxygen was indeed preferably consumed in thereforming reaction of CH4, so the injection of CH4 limits therecombination of CO and O into CO2, thereby increasing the CO2
conversion.

Fig. 17. Effect of removing the recombination reaction (CO + O + M ! CO2 + M) fromthe model, on the calculated CO2 conversion and energy efficiency, for a plasmapower of 70 W, a gas flow rate of 6.5 L/min and a shortest interelectrode gap of2.5 mm.
Fig. 18. Comparison of our (experimental and calculated) values of energyefficiency vs. conversion, with experimental data for various discharge typescollected from literature, as indicated in the legend. The numbers associated with
S.R. Sun et al. / Journal of CO2 Utilization 17 (2017) 220–234 231
As mentioned above, in order to reduce the backward reactionbetween CO and O atoms, we believe it would be necessary toremove the O atoms from the mixture, so that there is not enoughreactant available for this back-reaction from CO into CO2. It shouldbe noted that in our modeling study for a microwave discharge[68], we pointed out that the O atoms should preferentially reactwith CO2 (to form CO and O2) in order to improve the energyefficiency, before they would recombine with another O atom orwith an O2molecule, into an O2 or O3molecule, respectively, whilehere we suggest that it is better to remove the O atoms (e.g., byletting them react with O2, into the formation of O3), to avoid theirrecombination with CO into CO2. The reason for this difference isthat in the microwave discharge studied in [68], the collision of CO2
with O atoms is indeed crucial to further improve the CO2
conversion, while in the GA discharge investigated here, electronimpact dissociation plays a key role in the CO2 conversion, and therelative contribution of CO2 collisions with O atoms to the overallCO2 conversion is quite low. Thus, if the role of the O atoms in therecombination process is more important than its role in thedissociation process of CO2, it is important to be able to remove theO atoms, as the latter will further improve the conversion of CO2,while not having a negative effect on the conversion.
In order to remove the O atoms from the mixture in practice,with the aim to achieve a higher conversion, we believe thatpossible scavengers, catalyst interactions or membrane technologymight be an option. The main idea to eliminate the O atoms is tofind an interaction which makes the O atoms no longer available asa reactant; hence, this interaction has to be significantly faster thanthe reaction between CO and O. One possible scavenger for the Oatoms could be H atoms. Indeed, it was demonstrated in [88] thatthe O atoms can be chemically trapped during the plasma splittingof CO2 by the addition of H2 or CH4, forming H2O. We believe thatthis is also the reason why in the experiments of ref. [56], themaximum CO2 conversion increased from 12.3% to 34.5% uponaddition of methane, as mentioned above, because the O atoms areprobably preferentially consumed in the reforming reaction of CH4,so the addition of CH4 limits the recombination of CO and O intoCO2, thereby increasing the CO2 conversion. With respect to thecatalyst interactions, a more advanced catalytic process would bean alternative form of chemical looping, in which the O or O2 iscaptured in the plasma set-up and then used as an oxidizing agentin a second set-up [89,90]. Finally, by means of membraneseparation technology, the O atoms (or O2 molecules) could
possibly be transported away from the reaction mixture. Thecombination of a solid oxide electrolyser cell with a plasma set-upcould also be an option. In [91] a maximum CO2 conversion of 40%was obtained for a DBD plasma reactor, but this conversion wasincreased to about 80% by removing O2 from the plasma in a hybridreactor with a solid oxide electrolyser cell. It should, however, berealized that these options for catalysts or membrane technologyhave only been successfully applied up to now to separate O2 fromthe plasma. In order to trap the O atoms, we believe that addingpossible scavengers, as mentioned above, could be a good choice.Nevertheless, it should be mentioned that these ways of removingO atoms from the mixture are only suggestions, and they were notexperimentally verified yet for our setup, although we indeed haveindications that the chemical trapping should work, as demon-strated in the cited references above.
5.4. How do the conversion and energy efficiency of a GA dischargecompare with other types of plasma reactors?
Our experimental and calculation results illustrate that the CO2
conversion is in the range of 6–10%, while the energy efficiencyreaches about 40%. Moreover, our calculations predict that byreducing the gas temperature inside the arc, or by enhancing thepower density (e.g., by applying a micro-scale GA reactor), or byreducing the main reverse reaction, the conversion and energyefficiency can reach values up to nearly 20% (i.e., the maximumpossible for a treated gas fraction of 20%) and nearly 100%,respectively, although it should be realized that these modelpredictions are of course upper limits. Nevertheless, they showhow the conversion and energy efficiency could be furtherimproved, which is very useful to guide further experimentaloptimization work. In Fig. 18 we compare our results with dataobtained from literature for CO2 splitting, in a GA discharge, as wellas in other types of plasma reactors, such as a DBD and amicrowave (MW) plasma, a ns-pulse or spark discharge.
As Fig. 18 shows the optimim values for conversion and energyefficiency available in the literature, we also only plot our bestobtained results, and we also added our model predictions, basedon the suggested improvements discussed in Section 5.3 (seebelow). In order to realize a fair assessment for industrialapplicability, we only compare with results from literatureobtained at atmospheric pressure, although it should be men-tioned that in a microwave discharge, a higher energy efficiency of60% [92] and even up to 80–90% [10] was obtained at a reducedpressure and supersonic gas flow.
the data points correspond to the references in this paper.
232 S.R. Sun et al. / Journal of CO2 Utilization 17 (2017) 220–234
It is clear from Fig. 18 that a DBD [17,20,32,93–95] has areasonable conversion but a quite low energy efficiency. Micro-wave discharges also show limited performance up to now forconversion and energy efficiency, at least when they operate atatmospheric pressure conditions. An energy efficiency of onlyabout 20% was reported at normal flow conditions [96], although atreverse vortex flow conditions, an energy efficiency up to 50% wasobtained [97]. In general, GA plasmas exhibit a better performancein terms of energy efficiency, with respect to DBDs and microwavedischarges, and similar to ns-pulse and spark discharges. In [86], amaximum CO2 conversion of 33% was reported, but this was uponaddition of CH4, and is attributed to the fact that the O atoms have ahigher possibility to react with H atoms originating from CH4,instead of contributing to the backward reaction, as pointed out inSection 5.3.3. Moreover, the authors used a higher frequency of20 kHz, which will result in less gas heating, and thus in a higherconversion, as discussed in Section 5.3.1.
In spite of the reasonable results obtained already in a GA, theconversion should still be further improved, while maintaining thehigh energy efficiency. We believe that this could be realized eitherby reducing the gas temperature inside the arc, applying a micro-scale GA with higher power density, or by removing the reversereactions, as presented in previous sections, because in these cases,the calculated conversion was found to increase up to nearly 20%,with energy efficiencies reaching up to nearly 100%. These modelpredictions are also indicated in Fig. 18. However, the small treatedgas fraction (i.e., about 20%) is still the major limiting factor for theconversion, so we believe that a better design of the reactor isneeded to improve the treated gas volume. One way to do so is byapplying a reverse vortex flow GA reactor [48,98]. Another way,which can be applied in a classical GA reactor, could be to exploitthe so-called back-breakdown phenomenon, which results in alarger gas flow velocity compared to the arc velocity [66,99–101],so that more gas can be treated by the arc. In summary, we believethat a GA plasma still has room for improvement by optimizing thegas fraction to be treated, and that it will have great potential forgas processing applications.
6. Conclusions
CO2 splitting by means of plasma technology is gainingincreasing interest, and a gliding arc (GA) plasma is one of themost promising plasma setups for this purpose. However, theunderlying mechanisms and chemical pathways are still far fromunderstood. Therefore, in this work we try to obtain a betterunderstanding of the underlying chemical mechanisms of CO2
splitting in a GA discharge, by means of a 0D chemical kineticsmodel, using assumptions based on our previous 2D and 3Dmodels.
A comparison is made between the calculated and measuredCO2 conversion and energy efficiency for various conditions, andthe conversion was typically in the order of 6–10%, while theenergy efficiency was around 20–40%. These are reasonable valueswhen compared to other plasma technologies, but they are alsostill subject to improvement. A very good agreement was reachedbetween the calculated and experimental data, indicating that themodel can be used to identify the important species and reactionsplaying a role in the CO2 splitting, i.e., the main production and losspathways of CO2. This allows us to gain sufficient insight into theentire process, and to identify the limiting factors for CO2
conversion, and thus to propose solutions for improving the CO2
conversion based on the chemical reaction pathway analysis.Our study clearly reveals that in the experimental plasma
power range of 70–100 W, electron impact dissociation of CO2
molecules in vibrational levels (i.e., CO2(v) + e ! CO + O + e) is themain loss pathway of CO2 at a gas temperature inside the arc of
1200 K. Because of the crucial role of the vibrationally excitedstates of CO2 for energy-efficient dissociation, we investigated thevibrational distribution functions (VDFs) of the asymmetric modeof CO2 at different values of the plasma power. The populations ofthe vibrational levels slightly rise with increasing plasma power,which explains the rise in the CO2 conversion with plasma power.However, at the conditions investigated, mainly the lowerasymmetric mode and symmetric mode vibrational levels of CO2
are important for CO2 splitting, which limits the energy efficiency.Moreover, for all plasma powers investigated, the three-bodyrecombination between CO and O atoms (i.e., CO + O + M ! CO2 +M) is the main production process for CO2, and this limits theconversion. Thus, in order to further improve the CO2 conversion,the reversion reaction should be inhibited or at least reduced.
As we were able to identify the limiting factors that prevent ahigher and more energy-efficient CO2 conversion, we can proposesolutions on how this process can be further improved. First, ourmodel predicts that when the gas temperature inside the arc couldbe reduced to 1000 K, the conversion and energy efficiency wouldincrease up to 18% and 96%, respectively, because (i) the reversereaction between CO and O atoms is significantly reduced, as the Oatoms are more efficiently used for other reactions (i.e., O3
formation) at low temperature, and (ii) the higher vibrationallyexcited levels become much more important (see below). On theother hand, increasing the gas temperature up to 3000 K also yieldsa significant rise in the CO2 conversion up to 16.5%, but the energyefficiency is only about 29%. In this case, the plasma is only aprovider of the required high temperature to speed up thechemical reactions, but the energy inserted in the plasma is equallydistributed over the various degrees of freedom, and theadvantages of non-equilibrium vibrational excitation of CO2
disappear. Indeed, by investigating the VDFs of the asymmetricmode of CO2 at various gas temperatures, we found that thepopulations of the higher asymmetric mode vibrational levels arevery low at a gas temperature of 1200–3000 K, so they are notimportant for the dissociation of CO2. However, at a gastemperature of 1000 K, the densities of the higher asymmetricmode vibrational levels are very large, pointing towards a clearnon-equilibrium situation, and leading to a higher CO2 conversionand energy efficiency. Reducing the temperature inside the arcmight be realized in practice by means of a high frequency GAdischarge, so that the arc has not enough time to heat up.
Second, by increasing the power density, both the conversionand energy efficiency show a significant improvement, reaching upto 19% and 66% respectively, at a power density of 4.6 � 104W/cm3.These calculations were performed in the same experimentalpower range of 70–100 W, but the power density increases from3.6 � 104 to 5.1 �104W/cm3 by using a constant arc column radiusof 0.5 mm. At a larger power density, the dissociation ofvibrationally excited states of CO2 upon collisions with any neutralspecies (M) or with O atoms become the most important CO2
splitting mechanisms. Moreover, the higher asymmetric modevibrational states play an important role in the splitting process,resulting in a higher conversion and energy efficiency. In practice,we believe that a higher power density could be achieved byapplying a micro-scale GA reactor, as also demonstrated inliterature [57].
Third, we demonstrate by our model that if the O atoms, formedby the CO2 splitting, could be removed from the system, e.g., bychemical trapping with H atoms, the most important reversereaction, i.e., the three-body recombination of CO with O atomsforming again CO2, could be blocked, and consequently, the CO2
conversion and energy efficiency can increase by again more than afactor two.
Finally, we believe that the conversion in the GA dischargecould be further enhanced by increasing the fraction of treated gas

S.R. Sun et al. / Journal of CO2 Utilization 17 (2017) 220–234 233
in the arc. Indeed, the improvements proposed above can achieve atheoretical conversion of nearly 20%, along with a theoreticalenergy efficiency of 100%, but the conversion cannot exceed 20%,because this corresponds to the fraction of gas that passes throughthe arc, as assumed in the model, while the other gas fraction flowsthrough the reactor without passing through the arc. Increasingthe gas fraction treated by the arc can be realized experimentally ifthe gas flow velocity is larger than the arc velocity, which can bethe result of the so-called back-breakdown phenomenon, whichreduces the arc velocity [99–101]. In experiments, some operatingparameters can be adjusted to control the occurrence of the back-breakdown process, such as the gas flow rate, the current and thereactor structure. Other possible solutions could be modificationsto the reactor design, allowing more gas to pass through the arc,like in a reverse vortex flow GA discharge [48,98].
By comparing our results with other commonly used plasmareactors for CO2 conversion, we can conclude that the energyefficiency of CO2 splitting in a GA discharge is indeed verypromising, and better than in other plasma types at atmosphericpressure. However, the corresponding conversion should befurther improved in order to make the GA plasma technique morecompetitive with other technologies. We believe that a betterunderstanding of the CO2 splitting mechanisms in a GA discharge,as obtained in this study, is very valuable, as it allow us to proposesolutions on how to improve the conversion, which can guidefurther experimental optimizations.
Acknowledgments
We acknowledge financial support from the IAP/7 (Inter-university Attraction Pole) program ‘PSI-Physical Chemistry ofPlasma-Surface Interactions’ by the Belgian Federal Office forScience Policy (BELSPO) and the Fund for Scientific ResearchFlanders (FWO; Grant no. G.0383.16N). The calculations werecarried out using the Turing HPC infrastructure at the CalcUA corefacility of the Universiteit Antwerpen (UAntwerpen), a division ofthe Flemish Supercomputer Center VSC, funded by the HerculesFoundation, the Flemish Government (department EWI) and theUAntwerpen. This work is also supported by National NaturalScience Foundation of China (grant nos. 11275021, 11575019). S RSun thanks the financial support from the China ScholarshipCouncil (CSC).
References
[1] J.J. Shah, H.B. Singh, Environ. Sci. Technol. 22 (12) (1988) 1381–1388.[2] J. Qiao, Y. Liu, F. Hong, J. Zhang, Chem. Soc. Rev. 43 (2014) 631–675.[3] M. Aresta, A. Dibenedetto, A. Angelini, Chem. Rev. 114 (2014) 1709–1742.[4] Eric E. Benson, Clifford P. Kubiak, Aaron J. Sathrum, Jonathan M. Smieja,
Chem. Soc. Rev. 38 (2009) 89–99.[5] J. Shi, Y. Jiang, Z. Jiang, X. Wang, X. Wang, S. Zhang, P. Han, C. Yang, Chem. Soc.
Rev. 44 (2015) 5981–6000.[6] S.D. Ebbesen, S.H. Jensen, A. Hauch, M.B. Mogensen, Chem. Rev. 114 (2014)
10697–10734.[7] W. Wang, S. Wang, X. Ma, J. Gong, Chem. Soc. Rev. 40 (2011) 3703–3727.[8] A. Goeppert, M. Czaun, J.P. Jones, G.K.S. Prakash, G.A. Olah, Chem. Soc. Rev. 43
(2014) 7995–8048.[9] Y. Ma, X. Wang, Y. Jia, X. Chen, H. Han, C. Li, Chem. Rev. 114 (2014) 9987–
10043.[10] A. Fridman, Plasma Chemistry, Cambridge University Press, Cambridge, 2008.[11] I.A. Semiokhin, Y.P. Andreev, G.M. Panchenkov, Russ. J. Phys. Chem. 38 (8)
(1964) 1126.[12] A.N. Maltsev, E.N. Eremin, L.V. Ivanter, Russ. J. Phys. Chem. 41 (1967) 633.[13] Y.P. Andreev, I.A. Semiokhin, Y.M. Voronkov, V.A. Sirotkina, V.A. Kaigorodov,
Russ. J. Phys. Chem. 45 (1971) 1587.[14] V.D. Rusanov, A.A. Fridman, G.V. Sholin, Sov. Phys.—Usp. 24 (6) (1981) 447–
474.[15] R.I. Asisov, A.A. Fridman, V.K. Givotov, E.G. Krasheninnikov, B.I. Petrushev, B.V.
Potapkin, V.D. Rusanov, M.F. Krotov, I.V. Kurchatov, Carbon dioxidedissociation in non-equilibrium plasma, 5th Int Symp. on Plasma Chemistry,Edinburgh, UK, 1981, pp. 774.
[16] R.I. Azizov, A.K. Vakar, V.K. Zhivotov, M.F. Krotov, O.A. Zinov’ev, B.V. Potapkin,V.D. Rusanov, A.A. Rusanov, A.A. Fridman, Sov. Phys. Dokl. 28 (7) (1983) 567–569.
[17] R. Aerts, W. Somers, A. Bogaerts, ChemSusChem 8 (2015) 702–716.[18] R. Snoeckx, R. Aerts, X. Tu, A. Bogaerts, J. Phys. Chem. C 117 (2013) 4957–4970.[19] R. Snoeckx, Y.X. Zeng, X. Tu, A. Bogaerts, RSC Adv. 5 (2015) 29799–29808.[20] X. Tu, J.C. Whitehead, Appl. Catal. B: Environ. 125 (2012) 439–448.[21] M. Scapinello, L.M. Martini, P. Tosi, Plasma Proc. Polym.11 (7) (2014) 624–628.[22] R. Aerts, R. Snoeckx, A. Bogaerts, Plasma Process. Polym. 11 (10) (2014) 985–
992.[23] C. De Bie, J. van Dijk, A. Bogaerts, J. Phys. Chem. C 119 (2015) 22331–22350.[24] N.R. Pinhao, A. Janeco, J.B. Branco, Plasma Chem. Plasma Proc. 31 (2011) 427–
439.[25] M. Ramakers, I. Michielsen, R. Aerts, V. Meynen, A. Bogaerts, Plasma Process.
Polym. 12 (2015) 755–763.[26] Q. Wang, Y. Cheng, Y. Jin, Catal. Today 148 (2009) 275–282.[27] A.J. Zhang, A.M. Zhu, J. Guo, Y. Xu, C. Shi, Chem. Eng. J. 156 (2010) 601–606.[28] T. Nozaki, K. Okazaki, Catal. Today 211 (2013) 29–38.[29] A. Ozkan, T. Dufour, G. Arnoult, P. De Keyzer, A. Bogaerts, F. Reniers, J. CO2 Util.
9 (2015) 74–81.[30] S. Paulussen, B. Verheyde, X. Tu, C. De Bie, T. Martens, D. Petrovic, A. Bogaerts,
B. Sels, Plasma Sour. Sci. Technol. 19 (2010) 034015.[31] B. Eliasson, U. Kogelschatz, B. Xue, L.M. Zhou, Ind. Eng. Chem. Res. 37 (1998)
3350–3357.[32] A. Ozkan, T. Dufour, T. Silva, N. Britun, R. Snyders, A. Bogaerts, F. Reniers,
Plasma Sour. Sci. Technol. 25 (2016) 025013.[33] A. Ozkan, T. Dufour, A. Bogaerts, F. Reniers, Plasma Sour. Sci. Technol. 25
(2016) 045016.[34] A. Ozkan, T. Dufour, T. Silva, N. Britun, R. Snyders, F. Reniers, A. Bogaerts,
Plasma Sour. Sci. Technol. 25 (2016) 055005.[35] N. Britun, T. Godfroid, R. Snyders, Plasma Sour. Sci. Technol. 21 (2012) 035007.[36] T. Silva, N. Britun, T. Godfroid, R. Snyders, Plasma Sour. Sci. Technol. 23 (2014)
025009.[37] A. Vesel, M. Mozetic, A. Drenik, M. Balat-Pichelin, Chem. Phys. 382 (2011)
127–131.[38] L.F. Spencer, A.D. Gallimore, Plasma Sour. Sci. Technol 22 (2013) 015019.[39] S. Heijkers, R. Snoeckx, T. Kozak, T. Silva, T. Godfroid, N. Britun, R. Snyders, A.
Bogaerts, J. Phys. Chem. C 119 (23) (2015) 12815–12828.[40] G. Chen, T. Silva, V. Georgieva, T. Godfroid, N. Britun, R. Snyders, M.P.
Delplancke-Ogletree, Int. J. Hydrog. Energy 40 (20) (2015) 3789–3796.[41] G. Chen, V. Georgieva, T. Godfroid, R. Snyders, M.P. Delplancke-Ogletree, Appl.
Catal. B: Environ. 190 (2016) 115–124.[42] M. Scapinello, L.M. Martini, G. Dilecce, P. Tosi, J. Phys. D: Appl. Phys. 49 (2016)
075602.[43] X.S. Li, B. Zhu, C. Shi, Y. Xu, A.M. Zhu, AIChE J. 57 (2011) 2854–2860.[44] B. Zhu, X.S. Li, C. Shi, J.L. Liu, T.L. Zhao, A.M. Zhu, Int. J. Hydrog. Energy 37
(2012) 4945–4954.[45] B. Zhu, X.S. Li, J.L. Liu, X. Zhu, A.M. Zhu, Chem. Eng. J. 264 (2015) 445–452.[46] V. Shapoval, E. Marotta, C. Ceretta, N. Konjevic, M. Ivkovic, M. Schiorlin, C.
Paradisi, Plasma Process. Polym. 11 (2014) 787–797.[47] V. Shapoval, E. Marotta, Plasma Process. Polym. 12 (2015) 808–816.[48] T. Nunnally, K. Gutsol, A. Rabinovich, A. Fridman, A. Gutsol, A. Kemoun, J.
Phys. D Appl. Phys. 44 (27) (2011) 274009.[49] A. Indarto, D.R. Yang, J.W. Choi, H. Lee, H.K. Song, J. Hazard. Mater. 146 (2007)
309–315.[50] A. Indarto, J.W. Choi, H. Lee, H.K. Song, Environ. Eng. Sci. 23 (6) (2006) 1033–
1043.[51] Z. Bo, J. Yan, X. Li, Y. Chi, K. Cen, Int. J. Hydrog. Energy 33 (20) (2008) 5545–
5553.[52] Y.C. Yang, B.J. Lee, Y.N. Chun, Energy 34 (2) (2009) 172–177.[53] X. Tu, J.C. Whitehead, Int. J. Hydrog. Energy 39 (18) (2014) 9658–9669.[54] N. Rueangjitt, T. Sreethawong, S. Chavadej, Plasma Chem. Plasma Process. 28
(2008) 49–67.[55] N. Rueangjitt, C. Akarawitoo, T. Sreethawong, S. Chavadej, Plasma Chem.
Plasma Process. 27 (2007) 559–576.[56] S.C. Kim, M.S. Lim, Y.N. Chun, Plasma Chem. Plasma Process. 34 (2014) 125–
143.[57] N. Rueangjitt, T. Sreethawong, S. Chavadej, H. Sekiguchi, Chem. Eng. J. 155 (3)
(2009) 874–880.[58] A. Wu, J. Yan, H. Zhang, M. Zhang, C. Du, X. Li, Int. J. Hydrog. Energy 39 (2014)
17656–17670.[59] X. Li, H. Zhang, S. Yan, J. Yan, C. Du, IEEE Trans. Plasma Sci. 41 (1) (2013) 126–
132.[60] K. Li, J.L. Liu, X.S. Li, X. Zhu, A.M. Zhu, Chem. Eng. J. 288 (2016) 671–679.[61] A. Fridman, S. Nester, L.A. Kennedy, A. Saveliev, O. Mutaf-Yardimci, Prog.
Energy Combust. Sci. 25 (1999) 211–231.[62] O. Mutaf-Yardimci, A.V. Saveliev, A.A. Fridman, L.A. Kennedy, J. Appl. Phys. 87
(4) (2000) 1632–1641.[63] I.V. Kuznetsova, N.Y. Kalashnikov, A.F. Gutsol, A.A. Fridman, L.A. Kennedy, J.
Appl. Phys. 92 (8) (2002) 4231–4237.[64] A. Czernichowski, Pure Appl. Chem. 66 (6) (1994) 1301–1310.[65] St. Kolev, A. Bogaerts, Plasma Sour. Sci. Technol. 24 (2015) 015025.[66] S. Sun, St. Kolev, H.X. Wang, A. Bogaerts, Plasma Sour. Sci. Technol. 26 (2017)
015003.[67] T. Kozak, A. Bogaerts, Plasma Sour. Sci. Technol. 23 (2014) 045004.[68] T. Kozak, A. Bogaerts, Plasma Sour. Sci. Technol. 24 (2015) 015024.

234 S.R. Sun et al. / Journal of CO2 Utilization 17 (2017) 220–234
[69] X. Tu, H.J. Gallon, J.C. Whitehead, Electrical and optical diagnostics ofatmospheric pressure argon gliding arc plasma jet, 30th Int Conf. onPhenomena in Ionized Gases, Belfast, UK, 28 August–2 September 2011, 2011,pp. C10.
[70] X. Tu, H.J. Gallon, J.C. Whitehead, IEEE Trans. Plasma Sci. 39 (2011) 2900–2901.
[71] S. Pancheshnyi, B. Eismann, G.J.M. Hagelaar, L.C. Pitchford, Computer CodeZDPlasKin, University of Toulouse, LAPLACE, CNRS-UPS-INP, Toulouse,France, 2008. http://www.zdplaskin.laplace.univ-tlse.fr.
[72] A. Berthelot, A. Bogaerts, Plasma Sour. Sci. Technol. 25 (2016) 045022.[73] P. Koelman, S. Heijkers, S. Tadayon Mousavi, W. Graef, D. Mihailova, T. Kozák,
A. Bogaerts, J. van Dijk, A comprehensive chemical model for the splitting ofCO2 in non-equilibrium plasmas, Plasma Process Polym. (2016) in press).
[74] Phelps Database, www.lxcat.net (retrieved on 1 December 2015).[75] G.J.M. Hagelaar, L.C. Pitchford, Plasma Sour. Sci. Technol. 14 (2005) 722–733.[76] A. Bogaerts, W. Wang, A. Berthelot, V. Guerra, Plasma Sour. Sci. Technol. 25
(2016) 055016.[77] N. Pinhao, A. Moura, J.B. Branco, J. Neves, Int. J. Hydrog. Energy 14 (22) (2016)
9245–9255.[78] F. Richard, J.M. Cormier, S. Pellerin, J. Chapelle, J. Appl. Phys. 79 (1996) 2245.[79] S. Pellerin, F. Richard, J. Chapelle, J.M. Cormier, K. Musiol, J. Phys. D Appl. Phys.
33 (2000) 2407–2419.[80] A. Czernichowski, H. Nassar, A. Ranaivosoloarimanana, Acta Phys. Pol., A 89
(1996) 595–603.[81] A. Czernichowski, Oil & gas science and technology �Rev, IFP 56 (2) (2001)
181–198.[82] S.P. Gangoli, Experimental and Modeling Study of Warm Plasmas and Their
Applications. PhD Thesis, Drexel University, 2007.[83] I. Rusu, J.M. Cormier, Chem. Eng. J. 91 (1) (2003) 23–31.[84] F. Ouni, A. Khacef, J.M. Cormier, Chem. Eng. Technol. 29 (5) (2006) 604–609.
[85] J.M. Cormier, I. Rusu, M. Dudemaine, D. Sibiescu, Proc. 4th Int Conf.Optimization of Electrical and Electronic Equipments OPTIM’1, Brasov, 2002.
[86] A. Indarto, J.W. Choi, H. Lee, H.K. Song, Energy 31 (2006) 2986–2995.[87] U. Kogelschatz, Plasma Chem. Plasma Process. 23 (1) (2003) 1–46.[88] R. Aerts, R. Snoeckx, A. Bogaerts, Plasma Process. Polym. 11 (2014) 985–992.[89] R. Snoeckx, S. Heijkers, K. Van Wesenbeeck, S. Lenaerts, A. Bogaerts, Energy
Environ. Sci. 9 (2016) 999–1011.[90] J. Adanez, A. Abad, F. Garcia-Labiano, P. Gayan, L.F. de Diego, Prog. Energy
Combust. Sci. 38 (2012) 215–282.[91] Y. Tagawa, S. Mori, M. Suzuki, I. Yamanaka, T. Obara, J. Ryu, Y. Kato, Kagaku
Kogaku Ronbunshu 37 (2) (2011) 114–119.[92] A.P.H. Goede, W.A. Bongers, M.G. Graswinckel, R.M.C. van de Sanden, L.
Martina, K. Jochen, A. Schulz, W. Mathias, 3rd Eur. Energy Conf. Budapest(2013).
[93] K. Van Laer, A. Bogaerts, Energy Technol. 3 (2015) 1038–1044.[94] Q. Yu, M. Kong, T. Liu, J. Fei, X. Zheng, Plasma Chem. Plasma Process. 32 (2012)
153–163.[95] D. Mei, X. Zhu, Y. He, J.D. Yan, X. Tu, Plasma Sour. Sci. Technol. 24 (2015)
015011.[96] J.Q. Zhang, J.S. Zhang, Y.J. Yang, Q. Liu, Energy Fuels 17 (1) (2003) 54–59.[97] M. Leins, S. Gaiser, J. Kopecki, W.A. Bongers, A. Goede, M.F. Graswinckel, A.
Schulz, M. Walker, M.C.M. van de Sanden, T. Hirth, 22nd InternationalSymposium on Plasma Chemistry, P-II-8-18, Antwerp Belgium, 2015.
[98] G. Trenchev, St. Kolev, A. Bogaerts, Plasma Sour. Sci. Technol. 25 (2016)035014.
[99] S. Pellerin, O. Martinie, J.M. Cormier, J. Chapelle, P. Lefaucheux, High Temp.Mater. Process. 3 (2) (1999) 167–180.
[100] J. Zhu, Z. Sun, Z. Li, A. Ehn, M. Alden, M. Salewski, F. Leipold, Y. Kusano, J. Phys.D: Appl. Phys. 47 (29) (2014) 295203.
[101] F. Mitsugi, J. Furukawa, T. Ohshima, H. Kawasaki, T. Kawasaki, S. Aoqui, H.D.Stryczewska, Eur. Phys. J.: Appl. Phys. 61 (2) (2013) 24308.