Journal of Cancer Science & Therapy Open Access · Journal of Cancer Science & Therapy - Open...
8
O M I C S P u blishin g G r o u p J Cancer Sci er ISSN:1948-5956 JCST, an open access journal Volume 2(5): 145-152 (2010) - 145 Journal of Cancer Science & Therapy - Open Access Research Article OPEN ACCESS Freely available online doi:10.4172/1948-5956.1000040 JCST/Vol.2 Issue 5 MU-Tomo: Independent Dose Validation Software for Helical TomoTherapy Nikos Papanikolaou 1 *, Weihong He 1 , Luis A Vazquez Q 1 , Alonso Gutierrez 1 , Sotirios Stathakis 1 , Hassaan Alkhatib 2 and Chengyu Shi 1 1 Cancer Therapy and Research Center, Department of Radiation Oncology, University of Texas Health Science Center at San Antonio, TX, USA 2 South Carolina Radiation Oncology Associates, Columbia, SC, USA Keywords: TomoTherapy; Second check; Independent dose calculation; Dose verification Introduction The TomoTherapy ® Hi-Art ® unit (TomoTherapy, Inc., Madison, WI) is able to deliver intensity modulated radiation therapy (IMRT) via a helical trajectory about the patient using a fan beam irradiation geometry (Mackie et al., 1993; Mackie, 2006). Helical radiation delivery is simultaneous with couch translation and gantry rotation and has certain advantages in delivering conformal dose distributions (Zacarias et al., 2006; Mackie et al., 2003; Beavis, 2004; Yang et al., 1997). The American Association of Physicists in Medicine (AAPM) recommends that doses to cancer patients need to be carefully designed and verified (Kutcher et al., 1994). Therefore, especially for IMRT, it is common to have in addition to a computer generated treatment planned a patient specific quality assurance (QA) measurement and an independent monitor unit or dose calculation to verify the treatment plan. For independent monitor unit or dose calculation, several studies have been performed for different modalities in the years past. Ayyangar et al. (2001a, b; 2003) reported on their independent dose calculations based on multi-leaf collimator (MLC) for Corvus ® , Peacock ® , and ADAC ® systems from 2001 to 2003. Beck et al. (2004) developed an algorithm for an independent verification of Gamma Knife ® treatment plans. Chen et al. (2002) provided an independent monitor unit calculation using the MIMiC™ multileaf collimator. The MLC log information was also studied as a means to perform second checks and has been reported by several research groups (Chen et al., 2005; Lorenz et al., 2007, 2008; Luo et al., 2006; Yang et al., 2003; Zhu et al., 2003). Georg et al. (2007a, b) developed a fluence-based dose calculation software MUV for independent dose verification in IMRT planning. Jansen et al. (2003) imported the planning parameters from the CadPlan ® treatment planning system into the Pinnacle 3 treatment planning system as a means to perform an independent second check. Another approach for an independent dose calculation can be established using a Monte Carlo simulation method. Edimo et al. (2009) evaluated a commercial VMC++ Monte Carlo based treatment planning system for Elekta ® SL25 linear accelerator. Kumada et al. (2009) developed a multi-modal Monte Carlo system based on boron neutron capture therapy. Kumar et al. (2008) developed a dose verification method for brachytherapy using VC++. Mukumoto et al. (2009) developed a study of dose verification with Monte Carlo simulation using the MatLAB software platform. Sarkar et al. (2008) developed a Monte Carlo model to verify the dose distributions produced by the CORVUS treatment planning system and MIMiC collimator (Sarkar et al., 2008). Similar studies have been reported in an effort to independently verify dose distributions for the TomoTherapy ® Hi-Art ® unit. Pisaturo et al. (2009) extended their Monte Carlo code (EGSnrc/BEAMnrc) of a linear accelerator to tomotherapy. Gibbons et al. (2009) proposed an analytical algorithm, based on the use of common dosimetric functions and the planned treatment sinogram, for an independent calculation of dose for TomoTherapy ® . However, the workflow of the methods reported thus far in the literature is not automated and cannot be easily integrated in routine clinical use. In this study, we report on the development of in-house software called MU-Tomo which performs an independent point dose validation of helical TomoTherapy ® treatment plans. Our method is an extension of that proposed by Gibbons, et al. (2009). Our implementation is an analytical, correction-based second check that was developed on the Matlab platform. The input data needed for the calculation include the archived patient plan and dosimetric functions, such as off-axis ratio (OAR x and OAR y ), tissue phantom ratio (TPR), and output function (S cp ). Innovations in our method include the averaging of OAR x and OAR y over the positive and negative side of the profile axis, the optimization of OAR y to minimize fluctuations, the application of Mayneord factor to correct for SSD changes in the percent depth dose, automatic depth calculation to the point *Corresponding author: Nikos Papanikolaou, Ph.D., Cancer Therapy and Research Center, Department of Radiation Oncology, 7979 Wurzbach Rd Ste 240, University of Texas Health Science Center at San Antonio, TX, USA, Tel: 210-450- 1028; Fax: 210-450-1076; E-mail: [email protected] Received July 29, 2010; Accepted September 07, 2010; Published September 07, 2010 Citation: Papanikolaou N, He W, Vazquez LA, Gutierrez A, Stathakis S, et al. (2010) MU-Tomo: Independent Dose Validation Software for Helical TomoTherapy. J Cancer Sci Ther 2: 145-152. doi:10.4172/1948-5956.1000040 Copyright: © 2010 Papanikolaou N, et al. This is an open-access article distributed under the terms of the Creative Commons Attribution License, which permits unrestricted use, distribution, and reproduction in any medium, provided the original author and source are credited. Abstract A software program, MU-Tomo, has been developed to perform an independent point dose calculation and compare it to the dose calculated from the TomoTherapy (TomoTherapy, Inc., Madison, WI) treatment planning system (TPS). Input parameters required for this software include: archived tomotherapy patient files, QA plan image coordinates, tomotherapy-calculated point dose and machine-specific dosimetric parameters such as the off-axis ratios (OAR x and OAR y ), tissue phantom ratios (TPR) and output functions (S cp ). The software was validated on four phantom models and fifty tomotherapy patient plans representing various anatomical sites. Our results indicate that MU-Tomo can perform in a few seconds an independent dose calculation accurately and provide a secondary check for a point dose validation of helical tomotherapy plans.
Transcript of Journal of Cancer Science & Therapy Open Access · Journal of Cancer Science & Therapy - Open...

OM
ICS Publishing Gro
upJ Cancer Sci Th er
ISSN:1948-5956 JCST, an open access journalVolume 2(5): 145-152 (2010) - 145
Journal of Cancer Science & Therapy - Open Access Research Article
OPEN ACCESS Freely available online
doi:10.4172/1948-5956.1000040
JCST/Vol.2 Issue 5
MU-Tomo: Independent Dose Validation Software for Helical TomoTherapyNikos Papanikolaou1*, Weihong He1, Luis A Vazquez Q1, Alonso Gutierrez1, Sotirios Stathakis1, Hassaan Alkhatib2 and Chengyu Shi1
1Cancer Therapy and Research Center, Department of Radiation Oncology, University of Texas Health Science Center at San Antonio, TX, USA2South Carolina Radiation Oncology Associates, Columbia, SC, USA
Keywords: TomoTherapy; Second check; Independent dosecalculation; Dose verification
Introduction
The TomoTherapy® Hi-Art® unit (TomoTherapy, Inc., Madison,
WI) is able to deliver intensity modulated radiation therapy
(IMRT) via a helical trajectory about the patient using a fan beam
irradiation geometry (Mackie et al., 1993; Mackie, 2006). Helical
radiation delivery is simultaneous with couch translation and gantry
rotation and has certain advantages in delivering conformal dose
distributions (Zacarias et al., 2006; Mackie et al., 2003; Beavis,
2004; Yang et al., 1997). The American Association of Physicists in
Medicine (AAPM) recommends that doses to cancer patients need to
be carefully designed and verified (Kutcher et al., 1994). Therefore,
especially for IMRT, it is common to have in addition to a computer
generated treatment planned a patient specific quality assurance (QA)
measurement and an independent monitor unit or dose calculation
to verify the treatment plan.
For independent monitor unit or dose calculation, several
studies have been performed for different modalities in the years
past. Ayyangar et al. (2001a, b; 2003) reported on their independent
dose calculations based on multi-leaf collimator (MLC) for Corvus®,
Peacock®, and ADAC® systems from 2001 to 2003. Beck et al. (2004)
developed an algorithm for an independent verification of Gamma
Knife® treatment plans. Chen et al. (2002) provided an independent
monitor unit calculation using the MIMiC™ multileaf collimator. The
MLC log information was also studied as a means to perform second
checks and has been reported by several research groups (Chen et al.,
2005; Lorenz et al., 2007, 2008; Luo et al., 2006; Yang et al., 2003;
Zhu et al., 2003). Georg et al. (2007a, b) developed a fluence-based
dose calculation software MUV for independent dose verification in
IMRT planning. Jansen et al. (2003) imported the planning parameters
from the CadPlan® treatment planning system into the Pinnacle3
treatment planning system as a means to perform an independent
second check.
Another approach for an independent dose calculation can be
established using a Monte Carlo simulation method. Edimo et al.
(2009) evaluated a commercial VMC++ Monte Carlo based treatment
planning system for Elekta® SL25 linear accelerator. Kumada et al.
(2009) developed a multi-modal Monte Carlo system based on boron
neutron capture therapy. Kumar et al. (2008) developed a dose
verification method for brachytherapy using VC++. Mukumoto et al. (2009) developed a study of dose verification with Monte Carlo simulation using the MatLAB software platform. Sarkar et al. (2008) developed a Monte Carlo model to verify the dose distributions produced by the CORVUS treatment planning system and MIMiC collimator (Sarkar et al., 2008).
Similar studies have been reported in an effort to independently verify dose distributions for the TomoTherapy® Hi-Art® unit. Pisaturo et al. (2009) extended their Monte Carlo code (EGSnrc/BEAMnrc) of a linear accelerator to tomotherapy. Gibbons et al. (2009) proposed an analytical algorithm, based on the use of common dosimetric functions and the planned treatment sinogram, for an independent calculation of dose for TomoTherapy®. However, the workflow of the methods reported thus far in the literature is not automated and cannot be easily integrated in routine clinical use.
In this study, we report on the development of in-house software called MU-Tomo which performs an independent point dose validation of helical TomoTherapy® treatment plans. Our method is an extension of that proposed by Gibbons, et al. (2009). Our implementation is an analytical, correction-based second check that was developed on the Matlab platform. The input data needed for the calculation include the archived patient plan and dosimetric functions, such as off-axis ratio (OAR
x and OAR
y), tissue phantom ratio
(TPR), and output function (Scp
). Innovations in our method include the averaging of OAR
x and OAR
y over the positive and negative side
of the profile axis, the optimization of OARy to minimize fluctuations,
the application of Mayneord factor to correct for SSD changes in the percent depth dose, automatic depth calculation to the point
*Corresponding author: Nikos Papanikolaou, Ph.D., Cancer Therapy and
Research Center, Department of Radiation Oncology, 7979 Wurzbach Rd Ste 240, University of Texas Health Science Center at San Antonio, TX, USA, Tel: 210-450-
1028; Fax: 210-450-1076; E-mail: [email protected]
Received July 29, 2010; Accepted September 07, 2010; Published September 07, 2010
Citation: Papanikolaou N, He W, Vazquez LA, Gutierrez A, Stathakis S, et al.
(2010) MU-Tomo: Independent Dose Validation Software for Helical TomoTherapy. J Cancer Sci Ther 2: 145-152. doi:10.4172/1948-5956.1000040
Copyright: © 2010 Papanikolaou N, et al. This is an open-access article
distributed under the terms of the Creative Commons Attribution License, which permits unrestricted use, distribution, and reproduction in any medium, provided
the original author and source are credited.
Abstract
A software program, MU-Tomo, has been developed to perform an independent point dose calculation and compare it to the dose calculated from the TomoTherapy (TomoTherapy, Inc., Madison, WI) treatment planning system (TPS). Input parameters required for this software include: archived tomotherapy patient fi les, QA plan image coordinates, tomotherapy-calculated point dose and machine-specifi c dosimetric parameters such as the off-axis ratios (OAR
x and
OARy), tissue phantom ratios (TPR) and output functions (S
cp). The software was validated on four phantom models and
fi fty tomotherapy patient plans representing various anatomical sites. Our results indicate that MU-Tomo can perform in a few seconds an independent dose calculation accurately and provide a secondary check for a point dose validation of helical tomotherapy plans.
Citation: Papanikolaou N, He W, Vazquez LA, Gutierrez A, Stathakis S, et al. (2010) MU-Tomo: Independent Dose Validation Software for Helical TomoTherapy. J Cancer Sci Ther 2: 145-152. doi:10.4172/1948-5956.1000040
OMIC
S Pub lishing G
roupJ Cancer Sci Th er
ISSN:1948-5956 JCST, an open access journalVolume 2(5): 145-152 (2010) - 146
of measurement (obtained from the patient specific QA calculation
in the Cheese Phantom), and automated retrieval of gantry starting
angle, delivery duration, initial position of IEC-Y of tumor setting,
field size and pitch from the archived documents. Furthermore, in our
implementation the point of measurement can be located anywhere
inside the tumor as mapped to the Cheese Phantom and is not limited
to be at the geometric center of the phantom.
Materials and Methods
MU-Tomo software framework
The purpose of this in-house developed independent dose
calculation software is to calculate quickly a point dose and compare
the calculated dose with the planned patient dose provided by the
TomoTherapy® TPS. The software has three input components: the
archived patient documents, the initial set up coordinates and dose
to the QA point, and the machine-specific dosimetric functions.
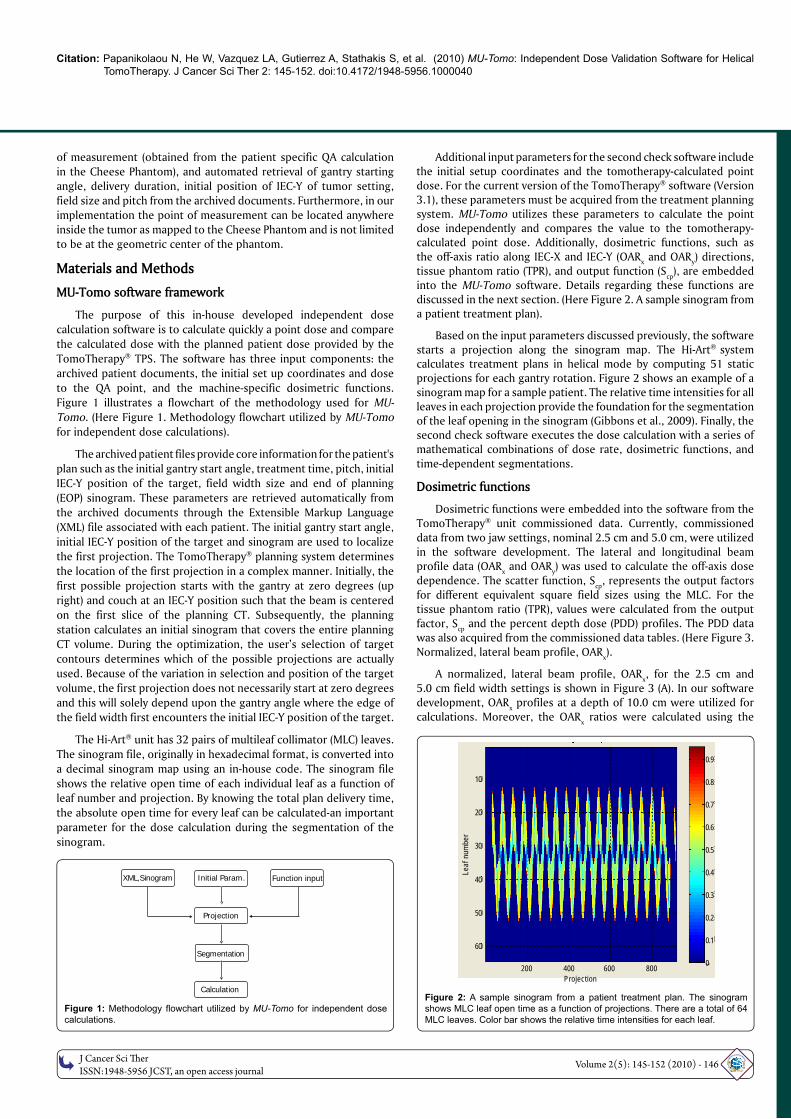
Figure 1 illustrates a flowchart of the methodology used for MU-
Tomo. (Here Figure 1. Methodology flowchart utilized by MU-Tomo
for independent dose calculations).
The archived patient files provide core information for the patient's
plan such as the initial gantry start angle, treatment time, pitch, initial
IEC-Y position of the target, field width size and end of planning
(EOP) sinogram. These parameters are retrieved automatically from
the archived documents through the Extensible Markup Language
(XML) file associated with each patient. The initial gantry start angle,
initial IEC-Y position of the target and sinogram are used to localize
the first projection. The TomoTherapy® planning system determines
the location of the first projection in a complex manner. Initially, the
first possible projection starts with the gantry at zero degrees (up
right) and couch at an IEC-Y position such that the beam is centered
on the first slice of the planning CT. Subsequently, the planning
station calculates an initial sinogram that covers the entire planning
CT volume. During the optimization, the user’s selection of target
contours determines which of the possible projections are actually
used. Because of the variation in selection and position of the target
volume, the first projection does not necessarily start at zero degrees
and this will solely depend upon the gantry angle where the edge of
the field width first encounters the initial IEC-Y position of the target.
The Hi-Art® unit has 32 pairs of multileaf collimator (MLC) leaves.
The sinogram file, originally in hexadecimal format, is converted into
a decimal sinogram map using an in-house code. The sinogram file
shows the relative open time of each individual leaf as a function of
leaf number and projection. By knowing the total plan delivery time,
the absolute open time for every leaf can be calculated-an important
parameter for the dose calculation during the segmentation of the
sinogram.
Additional input parameters for the second check software include the initial setup coordinates and the tomotherapy-calculated point dose. For the current version of the TomoTherapy® software (Version 3.1), these parameters must be acquired from the treatment planning system. MU-Tomo utilizes these parameters to calculate the point dose independently and compares the value to the tomotherapy-calculated point dose. Additionally, dosimetric functions, such as the off-axis ratio along IEC-X and IEC-Y (OAR
x and OAR
y) directions,
tissue phantom ratio (TPR), and output function (Scp
), are embedded into the MU-Tomo software. Details regarding these functions are discussed in the next section. (Here Figure 2. A sample sinogram from a patient treatment plan).
Based on the input parameters discussed previously, the software starts a projection along the sinogram map. The Hi-Art® system calculates treatment plans in helical mode by computing 51 static projections for each gantry rotation. Figure 2 shows an example of a sinogram map for a sample patient. The relative time intensities for all leaves in each projection provide the foundation for the segmentation of the leaf opening in the sinogram (Gibbons et al., 2009). Finally, the second check software executes the dose calculation with a series of mathematical combinations of dose rate, dosimetric functions, and time-dependent segmentations.
Dosimetric functions
Dosimetric functions were embedded into the software from the TomoTherapy® unit commissioned data. Currently, commissioned data from two jaw settings, nominal 2.5 cm and 5.0 cm, were utilized in the software development. The lateral and longitudinal beam profile data (OAR
x and OAR
y) was used to calculate the off-axis dose
dependence. The scatter function, Scp
, represents the output factors for different equivalent square field sizes using the MLC. For the tissue phantom ratio (TPR), values were calculated from the output factor, S
cp and the percent depth dose (PDD) profiles. The PDD data
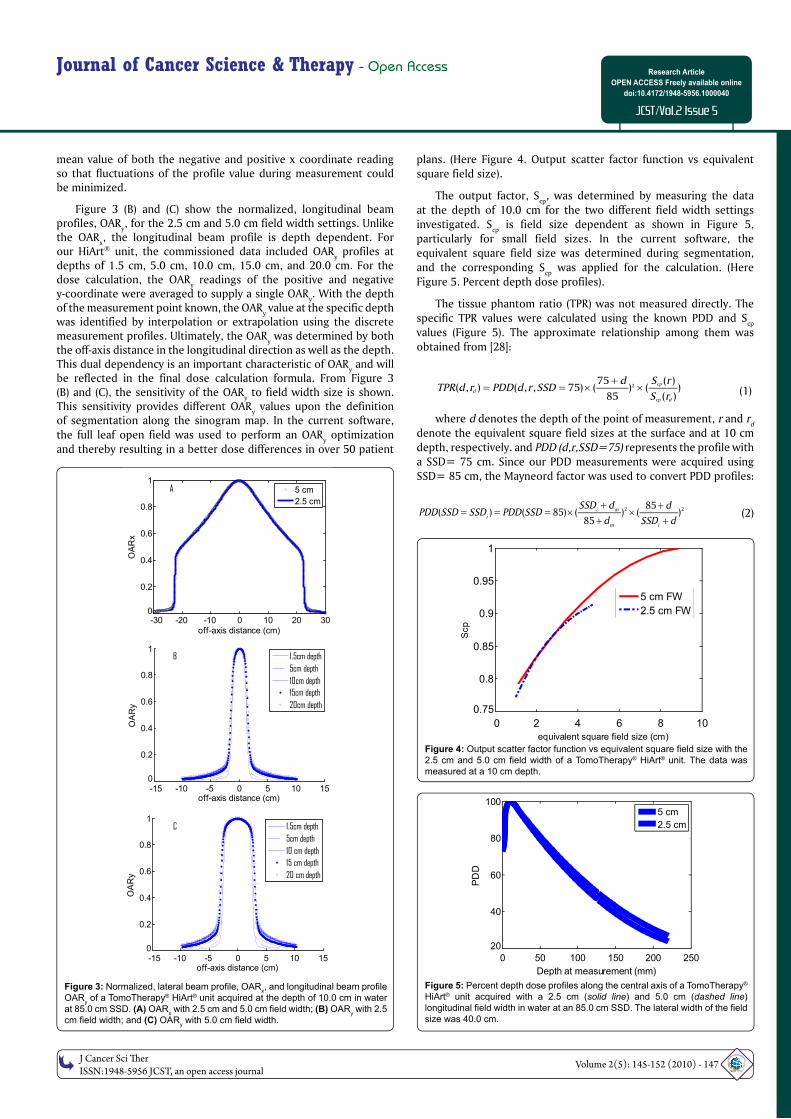
was also acquired from the commissioned data tables. (Here Figure 3. Normalized, lateral beam profile, OAR
x).
A normalized, lateral beam profile, OARx, for the 2.5 cm and
5.0 cm field width settings is shown in Figure 3 (A). In our software development, OAR
x profiles at a depth of 10.0 cm were utilized for
calculations. Moreover, the OARx ratios were calculated using the
Figure 1: Methodology fl owchart utilized by MU-Tomo for independent dose
calculations.
Figure 2: A sample sinogram from a patient treatment plan. The sinogram shows MLC leaf open time as a function of projections. There are a total of 64
MLC leaves. Color bar shows the relative time intensities for each leaf.
XML,Sinogram Initial Param. Function input
Projection
Segmentation
Calculation
Leaf
num
ber
Projection
10
20
30
40
50
60
0.9
0.8
0.7
0.6
0.5
0.4
0.3
0.2
0.1
0200 400 600 800
OM
ICS Publishing Gro
upJ Cancer Sci Th er
ISSN:1948-5956 JCST, an open access journalVolume 2(5): 145-152 (2010) - 147
Journal of Cancer Science & Therapy - Open Access Research Article
OPEN ACCESS Freely available online
doi:10.4172/1948-5956.1000040
JCST/Vol.2 Issue 5
0 50 100 150 200 250
20
40
60
80
100
Depth at measurement (mm)
PD
D
5 cm
2.5 cm
0 2 4 6 8 10
0.75
0.8
0.85
0.9
0.95
1
equivalent square field size (cm)
Scp
5 cm FW
2.5 cm FW
mean value of both the negative and positive x coordinate reading so that fluctuations of the profile value during measurement could be minimized.
Figure 3 (B) and (C) show the normalized, longitudinal beam profiles, OAR
y, for the 2.5 cm and 5.0 cm field width settings. Unlike
the OARx, the longitudinal beam profile is depth dependent. For
our HiArt® unit, the commissioned data included OARy profiles at
depths of 1.5 cm, 5.0 cm, 10.0 cm, 15.0 cm, and 20.0 cm. For the dose calculation, the OAR
y readings of the positive and negative
y-coordinate were averaged to supply a single OARy. With the depth
of the measurement point known, the OARy value at the specific depth
was identified by interpolation or extrapolation using the discretemeasurement profiles. Ultimately, the OAR
y was determined by both
the off-axis distance in the longitudinal direction as well as the depth. This dual dependency is an important characteristic of OAR
y and will
be reflected in the final dose calculation formula. From Figure 3(B) and (C), the sensitivity of the OAR
y to field width size is shown.
This sensitivity provides different OARy values upon the definition
of segmentation along the sinogram map. In the current software, the full leaf open field was used to perform an OAR
y optimization
and thereby resulting in a better dose differences in over 50 patient
plans. (Here Figure 4. Output scatter factor function vs equivalent square field size).
The output factor, Scp
, was determined by measuring the data at the depth of 10.0 cm for the two different field width settings investigated. S
cp is field size dependent as shown in Figure 5,
particularly for small field sizes. In the current software, the equivalent square field size was determined during segmentation, and the corresponding S
cp was applied for the calculation. (Here
Figure 5. Percent depth dose profiles).
The tissue phantom ratio (TPR) was not measured directly. The specific TPR values were calculated using the known PDD and S
cp
values (Figure 5). The approximate relationship among them was obtained from [28]:
275 ( )
( , ) ( , , 75) ( ) ( )85 ( )
cp
d
cp d
d S rTPR d r PDD d r SSD
S r
(1)
where d denotes the depth of the point of measurement, r and rd
denote the equivalent square field sizes at the surface and at 10 cm depth, respectively. and PDD (d,r,SSD=75) represents the profile with a SSD= 75 cm. Since our PDD measurements were acquired using SSD= 85 cm, the Mayneord factor was used to convert PDD profiles:
2 285( ) ( 85) ( ) ( )
85i m
i
m i
SSD d dPDD SSD SSD PDD SSD
d SSD d
(2)
Figure 3: Normalized, lateral beam profi le, OARx, and longitudinal beam profi le
OARy of a TomoTherapy® HiArt® unit acquired at the depth of 10.0 cm in water
at 85.0 cm SSD. (A) OARx with 2.5 cm and 5.0 cm fi eld width; (B) OAR
y with 2.5
cm fi eld width; and (C) OARy with 5.0 cm fi eld width.
Figure 4: Output scatter factor function vs equivalent square fi eld size with the 2.5 cm and 5.0 cm fi eld width of a TomoTherapy® HiArt® unit. The data was measured at a 10 cm depth.
Figure 5: Percent depth dose profi les along the central axis of a TomoTherapy® HiArt® unit acquired with a 2.5 cm (solid line) and 5.0 cm (dashed line) longitudinal fi eld width in water at an 85.0 cm SSD. The lateral width of the fi eld
size was 40.0 cm.
-30 -20 -10 0 10 20 300
0.2
0.4
0.6
0.8
1
off-axis distance (cm)
OA
Rx
5 cm
2.5 cm
A
-15 -10 -5 0 5 10 150
0.2
0.4
0.6
0.8
1
off-axis distance (cm)
OA
Ry
1.5cm depth5cm depth10cm depth15cm depth20cm depth
B
-15 -10 -5 0 5 10 150
0.2
0.4
0.6
0.8
1
off-axis distance (cm)
OA
Ry
1.5cm depth5cm depth10 cm depth15 cm depth20 cm depth
C

Citation: Papanikolaou N, He W, Vazquez LA, Gutierrez A, Stathakis S, et al. (2010) MU-Tomo: Independent Dose Validation Software for Helical TomoTherapy. J Cancer Sci Ther 2: 145-152. doi:10.4172/1948-5956.1000040
O
MIC
S Publishing GroupJ Cancer Sci Th er
ISSN:1948-5956 JCST, an open access journalVolume 2(5): 145-152 (2010) - 148
where SSDi represents the source to surface distance for each
projection and dm is the depth with maximum PDD. The TPR depends
on both the depth of measurement and equivalent square field size.
Segmentation of sinogram projection
The sinogram was converted to provide the open times for each MLC leaf. From the sinogram file, the time intensity distribution for the 64 leaves in any projection was found and shown to be mostly non-symmetrical. The goal of the sinogram segmentation was to bin multiple patterns with constant intensity in each pattern within any projection so that the superposition of these patterns produced the composite intensity modulation. The segmentation was accomplished by averaging the time distribution symmetrically around the central leaf position for each projection. The central leaf position was defined as the MLC leaf directly normal to the point of measurement. Subsequently, the outer- most leaf, which was identified as the leaf with the maximum distance from the central leaf, was determined. Starting from the outer-most leaf, the first evenly distributed segmentation pattern was determined. All leaves in the first pattern were assigned the same open time as the outer-most leaf. Gradually, the segmentation patterns moved from the first outer-most leaf to the central leaf. The open time for any given segmentation pattern was obtained by subtracting the previous segmented time from the current leaf open time. Once the iteration reaches the central leaf, the segmentation is complete.
Within each segmentation pattern, the equivalent square field size was determined. The S
cp for each segmented pattern was obtained
from the relationship between the equivalent square field size and Scp
as discussed above. The software calculated the dose from all these segmentation patterns within one projection and accumulated the total dose from all the projections.
Dose calculation algorithm
The dose calculation formula used in our second check software was first proposed by Gibbons et al. (2009) and is shown in Eq. 3. The objective of this calculation is to utilize the dosimetric functions, archived patient documents and coordinates of the point of measurement along with the segmented sinogram to accumulate the dose to a point from all the segmented patterns of all projections.
.
. ,2
0 , ,1 1
85( ) ( ) ( ) ( , )
N Nproj seg t
p x i ij cp j j i y j i ii j
i
D D OAR X t S TPR d OAR Y dSPD
(3)
Equation (3) shows how the dose at a point P is calculated based on the information entered into MU-Tomo. D
0 is the dose rate under
normalization conditions and is measured at a depth of 10.0 cm in water with a field size of 40×5 cm2 and SAD= 85.0 cm.
SPD is the source to point of measurement distance. For each projection, the SPD was calculated as follows:
2 2 2( ) ( ) ( )i x i y i z i
SPD P X P Y P Z (4)
where Px, P
y, and P
z are the relative coordinates from the point
of measurement to the gantry axis; Xi, Y
i, and Z
i are the relative
coordinates from the source to the gantry axis. Px, P
y, and P
z are
acquired from the initial input data, and Xi, Y
i, and Z
i are computed
as follows:
1
sin( );
cos( );
; 1;
0; 1;
i i
i i
i i m
i
X SAD
Z SAD
Y Y d i
Y i
(5)
Where i is the angle between the gantry at the ith projection
and zero degree. dm is the distance of movement along the gantry
projection. In the static mode, dm is always zero because no movement
exists. In helical mode, dm is computed as follows:
_
_ _ _ _m
field widthd pitch
number of projection per rotation
(6)
Using the pitch and field width from the patient archive, the distance of movement per projection can then be calculated.
Both OARx
and OARy values were normalized at the maximum
value and interpolation and extrapolation procedures were applied. The software can derive the OAR
x value for a given off-axis distance
along the lateral direction. OARx values were extrapolated to
±30.0 cm. The OARy values were extrapolated to±50.0 cm in the
longitudinal direction. To identify the OARy value, both the off-axis
longitudinal distance and depth of the point of measurement are required. Using Equation (1), the TPR values can then be calculated. For each segmentation pattern, the S
cp,j value is the output factor
for the j th segmentation pattern and tij is the delivery time in the jth
segmentation pattern within the i th projection.
From Equation (3), it can be seen that both TPR and OARy
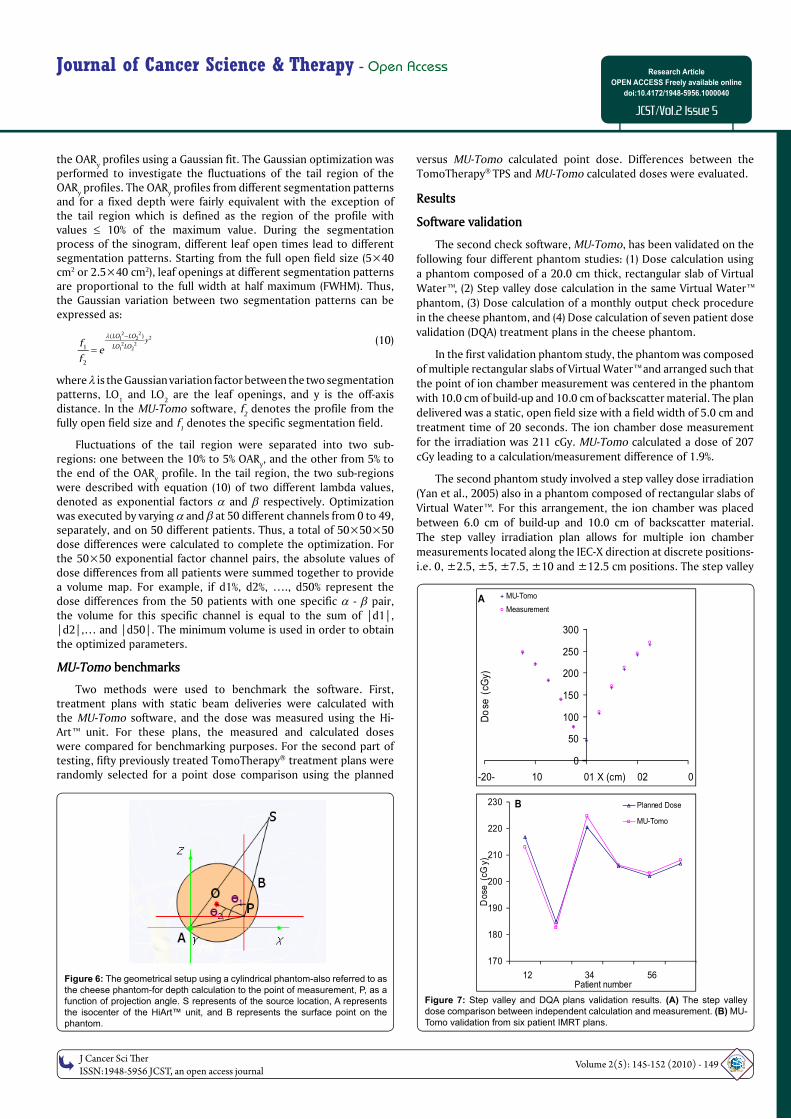
values depend on the depth between the surface and point of measurement. In our software, the second check calculation is based on the patient plan as calculated on a cylindrical water equivalent phantom (Standard Imaging, Middleton WI). The depth is obtained automatically from the plan and is unique for each patient and for the point that was selected for the second check calculation. (Here Figure 6. The geometrical setup using a cylindrical phantom).
The cylindrical phantom, also commonly known as the “cheese” phantom, is a quality assurance device that is included with the Hi-Art™ unit QA package. The radius of the phantom is 15.0 cm. Figure 6 shows an illustration of the geometry used in the software to calculate the depth for any given projection. In Figure 6, the line BP is the projection of the depth in the IEC-X and IEC-Z plane. The green lasers represent the isocenter and gantry rotation axis of the Hi-Art™ unit, and the red lasers represent the localization of point P. Point O is the geometrical center of the phantom. Point S represents the source position. Angles
1 and
2 are calculated as:
2 2 2
1 cos( )2
AP SP SADa
AP SP
(7) 2 2 2
2 cos( )2
OP AP AOa
AP OP
With these parameters known, the length of BP can be derived
from with the following relationship:
2 2 21 22 cos( ) 0BP OP BP OP R (8)
The final depth from the surface to the point of measurement, P, is then deduced from BP.
OARy optimization
OARy is a parameter dependent on three factors: the off-axis
distance in the longitudinal direction, the depth of the point of calculation in the patient or phantom and the segmented field size. Interpolation and extrapolation procedures were used to derive the value of OAR
y for randomly selected points of measurement. This can
be a very time consuming procedure when performed on the fly.
To optimize this process and to gain substantial time savings (ten-fold) in the calculation, we implemented an optimization method for
OMIC
S Pub lishing G
roupJ Cancer Sci Th er
ISSN:1948-5956 JCST, an open access journalVolume 2(5): 145-152 (2010) - 149
Journal of Cancer Science & Therapy - Open Access Research Article
OPEN ACCESS Freely available online
doi:10.4172/1948-5956.1000040
JCST/Vol.2 Issue 5
A
0
50
100
150
200
250
300
-20- 10 01 02 0X (cm)
Do
se (
cGy)
MU-Tomo
Measurement
B
170
180
190
200
210
220
230
12 34 56Patient number
Dose
(cG
y)
Planned Dose
MU-Tomo
the OARy profiles using a Gaussian fit. The Gaussian optimization was
performed to investigate the fluctuations of the tail region of the OAR
y profiles. The OAR
y profiles from different segmentation patterns
and for a fixed depth were fairly equivalent with the exception of the tail region which is defined as the region of the profile with values 10% of the maximum value. During the segmentation process of the sinogram, different leaf open times lead to different segmentation patterns. Starting from the full open field size (5×40 cm2 or 2.5×40 cm2), leaf openings at different segmentation patterns are proportional to the full width at half maximum (FWHM). Thus, the Gaussian variation between two segmentation patterns can be expressed as:
2 221 2
2 21 2
( )
1
2
LO LOy
LO LOfe
f
(10)
where is the Gaussian variation factor between the two segmentation patterns, LO
1 and LO
2 are the leaf openings, and y is the off-axis
distance. In the MU-Tomo software, f2 denotes the profile from the
fully open field size and f1 denotes the specific segmentation field.
Fluctuations of the tail region were separated into two sub-regions: one between the 10% to 5% OAR
y, and the other from 5% to
the end of the OARy profile. In the tail region, the two sub-regions
were described with equation (10) of two different lambda values, denoted as exponential factors and respectively. Optimization was executed by varying and at 50 different channels from 0 to 49, separately, and on 50 different patients. Thus, a total of 50×50×50 dose differences were calculated to complete the optimization. For the 50×50 exponential factor channel pairs, the absolute values of dose differences from all patients were summed together to provide a volume map. For example, if d1%, d2%, …., d50% represent the dose differences from the 50 patients with one specific - pair, the volume for this specific channel is equal to the sum of |d1|, |d2|,… and |d50|. The minimum volume is used in order to obtain the optimized parameters.
MU-Tomo benchmarks
Two methods were used to benchmark the software. First, treatment plans with static beam deliveries were calculated with the MU-Tomo software, and the dose was measured using the Hi-Art™ unit. For these plans, the measured and calculated doses were compared for benchmarking purposes. For the second part of testing, fifty previously treated TomoTherapy® treatment plans were randomly selected for a point dose comparison using the planned
versus MU-Tomo calculated point dose. Differences between the TomoTherapy® TPS and MU-Tomo calculated doses were evaluated.
Results
Software validation
The second check software, MU-Tomo, has been validated on the
following four different phantom studies: (1) Dose calculation using
a phantom composed of a 20.0 cm thick, rectangular slab of Virtual
Water™, (2) Step valley dose calculation in the same Virtual Water™
phantom, (3) Dose calculation of a monthly output check procedure
in the cheese phantom, and (4) Dose calculation of seven patient dose
validation (DQA) treatment plans in the cheese phantom.
In the first validation phantom study, the phantom was composed
of multiple rectangular slabs of Virtual Water™ and arranged such that
the point of ion chamber measurement was centered in the phantom
with 10.0 cm of build-up and 10.0 cm of backscatter material. The plan
delivered was a static, open field size with a field width of 5.0 cm and
treatment time of 20 seconds. The ion chamber dose measurement
for the irradiation was 211 cGy. MU-Tomo calculated a dose of 207
cGy leading to a calculation/measurement difference of 1.9%.
The second phantom study involved a step valley dose irradiation
(Yan et al., 2005) also in a phantom composed of rectangular slabs of
Virtual Water™. For this arrangement, the ion chamber was placed
between 6.0 cm of build-up and 10.0 cm of backscatter material.
The step valley irradiation plan allows for multiple ion chamber
measurements located along the IEC-X direction at discrete positions-
i.e. 0, ±2.5, ±5, ±7.5, ±10 and ±12.5 cm positions. The step valley
Figure 6: Figure 6: The geometrical setup using a cylindrical phantom-also referred to as The geometrical setup using a cylindrical phantom-also referred to as the cheese phantom-for depth calculation to the point of measurement, P, as a the cheese phantom-for depth calculation to the point of measurement, P, as a
function of projection angle. S represents of the source location, A represents function of projection angle. S represents of the source location, A represents
the isocenter of the HiArt™ unit, and B represents the surface point on the the isocenter of the HiArt™ unit, and B represents the surface point on the phantom.phantom.
Figure 7: Step valley and DQA plans validation results. (A) The step valley dose comparison between independent calculation and measurement. (B) MU-
Tomo validation from six patient IMRT plans.
Citation: Papanikolaou N, He W, Vazquez LA, Gutierrez A, Stathakis S, et al. (2010) MU-Tomo: Independent Dose Validation Software for Helical TomoTherapy. J Cancer Sci Ther 2: 145-152. doi:10.4172/1948-5956.1000040
OMIC
S Pub lishing G
roupJ Cancer Sci Th er
ISSN:1948-5956 JCST, an open access journalVolume 2(5): 145-152 (2010) - 150
-10 -5 0 5 10
0
2
4
6
8
10
Dose Difference (%)
Nu
mb
er
A
-10 -5 0 5 100
5
10
15
Nu
mb
er
Dose Difference (%)
B
produces an non-symmetric, step valley dose distribution with 11
different dose tiers. Figure 7 (A) shows the validation result in this
test. The dose differences for all eleven-measurement points were
within 3.0%, with a mean deviation of -0.94% and standard deviation
of 1.6%. (Here Figure 7. Step valley and DQA plans validation results).
The third phantom study validated the helical radiation delivery on
the cheese phantom. The treatment plan delivered is used routinely
as IMRT dose output verification and is part of our monthly QA
checks. The plan is a helical IMRT delivery with treatment parameters
of: FW= 2.5 cm, pitch= 0.287 and time= 262.4 seconds. The ion
chamber point of measurement was 0.5 cm beneath the geometric center of the cheese phantom. The dose difference between the MU-Tomo calculated point dose and ion chamber measured point dose was -0.31%.
The fourth phantom study was for validation of patient IMRT DQA plans on the cheese phantom. Six IMRT DQA treatment plans were created. The DQA treatment plans were created using the optimized patient-dependent treatment fluence and mapped onto the cheese phantom. These same treatment plans were imported into MU-Tomo and a point dose was calculated. Figure 7 (B) shows the result for this validation. For all six plans, dose differences between DQA planned point dose and MU-Tomo calculated point dose were within 2.0% with a mean of 0.08% and standard deviation of 1.3%.
Algorithm optimization and second check on fifty patient plans
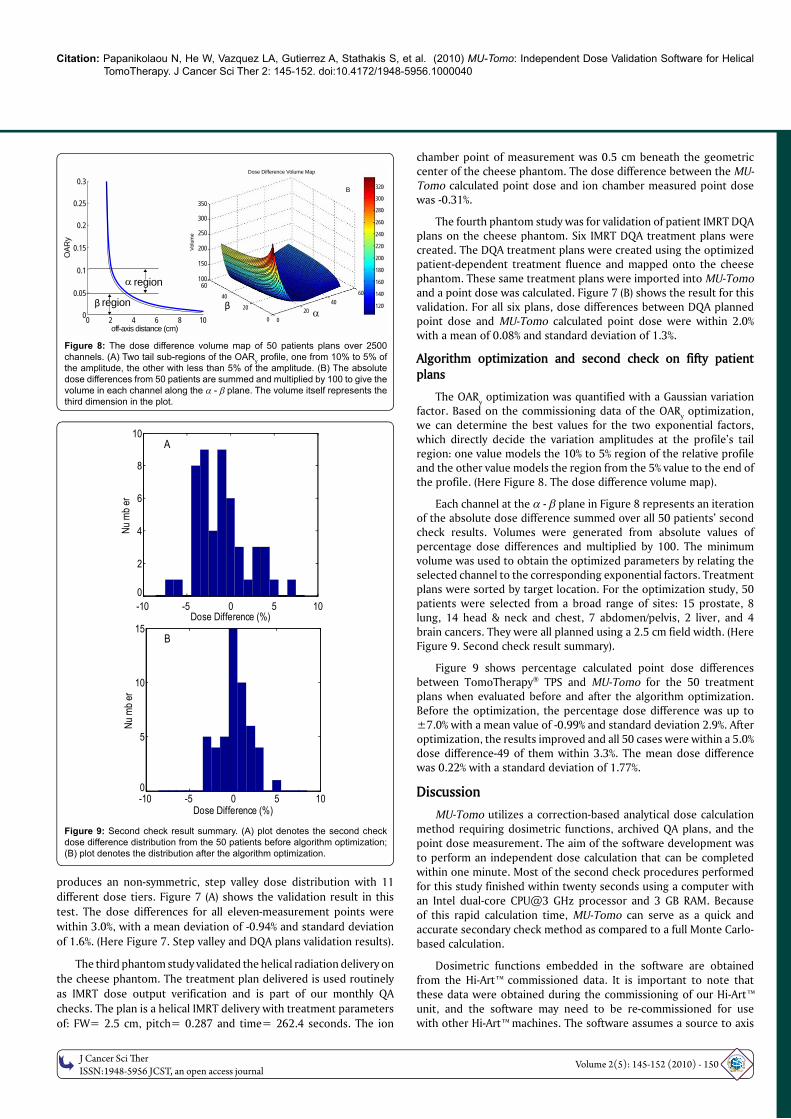
The OARy optimization was quantified with a Gaussian variation
factor. Based on the commissioning data of the OARy optimization,
we can determine the best values for the two exponential factors, which directly decide the variation amplitudes at the profile’s tail region: one value models the 10% to 5% region of the relative profile and the other value models the region from the 5% value to the end of the profile. (Here Figure 8. The dose difference volume map).
Each channel at the - plane in Figure 8 represents an iteration of the absolute dose difference summed over all 50 patients’ second check results. Volumes were generated from absolute values of percentage dose differences and multiplied by 100. The minimum volume was used to obtain the optimized parameters by relating the selected channel to the corresponding exponential factors. Treatment plans were sorted by target location. For the optimization study, 50 patients were selected from a broad range of sites: 15 prostate, 8 lung, 14 head & neck and chest, 7 abdomen/pelvis, 2 liver, and 4 brain cancers. They were all planned using a 2.5 cm field width. (Here Figure 9. Second check result summary).
Figure 9 shows percentage calculated point dose differences between TomoTherapy® TPS and MU-Tomo for the 50 treatment plans when evaluated before and after the algorithm optimization. Before the optimization, the percentage dose difference was up to ±7.0% with a mean value of -0.99% and standard deviation 2.9%. After optimization, the results improved and all 50 cases were within a 5.0% dose difference-49 of them within 3.3%. The mean dose difference was 0.22% with a standard deviation of 1.77%.
Discussion
MU-Tomo utilizes a correction-based analytical dose calculation method requiring dosimetric functions, archived QA plans, and the
point dose measurement. The aim of the software development was to perform an independent dose calculation that can be completed within one minute. Most of the second check procedures performed
for this study finished within twenty seconds using a computer with an Intel dual-core CPU@3 GHz processor and 3 GB RAM. Because of this rapid calculation time, MU-Tomo can serve as a quick and accurate secondary check method as compared to a full Monte Carlo-based calculation.
Dosimetric functions embedded in the software are obtained from the Hi-Art™ commissioned data. It is important to note that
these data were obtained during the commissioning of our Hi-Art™ unit, and the software may need to be re-commissioned for use with other Hi-Art™ machines. The software assumes a source to axis
Figure 8: The dose difference volume map of 50 patients plans over 2500
channels. (A) Two tail sub-regions of the OARy profi le, one from 10% to 5% of
the amplitude, the other with less than 5% of the amplitude. (B) The absolute
dose differences from 50 patients are summed and multiplied by 100 to give the
volume in each channel along the - plane. The volume itself represents the
third dimension in the plot.
Figure 9: Second check result summary. (A) plot denotes the second check
dose difference distribution from the 50 patients before algorithm optimization; (B) plot denotes the distribution after the algorithm optimization.
0 2 4 6 8 10
OAR
y
region
region
β β
off-axis distance (cm)
0.3
0.25
0.2
0.15
0.1
0.05
0
350
300
250
200
150
10060
40 60
320
300
280
260
240
220
200
180
160
140
1204020 20
0 0
Dose Difference Volume Map
Volu
me
B

OM
ICS Publishing Gro
upJ Cancer Sci Th er
ISSN:1948-5956 JCST, an open access journalVolume 2(5): 145-152 (2010) - 151
Journal of Cancer Science & Therapy - Open Access Research Article
OPEN ACCESS Freely available online
doi:10.4172/1948-5956.1000040
JCST/Vol.2 Issue 5
distance of 85 cm for the tomotherapy unit. During the software
development, the off-axis ratio profiles were averaged around the
centroid symmetrically, so that it is more reliable for both positive
and negative coordinates.
The point dose calculation that we perform is subject to any
errors that are inherent to the dosimetric functions that we extracted
from the planning system. The OAR and PDD were measured per
manufacturer's recommendation and were checked by tomotherapy
at the time of commissioning. However these data are subject to
approximately 1% measurement error. In addition, every time we
change the target or any other beam control components in our
unit, we do have about 1% discrepancy between our commissioned
and current clinical data. Those discrepancies are not significant but
could introduce as much as 3% uncertainty in the dose prediction
from our software. If the user updates the software parameters
with the corresponding dosimetric functions every time there is a
change in the tomotherapy unit, the agreement should improve. We
recommend that each clinic using the software imports their site
specific data and performs an acceptance of this software.
Optimization of the OARy using a Gaussian variation method
benefits MU-Tomo in two aspects: (1) the calculation accuracy
improves and (2) only the OARy from the fully open field size is
required, improving the calculation efficiency by a magnitude of ten.
The reason for defining the tail region from 10% of the maximum
value and below is because most fluctuations occurred in that region.
The reasons to divide the tail region into two sub-portions in this
study are that fluctuations within those two portions of the tail show
different amplitudes; the first portion from 10% to 5% affects the dose
calculation more than the second portion from 5% to the end. We
did not pursue further segmentation of the profile tail region, as that
would increase computation time with no significant improvement in
the calculation accuracy. The optimization applied in this study may
not be the best overall method, but it yielded good results with fast
calculation times.
An additional feature of this second check software is the usage
of archived patient documents. Initial gantry starting angle, initial
position of IEC-Y coordinate of the target, and the sinogram are read
in, enabling the software to determine the initial radiation projection
position. Plan delivery duration, pitch of each specific plan, field
width and the sinogram enable the software to accumulate the
dose to the calculation point. To perform a secondary point dose
check, a cylindrical phantom was embedded into the software. The
symmetrical shape of the phantom simplifies the calculation of depth
for any given projection angle. Because of the phantom geometry,
the dose calculation point for the independent dose calculation can
be placed anywhere inside the cylindrical phantom and is not limited
only to the geometrical center. If a different phantom were used, re-
commissioning of the depth calculation method would be necessary.
With regards to the study performed by Gibbons et al., the
MU-Tomo software has several novel developments that increase
calculation accuracy and efficiency. The averaging of OARx and OAR
y
profiles over the positive and negative axis sides removes fluence
fluctuations, the optimization of OARy values improves the dose
calculation accuracy and efficiency, the application of the Mayneord
F factor corrects the percent depth dose values for varying SSD, and
a cylindrical phantom geometry allows fast and automatic depth
calculation to the user defined dose calculation point. Furthermore,
the dose calculation point for an independent dose calculation using
MU-Tomo can be located at any point inside the cylindrical phantom,
which makes our point dose verification more general. Although in this work we present a point based calculation comparison, it is possible to extend our method to include several points in three dimensions. This is currently under investigation.
Conclusion
An independent dose calculation software, MU-Tomo, has been successfully developed and benchmarked. Fifty treatment plans from different treatment sites were evaluated with our software and dose differences between measurement and calculation were found to be less than 5.0% (49 plans were within 3.3%). For all the cases, the mean dose difference was 0.22% with a standard deviation of 1.77%. Results show that the MU-Tomo software is able to perform independent dose calculations accurately and quickly and may be used to satisfy the clinical need for a secondary dose calculation of TomoTherapy® treatment plans.
Disclosure
This project was supported in part from a research grant by Oncology Data
Systems, Inc., Oklahoma City, OK, USA
Acknowledgement
The authors would like to acknowledge Dr. Teboh Roland, Mr. Eric Dzintars from CTRC and Dr. Andrea Cox from TomoTherapy, Inc. for private communications in regards to the tomotherapy sinogram.
References
1. Ayyangar KM, Nizin PS, Saw CB, Gearheart D, Shen B, et al. (2001a)Independent dose calculations for the corvus MLC IMRT. Med Dosim 26: 135-141.
2. Ayyangar KM, Saw CB, Gearheart D, Shen B, Thompson R (2003) Independent calculations to validate monitor units from ADAC treatment planning system.Med Dosim 28: 79-83.
3. Ayyangar KM, Saw CB, Shen B, Enke CA, Nizin PS (2001b) Independent dose calculations for the PEACOCK System. Med Dosim 26: 29-35.
4. Beavis AW (2004) Is tomotherapy the future of IMRT? Br J Radiol 77: 285-295.
5. Beck J, Berndt A (2004) An algorithm for independent verifi cation of GammaKnife (TM) treatment plans. Med Phys 31: 2780-2784.
6. Chen XG, Yue NJ, Chen WM, Saw CB, Heron DE, et al. (2005) A doseverifi cation method using a monitor unit matrix for dynamic IMRT on Varianlinear accelerators. Phys Med Biol 50: 5641-5652.
7. Chen Z, Xing L, Nath R (2002) Independent monitor unit calculation for intensity modulated radiotherapy using the MIMIC multileaf collimator. Med Phys 29:2041-2051.
8. Edimo P, Clermont C, Kwato MG, Vynckier S (2009) Evaluation of a commercial VMC++ Monte Carlo based treatment planning system for electron beamsusing EGSnrc/BEAMnrc simulations and measurements. Phys Medica 25: 111-121.
9. Georg D, Nyholm T, Olofsson J, Kjaer-Kristoffersen F, Schnekenburger B, et al. (2007a) Clinical evaluation of monitor unit software and the application of action levels. Radiother Oncol 85: 306-315.
10. Georg D, Stock M, Kroupa B, Olofsson J, Nyholm T, et al. (2007) Patient-specifi c IMRT verifi cation using independent fl uence-based dose calculationsoftware: experimental benchmarking and initial clinical experience. Phys Med Biol 52: 4981-4992.
11. Gibbons JP, Smith K, Cheek D, Rosen I (2009) Independent calculation of dose from a helical TomoTherapy unit. J Appl Clin Med Phys 10: 2772.
12. Jansen WPA, Dirkx MLP, Heijmen BJM (2003) Independent 3D dose calculation as part of an overall individualized dosimetric QA protocol for IMRT. RadiotherOncol 68: S36-S36.
13. Khan FM, Stathakis S, (2010) The Physics of Radiation Therapy. Med Phys 37: 1374.
14. Kumada H, Nakamura T, Komeda M, Matsumura A (2009) Development of anew multi-modal Monte-Carlo radiotherapy planning system. Appl Radiat Isot67: S118-S121.

Citation: Papanikolaou N, He W, Vazquez LA, Gutierrez A, Stathakis S, et al. (2010) MU-Tomo: Independent Dose Validation Software for Helical TomoTherapy. J Cancer Sci Ther 2: 145-152. doi:10.4172/1948-5956.1000040
O
MIC
S Publishing GroupJ Cancer Sci Th er
ISSN:1948-5956 JCST, an open access journalVolume 2(5): 145-152 (2010) - 152
15. Kumar R, Sharma SD, Vijaykumar C, Deshpande S, Sharma PK, et al. (2008)
A dose verifi cation method for high-dose-rate brachytherapy treatment plans. J
Cancer Res Ther 4: 173-177.
16. Kutcher GJ, Coia L, Gillin M, Hanson WF, Leibel S, et al. (1994) Comprehensive
QA for radiation oncology: report of aapm radiation-therapy committee task
group 40. Med Phys 21: 581-618.
17. Lorenz F, Killoran JH, Wenz F, Zygmanski P (2007) An independent dose
calculation algorithm for MLC-based stereotactic radiotherapy. Med Phys 34:
1605-1614.
18. Lorenz F, Nalichowski A, Rosca F, Killoran J, Wenz F, et al. (2008) An
independent dose calculation algorithm for MLC-based radiotherapy including
the spatial dependence of MLC transmission. Phys Med Biol 53: 557-573.
19. Luo W, Li J, Price RA, Chen L, Yang J, et al. (2006) Monte Carlo based IMRT
dose verifi cation using MLC log fi les and R/V outputs. Med Phys 33: 2557-
2564.
20. Mackie TR (2006) History of tomotherapy. Phys Med Biol 51: R427-R453.
21. Mackie TR, Holmes T, Swerdloff S, Reckwerdt P, Deasy JO, et al. (1993)
Tomotherapy - a new concept for the delivery of dynamic conformal
radiotherapy. Med Phys 20: 1709-1719.
22. Mackie TR, Kapatoes J, Ruchala K, Lu WG, Wu C, et al. (2003) Image guidance
for precise conformal radiotherapy. Int J Radiat Oncol Biol Phys 56: 89-105.
23. Mukumoto N, Tsujii K, Saito S, Yasunaga M, Takegawa H, et al. (2009) A
preliminary study of in-house monte carlo simulations: an integrated monte carlo verifi cation system. Int J Radiat Oncol Biol Phys 75: 571-579.
24. Pisaturo O, Moeckli R, Mirimanoff RO, Bochud FO (2009) A Monte Carlo-based procedure for independent monitor unit calculation in IMRT treatment plans. Phys Med Biol 54: 4299-4310.
25. Sarkar V, Stathakis S, Papanikolaou N (2008) A Monte Carlo model for independent dose verifi cation in serial tomotherapy. Technol Cancer Res Treat 7: 385-392.
26. Tsai JS, Engler MJ, Liu J (2002) Quasi-independent monitor unit calculation for intensity modulated sequential tomotherapy. J Appl Clin Med Phys 3: 135-153.
27. Yan YL, Papanikolaou N, Weng XJ, Penagaricano J, Ratanatharathorn V (2005) Fast radiographic fi lm calibration procedure for helical tomotherapy intensity modulated radiation therapy dose verifi cation. Med Phys 32: 1566-1570.
28. Yang JN, Mackie TR, Reckwerdt P, Deasy JO, Thomadsen BR (1997) An investigation of tomotherapy beam delivery. Med Phys 24: 425-436.
29. Yang Y, Xing L, Li JG, Palta J, Chen Y, et al. (2003) Independent dosimetric calculation with inclusion of head scatter and MLC transmission for IMRT. Med Phys 30: 2937-2947.
30. Zacarias A, Balog J, Mills M (2006) Radiation shielding design of a new tomotherapy facility. Health Phys 91: 289-295.
31. Zhu J, Yin FF, Kim JH (2003) Point dose verifi cation for intensity modulated radiosurgery using Clarkson’s method. Med Phys 30: 2218-2221.