
Journal of Banking and - Hatem Masri | Hatem Masri · 03-04-2017 · Journal of Banking and Finance...
24
Journal of Banking and Finance 72 (2016) 28–51 Contents lists available at ScienceDirect Journal of Banking and Finance journal homepage: www.elsevier.com/locate/jbf Financial innovation: The bright and the dark sides Thorsten Beck a,d , Tao Chen b , Chen Lin c,∗ , Frank M. Song c a Cass Business School, City University London, United Kingdom b Nanyang Business School, Nanyang Technological University, Singapore c Faculty of Business and Economics, University of Hong Kong, Hong Kong d CEPR, United Kingdom a r t i c l e i n f o Article history: Received 22 February 2016 Accepted 27 June 2016 Available online 4 August 2016 JEL classification: G2 G15 G28 G01 O3 Keywords: Financial innovation Securitization Bank risk taking Finance and growth a b s t r a c t Based on data from 32 countries over the period 1996–2010, this paper is the first to assess the rela- tionship between financial innovation, on the one hand, and bank growth and fragility, as well as eco- nomic growth, on the other hand. We find that different measures of financial innovation, capturing both a broad concept and specific innovations, are associated with faster bank growth, but also higher bank fragility and worse bank performance during the recent crisis. These effects are stronger in countries with larger securities markets and more restrictive regulatory frameworks. In spite of these seemingly ambigu- ous findings, our evidence points to a positive net effect of financial innovation on economic growth: financial innovation is associated with higher growth in countries and industries with better growth op- portunities. © 2016 Elsevier B.V. All rights reserved. 1. Introduction “Everybody talks about financial innovation, but (almost) nobody empirically tests hypotheses about it.” Frame and White (2004) “I wish somebody would give me some shred of evidence linking financial innovation with a benefit to the economy.” 1 –Paul Volcker, former Chairman of the Federal Reserve Beck thanks the Hong Kong Monetary Authority for financial support and for providing helpful comments, and Lin thanks the Chinese University of Hong Kong for financial support (Direct Allocation Grant). We are grateful for helpful comments from the editor (Geert Bekaert), Douglas Diamond, Mariassunta Giannetti, Hayne Leland, Yupeng Lin, Basile Maire, Neil Pearson, Jun Qian, Manju Puri, Raghu Rau, Irene Tutticci, Annette Vissing-Jørgensen, Yuhai Xuan, and seminar participants at Hong Kong University of Science and Technology (HKUST), Judge School of Business, University of Cambridge, Peking University, Tilburg University, UPF Barcelona. Chen Lin gratefully acknowledges financial support from the Research Grants Council of Hong Kong (Project no. 448412). ∗ Corresponding author. E-mail addresses: [email protected] (T. Beck), [email protected] (T. Chen), [email protected] (C. Lin), [email protected] (F.M. Song). 1 See “Paul Volcker: Think More Boldly,” The Wall Street Journal, December 14, 2009, p. R7. The Global Financial Crisis of 2007–2009 has spurred renewed wide-spread debates on the “bright” and “dark” sides of financial innovation. 2 The traditional innovation-growth view posits that fi- nancial innovations help improve the quality and variety of bank- ing services (Merton, 1992; Berger, 2003), facilitate risk sharing (Allen and Gale, 1991, 1994), complete the market (Duffie and Rahi, 1995; Elul, 1995; Grinblatt and Longstaff, 2000), and ultimately im- prove allocative efficiency (Ross, 1976; Houston et al., 2010), thus focusing on the bright side of financial innovation. The innovation- fragility view, on the other hand, focuses on the “dark” side. Specif- ically, it identified financial innovations as the root cause of the re- cent Global Financial Crisis, by leading to an unprecedented credit expansion that helped feed the boom and subsequent bust in housing prices (Brunnermeier, 2009), by engineering securities per- ceived to be safe but exposed to neglected risks (Gennaioli et al., 2012), and by helping banks develop structured products to exploit investors’ misunderstandings of financial markets (Henderson and Pearson, 2011). This paper uses different indicators of financial in- novation and an array of bank-, industry and country-level data 2 In early 2010, the Economist organized a 10-day online debate between Ross Levine and Joseph E. Stiglitz on the role and benefits of financial innovation: http: //www.economist.com/debate/overview/166. http://dx.doi.org/10.1016/j.jbankfin.2016.06.012 0378-4266/© 2016 Elsevier B.V. All rights reserved.
Transcript of Journal of Banking and - Hatem Masri | Hatem Masri · 03-04-2017 · Journal of Banking and Finance...
Journal of Banking and Finance 72 (2016) 28–51
Contents lists available at ScienceDirect
Journal of Banking and Finance
journal homepage: www.elsevier.com/locate/jbf
Financial innovation: The bright and the dark sides
�
Thorsten Beck
a , d , Tao Chen
b , Chen Lin
c , ∗, Frank M. Song
c
a Cass Business School, City University London, United Kingdom
b Nanyang Business School, Nanyang Technological University, Singapore c Faculty of Business and Economics, University of Hong Kong, Hong Kong d CEPR, United Kingdom
a r t i c l e i n f o
Article history:
Received 22 February 2016
Accepted 27 June 2016
Available online 4 August 2016
JEL classification:
G2
G15
G28
G01
O3
Keywords:
Financial innovation
Securitization
Bank risk taking
Finance and growth
a b s t r a c t
Based on data from 32 countries over the period 1996–2010, this paper is the first to assess the rela-
tionship between financial innovation, on the one hand, and bank growth and fragility, as well as eco-
nomic growth, on the other hand. We find that different measures of financial innovation, capturing both
a broad concept and specific innovations, are associated with faster bank growth, but also higher bank
fragility and worse bank performance during the recent crisis. These effects are stronger in countries with
larger securities markets and more restrictive regulatory frameworks. In spite of these seemingly ambigu-
ous findings, our evidence points to a positive net effect of financial innovation on economic growth:
financial innovation is associated with higher growth in countries and industries with better growth op-
portunities.
© 2016 Elsevier B.V. All rights reserved.
w
i
n
i
(
1
p
f
f
1. Introduction
“Everybody talks about financial innovation, but (almost) nobody
empirically tests hypotheses about it.”
Frame and White (2004)
“I wish somebody would give me some shred of evidence linking
financial innovation with a benefit to the economy.”1
–Paul Volcker, former Chairman of the Federal Reserve
� Beck thanks the Hong Kong Monetary Authority for financial support and for
providing helpful comments, and Lin thanks the Chinese University of Hong Kong
for financial support (Direct Allocation Grant). We are grateful for helpful comments
from the editor (Geert Bekaert), Douglas Diamond, Mariassunta Giannetti, Hayne
Leland, Yupeng Lin, Basile Maire, Neil Pearson, Jun Qian, Manju Puri, Raghu Rau,
Irene Tutticci, Annette Vissing-Jørgensen, Yuhai Xuan, and seminar participants at
Hong Kong University of Science and Technology (HKUST), Judge School of Business,
University of Cambridge, Peking University, Tilburg University, UPF Barcelona. Chen
Lin gratefully acknowledges financial support from the Research Grants Council of
Hong Kong (Project no. 448412 ). ∗ Corresponding author.
E-mail addresses: [email protected] (T. Beck), [email protected] (T. Chen),
[email protected] (C. Lin), [email protected] (F.M. Song). 1 See “Paul Volcker: Think More Boldly,” The Wall Street Journal , December 14,
2009, p. R7.
i
c
e
h
c
2
i
P
n
L
/
http://dx.doi.org/10.1016/j.jbankfin.2016.06.012
0378-4266/© 2016 Elsevier B.V. All rights reserved.
The Global Financial Crisis of 20 07–20 09 has spurred renewed
ide-spread debates on the “bright” and “dark” sides of financial
nnovation. 2 The traditional innovation-growth view posits that fi-
ancial innovations help improve the quality and variety of bank-
ng services ( Merton, 1992; Berger, 2003 ), facilitate risk sharing
Allen and Gale, 1991, 1994 ), complete the market ( Duffie and Rahi,
995; Elul, 1995; Grinblatt and Longstaff, 20 0 0 ), and ultimately im-
rove allocative efficiency ( Ross, 1976; Houston et al., 2010 ), thus
ocusing on the bright side of financial innovation. The innovation-
ragility view , on the other hand, focuses on the “dark” side. Specif-
cally, it identified financial innovations as the root cause of the re-
ent Global Financial Crisis, by leading to an unprecedented credit
xpansion that helped feed the boom and subsequent bust in
ousing prices ( Brunnermeier, 2009 ), by engineering securities per-
eived to be safe but exposed to neglected risks ( Gennaioli et al.,
012 ), and by helping banks develop structured products to exploit
nvestors’ misunderstandings of financial markets ( Henderson and
earson, 2011 ). This paper uses different indicators of financial in-
ovation and an array of bank-, industry and country-level data
2 In early 2010, the Economist organized a 10-day online debate between Ross
evine and Joseph E. Stiglitz on the role and benefits of financial innovation: http:
/www.economist.com/debate/overview/166 .
T. Beck et al. / Journal of Banking and Finance 72 (2016) 28–51 29
a
o
n
i
m
s
a
i
c
H
t
n
n
2
m
i
i
t
t
s
i
T
p
d
c
i
a
c
a
f
c
f
W
a
a
o
b
p
s
c
d
2
a
a
(
i
s
t
t
t
g
s
v
n
w
d
u
v
l
J
c
o
v
c
c
p
g
t
a
s
fi
h
t
a
r
c
v
o
fi
e
w
c
J
t
b
r
n
o
i
l
t
o
2
o
l
f
g
a
r
a
t
c
e
t
a
d
s
t
c
4 This is different from Laeven et al. (2015) , one of the few other cross-country
papers in this area, who focus on one specific financial innovation – Private Credit
bureaus. Loayza and Ranciere (2006) combine these two effects in a panel anal-
ysis and find a positive long-run relationship between financial development and
growth, while the short-run coefficient on current financial development enters
negatively. Rancière et al. (2008) find a robust positive link between the first mo-
ment of credit growth and economic growth, and a negative relationship between
the second and third moment and GDP growth. Similarly, studies of financial liber-
alization show its positive effects on financial deepening and economic growth as
well as dampening effects on consumption volatility, but also a higher likelihood of
nd analyses to test these hypotheses in a sample of 32 countries
ver the period 1996–2010.
Given the active academic and policy debate on the role of fi-
ancial innovation, there is a striking paucity of empirical stud-
es of the real and financial implications of financial innovation,
ainly due the lack of data. 3 Unlike in manufacturing, patents are
carcely used in the financial service industry or even unavailable,
s in the European Union. As a consequence, most existing stud-
es focus on very specific innovations such as new forms of finan-
ial securities (e.g. Grinblatt and Longstaff, 20 0 0; Schroth, 20 03;
enderson and Pearson, 2011 ), the introduction of credit scoring
echniques ( Frame and White, 2004, 2009; Akhavein et al., 2005 ),
ew forms of mortgage lending ( Gerardi et al., 2010 ) or new orga-
izational forms, such as Internet-only banks (e.g. DeYoung, 2001,
0 05; DeYoung et al., 20 07 ). These studies so far have yielded
ixed findings.
On the one hand, there is supporting evidence that financial
nnovation increases bank growth and supports financial deepen-
ng. For example, DeYounget al. (2007) find that Internet adop-
ion improved U.S. community banks’ profitability – primarily
hrough deposit-related charges. Several studies document that
mall business credit scoring increases the quantity of bank lend-
ng ( Frame et al., 2001, 2004; Berger et al., 2005 ). Saretto and
ookes (2013) find that CDS trading increases bank credit sup-
ly, while Norden et al. (2014) show that banks that use credit
erivatives as risk management tool pass these benefits on to their
lients in form of lower interest spreads and cut lending less dur-
ng the recent crisis. Using “counterfactual historic analysis”, Lerner
nd Tufano (2011) document the positive contribution to finan-
ial deepening and economic growth of financial innovations, such
s venture capital and equity funds, mutual and exchange-traded
unds, and securitization.
On the other hand, financial innovations such as securitization
hange the ex-ante incentives of financial intermediaries to care-
ully screen and monitor the borrowers ( Allen and Carletti, 2006 ).
agner (2007a, b ) shows that financial innovation that reduces
symmetric information can actually increase risk-taking due to
gency problems between bank owners and managers, or because
f lower costs of fragility. In the context of the recent lending
oom and subsequent Global Financial Crisis, several authors have
ointed to distortions introduced by financial innovations, such as
ecuritization and new derivative securities, and how they have
ontributed to aggressive risk taking, reduction in lending stan-
ards and thus fragility (e.g., Keys et al., 2010; Dell’ Ariccia et al.,
0 08; Rajan, 20 06 ; and Gennaioli et al., 2012 ). Subrahmanyam et
l. (2014) find that CDS trading significantly increases credit risk
s financial institutions reduce monitoring, while Wang and Xia
2014) document that banks exert less effort on ex post monitor-
ng when they can securitize loans. Overall, there is no conclu-
ive evidence on whether financial innovation is good or bad for
he financial sector. Meanwhile, none of the existing papers has
aken a holistic approach to financial innovation and its implica-
ions for bank growth and fragility. This paper attempts to fill this
ap by providing cross-country evidence on the real and financial
ector consequences of financial innovation, looking beyond indi-
idual innovations to broader measures of activities that result in
ew products, delivery channels and organizational forms.
We follow Tufano’s (2003) concept of financial innovation,
hich includes the process of invention (the ongoing research and
evelopment function) and diffusion (or adoption) of new prod-
cts, services or ideas, and focus on R&D spending in the finan-
3 See discussion in Frame and White (20 04 , 20 09 ) who conduct a thorough sur-
ey of the empirical literature on financial innovation. For theoretical literature re-
ated to financial innovation, Duffie and Rahi (1995) introduce a special issue of
ournal of Economic Theory.
s
C
t
2
ial sector as well as several product or output based measures
f financial innovation. 4 Specifically, using OECD innovation sur-
ey data on banks’ R&D expenditures across 32 mostly developed
ountries over the period 1996–2010 as a broad indicator of finan-
ial innovation, as well as a financial system’s securitization ca-
acity and the importance of off- to on-balance-sheet assets as
auges of innovation in specific areas, we relate financial innova-
ion to bank growth and bank fragility over the period 1996–2010
nd bank performance during the recent financial crisis. Using a
ample of more than 20 0 0 unique banks across 32 countries, we
nd that a higher level of financial innovation is associated with
igher bank growth and higher fragility at the same time. Consis-
ent with these findings, we show that banks’ profitability dropped
t a higher rate during the recent crisis and the buy-and-hold stock
eturns during the crisis were lower in countries with higher pre-
risis levels of financial innovation.
The seemingly ambiguous relationship between financial inno-
ation and bank performance raises the question of its impact
n the real sector. An extensive literature in finance and growth
nds a positive correlation between financial development and
conomic growth (e.g. King and Levine, 1993a , b; Beck et al., 20 0 0 ),
hile an extensive banking crisis literature has established rapid
redit growth as one of the most robust crisis predictors (e.g.,
orda et al., 2013 ). 5 Similarly, the net effect of financial innova-
ion on economic growth remains an empirical question that goes
eyond its effects on banking sector outcomes. We therefore di-
ectly investigate the association of financial innovation with eco-
omic growth to pin down the net impact of financial innovation
n the real economy. 6 We try to mitigate the potential endogene-
ty problem, which is often a concern in the finance and growth
iterature, by offering several tests of channels and mechanisms
hrough which financial innovation is associated with real sector
utcomes. Specifically, we use the approach of Bekaert et al. (2005,
007 ) to gauge the relationship between financial innovation, ex-
genous growth opportunities and GDP per capita growth, and fol-
ow the approach by Rajan and Zingales (1998) to focus on the dif-
erential effects of financial innovation on industries with different
rowth opportunities ( Fisman and Love, 20 04, 20 07 ). We find that
higher level of financial innovation is associated with a stronger
elationship between a country’s exogenous growth opportunities
nd GDP per capita growth and with a higher growth of indus-
ries that have greater growth opportunities. We also show that
ross-country and time-variation in financial innovation cannot be
xplained by growth opportunities. While the cross-country set-
ing of our estimations does not allow the definite elimination of
ny endogeneity bias, this reduces concerns that our findings are
riven by reverse causation or omitted variable bias.
The existing literature on financial innovation also predicts
ignificant differences of its effects according to its nature and
he regulatory environment and market structure in which finan-
ial innovation happens and which influence banks’ incentives for
uffering systemic banking crises ( Bekaert et al., 2005 , 2007 Rancière et al., 2006 ). 5 The existing literature focus on the effect of financial development (Private
redit), information sharing, financial openness and liberalization, financial integra-
ion among others on economic growth (e.g., King and Levine, 1993b; Bekaert et al.,
005; Bekaert et al., 2007; Djankov et al., 2007; Houston et al., 2010 ). 6 See Levine (2005) for a literature survey.
30 T. Beck et al. / Journal of Banking and Finance 72 (2016) 28–51
i
u
W
s
i
c
3
S
e
2
f
e
a
i
p
r
n
a
t
i
c
i
v
a
e
p
O
p
s
t
a
l
p
t
i
o
o
R
d
a
s
n
i
n
8 The countries include Australia, Austria, Belgium, Canada, Czech Republic, Den-
mark, Germany, Greece, Hungary, Iceland, Ireland, Italy, Japan, Korea, Luxem-
bourg, Mexico, Netherlands, New Zealand, Norway, Poland, Portugal, Spain, Sweden,
Switzerland, Turkey, United Kingdom, United States, Israel, Romania, Russian Feder-
ation, Singapore, and South Africa. 9 Value added is the value of output less the value of intermediate consump-
tion, and it is a measure of the contribution to GDP made by an individual pro-
ducer, industry or sector. Due to the rounding problem in the data as reported by
SourceOECD database, we calculate our measure using R&D expenditures and value
added as reported in the database. Measuring the value-added (and therefore the
risk-taking. First, risk-shifting and regulatory arbitrage using new
forms of securities are easier to undertake in financial systems
with larger and more liquid securities markets, which suggests
a stronger relationship between financial innovation and banks’
growth and fragility in countries with larger securities markets.
Second, in times of increasing international integration of financial
markets, financial innovation not only diffuses more easily across
borders (as illustrated by the purchase of US-issued credit deriva-
tives subsequently purchased by European banks), but its effects
are also strengthened by financial integration. Third, financial in-
novation can arise as reaction to regulation (such as Euro market
arose as response to regulation Q ) or religious restrictions (such
as Sharia-compliant financial products). Specifically, it has been ar-
gued that the main purpose of recent financial innovations has
been to facilitate regulatory arbitrage by shifting off balance sheet
investments that would be more costly were they held on bal-
ance sheet. This cause of financial innovation implies that, on the
one hand, more restrictive regulation in terms of activity restric-
tions and capital might limit the possibilities to innovate as well
as dampen both positive and negative effects, while, on the other
hand, a more restrictive regulatory framework might provide banks
stronger incentives to innovate around regulations (i.e. regulatory
arbitrage), which might have negative effects on stability.
Our empirical analysis shows indeed important cross-country
variation in the relationship of financial innovation with bank- and
real sector outcomes. Specifically, we find that the real and finan-
cial effects of financial innovation are stronger in countries with
larger security markets. We also find that financial innovation has
stronger positive effects on growth in countries with stronger re-
strictions on banks and overall capital stringency, suggesting that
financial innovation can help banks work around regulatory re-
strictions to the benefit of the real economy. We also find some
evidence for an international diffusion channel of financial innova-
tion.
Our paper is related and contributes to several strands of the
literature. First, we complement the literature on the importance
of financial innovation by providing consistent cross-country mea-
sures of financial innovation and relating them to an array of real
and financial sector outcome variables. Second, we add to the liter-
ature that explores the determinants of bank behavior and fragility
(e.g. Houston and James, 1995; Laeven and Levine, 2009; Houston
et al., 2010; Demirgüç-Kunt and Huizinga, 2010 ). While our study
is not able to directly answer the larger questions regarding opti-
mal risk taking, we do provide interesting insights into the chan-
nels through which financial innovative activity influences banks’
business decisions. Third, our paper is also related to the literature
on financial crises, particularly the recent one (e.g. Brunnermeier,
2009; Johnson and Kwak, 2010; Keys et al., 2010 ), as we explore
whether variation in bank performance during the crisis can be ex-
plained by pre-crisis financial innovation.
Fourth, we contribute to the literature on finance and eco-
nomic growth started by King and Levine (1993a, b ). 7 Recent con-
tributions have focused on the non-linearity of the finance-growth
link, highlighting declining, insignificant or even negative associa-
tions of finance with economic growth at high levels of GDP per
capita ( Aghion et al., 2005; Rioja and Valev, 2004; Arcand et al.,
2015 ). We find strong evidence that financial innovation is associ-
ated with higher levels of economic growth, even when controlling
for aggregate indicators of financial development, in our sample of
high-income countries. This suggests that it is not only the level
of financial development, but also innovative activities of financial
intermediaries, which help countries grow faster at high levels of
7 ANBERD contains OECD estimates that adjust for deficiencies and anomalies
that exist in the official data and might lead to underestimates.
s
a
ncome. Finally, we also contribute to the literature of banking reg-
lation ( Barth et al., 20 01, 20 06, 20 08; Laeven and Levine, 2009 ).
e find that in countries with more activity restrictions and less
tringent capital regulation, financial innovation is more likely to
ncrease bank growth and risk taking.
The rest of the paper proceeds as follows. Section 2 dis-
usses our cross-country indicators of financial innovation. Section
relates financial innovation to bank growth and fragility, while
ection 4 gauges its relationship between real-sector outcome and
conomic growth. Section 5 concludes.
. Measuring financial innovation
The literature on innovation in the manufacturing industry has
ocused mostly on patents (either outstanding or new ones), R&D
xpenditures, or share of research staff as indicators of innovative
ctivity (e.g. Helpman, 1993; Cohen and Klepper, 1996 ). Gauging
nnovative activity in the financial sector is more challenging, as
atents in the financial sector rarely exist and not at all in the Eu-
opean Union. R&D expenditures are typically not collected for fi-
ancial institutions nor are data on research staff. This lack of data,
s already pointed out by Frame and White (2004) has impeded
he rigorous study of financial innovation across countries.
We fill this gap by using an array of different indicators reflect-
ng both input into and output of financial innovations. First, we
ollect data on R&D expenditures in the financial intermediation
ndustry from the Analytical Business Enterprise Research and De-
elopment database (ANBERD). ANBERD was developed to provide
consistent, internationally comparable data set of enterprise R&D
xpenditures across industries and over time, and builds on data
rovided to the OECD by its member countries through the joint
ECD/Eurostat R&D survey. 8 These data are collected from enter-
rise surveys via the OECD/Eurostat International Survey of Re-
ources Devoted to R&D from 32 nations in the world from 1987
o 2009. R&D expenditure consists of total intramural (within firm)
nd extramural (acquired from outside) expenditures on R&D fol-
owing the definition in the Frascati Manual.
We start our analysis from 1996 when data for nearly all sam-
le countries are available, and we complement with data from
he OECD Science, Technology and R&D Statistics for some miss-
ng data in ANBERD. In particular, we obtain banking sector data
f 32 countries from SourceOECD Statistics, including 26 OECD (as
f 2009) and six non-member countries. 9
Based on R&D expenditures, we use two different indicators of
&D activities across countries and years. Specifically, SourceOECD
atabase reports Financial R&D Intensity relative to the value
dded in the financial intermediation sector ( Financial R&D Inten-
ity (Value Added) ), and we rely on this as our main gauge of fi-
ancial innovation. 10 We use an alternative indicator by standard-
zing financial R&D by total operating cost of banks to obtain Fi-
ancial R&D Intensity (Cost ), where total operating cost refers to
ize) of the financial sector, however, is challenging, as discussed, for example, by
Basu et al. (2011) . 10 The high expenditure in Denmark might be related to the high share of mort-
gage credit in this economy, while South African banks have undertaken significant
ttempts at expanding outreach after the end of apartheid.
T. Beck et al. / Journal of Banking and Finance 72 (2016) 28–51 31
t
B
c
t
t
w
fi
v
s
a
c
c
r
0
c
s
t
t
w
s
o
v
h
n
t
U
2
l
a
S
U
t
1
d
s
i
a
a
s
a
l
(
(
l
t
p
a
(
fi
c
t
i
w
s
l
a
(
d
w
.00
1.0
02
.00
3.0
04
.00
5.0
06
Fin
anci
al R
&D
Inte
nsity
(S
cale
d by
Val
ue
Add
ed)
199
6
199
7
199
8
199
9
200
0
200
1
200
2
200
3
200
4
200
5
200
6
200
7
200
8
200
9
Year
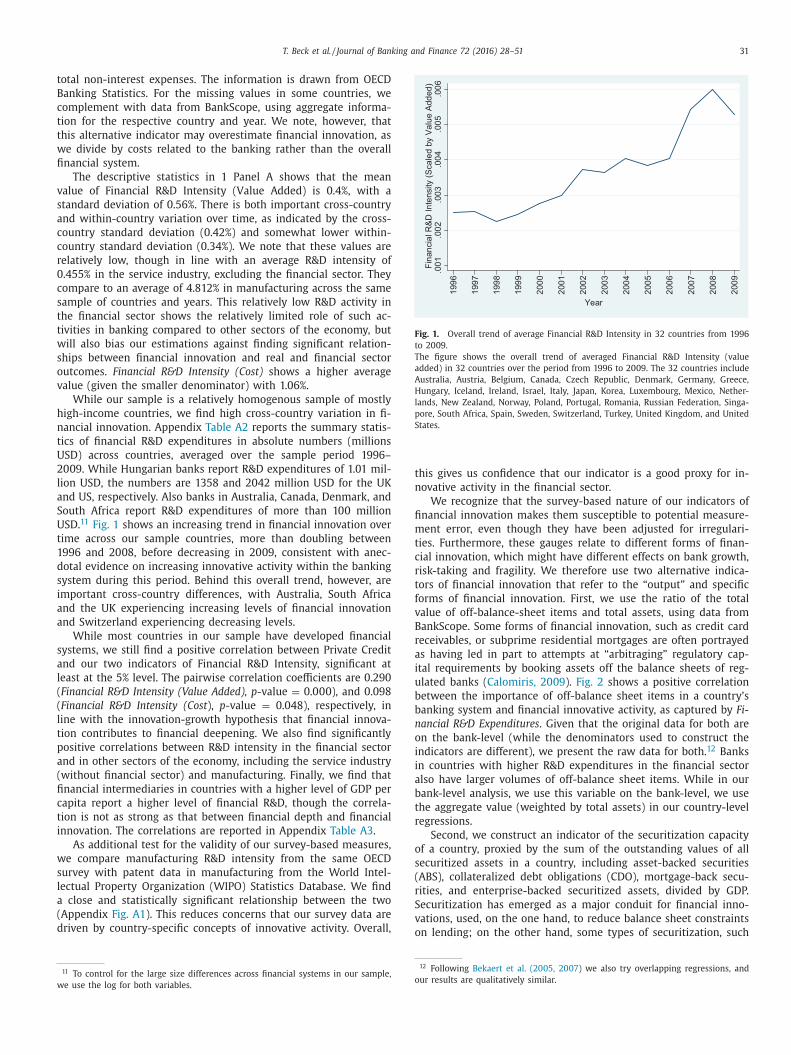
Fig. 1. Overall trend of average Financial R&D Intensity in 32 countries from 1996
to 2009.
The figure shows the overall trend of averaged Financial R&D Intensity (value
added) in 32 countries over the period from 1996 to 2009. The 32 countries include
Australia, Austria, Belgium, Canada, Czech Republic, Denmark, Germany, Greece,
Hungary, Iceland, Ireland, Israel, Italy, Japan, Korea, Luxembourg, Mexico, Nether-
lands, New Zealand, Norway, Poland, Portugal, Romania, Russian Federation, Singa-
pore, South Africa, Spain, Sweden, Switzerland, Turkey, United Kingdom, and United
States.
t
n
fi
m
t
c
r
t
f
v
B
r
a
i
u
b
b
n
o
i
i
a
b
t
r
o
s
(
r
S
v
otal non-interest expenses. The information is drawn from OECD
anking Statistics. For the missing values in some countries, we
omplement with data from BankScope, using aggregate informa-
ion for the respective country and year. We note, however, that
his alternative indicator may overestimate financial innovation, as
e divide by costs related to the banking rather than the overall
nancial system.
The descriptive statistics in 1 Panel A shows that the mean
alue of Financial R&D Intensity (Value Added) is 0.4%, with a
tandard deviation of 0.56%. There is both important cross-country
nd within-country variation over time, as indicated by the cross-
ountry standard deviation (0.42%) and somewhat lower within-
ountry standard deviation (0.34%). We note that these values are
elatively low, though in line with an average R&D intensity of
.455% in the service industry, excluding the financial sector. They
ompare to an average of 4.812% in manufacturing across the same
ample of countries and years. This relatively low R&D activity in
he financial sector shows the relatively limited role of such ac-
ivities in banking compared to other sectors of the economy, but
ill also bias our estimations against finding significant relation-
hips between financial innovation and real and financial sector
utcomes. Financial R&D Intensity (Cost) shows a higher average
alue (given the smaller denominator) with 1.06%.
While our sample is a relatively homogenous sample of mostly
igh-income countries, we find high cross-country variation in fi-
ancial innovation. Appendix Table A2 reports the summary statis-
ics of financial R&D expenditures in absolute numbers (millions
SD) across countries, averaged over the sample period 1996–
009. While Hungarian banks report R&D expenditures of 1.01 mil-
ion USD, the numbers are 1358 and 2042 million USD for the UK
nd US, respectively. Also banks in Australia, Canada, Denmark, and
outh Africa report R&D expenditures of more than 100 million
SD. 11 Fig. 1 shows an increasing trend in financial innovation over
ime across our sample countries, more than doubling between
996 and 2008, before decreasing in 2009, consistent with anec-
otal evidence on increasing innovative activity within the banking
ystem during this period. Behind this overall trend, however, are
mportant cross-country differences, with Australia, South Africa
nd the UK experiencing increasing levels of financial innovation
nd Switzerland experiencing decreasing levels.
While most countries in our sample have developed financial
ystems, we still find a positive correlation between Private Credit
nd our two indicators of Financial R&D Intensity, significant at
east at the 5% level. The pairwise correlation coefficients are 0.290
Financial R&D Intensity (Value Added), p -value = 0.0 0 0), and 0.098
Financial R&D Intensity (Cost ), p -value = 0.048), respectively, in
ine with the innovation-growth hypothesis that financial innova-
ion contributes to financial deepening. We also find significantly
ositive correlations between R&D intensity in the financial sector
nd in other sectors of the economy, including the service industry
without financial sector) and manufacturing. Finally, we find that
nancial intermediaries in countries with a higher level of GDP per
apita report a higher level of financial R&D, though the correla-
ion is not as strong as that between financial depth and financial
nnovation. The correlations are reported in Appendix Table A3 .
As additional test for the validity of our survey-based measures,
e compare manufacturing R&D intensity from the same OECD
urvey with patent data in manufacturing from the World Intel-
ectual Property Organization (WIPO) Statistics Database. We find
close and statistically significant relationship between the two
Appendix Fig. A1 ). This reduces concerns that our survey data are
riven by country-specific concepts of innovative activity. Overall,
11 To control for the large size differences across financial systems in our sample,
e use the log for both variables.
o
o
his gives us confidence that our indicator is a good proxy for in-
ovative activity in the financial sector.
We recognize that the survey-based nature of our indicators of
nancial innovation makes them susceptible to potential measure-
ent error, even though they have been adjusted for irregulari-
ies. Furthermore, these gauges relate to different forms of finan-
ial innovation, which might have different effects on bank growth,
isk-taking and fragility. We therefore use two alternative indica-
ors of financial innovation that refer to the “output” and specific
orms of financial innovation. First, we use the ratio of the total
alue of off-balance-sheet items and total assets, using data from
ankScope. Some forms of financial innovation, such as credit card
eceivables, or subprime residential mortgages are often portrayed
s having led in part to attempts at “arbitraging” regulatory cap-
tal requirements by booking assets off the balance sheets of reg-
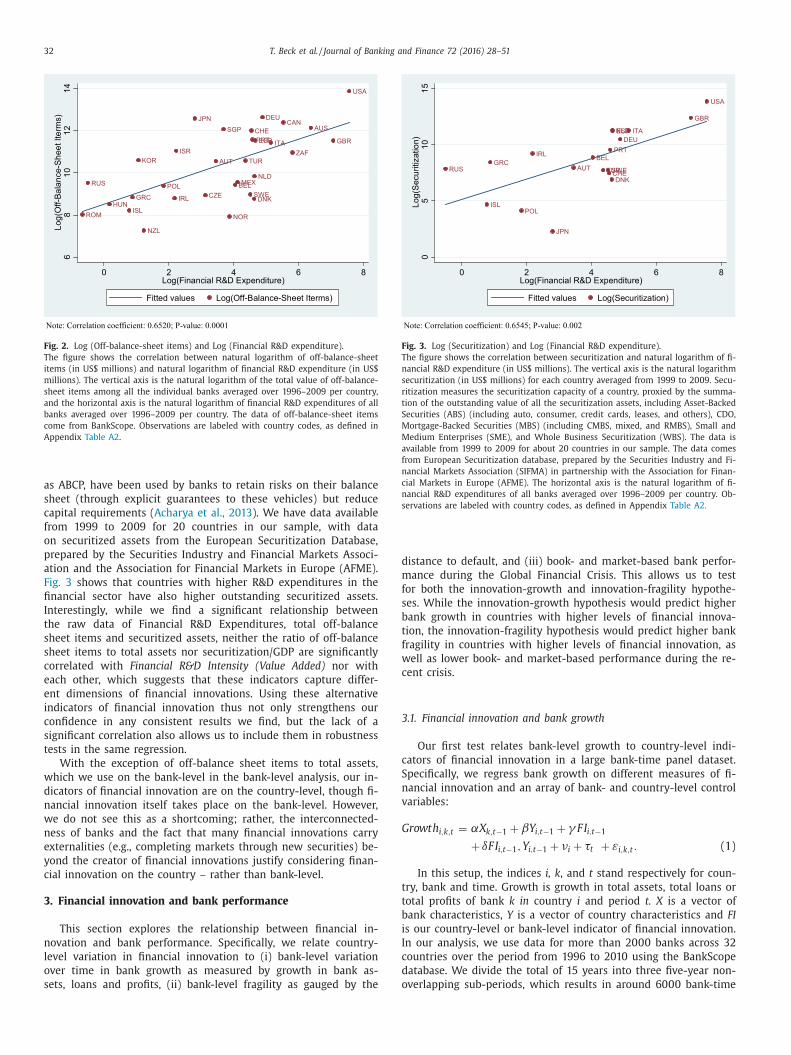
lated banks ( Calomiris, 2009 ). Fig. 2 shows a positive correlation
etween the importance of off-balance sheet items in a country’s
anking system and financial innovative activity, as captured by Fi-
ancial R&D Expenditures . Given that the original data for both are
n the bank-level (while the denominators used to construct the
ndicators are different), we present the raw data for both. 12 Banks
n countries with higher R&D expenditures in the financial sector
lso have larger volumes of off-balance sheet items. While in our
ank-level analysis, we use this variable on the bank-level, we use
he aggregate value (weighted by total assets) in our country-level
egressions.
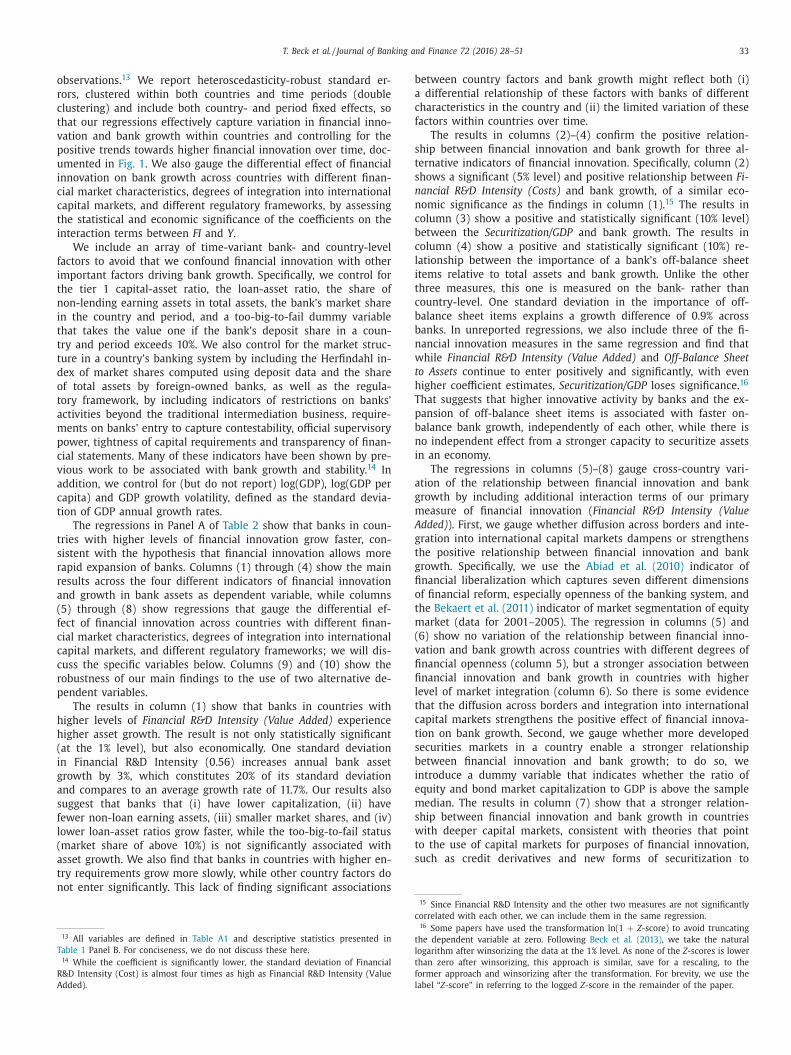
Second, we construct an indicator of the securitization capacity
f a country, proxied by the sum of the outstanding values of all
ecuritized assets in a country, including asset-backed securities
ABS), collateralized debt obligations (CDO), mortgage-back secu-
ities, and enterprise-backed securitized assets, divided by GDP.
ecuritization has emerged as a major conduit for financial inno-
ations, used, on the one hand, to reduce balance sheet constraints
n lending; on the other hand, some types of securitization, such
12 Following Bekaert et al. (20 05, 20 07 ) we also try overlapping regressions, and
ur results are qualitatively similar.
32 T. Beck et al. / Journal of Banking and Finance 72 (2016) 28–51
Fig. 2. Log (Off-balance-sheet items) and Log (Financial R&D expenditure).
The figure shows the correlation between natural logarithm of off-balance-sheet
items (in US$ millions) and natural logarithm of financial R&D expenditure (in US$
millions). The vertical axis is the natural logarithm of the total value of off-balance-
sheet items among all the individual banks averaged over 1996–2009 per country,
and the horizontal axis is the natural logarithm of financial R&D expenditures of all
banks averaged over 1996–2009 per country. The data of off-balance-sheet items
come from BankScope. Observations are labeled with country codes, as defined in
Appendix Table A2 .
Fig. 3. Log (Securitization) and Log (Financial R&D expenditure).
The figure shows the correlation between securitization and natural logarithm of fi-
nancial R&D expenditure (in US$ millions). The vertical axis is the natural logarithm
securitization (in US$ millions) for each country averaged from 1999 to 2009. Secu-
ritization measures the securitization capacity of a country, proxied by the summa-
tion of the outstanding value of all the securitization assets, including Asset-Backed
Securities (ABS) (including auto, consumer, credit cards, leases, and others), CDO,
Mortgage-Backed Securities (MBS) (including CMBS, mixed, and RMBS), Small and
Medium Enterprises (SME), and Whole Business Securitization (WBS). The data is
available from 1999 to 2009 for about 20 countries in our sample. The data comes
from European Securitization database, prepared by the Securities Industry and Fi-
nancial Markets Association (SIFMA) in partnership with the Association for Finan-
cial Markets in Europe (AFME). The horizontal axis is the natural logarithm of fi-
nancial R&D expenditures of all banks averaged over 1996–2009 per country. Ob-
servations are labeled with country codes, as defined in Appendix Table A2.
d
m
f
s
b
t
f
w
c
3
c
S
n
v
G
t
t
b
i
I
c
d
o
as ABCP, have been used by banks to retain risks on their balance
sheet (through explicit guarantees to these vehicles) but reduce
capital requirements ( Acharya et al., 2013 ). We have data available
from 1999 to 2009 for 20 countries in our sample, with data
on securitized assets from the European Securitization Database,
prepared by the Securities Industry and Financial Markets Associ-
ation and the Association for Financial Markets in Europe (AFME).
Fig. 3 shows that countries with higher R&D expenditures in the
financial sector have also higher outstanding securitized assets.
Interestingly, while we find a significant relationship between
the raw data of Financial R&D Expenditures, total off-balance
sheet items and securitized assets, neither the ratio of off-balance
sheet items to total assets nor securitization/GDP are significantly
correlated with Financial R&D Intensity (Value Added) nor with
each other, which suggests that these indicators capture differ-
ent dimensions of financial innovations. Using these alternative
indicators of financial innovation thus not only strengthens our
confidence in any consistent results we find, but the lack of a
significant correlation also allows us to include them in robustness
tests in the same regression.
With the exception of off-balance sheet items to total assets,
which we use on the bank-level in the bank-level analysis, our in-
dicators of financial innovation are on the country-level, though fi-
nancial innovation itself takes place on the bank-level. However,
we do not see this as a shortcoming; rather, the interconnected-
ness of banks and the fact that many financial innovations carry
externalities (e.g., completing markets through new securities) be-
yond the creator of financial innovations justify considering finan-
cial innovation on the country – rather than bank-level.
3. Financial innovation and bank performance
This section explores the relationship between financial in-
novation and bank performance. Specifically, we relate country-
level variation in financial innovation to (i) bank-level variation
over time in bank growth as measured by growth in bank as-
sets, loans and profits, (ii) bank-level fragility as gauged by the
istance to default, and (iii) book- and market-based bank perfor-
ance during the Global Financial Crisis. This allows us to test
or both the innovation-growth and innovation-fragility hypothe-
es. While the innovation-growth hypothesis would predict higher
ank growth in countries with higher levels of financial innova-
ion, the innovation-fragility hypothesis would predict higher bank
ragility in countries with higher levels of financial innovation, as
ell as lower book- and market-based performance during the re-
ent crisis.
.1. Financial innovation and bank growth
Our first test relates bank-level growth to country-level indi-
ators of financial innovation in a large bank-time panel dataset.
pecifically, we regress bank growth on different measures of fi-
ancial innovation and an array of bank- and country-level control
ariables:
rowt h i,k,t = αX k,t−1 + βY i,t−1 + γ F I i,t−1
+ δF I i,t−1 , Y i,t−1 + νi + τt + ε i,k,t . (1)
In this setup, the indices i, k , and t stand respectively for coun-
ry, bank and time. Growth is growth in total assets, total loans or
otal profits of bank k in country i and period t. X is a vector of
ank characteristics, Y is a vector of country characteristics and FI
s our country-level or bank-level indicator of financial innovation.
n our analysis, we use data for more than 20 0 0 banks across 32
ountries over the period from 1996 to 2010 using the BankScope
atabase. We divide the total of 15 years into three five-year non-
verlapping sub-periods, which results in around 60 0 0 bank-time
T. Beck et al. / Journal of Banking and Finance 72 (2016) 28–51 33
o
r
c
t
v
p
u
i
c
c
t
i
f
i
t
n
i
t
t
t
d
o
t
a
m
p
c
v
a
c
t
t
s
r
r
a
(
f
c
c
c
r
p
h
h
(
i
g
a
s
f
l
(
a
t
n
T
R
A
b
a
c
f
s
t
s
n
n
c
b
c
l
i
t
c
b
b
n
w
t
h
T
p
b
n
i
a
g
m
A
g
t
g
fi
o
t
m
(
v
fi
fi
l
t
c
t
s
b
i
e
m
s
w
t
s
15 Since Financial R&D Intensity and the other two measures are not significantly
bservations. 13 We report heteroscedasticity-robust standard er-
ors, clustered within both countries and time periods (double
lustering) and include both country- and period fixed effects, so
hat our regressions effectively capture variation in financial inno-
ation and bank growth within countries and controlling for the
ositive trends towards higher financial innovation over time, doc-
mented in Fig. 1 . We also gauge the differential effect of financial
nnovation on bank growth across countries with different finan-
ial market characteristics, degrees of integration into international
apital markets, and different regulatory frameworks, by assessing
he statistical and economic significance of the coefficients on the
nteraction terms between FI and Y .
We include an array of time-variant bank- and country-level
actors to avoid that we confound financial innovation with other
mportant factors driving bank growth. Specifically, we control for
he tier 1 capital-asset ratio, the loan-asset ratio, the share of
on-lending earning assets in total assets, the bank’s market share
n the country and period, and a too-big-to-fail dummy variable
hat takes the value one if the bank’s deposit share in a coun-
ry and period exceeds 10%. We also control for the market struc-
ure in a country’s banking system by including the Herfindahl in-
ex of market shares computed using deposit data and the share
f total assets by foreign-owned banks, as well as the regula-
ory framework, by including indicators of restrictions on banks’
ctivities beyond the traditional intermediation business, require-
ents on banks’ entry to capture contestability, official supervisory
ower, tightness of capital requirements and transparency of finan-
ial statements. Many of these indicators have been shown by pre-
ious work to be associated with bank growth and stability. 14 In
ddition, we control for (but do not report) log(GDP), log(GDP per
apita) and GDP growth volatility, defined as the standard devia-
ion of GDP annual growth rates.
The regressions in Panel A of Table 2 show that banks in coun-
ries with higher levels of financial innovation grow faster, con-
istent with the hypothesis that financial innovation allows more
apid expansion of banks. Columns (1) through (4) show the main
esults across the four different indicators of financial innovation
nd growth in bank assets as dependent variable, while columns
5) through (8) show regressions that gauge the differential ef-
ect of financial innovation across countries with different finan-
ial market characteristics, degrees of integration into international
apital markets, and different regulatory frameworks; we will dis-
uss the specific variables below. Columns (9) and (10) show the
obustness of our main findings to the use of two alternative de-
endent variables.
The results in column (1) show that banks in countries with
igher levels of Financial R&D Intensity (Value Added) experience
igher asset growth. The result is not only statistically significant
at the 1% level), but also economically. One standard deviation
n Financial R&D Intensity (0.56) increases annual bank asset
rowth by 3%, which constitutes 20% of its standard deviation
nd compares to an average growth rate of 11.7%. Our results also
uggest that banks that (i) have lower capitalization, (ii) have
ewer non-loan earning assets, (iii) smaller market shares, and (iv)
ower loan-asset ratios grow faster, while the too-big-to-fail status
market share of above 10%) is not significantly associated with
sset growth. We also find that banks in countries with higher en-
ry requirements grow more slowly, while other country factors do
ot enter significantly. This lack of finding significant associations
13 All variables are defined in Table A1 and descriptive statistics presented in
able 1 Panel B. For conciseness, we do not discuss these here. 14 While the coefficient is significantly lower, the standard deviation of Financial
&D Intensity (Cost) is almost four times as high as Financial R&D Intensity (Value
dded).
c
t
l
t
f
l
etween country factors and bank growth might reflect both (i)
differential relationship of these factors with banks of different
haracteristics in the country and (ii) the limited variation of these
actors within countries over time.
The results in columns (2)–(4) confirm the positive relation-
hip between financial innovation and bank growth for three al-
ernative indicators of financial innovation. Specifically, column (2)
hows a significant (5% level) and positive relationship between Fi-
ancial R&D Intensity (Costs) and bank growth, of a similar eco-
omic significance as the findings in column (1). 15 The results in
olumn (3) show a positive and statistically significant (10% level)
etween the Securitization/GDP and bank growth. The results in
olumn (4) show a positive and statistically significant (10%) re-
ationship between the importance of a bank’s off-balance sheet
tems relative to total assets and bank growth. Unlike the other
hree measures, this one is measured on the bank- rather than
ountry-level. One standard deviation in the importance of off-
alance sheet items explains a growth difference of 0.9% across
anks. In unreported regressions, we also include three of the fi-
ancial innovation measures in the same regression and find that
hile Financial R&D Intensity (Value Added) and Off-Balance Sheet
o Assets continue to enter positively and significantly, with even
igher coefficient estimates, Securitization/GDP loses significance. 16
hat suggests that higher innovative activity by banks and the ex-
ansion of off-balance sheet items is associated with faster on-
alance bank growth, independently of each other, while there is
o independent effect from a stronger capacity to securitize assets
n an economy.
The regressions in columns (5)–(8) gauge cross-country vari-
tion of the relationship between financial innovation and bank
rowth by including additional interaction terms of our primary
easure of financial innovation ( Financial R&D Intensity (Value
dded) ). First, we gauge whether diffusion across borders and inte-
ration into international capital markets dampens or strengthens
he positive relationship between financial innovation and bank
rowth. Specifically, we use the Abiad et al. (2010) indicator of
nancial liberalization which captures seven different dimensions
f financial reform, especially openness of the banking system, and
he Bekaert et al. (2011) indicator of market segmentation of equity
arket (data for 20 01–20 05). The regression in columns (5) and
6) show no variation of the relationship between financial inno-
ation and bank growth across countries with different degrees of
nancial openness (column 5), but a stronger association between
nancial innovation and bank growth in countries with higher
evel of market integration (column 6). So there is some evidence
hat the diffusion across borders and integration into international
apital markets strengthens the positive effect of financial innova-
ion on bank growth. Second, we gauge whether more developed
ecurities markets in a country enable a stronger relationship
etween financial innovation and bank growth; to do so, we
ntroduce a dummy variable that indicates whether the ratio of
quity and bond market capitalization to GDP is above the sample
edian. The results in column (7) show that a stronger relation-
hip between financial innovation and bank growth in countries
ith deeper capital markets, consistent with theories that point
o the use of capital markets for purposes of financial innovation,
uch as credit derivatives and new forms of securitization to
orrelated with each other, we can include them in the same regression. 16 Some papers have used the transformation ln(1 + Z -score) to avoid truncating
he dependent variable at zero. Following Beck et al. (2013) , we take the natural
ogarithm after winsorizing the data at the 1% level. As none of the Z -scores is lower
han zero after winsorizing, this approach is similar, save for a rescaling, to the
ormer approach and winsorizing after the transformation. For brevity, we use the
abel “Z -score” in referring to the logged Z -score in the remainder of the paper.
34 T. Beck et al. / Journal of Banking and Finance 72 (2016) 28–51
i
f
v
s
s
m
t
t
l
c
t
s
3
t
s
t
s
t
S
t
t
(
b
g
i
t
g
s
i
r
T
i
t
d
c
l
s
h
g
n
a
s
o
3
c
l
i
C
w
c
h
t
o
g
w
better manage risks and expand credit. Third, we gauge whether
the regulatory framework has a conditioning effect on the re-
lationship between financial innovation and bank growth. The
results in column (8) show that the relationship between financial
innovation and bank growth is stronger in countries with tighter
capital regulation and higher activity restrictions, while there is no
significant interaction with financial statement transparency. This
can be interpreted as regulatory restrictions providing impetus for
financially innovative activities (“regulatory arbitrage”) to expand
banks’ balance sheets.
The results in columns (9) and (10), finally, show the robust-
ness of our findings to using alternative indicators of bank growth.
Financial R&D Intensity (Value Added) enters positively and signifi-
cantly at the 1% level in the regressions of both bank loan growth
(column 9) and bank profit growth (column 10). In unreported re-
gressions, we also confirm our findings with these two dependent
variables and alternative indicators of financial innovation, used in
columns (2)–(4).
3.2. Financial innovation and bank fragility
To gauge the relationship between financial innovation and
bank fragility, we run the same regressions as in the previous sec-
tion, but using a measure of banks’ distance to default as depen-
dent variable. Specifically, we run the following regression
Z i,k,t = αX k,t−1 + βY i,t−1 + γ F I i,t−1 + δF I i,t−1 Y i,t−1 + νi + τt + ε i,k,t,
(2)
where Z is the log of the z -score of bank k in country i in period t.
The Z-score represents the number of standard deviations by which
profits would have to fall below the mean so as to deplete equity
capital ( Boyd et al., 2006 ) and is defined as (ROA + CAR)/ σ (ROA),
where ROA is the rate of return on assets, CAR is the ratio of eq-
uity to assets, and σ (ROA) is the standard deviation of ROA. The Z -
score is a measure of a bank’s distance from insolvency ( Roy, 1952 )
and has been widely used in the recent literature (e.g. Laeven and
Levine, 2009; Houston et al., 2010; Demirguc-Kunt and Huizinga,
2010 ). Since the Z -score is highly skewed, we follow Laeven and
Levine (2009) and use the natural logarithm of the Z -score as the
risk measure. 17
The regression results in Panel B of Table 2 show a negative re-
lationship between financial innovation on the country- and bank-
level and bank stability, as measured by the z -score, though with
important cross-country variation. Specifically, all four indicators of
financial innovation enter negatively and significantly at least at
the 5% level (columns 1–4). The relationship is not only statisti-
cally but also economically significant. Using Financial R&D Inten-
sity (Value Added) , we find that one standard deviation variation
in financial innovation results in 0.32 difference in log( z -score),
around 30% of one standard deviation. In unreported regressions,
we find (similar to the case of bank growth), that when including
three of the financial innovation measures together in the regres-
sion , Financial R&D Intensity (Value Added) and off-balance sheet
items/total assets continue to enter negatively and significantly,
while securitization/GDP loses significance.
In unreported regressions, we also explore which of the three
components of the z -score drives the relationship between finan-
cial innovation and fragility. While we do not find significant rela-
tionships between financial innovation and profitability or capital-
ization, we find a positive and significant relationship between the
volatility of ROA (i.e. the denominator of the z -score) and financial
17 Their sample is smaller as they are focusing only on a sample of large banks,
with total assets larger than $50bn.
2
w
t
h
nnovation. This suggests that financial innovation increases bank
ragility through a higher volatility of their profitability.
The results in columns (5)–(8) show important cross-country
ariation in the relationship between financial innovation and bank
tability. As in the case of bank growth, we interact our main mea-
ure of financial innovation with indicators of international capital
arket integration, securities market development and the regula-
ory framework. First, the results in columns (5) and (6) show that
he relationship between financial innovation and bank fragility is
ess strong in countries that are less integrated in international
apital markets. Specifically, for countries with market segmen-
ation above 2.7%, the relationship between Financial R&D Inten-
ity (Value Added) and the z -score turns positive. Nine out of the
2 countries have market segmentation above this value. The in-
eraction between financial liberalization and Financial R&D Inten-
ity (Value Added) enters negatively, but not significantly. Together,
he findings provide suggestive but not conclusive evidence that
tronger integration in international capital markets exacerbates
he relationship between financial innovation and bank fragility.
econd, the results in column (7) show that the relationship be-
ween financial innovation and bank fragility is stronger in coun-
ries with deeper security markets. Finally, the results in column
8) show that this relationship is stronger in countries where
anks’ activities are more restricted, while the relationship is miti-
ated by more transparent bank statements. There is thus some ev-
dence that regulatory restrictions strengthen the relationship be-
ween financial innovation and bank fragility, while a higher de-
ree of transparency weakens it.
While we cannot interpret our regression results in a causal
ense, the results in Table 2 suggest a trade-off between financial
nnovations allowing banks to expand their balance sheets more
apidly but also being associated with higher levels of fragility.
hese findings are consistent across different measures of financial
nnovation and show important differential effects across coun-
ries with different financial structures, regulatory frameworks and
egree of integration into international capital markets. Specifi-
ally, the size of securities markets has an important role in al-
owing banks to use financial innovations to grow their balance
heets but also expose them to higher profit volatility and thus
igher fragility. We find that international capital market inte-
ration strengthens the positive relationship between financial in-
ovation and bank growth but also between financial innovation
nd bank fragility, consistent with evidence from the recent cri-
is where international capital market integration might have been
ne of several contagion channels (e.g. Devereux and Yu, 2014 ).
.3. Did financial innovation hurt banks during the global crisis?
The estimations so far rely on panel regressions relating finan-
ial innovation (mostly measured on the country-level) to bank-
evel growth and stability over longer time periods. In the follow-
ng, we focus on bank performance around the Global Financial
risis, using book- and market-based indicators. In the first test,
e regress the difference in ROA between 20 08 and 20 06 on finan-
ial innovation in 2006 to assess whether banks in countries with
igher pre-crisis levels of financial innovation in the banking sec-
or showed stronger performance reductions during the first year
f the global financial crisis. Specifically, we run the following re-
ression:
R i,k = αX k + βY i, + γ F I i + ε i,k, (3)
here R is ROA and the right-hand side variables are taken for
006. A negative sign on γ would indicate that banks in countries
ith higher levels of financial innovation suffered more during
he global financial crisis, consistent with the innovation-fragility
ypothesis. We include the same bank- and country-level control
T. Beck et al. / Journal of Banking and Finance 72 (2016) 28–51 35
v
s
v
r
i
e
p
b
1
O
n
b
e
i
t
i
s
i
R
i
s
fi
l
a
c
p
o
(
o
r
o
o
h
c
v
S
a
a
a
n
a
w
b
c
l
i
i
c
d
t
t
t
a
t
c
s
F
s
(
t
o
Z
3
c
t
b
d
g
b
B
i
v
a
i
i
s
d
f
s
4
e
w
fi
c
p
n
f
p
d
s
g
t
w
t
e
L
H
n
i
1
i
s
s
i
a
c
u
c
d
a
i
o
m
i
ariables as in regressions ( 1 ) and ( 2 ). When using off-balance
heet items/total assets as bank-level indicator of financial inno-
ation, we include country fixed effects. We cluster standard er-
ors at the country-level to take into account possible correlation
n banks’ performance during the crisis not captured by any of the
xplanatory variables.
We use a bank-level sample to assess the relationship between
re-crisis financial innovation and changes in banks’ profitability
etween 2006 and 2008. Descriptive statistics for this sample of
536 banks across 32 countries are reported in Panel C of Table 2 .
n average, banks’ ROA dropped by 1.2% between 20 06 and 20 08.
The results in Table 3 Panel A suggest that higher pre-crisis fi-
ancial innovation is associated with higher drops in profitability
etween 2006 and 2008. All four indicators of financial innovation
nter negatively in the regressions of changes in ROA and signif-
cantly at least at the 10% level. The economic effect of this rela-
ionship is also large. Taking the column (1) estimate, for example,
t suggests that a one standard deviation in Financial R&D Inten-
ity (Value Added) is associated with a 0.3 percentage point drop
n ROA, compared to an average drop of 1.2 percentage point in
OA. It is important to note that even when using the bank-level
ndicator of financial innovation (off-balance sheet items/total as-
ets) and thus considering within-country relationships between
nancial innovation and bank performance, we find a negative re-
ationship. Our results also suggest that banks with higher loan-
sset ratios and higher tier 1 capital-asset ratio as well as banks in
ountries with more transparent standard for financial statements
erformed better during the crisis.
A second test of the impact of pre-crisis financial innovation
n banks’ crisis performance builds on work by Beltratti and Stulz
2012) . Specifically, they regress the buy-and-hold stock return
ver the crisis period from July 2007 to December 2008 on an ar-
ay of bank and country characteristics. We follow their method-
logy with a larger sample of banks and include our measures
f financial innovation to gauge whether banks in countries with
igher levels of financial innovation performed worse during the
risis. We include a similar set of same bank- and country-level
ariables as Beltratti and Stulz (2012) , but use a larger sample. 18
pecifically, we include 487 banks in Bankscope with returns avail-
ble from Datastream, with a loan-to-assets ratio larger than 10%
nd a deposit-to-assets ratio larger than 20%. Bank characteristics
re computed using data from 2006 and thus prior to the begin-
ing of the financial crisis, while the financial innovation measures
re averaged over the available years before 2007.
The results in Table 3 Panel B suggest that banks in countries
ith a higher level of financial innovation pre-crisis had lower
uy-and-hold returns during the crisis. All four measures of finan-
ial innovation enter negatively and significantly at least at the 5%
evel. We also find that banks that rely more on deposits for fund-
ng, higher z -scores, higher diversity in interest- and non-interest
ncome, a higher share of non-lending assets and a lower Tier 1
apital ratio have higher buy-and hold stock returns.
In a final test on whether our findings in this section are not
riven by omitted variable bias, we replace the financial innova-
ion indicator with R&D intensity in manufacturing as a placebo
est. If our indicator of financial innovation reflects a general atti-
ude towards risk-taking in society and the findings in this section
re thus driven by a spurious correlation, the indicator of R&D in-
ensity in manufacturing should also enter negatively and signifi-
antly. This test is biased in favor of this hypothesis as R&D inten-
ity in manufacturing is positively and significantly correlated with
inancial R&D Intensity, as discussed earlier.
18 For a more detailed discussion on the advantages of PE ratios over other mea-
ures of growth opportunities and details on their construction, see Bekaert et al.
2007) .
t
w
f
f
The results in Appendix Table A4 show that Financial R&D In-
ensity does not proxy for general innovative attitude in the econ-
my. Here, we replicate the regressions of the bank growth and
-score in Table 2 and the regressions of change in ROA in Table
. R&D intensity in manufacturing enters positively and insignifi-
antly across all three regressions. In the case of the z -score and
he ROA change, it thus has also the wrong sign in addition to
eing insignificant. Overall, these findings provide additional evi-
ence that the relationship between financial innovation and bank
rowth and fragility is not driven by a spurious correlation.
In summary, the results in this section provide evidence for
oth the innovation-growth and innovation-fragility hypotheses.
anks grow faster in countries with higher levels of financial
nnovation, but also experience higher fragility, due to higher
olatility of their profits. Financial innovation thus seems to be
double-sided sword, contributing to financial deepening and to
nstability. This raises the question on the relationship of financial
nnovation with real economy outcomes. Does financial innovation
upport economic growth by supporting financial deepening or
oes it undermine economic growth by resulting in oversized and
ragile financial systems? We will turn to this question in the next
ection.
. Financial innovation and the real economy
The results in the previous section suggest a trade-off in the
ffects of financial innovation o banks’ growth and stability. But
hat are the real sector implications of financial innovation? The
nance and growth literature suggests positive real sector impli-
ations of more efficient banking systems; do these findings ex-
and to financial innovation that helps countries deepen their fi-
ancial systems? Alternatively, and consistent with the innovation-
ragility hypothesis, does financial innovation lead to an overex-
ansion of the financial sector, with higher fragility ultimately un-
ermining the growth of the real economy? In this section, we
tudy the relationship between financial innovation and economic
rowth.
To address endogeneity concerns and explore the channels
hrough which financial innovation might affect the real economy,
e focus on exogenous growth opportunities. Theory suggests
hat financial intermediaries are critical in choosing projects and
ntrepreneurs with the highest growth opportunities ( King and
evine, 1993a ), as well as in monitoring them ( Blackburn and
ung, 1998 ). Similarly, by offering risk diversification opportu-
ities, well-developed financial intermediaries allow investment
n high risk but high return projects ( Greenwood and Jovanovic,
990 ). The innovation-growth hypothesis suggests that financial
nnovation helps financial intermediaries and markets improve
creening, monitoring and risk management capacities and thus
upport and fund growth opportunities in the real economy. The
nnovation-fragility hypothesis would predict no such effect or,
t a minimum no long-term sustainable growth effect, as finan-
ial innovations mainly serve regulatory arbitrage purposes and
ndermine stable financial intermediaries with negative reper-
ussions for the real economy. In this section, we will employ
ifferent panel data sets (i) across countries and over time and (ii)
cross countries and across industries, exploring whether financial
nnovation helps countries and industries with higher growth
pportunities grow faster. In each case, we will first explain the
ethodology, then describe data and finally discuss the results.
One important concern that we want to address before present-
ng regressions of real sector outcomes of financial innovation is
hat of endogeneity – in faster growing economies or economies
ith higher growth opportunities there might be higher demand
or innovative financial products. In addition, relating country-level
actors such as financial development or innovation always raises
36 T. Beck et al. / Journal of Banking and Finance 72 (2016) 28–51
t
h
d
g
r
v
s
s
k
w
a
s
h
t
o
r
r
e
T
t
i
fi
c
4
o
e
w
q
c
g
p
m
G
w
p
o
o
c
d
e
t
a
t
a
o
a
l
d
a
p
(
t
a
t
A
e
concerns of simultaneity bias, where omitted factors drive both the
explanatory variable of interest and the dependent variable. In the
following, we will therefore first present regressions exploring fac-
tors explaining cross-country and over-time variation in financial
innovation, including growth opportunities, since our subsequent
regression analysis will exploit cross-country and cross-industry
variation in growth opportunities.
4.1. What explains cross-country variation in financial innovation?
We first explore factors explaining cross-country and over-time
variation in financial innovation. We would like to stress that
this is far from being a full-fledged analysis of the drivers of
financial innovation, an analysis beyond the objective of this paper
and which we leave for future research. Table 4 thus presents
exploratory OLS regressions, relating country-year variation in fi-
nancial innovation to an array of country characteristics, including
indicators of financial market structure and the regulatory frame-
work of countries. Specifically, we use the following regression
set-up:
F I i,t = αX i,t + Yea r t + ε i,t, (4)
where i stands for country and t for year. We include year-fixed
effects to control for the time trends documented earlier. While
we exploit variation in financial innovation both across countries
and over time, not all our explanatory variables, most notably the
regulatory indicators, vary over time. To control for this and the
correlation of the intensity of financial innovation within coun-
tries over time but also across countries within given years, we
double-cluster our standard errors at the country- and year-level.
One of our main variables of interest is growth opportunities,
which in the following regressions (as well as in the subsequent
section) we measure on the country-year level. We follow Bekaert
et al.’s (2007) methodology and measure exogenous growth op-
portunities for each country by the weighted average of indus-
try price-earnings ratios using data across our sample countries.
This measure is based on the assumptions that a country’s growth
potential is reflected in the growth potential of its industry mix
and that price-earnings (PE) ratios contain valuable information
about an industry’s growth opportunities. 19 We compute the global
growth opportunities of a country i in year t as the PE ratios com-
puted on global data on listed companies, averaged across 35 sec-
tors weighed by annual country-specific industry weights based on
lagged market capitalization. As this measure might be driven by
differences in persistent discount rates, we follow Bekaert et al.
(2007) and remove a 60-month moving average from this mea-
sure. The descriptive statistics show an average GGO_MA of 0.078
across countries and over time, with a standard deviation of 0.419
( Table 1 , Panel D).
The regressions in Table 4 show that cross-country and over
time variation in financial innovation is associated with different
features of the regulatory framework, the ownership structure and
the importance of capital markets. Most notably, however, we find
no significant relationship between a country’s growth opportuni-
ties and financial innovation by its banks. Columns (1)–(6) use Fi-
nancial R&D Intensity (Value Added) as dependent variable, while
columns (7)–(9) use the three alternative indicators of financial
innovation. The results suggest higher levels of financial innova-
tion in countries with higher restrictions on banks’ activities, with
less powerful supervisors, but higher capital stringency and less
transparent accounting standards. Overall, this provides some ev-
idence for the regulatory arbitrage hypothesis of financial innova-
19 We cannot use our fourth indicator – securitization/GDP, given limited coun-
try and time-series coverage. When including both Financial R&D Intensity (Value
Added) and off-balance sheet items/total assets, only the latter enters significantly.
e
i
t
ion, especially in countries with higher activities restrictions and
igher informational opacity. While not all of these regulatory in-
icators enter consistently across all specifications, the share of
overnment-owned enters negatively and highly significantly in all
egressions, suggesting that – for better or worse – financial inno-
ation is associated with private bank ownership. While the inten-
ity of financial innovation does not vary with the level of banking
ector development (as proxied by Private Credit to GDP) and mar-
et structure (as proxied by the Herfindahl index and its square),
e find a positive relationship between stock market development
nd financial innovation. In addition, countries with above median
ecurities market depth (comprising equity and debt markets) have
igher levels of financial innovation. We also find some evidence
hat financial innovation is lower in larger countries. Important for
ur subsequent regression analysis, we cannot find any significant
elationship of financial innovation with growth opportunities. The
esults also show no significant relationship between the level of
conomic development or business cycles and financial innovation.
he fact that some of the same characteristics that make a coun-
ry more or less susceptible to the benefits and costs of financial
nnovation also explain why banks in this country invest more in
nancial innovation shows the importance of a differentiated and
ontext-specific regulatory approach towards financial innovation.
.2. Does financial innovation help countries exploit growth
pportunities?
Our first test of the effect of financial innovation on the real
conomy builds on previous work by Bekaert et al. (20 05, 20 07 )
ho show that exogenous growth opportunities predict subse-
uent GDP growth and more so in countries with liberalized
apital accounts, banking systems and equity markets. Here, we
auge the relationship between financial innovation, growth op-
ortunities and GDP per capita growth in the following regression
odel:
rowt h i,t = β1 GGO _ M A i,t + β2 F I i,t + β3 GGO _ M A i,t ∗F I i,t + γ X i,t
+
∑
i
δi Countr y i + ε i,t , (5)
here Growth i,t is the five-year moving average annual real GDP
er capita growth in country i and period t; GGO_MA is a measure
f global growth opportunities and FI is one of our indicators
f financial innovation; X contains an array of time-variant
ountry-level control variables and Country is an array of country
ummies. Our sample period is 1997–2010 and, following Bekaert
t al. (2007) , we use overlapping five year samples to exploit
he time-series information in our sample to a maximum and
djust standard errors accordingly. Since, Bekaert et al. (2007) find
hat domestic banking development, equity market development
nd financial liberalization are important for exploiting growth
pportunities, we also control for the interaction of GGO_MA
nd (i) Private Credit to GDP, which is calculated as the natural
ogarithm of financial institutions’ claims on the private sector
ivided by GDP, (ii) a measure of financial liberalization, defined
s a dummy that takes on a value of one if there has been a
ositive change in financial liberalization index in a specific year
Abiad et al., 2010 ), and (iii) stock market capitalization to GDP
o gauge the size of equity markets. We therefore pick up any
dditional direct effect of financial innovation on growth, beyond
he effect through financial development or financial liberalization.
s we include country dummies, our coefficient estimates pick up
conomic relationships relative to country averages.
The estimate of the regression coefficients β allows us to differ-
ntiate between different hypotheses regarding the role of financial
nnovation. Specifically, a positive β2 would be evidence in favor of
he innovation-growth hypothesis. In addition and consistent with
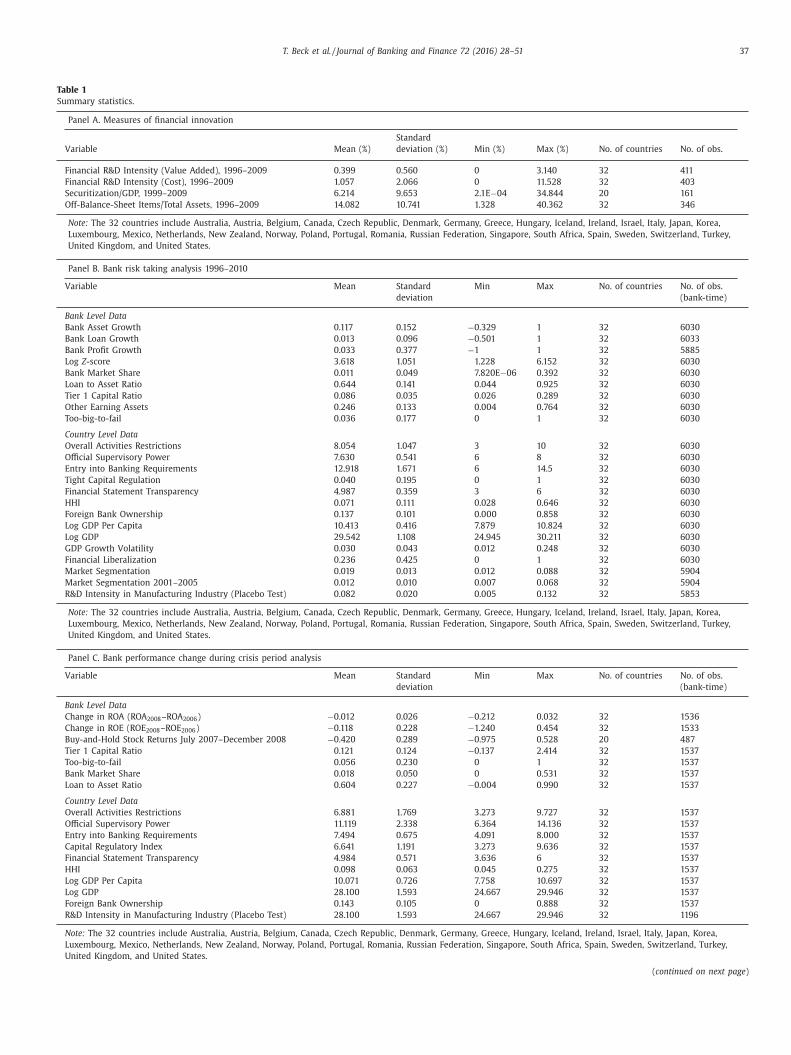
T. Beck et al. / Journal of Banking and Finance 72 (2016) 28–51 37
Table 1
Summary statistics.
Panel A. Measures of financial innovation
Variable Mean (%)
Standard
deviation (%) Min (%) Max (%) No. of countries No. of obs.
Financial R&D Intensity (Value Added), 1996–2009 0.399 0.560 0 3.140 32 411
Financial R&D Intensity (Cost), 1996–2009 1.057 2.066 0 11.528 32 403
Securitization/GDP, 1999–2009 6.214 9.653 2.1E −04 34.844 20 161
Off-Balance-Sheet Items/Total Assets, 1996–2009 14.082 10.741 1.328 40.362 32 346
Note: The 32 countries include Australia, Austria, Belgium, Canada, Czech Republic, Denmark, Germany, Greece, Hungary, Iceland, Ireland, Israel, Italy, Japan, Korea,
Luxembourg, Mexico, Netherlands, New Zealand, Norway, Poland, Portugal, Romania, Russian Federation, Singapore, South Africa, Spain, Sweden, Switzerland, Turkey,
United Kingdom, and United States.
Panel B. Bank risk taking analysis 1996–2010
Variable Mean Standard
deviation
Min Max No. of countries No. of obs.
(bank-time)
Bank Level Data
Bank Asset Growth 0.117 0.152 −0.329 1 32 6030
Bank Loan Growth 0.013 0.096 −0.501 1 32 6033
Bank Profit Growth 0.033 0.377 −1 1 32 5885
Log Z -score 3.618 1.051 1.228 6.152 32 6030
Bank Market Share 0.011 0.049 7.820E −06 0.392 32 6030
Loan to Asset Ratio 0.644 0.141 0.044 0.925 32 6030
Tier 1 Capital Ratio 0.086 0.035 0.026 0.289 32 6030
Other Earning Assets 0.246 0.133 0.004 0.764 32 6030
Too-big-to-fail 0.036 0.177 0 1 32 6030
Country Level Data
Overall Activities Restrictions 8.054 1.047 3 10 32 6030
Official Supervisory Power 7.630 0.541 6 8 32 6030
Entry into Banking Requirements 12.918 1.671 6 14.5 32 6030
Tight Capital Regulation 0.040 0.195 0 1 32 6030
Financial Statement Transparency 4.987 0.359 3 6 32 6030
HHI 0.071 0.111 0.028 0.646 32 6030
Foreign Bank Ownership 0.137 0.101 0.0 0 0 0.858 32 6030
Log GDP Per Capita 10.413 0.416 7.879 10.824 32 6030
Log GDP 29.542 1.108 24.945 30.211 32 6030
GDP Growth Volatility 0.030 0.043 0.012 0.248 32 6030
Financial Liberalization 0.236 0.425 0 1 32 6030
Market Segmentation 0.019 0.013 0.012 0.088 32 5904
Market Segmentation 20 01–20 05 0.012 0.010 0.007 0.068 32 5904
R&D Intensity in Manufacturing Industry (Placebo Test) 0.082 0.020 0.005 0.132 32 5853
Note: The 32 countries include Australia, Austria, Belgium, Canada, Czech Republic, Denmark, Germany, Greece, Hungary, Iceland, Ireland, Israel, Italy, Japan, Korea,
Luxembourg, Mexico, Netherlands, New Zealand, Norway, Poland, Portugal, Romania, Russian Federation, Singapore, South Africa, Spain, Sweden, Switzerland, Turkey,
United Kingdom, and United States.
Panel C. Bank performance change during crisis period analysis
Variable Mean Standard
deviation
Min Max No. of countries No. of obs.
(bank-time)
Bank Level Data
Change in ROA (ROA 2008 –ROA 2006 ) −0.012 0.026 −0.212 0.032 32 1536
Change in ROE (ROE 2008 –ROE 2006 ) −0.118 0.228 −1.240 0.454 32 1533
Buy-and-Hold Stock Returns July 20 07–December 20 08 −0.420 0.289 −0.975 0.528 20 487
Tier 1 Capital Ratio 0.121 0.124 −0.137 2.414 32 1537
Too-big-to-fail 0.056 0.230 0 1 32 1537
Bank Market Share 0.018 0.050 0 0.531 32 1537
Loan to Asset Ratio 0.604 0.227 −0.004 0.990 32 1537
Country Level Data
Overall Activities Restrictions 6.881 1.769 3.273 9.727 32 1537
Official Supervisory Power 11.119 2.338 6.364 14.136 32 1537
Entry into Banking Requirements 7.494 0.675 4.091 8.0 0 0 32 1537
Capital Regulatory Index 6.641 1.191 3.273 9.636 32 1537
Financial Statement Transparency 4.984 0.571 3.636 6 32 1537
HHI 0.098 0.063 0.045 0.275 32 1537
Log GDP Per Capita 10.071 0.726 7.758 10.697 32 1537
Log GDP 28.100 1.593 24.667 29.946 32 1537
Foreign Bank Ownership 0.143 0.105 0 0.888 32 1537
R&D Intensity in Manufacturing Industry (Placebo Test) 28.100 1.593 24.667 29.946 32 1196
Note: The 32 countries include Australia, Austria, Belgium, Canada, Czech Republic, Denmark, Germany, Greece, Hungary, Iceland, Ireland, Israel, Italy, Japan, Korea,
Luxembourg, Mexico, Netherlands, New Zealand, Norway, Poland, Portugal, Romania, Russian Federation, Singapore, South Africa, Spain, Sweden, Switzerland, Turkey,
United Kingdom, and United States.
( continued on next page )
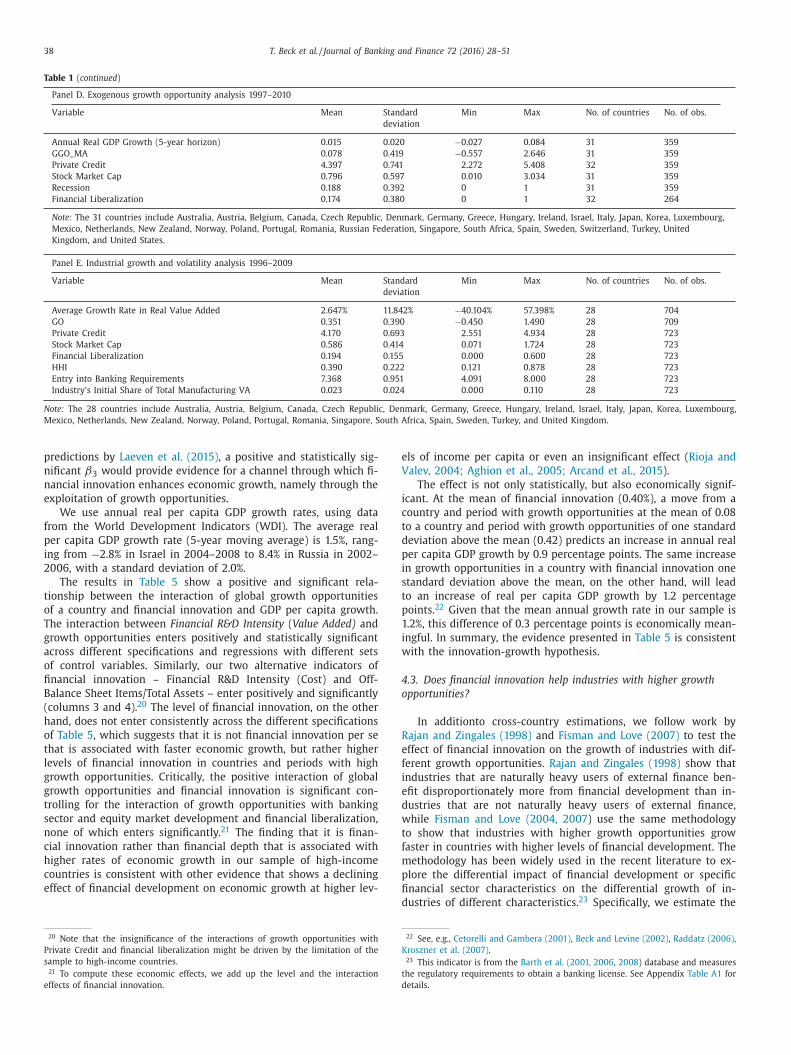
38 T. Beck et al. / Journal of Banking and Finance 72 (2016) 28–51
Table 1 ( continued )
Panel D. Exogenous growth opportunity analysis 1997–2010
Variable Mean Standard
deviation
Min Max No. of countries No. of obs.
Annual Real GDP Growth (5-year horizon) 0.015 0.020 −0.027 0.084 31 359
GGO_MA 0.078 0.419 −0.557 2.646 31 359
Private Credit 4.397 0.741 2.272 5.408 32 359
Stock Market Cap 0.796 0.597 0.010 3.034 31 359
Recession 0.188 0.392 0 1 31 359
Financial Liberalization 0.174 0.380 0 1 32 264
Note: The 31 countries include Australia, Austria, Belgium, Canada, Czech Republic, Denmark, Germany, Greece, Hungary, Ireland, Israel, Italy, Japan, Korea, Luxembourg,
Mexico, Netherlands, New Zealand, Norway, Poland, Portugal, Romania, Russian Federation, Singapore, South Africa, Spain, Sweden, Switzerland, Turkey, United
Kingdom, and United States.
Panel E. Industrial growth and volatility analysis 1996–2009
Variable Mean Standard
deviation
Min Max No. of countries No. of obs.
Average Growth Rate in Real Value Added 2.647% 11.842% −40.104% 57.398% 28 704
GO 0.351 0.390 −0.450 1.490 28 709
Private Credit 4.170 0.693 2.551 4.934 28 723
Stock Market Cap 0.586 0.414 0.071 1.724 28 723
Financial Liberalization 0.194 0.155 0.0 0 0 0.600 28 723
HHI 0.390 0.222 0.121 0.878 28 723
Entry into Banking Requirements 7.368 0.951 4.091 8.0 0 0 28 723
Industry’s Initial Share of Total Manufacturing VA 0.023 0.024 0.0 0 0 0.110 28 723
Note: The 28 countries include Australia, Austria, Belgium, Canada, Czech Republic, Denmark, Germany, Greece, Hungary, Ireland, Israel, Italy, Japan, Korea, Luxembourg,
Mexico, Netherlands, New Zealand, Norway, Poland, Portugal, Romania, Singapore, South Africa, Spain, Sweden, Turkey, and United Kingdom.
e
V
i
c
t
d
p
i
s
t
p
1
i
w
4
o
R
e
f
i
e
d
w
t
f
m
p
fi
predictions by Laeven et al. (2015) , a positive and statistically sig-
nificant β3 would provide evidence for a channel through which fi-
nancial innovation enhances economic growth, namely through the
exploitation of growth opportunities.
We use annual real per capita GDP growth rates, using data
from the World Development Indicators (WDI). The average real
per capita GDP growth rate (5-year moving average) is 1.5%, rang-
ing from −2.8% in Israel in 20 04–20 08 to 8.4% in Russia in 2002–
2006, with a standard deviation of 2.0%.
The results in Table 5 show a positive and significant rela-
tionship between the interaction of global growth opportunities
of a country and financial innovation and GDP per capita growth.
The interaction between Financial R&D Intensity ( Value Added) and
growth opportunities enters positively and statistically significant
across different specifications and regressions with different sets
of control variables. Similarly, our two alternative indicators of
financial innovation – Financial R&D Intensity (Cost) and Off-
Balance Sheet Items/Total Assets – enter positively and significantly
(columns 3 and 4). 20 The level of financial innovation, on the other
hand, does not enter consistently across the different specifications
of Table 5 , which suggests that it is not financial innovation per se
that is associated with faster economic growth, but rather higher
levels of financial innovation in countries and periods with high
growth opportunities. Critically, the positive interaction of global
growth opportunities and financial innovation is significant con-
trolling for the interaction of growth opportunities with banking
sector and equity market development and financial liberalization,
none of which enters significantly. 21 The finding that it is finan-
cial innovation rather than financial depth that is associated with
higher rates of economic growth in our sample of high-income
countries is consistent with other evidence that shows a declining
effect of financial development on economic growth at higher lev-
20 Note that the insignificance of the interactions of growth opportunities with
Private Credit and financial liberalization might be driven by the limitation of the
sample to high-income countries. 21 To compute these economic effects, we add up the level and the interaction
effects of financial innovation.
d
K
t
d
ls of income per capita or even an insignificant effect ( Rioja and
alev, 2004; Aghion et al., 2005; Arcand et al., 2015 ).
The effect is not only statistically, but also economically signif-
cant. At the mean of financial innovation (0.40%), a move from a
ountry and period with growth opportunities at the mean of 0.08
o a country and period with growth opportunities of one standard
eviation above the mean (0.42) predicts an increase in annual real
er capita GDP growth by 0.9 percentage points. The same increase
n growth opportunities in a country with financial innovation one
tandard deviation above the mean, on the other hand, will lead
o an increase of real per capita GDP growth by 1.2 percentage
oints. 22 Given that the mean annual growth rate in our sample is
.2%, this difference of 0.3 percentage points is economically mean-
ngful. In summary, the evidence presented in Table 5 is consistent
ith the innovation-growth hypothesis.
.3. Does financial innovation help industries with higher growth
pportunities?
In additionto cross-country estimations, we follow work by
ajan and Zingales (1998) and Fisman and Love (2007) to test the
ffect of financial innovation on the growth of industries with dif-
erent growth opportunities. Rajan and Zingales (1998) show that
ndustries that are naturally heavy users of external finance ben-
fit disproportionately more from financial development than in-
ustries that are not naturally heavy users of external finance,
hile Fisman and Love (20 04, 20 07 ) use the same methodology
o show that industries with higher growth opportunities grow
aster in countries with higher levels of financial development. The
ethodology has been widely used in the recent literature to ex-
lore the differential impact of financial development or specific
nancial sector characteristics on the differential growth of in-
ustries of different characteristics. 23 Specifically, we estimate the
22 See, e.g., Cetorelli and Gambera (2001) , Beck and Levine (2002) , Raddatz (2006) ,
roszner et al. (2007) . 23 This indicator is from the Barth et al. (20 01, 20 06 , 20 08 ) database and measures
he regulatory requirements to obtain a banking license. See Appendix Table A1 for
etails.
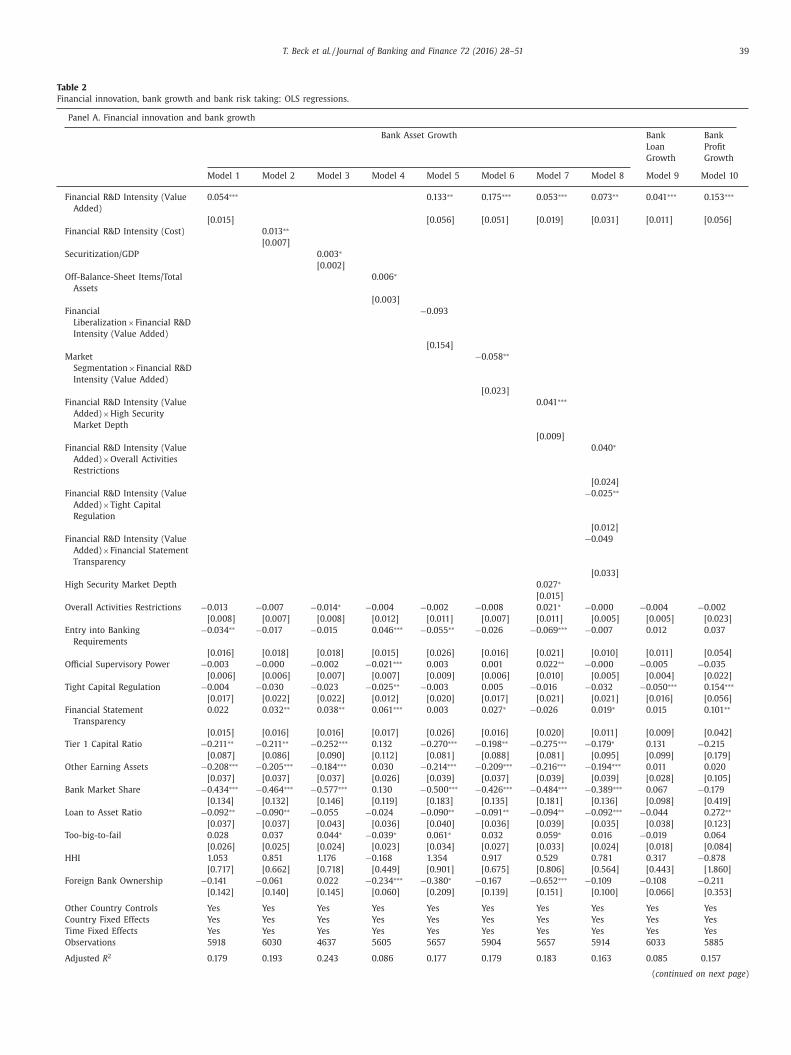
T. Beck et al. / Journal of Banking and Finance 72 (2016) 28–51 39
Table 2
Financial innovation, bank growth and bank risk taking: OLS regressions.
Panel A. Financial innovation and bank growth
Bank Asset Growth Bank
Loan
Growth
Bank
Profit
Growth
Model 1 Model 2 Model 3 Model 4 Model 5 Model 6 Model 7 Model 8 Model 9 Model 10
Financial R&D Intensity (Value
Added)
0.054 ∗∗∗ 0.133 ∗∗ 0.175 ∗∗∗ 0.053 ∗∗∗ 0.073 ∗∗ 0.041 ∗∗∗ 0.153 ∗∗∗
[0.015] [0.056] [0.051] [0.019] [0.031] [0.011] [0.056]
Financial R&D Intensity (Cost) 0.013 ∗∗
[0.007]
Securitization/GDP 0.003 ∗
[0.002]
Off-Balance-Sheet Items/Total
Assets
0.006 ∗
[0.003]
Financial
Liberalization ×Financial R&D
Intensity (Value Added)
−0.093
[0.154]
Market
Segmentation ×Financial R&D
Intensity (Value Added)
−0.058 ∗∗
[0.023]
Financial R&D Intensity (Value
Added) ×High Security
Market Depth
0.041 ∗∗∗
[0.009]
Financial R&D Intensity (Value
Added) ×Overall Activities
Restrictions
0.040 ∗
[0.024]
Financial R&D Intensity (Value
Added) ×Tight Capital
Regulation
−0.025 ∗∗
[0.012]
Financial R&D Intensity (Value
Added) ×Financial Statement
Transparency
−0.049
[0.033]
High Security Market Depth 0.027 ∗
[0.015]
Overall Activities Restrictions −0.013 −0.007 −0.014 ∗ −0.004 −0.002 −0.008 0.021 ∗ −0.0 0 0 −0.004 −0.002
[0.008] [0.007] [0.008] [0.012] [0.011] [0.007] [0.011] [0.005] [0.005] [0.023]
Entry into Banking
Requirements
−0.034 ∗∗ −0.017 −0.015 0.046 ∗∗∗ −0.055 ∗∗ −0.026 −0.069 ∗∗∗ −0.007 0.012 0.037
[0.016] [0.018] [0.018] [0.015] [0.026] [0.016] [0.021] [0.010] [0.011] [0.054]
Official Supervisory Power −0.003 −0.0 0 0 −0.002 −0.021 ∗∗∗ 0.003 0.001 0.022 ∗∗ −0.0 0 0 −0.005 −0.035
[0.006] [0.006] [0.007] [0.007] [0.009] [0.006] [0.010] [0.005] [0.004] [0.022]
Tight Capital Regulation −0.004 −0.030 −0.023 −0.025 ∗∗ −0.003 0.005 −0.016 −0.032 −0.050 ∗∗∗ 0.154 ∗∗∗
[0.017] [0.022] [0.022] [0.012] [0.020] [0.017] [0.021] [0.021] [0.016] [0.056]
Financial Statement
Transparency
0.022 0.032 ∗∗ 0.038 ∗∗ 0.061 ∗∗∗ 0.003 0.027 ∗ −0.026 0.019 ∗ 0.015 0.101 ∗∗
[0.015] [0.016] [0.016] [0.017] [0.026] [0.016] [0.020] [0.011] [0.009] [0.042]
Tier 1 Capital Ratio −0.211 ∗∗ −0.211 ∗∗ −0.252 ∗∗∗ 0.132 −0.270 ∗∗∗ −0.198 ∗∗ −0.275 ∗∗∗ −0.179 ∗ 0.131 −0.215
[0.087] [0.086] [0.090] [0.112] [0.081] [0.088] [0.081] [0.095] [0.099] [0.179]
Other Earning Assets −0.208 ∗∗∗ −0.205 ∗∗∗ −0.184 ∗∗∗ 0.030 −0.214 ∗∗∗ −0.209 ∗∗∗ −0.216 ∗∗∗ −0.194 ∗∗∗ 0.011 0.020
[0.037] [0.037] [0.037] [0.026] [0.039] [0.037] [0.039] [0.039] [0.028] [0.105]
Bank Market Share −0.434 ∗∗∗ −0.464 ∗∗∗ −0.577 ∗∗∗ 0.130 −0.500 ∗∗∗ −0.426 ∗∗∗ −0.484 ∗∗∗ −0.389 ∗∗∗ 0.067 −0.179
[0.134] [0.132] [0.146] [0.119] [0.183] [0.135] [0.181] [0.136] [0.098] [0.419]
Loan to Asset Ratio −0.092 ∗∗ −0.090 ∗∗ −0.055 −0.024 −0.090 ∗∗ −0.091 ∗∗ −0.094 ∗∗ −0.092 ∗∗∗ −0.044 0.272 ∗∗
[0.037] [0.037] [0.043] [0.036] [0.040] [0.036] [0.039] [0.035] [0.038] [0.123]
Too-big-to-fail 0.028 0.037 0.044 ∗ −0.039 ∗ 0.061 ∗ 0.032 0.059 ∗ 0.016 −0.019 0.064
[0.026] [0.025] [0.024] [0.023] [0.034] [0.027] [0.033] [0.024] [0.018] [0.084]
HHI 1.053 0.851 1.176 −0.168 1.354 0.917 0.529 0.781 0.317 −0.878
[0.717] [0.662] [0.718] [0.449] [0.901] [0.675] [0.806] [0.564] [0.443] [1.860]
Foreign Bank Ownership −0.141 −0.061 0.022 −0.234 ∗∗∗ −0.380 ∗ −0.167 −0.652 ∗∗∗ −0.109 −0.108 −0.211
[0.142] [0.140] [0.145] [0.060] [0.209] [0.139] [0.151] [0.100] [0.066] [0.353]
Other Country Controls Yes Yes Yes Yes Yes Yes Yes Yes Yes Yes
Country Fixed Effects Yes Yes Yes Yes Yes Yes Yes Yes Yes Yes
Time Fixed Effects Yes Yes Yes Yes Yes Yes Yes Yes Yes Yes
Observations 5918 6030 4637 5605 5657 5904 5657 5914 6033 5885
Adjusted R 2 0.179 0.193 0.243 0.086 0.177 0.179 0.183 0.163 0.085 0.157
( continued on next page )
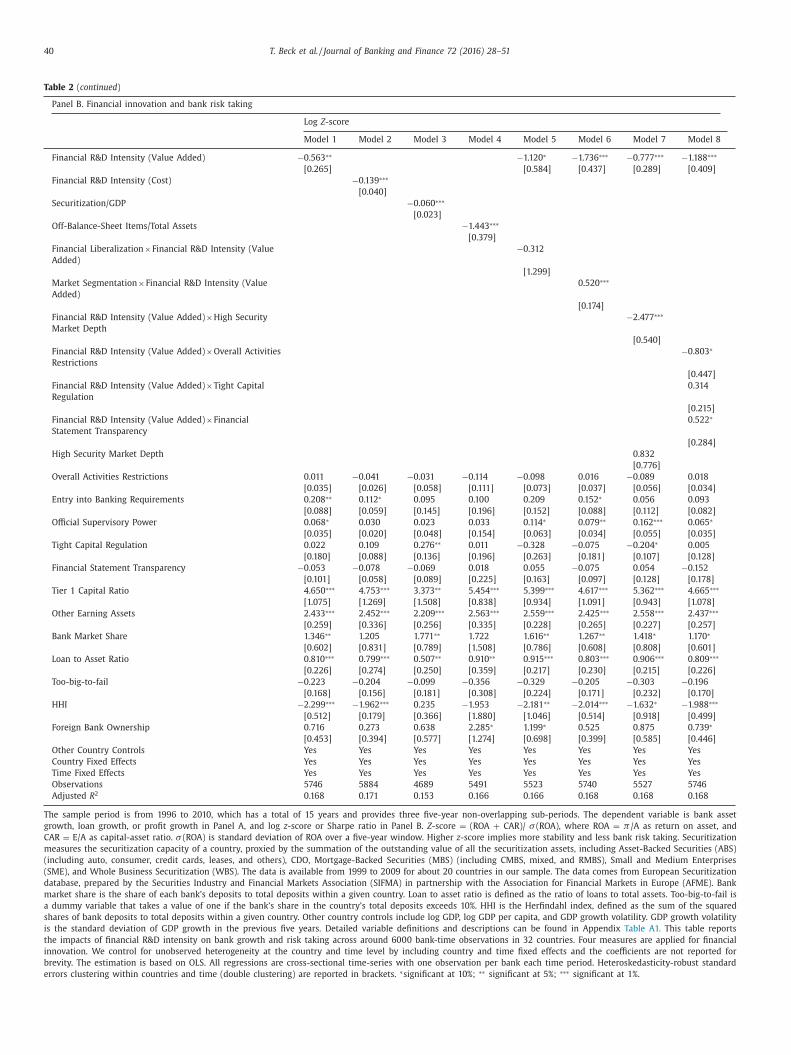
40 T. Beck et al. / Journal of Banking and Finance 72 (2016) 28–51
Table 2 ( continued )
Panel B. Financial innovation and bank risk taking
Log Z -score
Model 1 Model 2 Model 3 Model 4 Model 5 Model 6 Model 7 Model 8
Financial R&D Intensity (Value Added) −0.563 ∗∗ −1.120 ∗ −1.736 ∗∗∗ −0.777 ∗∗∗ −1.188 ∗∗∗
[0.265] [0.584] [0.437] [0.289] [0.409]
Financial R&D Intensity (Cost) −0.139 ∗∗∗
[0.040]
Securitization/GDP −0.060 ∗∗∗
[0.023]
Off-Balance-Sheet Items/Total Assets −1.443 ∗∗∗
[0.379]
Financial Liberalization ×Financial R&D Intensity (Value
Added)
−0.312
[1.299]
Market Segmentation ×Financial R&D Intensity (Value
Added)
0.520 ∗∗∗
[0.174]
Financial R&D Intensity (Value Added) ×High Security
Market Depth
−2.477 ∗∗∗
[0.540]
Financial R&D Intensity (Value Added) ×Overall Activities
Restrictions
−0.803 ∗
[0.447]
Financial R&D Intensity (Value Added) ×Tight Capital
Regulation
0.314
[0.215]
Financial R&D Intensity (Value Added) ×Financial
Statement Transparency
0.522 ∗
[0.284]
High Security Market Depth 0.832
[0.776]
Overall Activities Restrictions 0.011 −0.041 −0.031 −0.114 −0.098 0.016 −0.089 0.018
[0.035] [0.026] [0.058] [0.111] [0.073] [0.037] [0.056] [0.034]
Entry into Banking Requirements 0.208 ∗∗ 0.112 ∗ 0.095 0.100 0.209 0.152 ∗ 0.056 0.093
[0.088] [0.059] [0.145] [0.196] [0.152] [0.088] [0.112] [0.082]
Official Supervisory Power 0.068 ∗ 0.030 0.023 0.033 0.114 ∗ 0.079 ∗∗ 0.162 ∗∗∗ 0.065 ∗
[0.035] [0.020] [0.048] [0.154] [0.063] [0.034] [0.055] [0.035]
Tight Capital Regulation 0.022 0.109 0.276 ∗∗ 0.011 −0.328 −0.075 −0.204 ∗ 0.005
[0.180] [0.088] [0.136] [0.196] [0.263] [0.181] [0.107] [0.128]
Financial Statement Transparency −0.053 −0.078 −0.069 0.018 0.055 −0.075 0.054 −0.152
[0.101] [0.058] [0.089] [0.225] [0.163] [0.097] [0.128] [0.178]
Tier 1 Capital Ratio 4.650 ∗∗∗ 4.753 ∗∗∗ 3.373 ∗∗ 5.454 ∗∗∗ 5.399 ∗∗∗ 4.617 ∗∗∗ 5.362 ∗∗∗ 4.665 ∗∗∗
[1.075] [1.269] [1.508] [0.838] [0.934] [1.091] [0.943] [1.078]
Other Earning Assets 2.433 ∗∗∗ 2.452 ∗∗∗ 2.209 ∗∗∗ 2.563 ∗∗∗ 2.559 ∗∗∗ 2.425 ∗∗∗ 2.558 ∗∗∗ 2.437 ∗∗∗
[0.259] [0.336] [0.256] [0.335] [0.228] [0.265] [0.227] [0.257]
Bank Market Share 1.346 ∗∗ 1.205 1.771 ∗∗ 1.722 1.616 ∗∗ 1.267 ∗∗ 1.418 ∗ 1.170 ∗
[0.602] [0.831] [0.789] [1.508] [0.786] [0.608] [0.808] [0.601]
Loan to Asset Ratio 0.810 ∗∗∗ 0.799 ∗∗∗ 0.507 ∗∗ 0.910 ∗∗ 0.915 ∗∗∗ 0.803 ∗∗∗ 0.906 ∗∗∗ 0.809 ∗∗∗
[0.226] [0.274] [0.250] [0.359] [0.217] [0.230] [0.215] [0.226]
Too-big-to-fail −0.223 −0.204 −0.099 −0.356 −0.329 −0.205 −0.303 −0.196
[0.168] [0.156] [0.181] [0.308] [0.224] [0.171] [0.232] [0.170]
HHI −2.299 ∗∗∗ −1.962 ∗∗∗ 0.235 −1.953 −2.181 ∗∗ −2.014 ∗∗∗ −1.632 ∗ −1.988 ∗∗∗
[0.512] [0.179] [0.366] [1.880] [1.046] [0.514] [0.918] [0.499]
Foreign Bank Ownership 0.716 0.273 0.638 2.285 ∗ 1.199 ∗ 0.525 0.875 0.739 ∗
[0.453] [0.394] [0.577] [1.274] [0.698] [0.399] [0.585] [0.446]
Other Country Controls Yes Yes Yes Yes Yes Yes Yes Yes
Country Fixed Effects Yes Yes Yes Yes Yes Yes Yes Yes
Time Fixed Effects Yes Yes Yes Yes Yes Yes Yes Yes
Observations 5746 5884 4689 5491 5523 5740 5527 5746
Adjusted R 2 0.168 0.171 0.153 0.166 0.166 0.168 0.168 0.168
The sample period is from 1996 to 2010, which has a total of 15 years and provides three five-year non-overlapping sub-periods. The dependent variable is bank asset
growth, loan growth, or profit growth in Panel A, and log z -score or Sharpe ratio in Panel B. Z -score = (ROA + CAR)/ σ (ROA), where ROA = π /A as return on asset, and
CAR = E/A as capital-asset ratio. σ (ROA) is standard deviation of ROA over a five-year window. Higher z -score implies more stability and less bank risk taking. Securitization
measures the securitization capacity of a country, proxied by the summation of the outstanding value of all the securitization assets, including Asset-Backed Securities (ABS)
(including auto, consumer, credit cards, leases, and others), CDO, Mortgage-Backed Securities (MBS) (including CMBS, mixed, and RMBS), Small and Medium Enterprises
(SME), and Whole Business Securitization (WBS). The data is available from 1999 to 2009 for about 20 countries in our sample. The data comes from European Securitization
database, prepared by the Securities Industry and Financial Markets Association (SIFMA) in partnership with the Association for Financial Markets in Europe (AFME). Bank
market share is the share of each bank’s deposits to total deposits within a given country. Loan to asset ratio is defined as the ratio of loans to total assets. Too-big-to-fail is
a dummy variable that takes a value of one if the bank’s share in the country’s total deposits exceeds 10%. HHI is the Herfindahl index, defined as the sum of the squared
shares of bank deposits to total deposits within a given country. Other country controls include log GDP, log GDP per capita, and GDP growth volatility. GDP growth volatility
is the standard deviation of GDP growth in the previous five years. Detailed variable definitions and descriptions can be found in Appendix Table A1. This table reports
the impacts of financial R&D intensity on bank growth and risk taking across around 60 0 0 bank-time observations in 32 countries. Four measures are applied for financial
innovation. We control for unobserved heterogeneity at the country and time level by including country and time fixed effects and the coefficients are not reported for
brevity. The estimation is based on OLS. All regressions are cross-sectional time-series with one observation per bank each time period. Heteroskedasticity-robust standard
errors clustering within countries and time (double clustering) are reported in brackets. ∗significant at 10%; ∗∗ significant at 5%; ∗∗∗ significant at 1%.
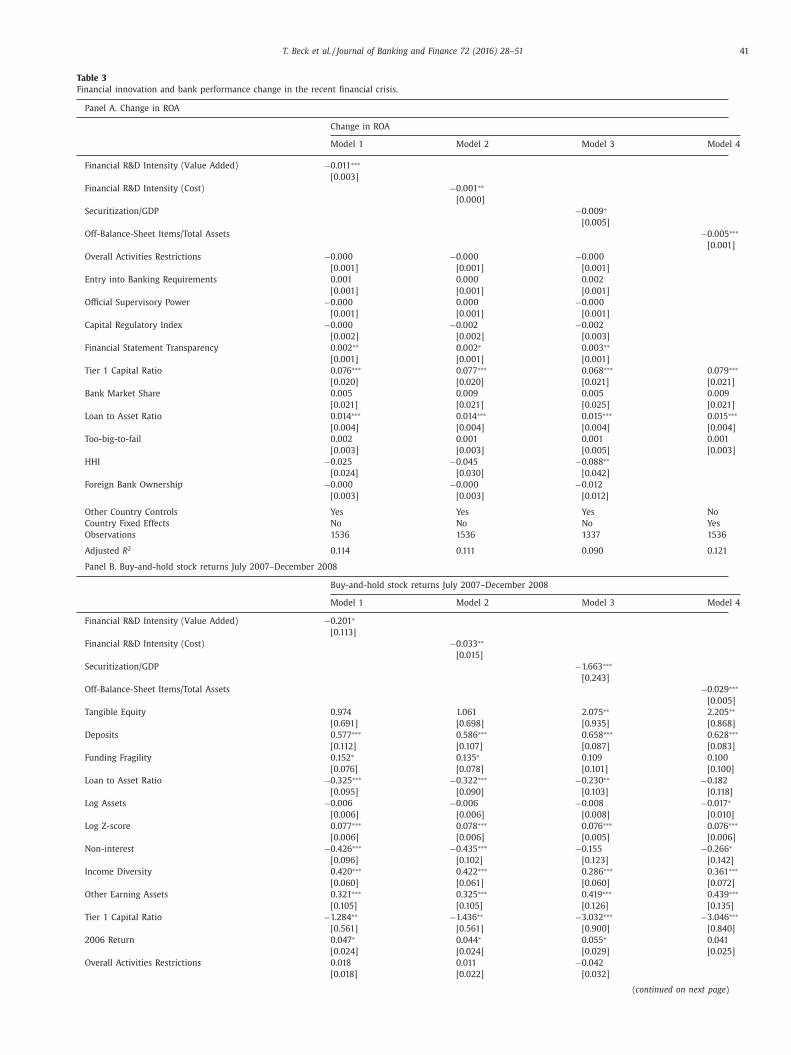
T. Beck et al. / Journal of Banking and Finance 72 (2016) 28–51 41
Table 3
Financial innovation and bank performance change in the recent financial crisis.
Panel A. Change in ROA
Change in ROA
Model 1 Model 2 Model 3 Model 4
Financial R&D Intensity (Value Added) −0.011 ∗∗∗
[0.003]
Financial R&D Intensity (Cost) −0.001 ∗∗
[0.0 0 0]
Securitization/GDP −0.009 ∗
[0.005]
Off-Balance-Sheet Items/Total Assets −0.005 ∗∗∗
[0.001]
Overall Activities Restrictions −0.0 0 0 −0.0 0 0 −0.0 0 0
[0.001] [0.001] [0.001]
Entry into Banking Requirements 0.001 0.0 0 0 0.002
[0.001] [0.001] [0.001]
Official Supervisory Power −0.0 0 0 0.0 0 0 −0.0 0 0
[0.001] [0.001] [0.001]
Capital Regulatory Index −0.0 0 0 −0.002 −0.002
[0.002] [0.002] [0.003]
Financial Statement Transparency 0.002 ∗∗ 0.002 ∗ 0.003 ∗∗
[0.001] [0.001] [0.001]
Tier 1 Capital Ratio 0.076 ∗∗∗ 0.077 ∗∗∗ 0.068 ∗∗∗ 0.079 ∗∗∗
[0.020] [0.020] [0.021] [0.021]
Bank Market Share 0.005 0.009 0.005 0.009
[0.021] [0.021] [0.025] [0.021]
Loan to Asset Ratio 0.014 ∗∗∗ 0.014 ∗∗∗ 0.015 ∗∗∗ 0.015 ∗∗∗
[0.004] [0.004] [0.004] [0.004]
Too-big-to-fail 0.002 0.001 0.001 0.001
[0.003] [0.003] [0.005] [0.003]
HHI −0.025 −0.045 −0.088 ∗∗
[0.024] [0.030] [0.042]
Foreign Bank Ownership −0.0 0 0 −0.0 0 0 −0.012
[0.003] [0.003] [0.012]
Other Country Controls Yes Yes Yes No
Country Fixed Effects No No No Yes
Observations 1536 1536 1337 1536
Adjusted R 2 0.114 0.111 0.090 0.121
Panel B. Buy-and-hold stock returns July 2007–December 2008
Buy-and-hold stock returns July 20 07–December 20 08
Model 1 Model 2 Model 3 Model 4
Financial R&D Intensity (Value Added) −0.201 ∗
[0.113]
Financial R&D Intensity (Cost) −0.033 ∗∗
[0.015]
Securitization/GDP −1.663 ∗∗∗
[0.243]
Off-Balance-Sheet Items/Total Assets −0.029 ∗∗∗
[0.005]
Tangible Equity 0.974 1.061 2.075 ∗∗ 2.205 ∗∗
[0.691] [0.698] [0.935] [0.868]
Deposits 0.577 ∗∗∗ 0.586 ∗∗∗ 0.658 ∗∗∗ 0.628 ∗∗∗
[0.112] [0.107] [0.087] [0.083]
Funding Fragility 0.152 ∗ 0.135 ∗ 0.109 0.100
[0.076] [0.078] [0.101] [0.100]
Loan to Asset Ratio −0.325 ∗∗∗ −0.322 ∗∗∗ −0.230 ∗∗ −0.182
[0.095] [0.090] [0.103] [0.118]
Log Assets −0.006 −0.006 −0.008 −0.017 ∗
[0.006] [0.006] [0.008] [0.010]
Log Z-score 0.077 ∗∗∗ 0.078 ∗∗∗ 0.076 ∗∗∗ 0.076 ∗∗∗
[0.006] [0.006] [0.005] [0.006]
Non-interest −0.426 ∗∗∗ −0.435 ∗∗∗ −0.155 −0.266 ∗
[0.096] [0.102] [0.123] [0.142]
Income Diversity 0.420 ∗∗∗ 0.422 ∗∗∗ 0.286 ∗∗∗ 0.361 ∗∗∗
[0.060] [0.061] [0.060] [0.072]
Other Earning Assets 0.321 ∗∗∗ 0.325 ∗∗∗ 0.419 ∗∗∗ 0.439 ∗∗∗
[0.105] [0.105] [0.126] [0.135]
Tier 1 Capital Ratio −1.284 ∗∗ −1.436 ∗∗ −3.032 ∗∗∗ −3.046 ∗∗∗
[0.561] [0.561] [0.900] [0.840]
2006 Return 0.047 ∗ 0.044 ∗ 0.055 ∗ 0.041
[0.024] [0.024] [0.029] [0.025]
Overall Activities Restrictions 0.018 0.011 −0.042
[0.018] [0.022] [0.032]
( continued on next page )
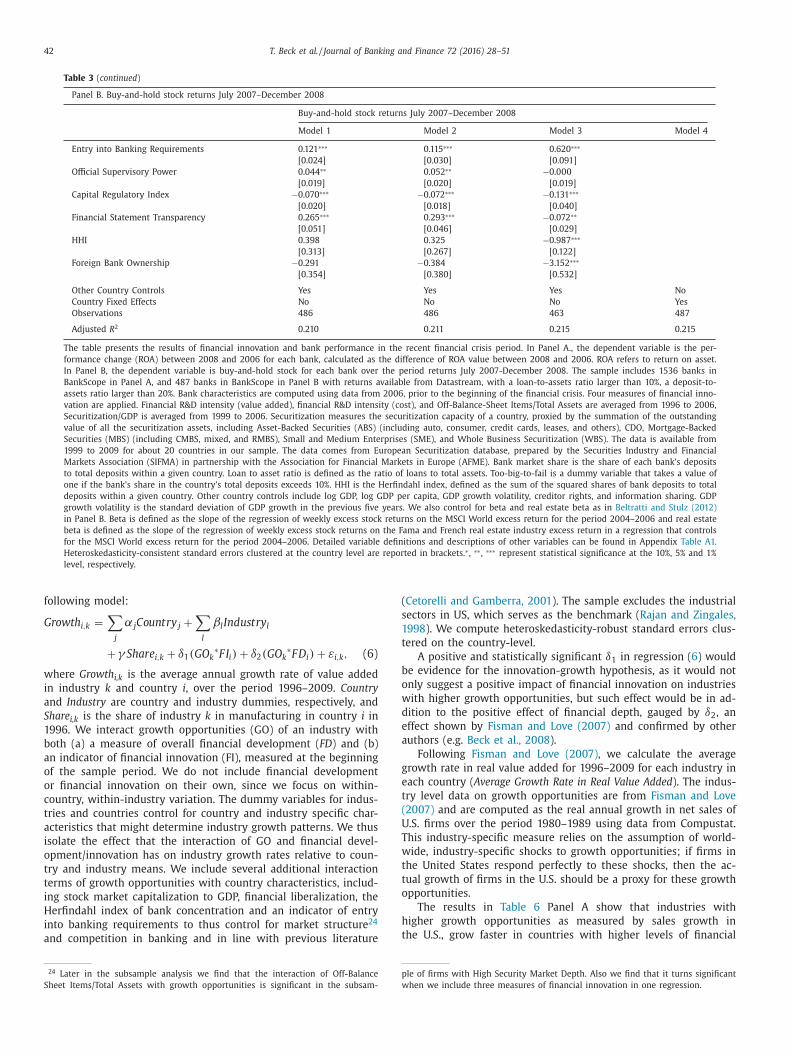
42 T. Beck et al. / Journal of Banking and Finance 72 (2016) 28–51
Table 3 ( continued )
Panel B. Buy-and-hold stock returns July 2007–December 2008
Buy-and-hold stock returns July 20 07–December 20 08
Model 1 Model 2 Model 3 Model 4
Entry into Banking Requirements 0.121 ∗∗∗ 0.115 ∗∗∗ 0.620 ∗∗∗
[0.024] [0.030] [0.091]
Official Supervisory Power 0.044 ∗∗ 0.052 ∗∗ −0.0 0 0
[0.019] [0.020] [0.019]
Capital Regulatory Index −0.070 ∗∗∗ −0.072 ∗∗∗ −0.131 ∗∗∗
[0.020] [0.018] [0.040]
Financial Statement Transparency 0.265 ∗∗∗ 0.293 ∗∗∗ −0.072 ∗∗
[0.051] [0.046] [0.029]
HHI 0.398 0.325 −0.987 ∗∗∗
[0.313] [0.267] [0.122]
Foreign Bank Ownership −0.291 −0.384 −3.152 ∗∗∗
[0.354] [0.380] [0.532]
Other Country Controls Yes Yes Yes No
Country Fixed Effects No No No Yes
Observations 486 486 463 487
Adjusted R 2 0.210 0.211 0.215 0.215
The table presents the results of financial innovation and bank performance in the recent financial crisis period. In Panel A., the dependent variable is the per-
formance change (ROA) between 2008 and 2006 for each bank, calculated as the difference of ROA value between 2008 and 2006. ROA refers to return on asset.
In Panel B, the dependent variable is buy-and-hold stock for each bank over the period returns July 2007-December 2008. The sample includes 1536 banks in
BankScope in Panel A, and 487 banks in BankScope in Panel B with returns available from Datastream, with a loan-to-assets ratio larger than 10%, a deposit-to-
assets ratio larger than 20%. Bank characteristics are computed using data from 2006, prior to the beginning of the financial crisis. Four measures of financial inno-
vation are applied. Financial R&D intensity (value added), financial R&D intensity (cost), and Off-Balance-Sheet Items/Total Assets are averaged from 1996 to 2006,
Securitization/GDP is averaged from 1999 to 2006. Securitization measures the securitization capacity of a country, proxied by the summation of the outstanding
value of all the securitization assets, including Asset-Backed Securities (ABS) (including auto, consumer, credit cards, leases, and others), CDO, Mortgage-Backed
Securities (MBS) (including CMBS, mixed, and RMBS), Small and Medium Enterprises (SME), and Whole Business Securitization (WBS). The data is available from
1999 to 2009 for about 20 countries in our sample. The data comes from European Securitization database, prepared by the Securities Industry and Financial
Markets Association (SIFMA) in partnership with the Association for Financial Markets in Europe (AFME). Bank market share is the share of each bank’s deposits
to total deposits within a given country. Loan to asset ratio is defined as the ratio of loans to total assets. Too-big-to-fail is a dummy variable that takes a value of
one if the bank’s share in the country’s total deposits exceeds 10%. HHI is the Herfindahl index, defined as the sum of the squared shares of bank deposits to total
deposits within a given country. Other country controls include log GDP, log GDP per capita, GDP growth volatility, creditor rights, and information sharing. GDP
growth volatility is the standard deviation of GDP growth in the previous five years. We also control for beta and real estate beta as in Beltratti and Stulz (2012)
in Panel B. Beta is defined as the slope of the regression of weekly excess stock returns on the MSCI World excess return for the period 20 04–20 06 and real estate
beta is defined as the slope of the regression of weekly excess stock returns on the Fama and French real estate industry excess return in a regression that controls
for the MSCI World excess return for the period 20 04–20 06. Detailed variable definitions and descriptions of other variables can be found in Appendix Table A1.
Heteroskedasticity-consistent standard errors clustered at the country level are reported in brackets. ∗ , ∗∗ , ∗∗∗ represent statistical significance at the 10%, 5% and 1%
level, respectively.
(
s
1
t
b
o
w
d
e
a
g
e
t
(
U
T
w
t
t
o
h
t
following model:
Growth i,k =
∑
j
α j Count r y j +
∑
l
βl Indust r y l
+ γ Shar e i,k + δ1 (G O k ∗F I i ) + δ2 (G O k
∗F D i ) + ε i,k , (6)
where Growth i,k is the average annual growth rate of value added
in industry k and country i , over the period 1996–2009. Country
and Industry are country and industry dummies, respectively, and
Share i,k is the share of industry k in manufacturing in country i in
1996. We interact growth opportunities (GO) of an industry with
both (a) a measure of overall financial development ( FD ) and (b)
an indicator of financial innovation (FI), measured at the beginning
of the sample period. We do not include financial development
or financial innovation on their own, since we focus on within-
country, within-industry variation. The dummy variables for indus-
tries and countries control for country and industry specific char-
acteristics that might determine industry growth patterns. We thus
isolate the effect that the interaction of GO and financial devel-
opment/innovation has on industry growth rates relative to coun-
try and industry means. We include several additional interaction
terms of growth opportunities with country characteristics, includ-
ing stock market capitalization to GDP, financial liberalization, the
Herfindahl index of bank concentration and an indicator of entry
into banking requirements to thus control for market structure 24
and competition in banking and in line with previous literature
24 Later in the subsample analysis we find that the interaction of Off-Balance
Sheet Items/Total Assets with growth opportunities is significant in the subsam-
p
w
Cetorelli and Gamberra, 2001 ). The sample excludes the industrial
ectors in US, which serves as the benchmark ( Rajan and Zingales,
998 ). We compute heteroskedasticity-robust standard errors clus-
ered on the country-level.
A positive and statistically significant δ1 in regression ( 6 ) would
e evidence for the innovation-growth hypothesis, as it would not
nly suggest a positive impact of financial innovation on industries
ith higher growth opportunities, but such effect would be in ad-
ition to the positive effect of financial depth, gauged by δ2 , an
ffect shown by Fisman and Love (2007) and confirmed by other
uthors (e.g. Beck et al., 2008 ).
Following Fisman and Love (2007) , we calculate the average
rowth rate in real value added for 1996–2009 for each industry in
ach country ( Average Growth Rate in Real Value Added ). The indus-
ry level data on growth opportunities are from Fisman and Love
2007) and are computed as the real annual growth in net sales of
.S. firms over the period 1980–1989 using data from Compustat.
his industry-specific measure relies on the assumption of world-
ide, industry-specific shocks to growth opportunities; if firms in
he United States respond perfectly to these shocks, then the ac-
ual growth of firms in the U.S. should be a proxy for these growth
pportunities.
The results in Table 6 Panel A show that industries with
igher growth opportunities as measured by sales growth in
he U.S., grow faster in countries with higher levels of financial
le of firms with High Security Market Depth. Also we find that it turns significant
hen we include three measures of financial innovation in one regression.
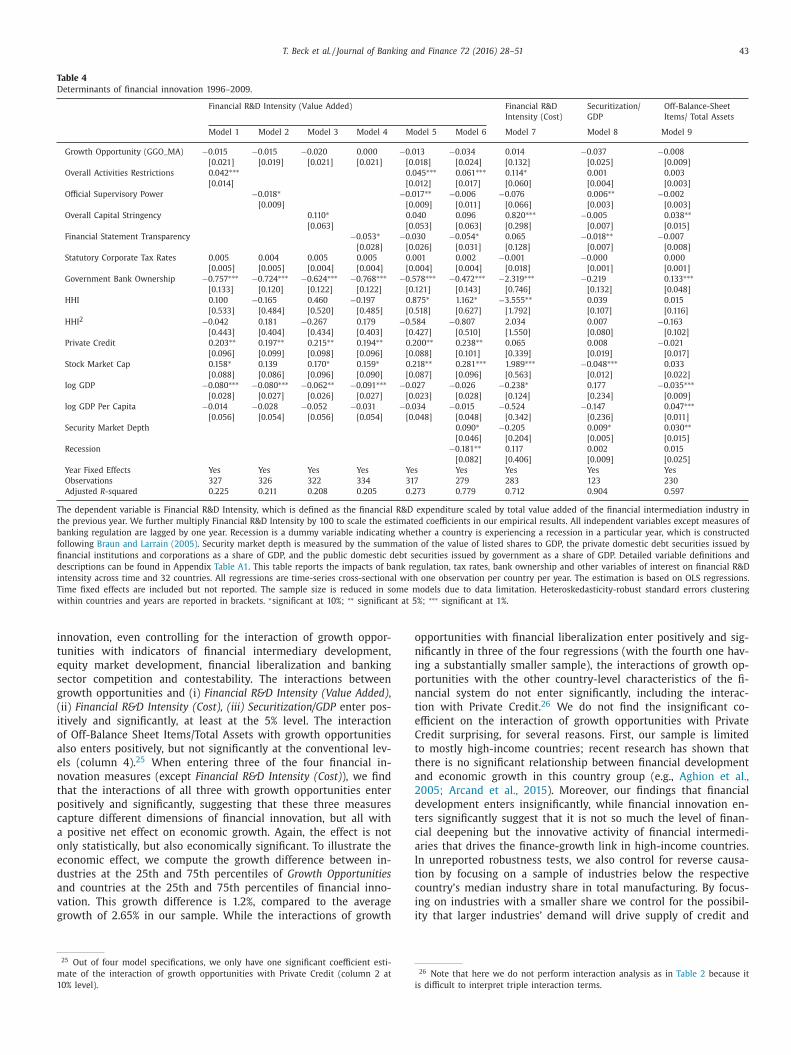
T. Beck et al. / Journal of Banking and Finance 72 (2016) 28–51 43
Table 4
Determinants of financial innovation 1996–2009.
Financial R&D Intensity (Value Added) Financial R&D
Intensity (Cost)
Securitization/
GDP
Off-Balance-Sheet
Items/ Total Assets
Model 1 Model 2 Model 3 Model 4 Model 5 Model 6 Model 7 Model 8 Model 9
Growth Opportunity (GGO_MA) −0.015 −0.015 −0.020 0.0 0 0 −0.013 −0.034 0.014 −0.037 −0.008
[0.021] [0.019] [0.021] [0.021] [0.018] [0.024] [0.132] [0.025] [0.009]
Overall Activities Restrictions 0.042 ∗∗∗ 0.045 ∗∗∗ 0.061 ∗∗∗ 0.114 ∗ 0.001 0.003
[0.014] [0.012] [0.017] [0.060] [0.004] [0.003]
Official Supervisory Power −0.018 ∗ −0.017 ∗∗ −0.006 −0.076 0.006 ∗∗ −0.002
[0.009] [0.009] [0.011] [0.066] [0.003] [0.003]
Overall Capital Stringency 0.110 ∗ 0.040 0.096 0.820 ∗∗∗ −0.005 0.038 ∗∗[0.063] [0.053] [0.063] [0.298] [0.007] [0.015]
Financial Statement Transparency −0.053 ∗ −0.030 −0.054 ∗ 0.065 −0.018 ∗∗ −0.007
[0.028] [0.026] [0.031] [0.128] [0.007] [0.008]
Statutory Corporate Tax Rates 0.005 0.004 0.005 0.005 0.001 0.002 −0.001 −0.0 0 0 0.0 0 0
[0.005] [0.005] [0.004] [0.004] [0.004] [0.004] [0.018] [0.001] [0.001]
Government Bank Ownership −0.757 ∗∗∗ −0.724 ∗∗∗ −0.624 ∗∗∗ −0.768 ∗∗∗ −0.578 ∗∗∗ −0.472 ∗∗∗ −2.319 ∗∗∗ −0.219 0.133 ∗∗∗[0.133] [0.120] [0.122] [0.122] [0.121] [0.143] [0.746] [0.132] [0.048]
HHI 0.100 −0.165 0.460 −0.197 0.875 ∗ 1.162 ∗ −3.555 ∗∗ 0.039 0.015
[0.533] [0.484] [0.520] [0.485] [0.518] [0.627] [1.792] [0.107] [0.116]
HHI 2 −0.042 0.181 −0.267 0.179 −0.584 −0.807 2.034 0.007 −0.163
[0.443] [0.404] [0.434] [0.403] [0.427] [0.510] [1.550] [0.080] [0.102]
Private Credit 0.203 ∗∗ 0.197 ∗∗ 0.215 ∗∗ 0.194 ∗∗ 0.200 ∗∗ 0.238 ∗∗ 0.065 0.008 −0.021
[0.096] [0.099] [0.098] [0.096] [0.088] [0.101] [0.339] [0.019] [0.017]
Stock Market Cap 0.158 ∗ 0.139 0.170 ∗ 0.159 ∗ 0.218 ∗∗ 0.281 ∗∗∗ 1.989 ∗∗∗ −0.048 ∗∗∗ 0.033
[0.088] [0.086] [0.096] [0.090] [0.087] [0.096] [0.563] [0.012] [0.022]
log GDP −0.080 ∗∗∗ −0.080 ∗∗∗ −0.062 ∗∗ −0.091 ∗∗∗ −0.027 −0.026 −0.238 ∗ 0.177 −0.035 ∗∗∗[0.028] [0.027] [0.026] [0.027] [0.023] [0.028] [0.124] [0.234] [0.009]
log GDP Per Capita −0.014 −0.028 −0.052 −0.031 −0.034 −0.015 −0.524 −0.147 0.047 ∗∗∗[0.056] [0.054] [0.056] [0.054] [0.048] [0.048] [0.342] [0.236] [0.011]
Security Market Depth 0.090 ∗ −0.205 0.009 ∗ 0.030 ∗∗[0.046] [0.204] [0.005] [0.015]
Recession −0.181 ∗∗ 0.117 0.002 0.015
[0.082] [0.406] [0.009] [0.025]
Year Fixed Effects Yes Yes Yes Yes Yes Yes Yes Yes Yes
Observations 327 326 322 334 317 279 283 123 230
Adjusted R -squared 0.225 0.211 0.208 0.205 0.273 0.779 0.712 0.904 0.597
The dependent variable is Financial R&D Intensity, which is defined as the financial R&D expenditure scaled by total value added of the financial intermediation industry in
the previous year. We further multiply Financial R&D Intensity by 100 to scale the estimated coefficients in our empirical results. All independent variables except measures of
banking regulation are lagged by one year. Recession is a dummy variable indicating whether a country is experiencing a recession in a particular year, which is constructed
following Braun and Larrain (2005) . Security market depth is measured by the summation of the value of listed shares to GDP, the private domestic debt securities issued by
financial institutions and corporations as a share of GDP, and the public domestic debt securities issued by government as a share of GDP. Detailed variable definitions and
descriptions can be found in Appendix Table A1 . This table reports the impacts of bank regulation, tax rates, bank ownership and other variables of interest on financial R&D
intensity across time and 32 countries. All regressions are time-series cross-sectional with one observation per country per year. The estimation is based on OLS regressions.
Time fixed effects are included but not reported. The sample size is reduced in some models due to data limitation. Heteroskedasticity-robust standard errors clustering
within countries and years are reported in brackets. ∗significant at 10%; ∗∗ significant at 5%; ∗∗∗ significant at 1%.
i
t
e
s
g
(
i
o
a
e
n
t
p
c
a
o
e
d
a
v
g
m
1
o
n
i
p
n
t
e
C
t
t
a
2
d
t
c
a
I
t
c
i
i
nnovation, even controlling for the interaction of growth oppor-
unities with indicators of financial intermediary development,
quity market development, financial liberalization and banking
ector competition and contestability. The interactions between
rowth opportunities and (i) Financial R&D Intensity (Value Added) ,
ii) Financial R&D Intensity (Cost), (iii) Securitization/GDP enter pos-
tively and significantly, at least at the 5% level. The interaction
f Off-Balance Sheet Items/Total Assets with growth opportunities
lso enters positively, but not significantly at the conventional lev-
ls (column 4). 25 When entering three of the four financial in-
ovation measures (except Financial R&D Intensity (Cost) ), we find
hat the interactions of all three with growth opportunities enter
ositively and significantly, suggesting that these three measures
apture different dimensions of financial innovation, but all with
positive net effect on economic growth. Again, the effect is not
nly statistically, but also economically significant. To illustrate the
conomic effect, we compute the growth difference between in-
ustries at the 25th and 75th percentiles of Growth Opportunities
nd countries at the 25th and 75th percentiles of financial inno-
ation. This growth difference is 1.2%, compared to the average
rowth of 2.65% in our sample. While the interactions of growth
25 Out of four model specifications, we only have one significant coefficient esti-
ate of the interaction of growth opportunities with Private Credit (column 2 at
0% level). i
pportunities with financial liberalization enter positively and sig-
ificantly in three of the four regressions (with the fourth one hav-
ng a substantially smaller sample), the interactions of growth op-
ortunities with the other country-level characteristics of the fi-
ancial system do not enter significantly, including the interac-
ion with Private Credit. 26 We do not find the insignificant co-
fficient on the interaction of growth opportunities with Private
redit surprising, for several reasons. First, our sample is limited
o mostly high-income countries; recent research has shown that
here is no significant relationship between financial development
nd economic growth in this country group (e.g., Aghion et al.,
005; Arcand et al., 2015 ). Moreover, our findings that financial
evelopment enters insignificantly, while financial innovation en-
ers significantly suggest that it is not so much the level of finan-
ial deepening but the innovative activity of financial intermedi-
ries that drives the finance-growth link in high-income countries.
n unreported robustness tests, we also control for reverse causa-
ion by focusing on a sample of industries below the respective
ountry’s median industry share in total manufacturing. By focus-
ng on industries with a smaller share we control for the possibil-
ty that larger industries’ demand will drive supply of credit and
26 Note that here we do not perform interaction analysis as in Table 2 because it
s difficult to interpret triple interaction terms.
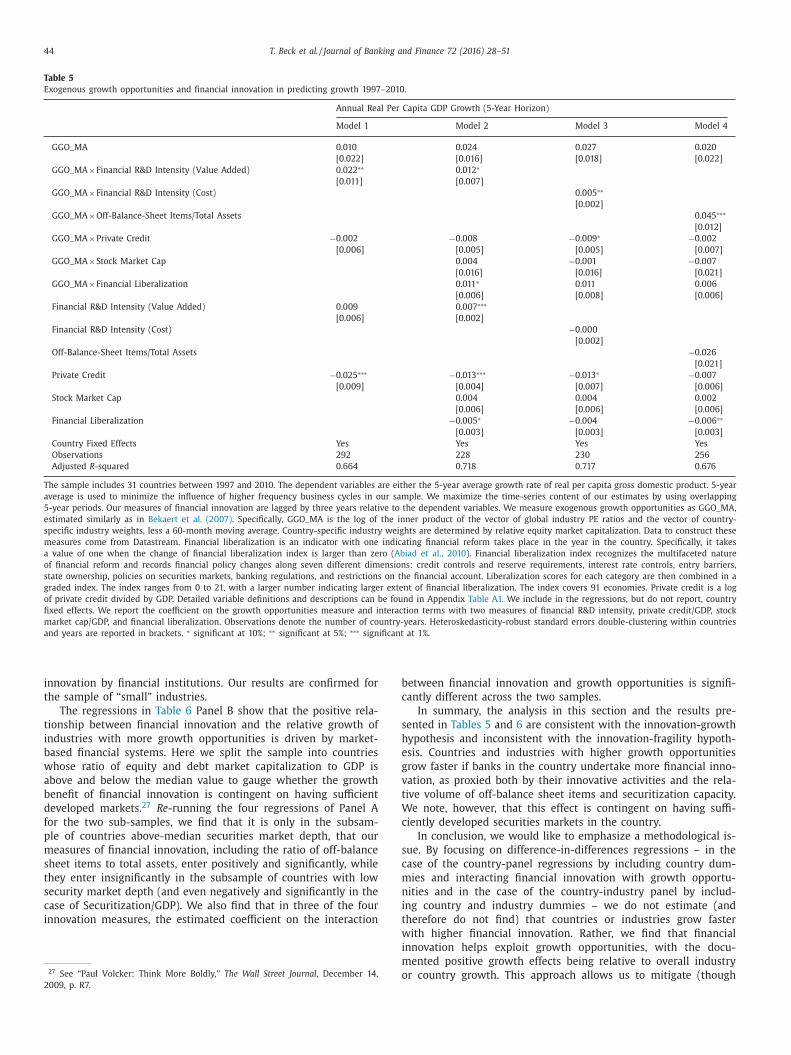
44 T. Beck et al. / Journal of Banking and Finance 72 (2016) 28–51
Table 5
Exogenous growth opportunities and financial innovation in predicting growth 1997–2010.
Annual Real Per Capita GDP Growth (5-Year Horizon)
Model 1 Model 2 Model 3 Model 4
GGO_MA 0.010 0.024 0.027 0.020
[0.022] [0.016] [0.018] [0.022]
GGO_MA ×Financial R&D Intensity (Value Added) 0.022 ∗∗ 0.012 ∗
[0.011] [0.007]
GGO_MA ×Financial R&D Intensity (Cost) 0.005 ∗∗
[0.002]
GGO_MA ×Off-Balance-Sheet Items/Total Assets 0.045 ∗∗∗
[0.012]
GGO_MA ×Private Credit −0.002 −0.008 −0.009 ∗ −0.002
[0.006] [0.005] [0.005] [0.007]
GGO_MA ×Stock Market Cap 0.004 −0.001 −0.007
[0.016] [0.016] [0.021]
GGO_MA ×Financial Liberalization 0.011 ∗ 0.011 0.006
[0.006] [0.008] [0.006]
Financial R&D Intensity (Value Added) 0.009 0.007 ∗∗∗
[0.006] [0.002]
Financial R&D Intensity (Cost) −0.0 0 0
[0.002]
Off-Balance-Sheet Items/Total Assets −0.026
[0.021]
Private Credit −0.025 ∗∗∗ −0.013 ∗∗∗ −0.013 ∗ −0.007
[0.009] [0.004] [0.007] [0.006]
Stock Market Cap 0.004 0.004 0.002
[0.006] [0.006] [0.006]
Financial Liberalization −0.005 ∗ −0.004 −0.006 ∗∗
[0.003] [0.003] [0.003]
Country Fixed Effects Yes Yes Yes Yes
Observations 292 228 230 256
Adjusted R -squared 0.664 0.718 0.717 0.676
The sample includes 31 countries between 1997 and 2010. The dependent variables are either the 5-year average growth rate of real per capita gross domestic product. 5-year
average is used to minimize the influence of higher frequency business cycles in our sample. We maximize the time-series content of our estimates by using overlapping
5-year periods. Our measures of financial innovation are lagged by three years relative to the dependent variables. We measure exogenous growth opportunities as GGO_MA,
estimated similarly as in Bekaert et al. (2007) . Specifically, GGO_MA is the log of the inner product of the vector of global industry PE ratios and the vector of country-
specific industry weights, less a 60-month moving average. Country-specific industry weights are determined by relative equity market capitalization. Data to construct these
measures come from Datastream. Financial liberalization is an indicator with one indicating financial reform takes place in the year in the country. Specifically, it takes
a value of one when the change of financial liberalization index is larger than zero ( Abiad et al., 2010 ). Financial liberalization index recognizes the multifaceted nature
of financial reform and records financial policy changes along seven different dimensions: credit controls and reserve requirements, interest rate controls, entry barriers,
state ownership, policies on securities markets, banking regulations, and restrictions on the financial account. Liberalization scores for each category are then combined in a
graded index. The index ranges from 0 to 21, with a larger number indicating larger extent of financial liberalization. The index covers 91 economies. Private credit is a log
of private credit divided by GDP. Detailed variable definitions and descriptions can be found in Appendix Table A1. We include in the regressions, but do not report, country
fixed effects. We report the coefficient on the growth opportunities measure and interaction terms with two measures of financial R&D intensity, private credit/GDP, stock
market cap/GDP, and financial liberalization. Observations denote the number of country-years. Heteroskedasticity-robust standard errors double-clustering within countries
and years are reported in brackets. ∗ significant at 10%; ∗∗ significant at 5%; ∗∗∗ significant at 1%.
b
c
s
h
e
g
v
t
W
c
s
c
m
n
i
t
innovation by financial institutions. Our results are confirmed for
the sample of “small” industries.
The regressions in Table 6 Panel B show that the positive rela-
tionship between financial innovation and the relative growth of
industries with more growth opportunities is driven by market-
based financial systems. Here we split the sample into countries
whose ratio of equity and debt market capitalization to GDP is
above and below the median value to gauge whether the growth
benefit of financial innovation is contingent on having sufficient
developed markets. 27 Re -running the four regressions of Panel A
for the two sub-samples, we find that it is only in the subsam-
ple of countries above-median securities market depth, that our
measures of financial innovation, including the ratio of off-balance
sheet items to total assets, enter positively and significantly, while
they enter insignificantly in the subsample of countries with low
security market depth (and even negatively and significantly in the
case of Securitization/GDP). We also find that in three of the four
innovation measures, the estimated coefficient on the interaction
27 See “Paul Volcker: Think More Boldly,” The Wall Street Journal , December 14,
2009, p. R7.
w
i
m
o
etween financial innovation and growth opportunities is signifi-
antly different across the two samples.
In summary, the analysis in this section and the results pre-
ented in Tables 5 and 6 are consistent with the innovation-growth
ypothesis and inconsistent with the innovation-fragility hypoth-
sis. Countries and industries with higher growth opportunities
row faster if banks in the country undertake more financial inno-
ation, as proxied both by their innovative activities and the rela-
ive volume of off-balance sheet items and securitization capacity.
e note, however, that this effect is contingent on having suffi-
iently developed securities markets in the country.
In conclusion, we would like to emphasize a methodological is-
ue. By focusing on difference-in-differences regressions – in the
ase of the country-panel regressions by including country dum-
ies and interacting financial innovation with growth opportu-
ities and in the case of the country-industry panel by includ-
ng country and industry dummies – we do not estimate (and
herefore do not find) that countries or industries grow faster
ith higher financial innovation. Rather, we find that financial
nnovation helps exploit growth opportunities, with the docu-
ented positive growth effects being relative to overall industry
r country growth. This approach allows us to mitigate (though
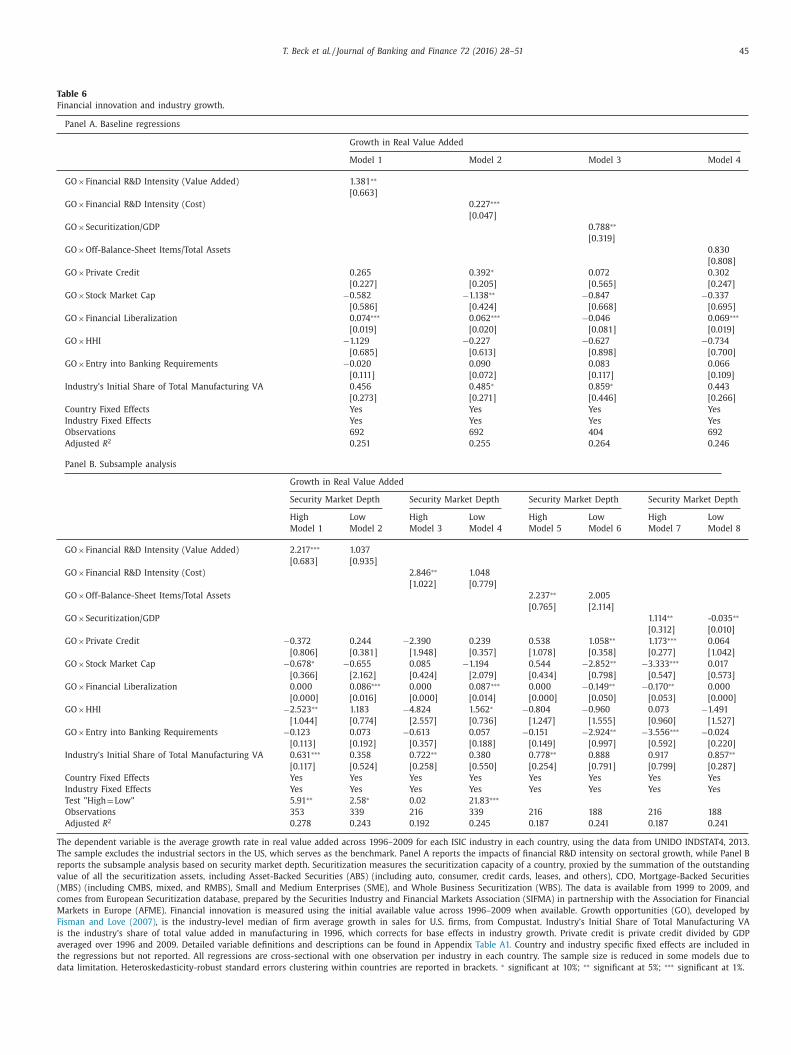
T. Beck et al. / Journal of Banking and Finance 72 (2016) 28–51 45
Table 6
Financial innovation and industry growth.
Panel A. Baseline regressions
Growth in Real Value Added
Model 1 Model 2 Model 3 Model 4
GO ×Financial R&D Intensity (Value Added) 1.381 ∗∗
[0.663]
GO ×Financial R&D Intensity (Cost) 0.227 ∗∗∗
[0.047]
GO ×Securitization/GDP 0.788 ∗∗
[0.319]
GO ×Off-Balance-Sheet Items/Total Assets 0.830
[0.808]
GO ×Private Credit 0.265 0.392 ∗ 0.072 0.302
[0.227] [0.205] [0.565] [0.247]
GO ×Stock Market Cap −0.582 −1.138 ∗∗ −0.847 −0.337
[0.586] [0.424] [0.668] [0.695]
GO ×Financial Liberalization 0.074 ∗∗∗ 0.062 ∗∗∗ −0.046 0.069 ∗∗∗
[0.019] [0.020] [0.081] [0.019]
GO ×HHI −1.129 −0.227 −0.627 −0.734
[0.685] [0.613] [0.898] [0.700]
GO ×Entry into Banking Requirements −0.020 0.090 0.083 0.066
[0.111] [0.072] [0.117] [0.109]
Industry’s Initial Share of Total Manufacturing VA 0.456 0.485 ∗ 0.859 ∗ 0.443
[0.273] [0.271] [0.446] [0.266]
Country Fixed Effects Yes Yes Yes Yes
Industry Fixed Effects Yes Yes Yes Yes
Observations 692 692 404 692
Adjusted R 2 0.251 0.255 0.264 0.246
Panel B. Subsample analysis
Growth in Real Value Added
Security Market Depth Security Market Depth Security Market Depth Security Market Depth
High Low High Low High Low High Low
Model 1 Model 2 Model 3 Model 4 Model 5 Model 6 Model 7 Model 8
GO ×Financial R&D Intensity (Value Added) 2.217 ∗∗∗ 1.037
[0.683] [0.935]
GO ×Financial R&D Intensity (Cost) 2.846 ∗∗ 1.048
[1.022] [0.779]
GO ×Off-Balance-Sheet Items/Total Assets 2.237 ∗∗ 2.005
[0.765] [2.114]
GO ×Securitization/GDP 1.114 ∗∗ -0.035 ∗∗
[0.312] [0.010]
GO ×Private Credit −0.372 0.244 −2.390 0.239 0.538 1.058 ∗∗ 1.173 ∗∗∗ 0.064
[0.806] [0.381] [1.948] [0.357] [1.078] [0.358] [0.277] [1.042]
GO ×Stock Market Cap −0.678 ∗ −0.655 0.085 −1.194 0.544 −2.852 ∗∗ −3.333 ∗∗∗ 0.017
[0.366] [2.162] [0.424] [2.079] [0.434] [0.798] [0.547] [0.573]
GO ×Financial Liberalization 0.0 0 0 0.086 ∗∗∗ 0.0 0 0 0.087 ∗∗∗ 0.0 0 0 −0.149 ∗∗ −0.170 ∗∗ 0.0 0 0
[0.0 0 0] [0.016] [0.0 0 0] [0.014] [0.0 0 0] [0.050] [0.053] [0.0 0 0]
GO ×HHI −2.523 ∗∗ 1.183 −4.824 1.562 ∗ −0.804 −0.960 0.073 −1.491
[1.044] [0.774] [2.557] [0.736] [1.247] [1.555] [0.960] [1.527]
GO ×Entry into Banking Requirements −0.123 0.073 −0.613 0.057 −0.151 −2.924 ∗∗ −3.556 ∗∗∗ −0.024
[0.113] [0.192] [0.357] [0.188] [0.149] [0.997] [0.592] [0.220]
Industry’s Initial Share of Total Manufacturing VA 0.631 ∗∗∗ 0.358 0.722 ∗∗ 0.380 0.778 ∗∗ 0.888 0.917 0.857 ∗∗
[0.117] [0.524] [0.258] [0.550] [0.254] [0.791] [0.799] [0.287]
Country Fixed Effects Yes Yes Yes Yes Yes Yes Yes Yes
Industry Fixed Effects Yes Yes Yes Yes Yes Yes Yes Yes
Test "High = Low" 5.91 ∗∗ 2.58 ∗ 0.02 21.83 ∗∗∗
Observations 353 339 216 339 216 188 216 188
Adjusted R 2 0.278 0.243 0.192 0.245 0.187 0.241 0.187 0.241
The dependent variable is the average growth rate in real value added across 1996–2009 for each ISIC industry in each country, using the data from UNIDO INDSTAT4, 2013.
The sample excludes the industrial sectors in the US, which serves as the benchmark. Panel A reports the impacts of financial R&D intensity on sectoral growth, while Panel B
reports the subsample analysis based on security market depth. Securitization measures the securitization capacity of a country, proxied by the summation of the outstanding
value of all the securitization assets, including Asset-Backed Securities (ABS) (including auto, consumer, credit cards, leases, and others), CDO, Mortgage-Backed Securities
(MBS) (including CMBS, mixed, and RMBS), Small and Medium Enterprises (SME), and Whole Business Securitization (WBS). The data is available from 1999 to 2009, and
comes from European Securitization database, prepared by the Securities Industry and Financial Markets Association (SIFMA) in partnership with the Association for Financial
Markets in Europe (AFME). Financial innovation is measured using the initial available value across 1996–2009 when available. Growth opportunities (GO), developed by
Fisman and Love (2007) , is the industry-level median of firm average growth in sales for U.S. firms, from Compustat. Industry’s Initial Share of Total Manufacturing VA
is the industry’s share of total value added in manufacturing in 1996, which corrects for base effects in industry growth. Private credit is private credit divided by GDP
averaged over 1996 and 2009. Detailed variable definitions and descriptions can be found in Appendix Table A1. Country and industry specific fixed effects are included in
the regressions but not reported. All regressions are cross-sectional with one observation per industry in each country. The sample size is reduced in some models due to
data limitation. Heteroskedasticity-robust standard errors clustering within countries are reported in brackets. ∗ significant at 10%; ∗∗ significant at 5%; ∗∗∗ significant at 1%.
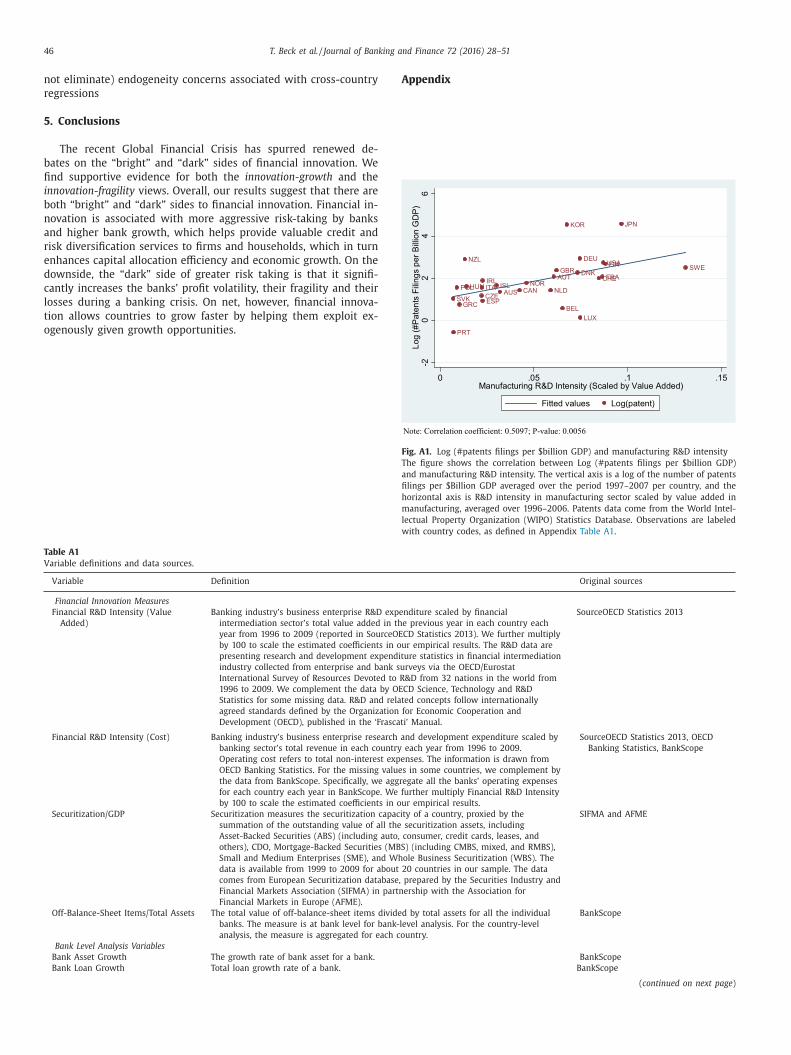
46 T. Beck et al. / Journal of Banking and Finance 72 (2016) 28–51
A
F
T
a
h
m
not eliminate) endogeneity concerns associated with cross-country
regressions
5. Conclusions
The recent Global Financial Crisis has spurred renewed de-
bates on the “bright” and “dark” sides of financial innovation. We
find supportive evidence for both the innovation-growth and the
innovation-fragility views. Overall, our results suggest that there are
both “bright” and “dark” sides to financial innovation. Financial in-
novation is associated with more aggressive risk-taking by banks
and higher bank growth, which helps provide valuable credit and
risk diversification services to firms and households, which in turn
enhances capital allocation efficiency and economic growth. On the
downside, the “dark” side of greater risk taking is that it signifi-
cantly increases the banks’ profit volatility, their fragility and their
losses during a banking crisis. On net, however, financial innova-
tion allows countries to grow faster by helping them exploit ex-
ogenously given growth opportunities.
l
w
Table A1
Variable definitions and data sources.
Variable Definition
Financial Innovation Measures
Financial R&D Intensity (Value
Added)
Banking industry’s business enterprise R&D expe
intermediation sector’s total value added in th
year from 1996 to 2009 (reported in SourceOE
by 100 to scale the estimated coefficients in ou
presenting research and development expendit
industry collected from enterprise and bank su
International Survey of Resources Devoted to R
1996 to 2009. We complement the data by OE
Statistics for some missing data. R&D and relat
agreed standards defined by the Organization
Development (OECD), published in the ‘Frascat
Financial R&D Intensity (Cost) Banking industry’s business enterprise research a
banking sector’s total revenue in each country
Operating cost refers to total non-interest expe
OECD Banking Statistics. For the missing value
the data from BankScope. Specifically, we aggr
for each country each year in BankScope. We f
by 100 to scale the estimated coefficients in ou
Securitization/GDP Securitization measures the securitization capaci
summation of the outstanding value of all the
Asset-Backed Securities (ABS) (including auto,
others), CDO, Mortgage-Backed Securities (MBS
Small and Medium Enterprises (SME), and Wh
data is available from 1999 to 2009 for about
comes from European Securitization database,
Financial Markets Association (SIFMA) in partn
Financial Markets in Europe (AFME).
Off-Balance-Sheet Items/Total Assets The total value of off-balance-sheet items divide
banks. The measure is at bank level for bank-l
analysis, the measure is aggregated for each co
Bank Level Analysis Variables
Bank Asset Growth The growth rate of bank asset for a bank.
Bank Loan Growth Total loan growth rate of a bank.
ppendix
ig. A1. Log (#patents filings per $billion GDP) and manufacturing R&D intensity
he figure shows the correlation between Log (#patents filings per $billion GDP)
nd manufacturing R&D intensity. The vertical axis is a log of the number of patents
filings per $Billion GDP averaged over the period 1997–2007 per country, and the
orizontal axis is R&D intensity in manufacturing sector scaled by value added in
anufacturing, averaged over 1996–2006. Patents data come from the World Intel-
ectual Property Organization (WIPO) Statistics Database. Observations are labeled
ith country codes, as defined in Appendix Table A1 .
Original sources
nditure scaled by financial
e previous year in each country each
CD Statistics 2013). We further multiply
r empirical results. The R&D data are
ure statistics in financial intermediation
rveys via the OECD/Eurostat
&D from 32 nations in the world from
CD Science, Technology and R&D
ed concepts follow internationally
for Economic Cooperation and
i’ Manual.
SourceOECD Statistics 2013
nd development expenditure scaled by
each year from 1996 to 2009.
nses. The information is drawn from
s in some countries, we complement by
egate all the banks’ operating expenses
urther multiply Financial R&D Intensity
r empirical results.
SourceOECD Statistics 2013, OECD
Banking Statistics, BankScope
ty of a country, proxied by the
securitization assets, including
consumer, credit cards, leases, and
) (including CMBS, mixed, and RMBS),
ole Business Securitization (WBS). The
20 countries in our sample. The data
prepared by the Securities Industry and
ership with the Association for
SIFMA and AFME
d by total assets for all the individual
evel analysis. For the country-level
untry.
BankScope
BankScope
BankScope
( continued on next page )
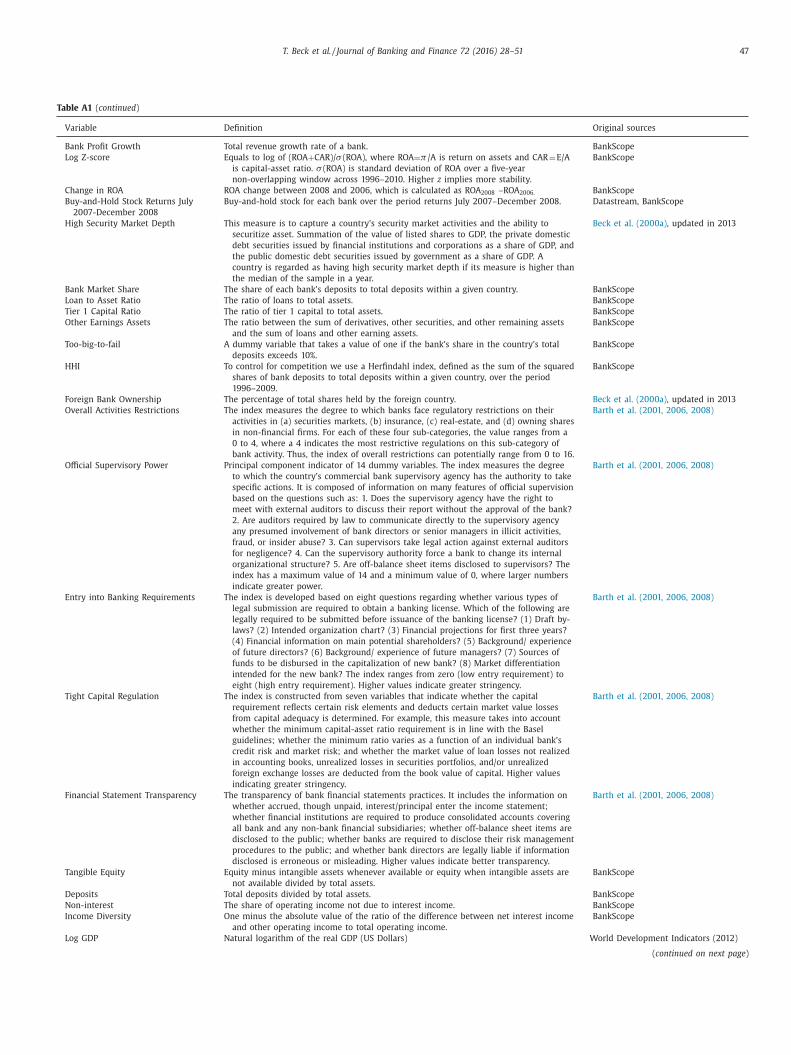
T. Beck et al. / Journal of Banking and Finance 72 (2016) 28–51 47
Table A1 ( continued )
Variable Definition Original sources
Bank Profit Growth Total revenue growth rate of a bank. BankScope
Log Z-score Equals to log of (ROA + CAR)/ σ (ROA), where ROA = π /A is return on assets and CAR = E/A
is capital-asset ratio. σ (ROA) is standard deviation of ROA over a five-year
non-overlapping window across 1996–2010. Higher z implies more stability.
BankScope
Change in ROA ROA change between 2008 and 2006, which is calculated as ROA 2008 –ROA 2006. BankScope
Buy-and-Hold Stock Returns July
20 07-December 20 08
Buy-and-hold stock for each bank over the period returns July 20 07–December 20 08. Datastream, BankScope
High Security Market Depth This measure is to capture a country’s security market activities and the ability to
securitize asset. Summation of the value of listed shares to GDP, the private domestic
debt securities issued by financial institutions and corporations as a share of GDP, and
the public domestic debt securities issued by government as a share of GDP. A
country is regarded as having high security market depth if its measure is higher than
the median of the sample in a year.
Beck et al. (20 0 0a) , updated in 2013
Bank Market Share The share of each bank’s deposits to total deposits within a given country. BankScope
Loan to Asset Ratio The ratio of loans to total assets. BankScope
Tier 1 Capital Ratio The ratio of tier 1 capital to total assets. BankScope
Other Earnings Assets The ratio between the sum of derivatives, other securities, and other remaining assets
and the sum of loans and other earning assets.
BankScope
Too-big-to-fail A dummy variable that takes a value of one if the bank’s share in the country’s total
deposits exceeds 10%.
BankScope
HHI To control for competition we use a Herfindahl index, defined as the sum of the squared
shares of bank deposits to total deposits within a given country, over the period
1996–2009.
BankScope
Foreign Bank Ownership The percentage of total shares held by the foreign country. Beck et al. (20 0 0a) , updated in 2013
Overall Activities Restrictions The index measures the degree to which banks face regulatory restrictions on their
activities in (a) securities markets, (b) insurance, (c) real-estate, and (d) owning shares
in non-financial firms. For each of these four sub-categories, the value ranges from a
0 to 4, where a 4 indicates the most restrictive regulations on this sub-category of
bank activity. Thus, the index of overall restrictions can potentially range from 0 to 16.
Barth et al. (2001, 2006, 2008)
Official Supervisory Power Principal component indicator of 14 dummy variables. The index measures the degree
to which the country’s commercial bank supervisory agency has the authority to take
specific actions. It is composed of information on many features of official supervision
based on the questions such as: 1. Does the supervisory agency have the right to
meet with external auditors to discuss their report without the approval of the bank?
2. Are auditors required by law to communicate directly to the supervisory agency
any presumed involvement of bank directors or senior managers in illicit activities,
fraud, or insider abuse? 3. Can supervisors take legal action against external auditors
for negligence? 4. Can the supervisory authority force a bank to change its internal
organizational structure? 5. Are off-balance sheet items disclosed to supervisors? The
index has a maximum value of 14 and a minimum value of 0, where larger numbers
indicate greater power.
Barth et al. (2001, 2006, 2008)
Entry into Banking Requirements The index is developed based on eight questions regarding whether various types of
legal submission are required to obtain a banking license. Which of the following are
legally required to be submitted before issuance of the banking license? (1) Draft by-
laws? (2) Intended organization chart? (3) Financial projections for first three years?
(4) Financial information on main potential shareholders? (5) Background/ experience
of future directors? (6) Background/ experience of future managers? (7) Sources of
funds to be disbursed in the capitalization of new bank? (8) Market differentiation
intended for the new bank? The index ranges from zero (low entry requirement) to
eight (high entry requirement). Higher values indicate greater stringency.
Barth et al. (2001, 2006, 2008)
Tight Capital Regulation The index is constructed from seven variables that indicate whether the capital
requirement reflects certain risk elements and deducts certain market value losses
from capital adequacy is determined. For example, this measure takes into account
whether the minimum capital-asset ratio requirement is in line with the Basel
guidelines; whether the minimum ratio varies as a function of an individual bank’s
credit risk and market risk; and whether the market value of loan losses not realized
in accounting books, unrealized losses in securities portfolios, and/or unrealized
foreign exchange losses are deducted from the book value of capital. Higher values
indicating greater stringency.
Barth et al. (2001, 2006, 2008)
Financial Statement Transparency The transparency of bank financial statements practices. It includes the information on
whether accrued, though unpaid, interest/principal enter the income statement;
whether financial institutions are required to produce consolidated accounts covering
all bank and any non-bank financial subsidiaries; whether off-balance sheet items are
disclosed to the public; whether banks are required to disclose their risk management
procedures to the public; and whether bank directors are legally liable if information
disclosed is erroneous or misleading. Higher values indicate better transparency.
Barth et al. (2001, 2006, 2008)
Tangible Equity Equity minus intangible assets whenever available or equity when intangible assets are
not available divided by total assets.
BankScope
Deposits Total deposits divided by total assets. BankScope
Non-interest The share of operating income not due to interest income. BankScope
Income Diversity One minus the absolute value of the ratio of the difference between net interest income
and other operating income to total operating income.
BankScope
Log GDP Natural logarithm of the real GDP (US Dollars) World Development Indicators (2012)
( continued on next page )
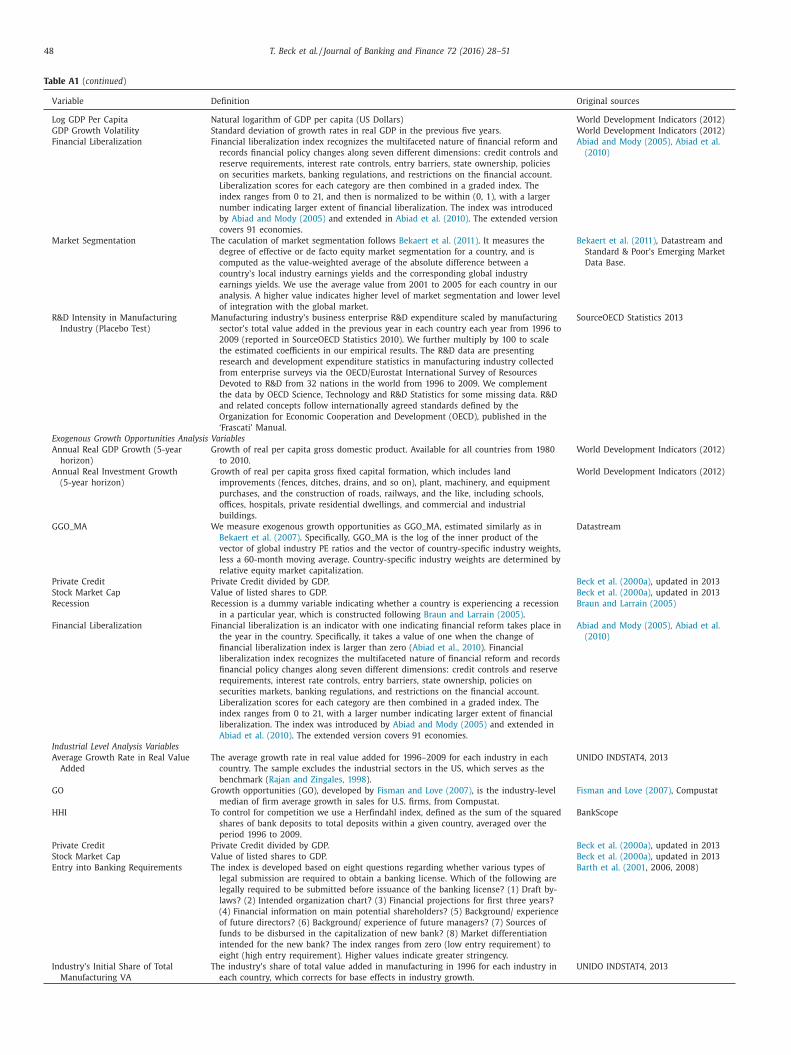
48 T. Beck et al. / Journal of Banking and Finance 72 (2016) 28–51
Table A1 ( continued )
Variable Definition Original sources
Log GDP Per Capita Natural logarithm of GDP per capita (US Dollars) World Development Indicators (2012)
GDP Growth Volatility Standard deviation of growth rates in real GDP in the previous five years. World Development Indicators (2012)
Financial Liberalization Financial liberalization index recognizes the multifaceted nature of financial reform and
records financial policy changes along seven different dimensions: credit controls and
reserve requirements, interest rate controls, entry barriers, state ownership, policies
on securities markets, banking regulations, and restrictions on the financial account.
Liberalization scores for each category are then combined in a graded index. The
index ranges from 0 to 21, and then is normalized to be within (0, 1), with a larger
number indicating larger extent of financial liberalization. The index was introduced
by Abiad and Mody (2005) and extended in Abiad et al. (2010) . The extended version
covers 91 economies.
Abiad and Mody (2005), Abiad et al.
(2010)
Market Segmentation The caculation of market segmentation follows Bekaert et al. (2011) . It measures the
degree of effective or de facto equity market segmentation for a country, and is
computed as the value-weighted average of the absolute difference between a
country’s local industry earnings yields and the corresponding global industry
earnings yields. We use the average value from 2001 to 2005 for each country in our
analysis. A higher value indicates higher level of market segmentation and lower level
of integration with the global market.
Bekaert et al. (2011) , Datastream and
Standard & Poor’s Emerging Market
Data Base.
R&D Intensity in Manufacturing
Industry (Placebo Test)
Manufacturing industry’s business enterprise R&D expenditure scaled by manufacturing
sector’s total value added in the previous year in each country each year from 1996 to
2009 (reported in SourceOECD Statistics 2010). We further multiply by 100 to scale
the estimated coefficients in our empirical results. The R&D data are presenting
research and development expenditure statistics in manufacturing industry collected
from enterprise surveys via the OECD/Eurostat International Survey of Resources
Devoted to R&D from 32 nations in the world from 1996 to 2009. We complement
the data by OECD Science, Technology and R&D Statistics for some missing data. R&D
and related concepts follow internationally agreed standards defined by the
Organization for Economic Cooperation and Development (OECD), published in the
‘Frascati’ Manual.
SourceOECD Statistics 2013
Exogenous Growth Opportunities Analysis Variables
Annual Real GDP Growth (5-year
horizon)
Growth of real per capita gross domestic product. Available for all countries from 1980
to 2010.
World Development Indicators (2012)
Annual Real Investment Growth
(5-year horizon)
Growth of real per capita gross fixed capital formation, which includes land
improvements (fences, ditches, drains, and so on), plant, machinery, and equipment
purchases, and the construction of roads, railways, and the like, including schools,
offices, hospitals, private residential dwellings, and commercial and industrial
buildings.
World Development Indicators (2012)
GGO_MA We measure exogenous growth opportunities as GGO_MA, estimated similarly as in
Bekaert et al. (2007) . Specifically, GGO_MA is the log of the inner product of the
vector of global industry PE ratios and the vector of country-specific industry weights,
less a 60-month moving average. Country-specific industry weights are determined by
relative equity market capitalization.
Datastream
Private Credit Private Credit divided by GDP. Beck et al. (20 0 0a) , updated in 2013
Stock Market Cap Value of listed shares to GDP. Beck et al. (20 0 0a) , updated in 2013
Recession Recession is a dummy variable indicating whether a country is experiencing a recession
in a particular year, which is constructed following Braun and Larrain (2005) .
Braun and Larrain (2005)
Financial Liberalization Financial liberalization is an indicator with one indicating financial reform takes place in
the year in the country. Specifically, it takes a value of one when the change of
financial liberalization index is larger than zero ( Abiad et al., 2010 ). Financial
liberalization index recognizes the multifaceted nature of financial reform and records
financial policy changes along seven different dimensions: credit controls and reserve
requirements, interest rate controls, entry barriers, state ownership, policies on
securities markets, banking regulations, and restrictions on the financial account.
Liberalization scores for each category are then combined in a graded index. The
index ranges from 0 to 21, with a larger number indicating larger extent of financial
liberalization. The index was introduced by Abiad and Mody (2005) and extended in
Abiad et al. (2010) . The extended version covers 91 economies.
Abiad and Mody (2005), Abiad et al.
(2010)
Industrial Level Analysis Variables
Average Growth Rate in Real Value
Added
The average growth rate in real value added for 1996–2009 for each industry in each
country. The sample excludes the industrial sectors in the US, which serves as the
benchmark ( Rajan and Zingales, 1998 ).
UNIDO INDSTAT4, 2013
GO Growth opportunities (GO), developed by Fisman and Love (2007) , is the industry-level
median of firm average growth in sales for U.S. firms, from Compustat.
Fisman and Love (2007) , Compustat
HHI To control for competition we use a Herfindahl index, defined as the sum of the squared
shares of bank deposits to total deposits within a given country, averaged over the
period 1996 to 2009.
BankScope
Private Credit Private Credit divided by GDP. Beck et al. (20 0 0a) , updated in 2013
Stock Market Cap Value of listed shares to GDP. Beck et al. (20 0 0a) , updated in 2013
Entry into Banking Requirements The index is developed based on eight questions regarding whether various types of
legal submission are required to obtain a banking license. Which of the following are
legally required to be submitted before issuance of the banking license? (1) Draft by-
laws? (2) Intended organization chart? (3) Financial projections for first three years?
(4) Financial information on main potential shareholders? (5) Background/ experience
of future directors? (6) Background/ experience of future managers? (7) Sources of
funds to be disbursed in the capitalization of new bank? (8) Market differentiation
intended for the new bank? The index ranges from zero (low entry requirement) to
eight (high entry requirement). Higher values indicate greater stringency.
Barth et al. (2001 , 2006, 2008)
Industry’s Initial Share of Total
Manufacturing VA
The industry’s share of total value added in manufacturing in 1996 for each industry in
each country, which corrects for base effects in industry growth.
UNIDO INDSTAT4, 2013
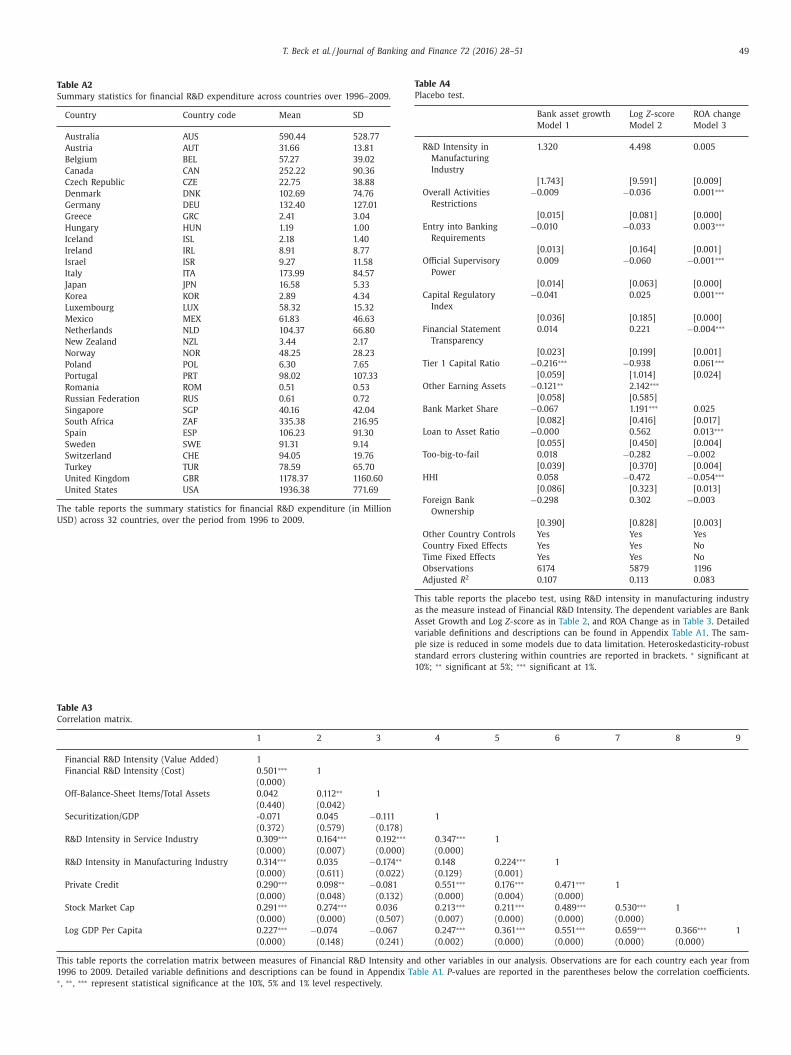
T. Beck et al. / Journal of Banking and Finance 72 (2016) 28–51 49
Table A2
Summary statistics for financial R&D expenditure across countries over 1996–2009.
Country Country code Mean SD
Australia AUS 590.44 528.77
Austria AUT 31.66 13.81
Belgium BEL 57.27 39.02
Canada CAN 252.22 90.36
Czech Republic CZE 22.75 38.88
Denmark DNK 102.69 74.76
Germany DEU 132.40 127.01
Greece GRC 2.41 3.04
Hungary HUN 1.19 1.00
Iceland ISL 2.18 1.40
Ireland IRL 8.91 8.77
Israel ISR 9.27 11.58
Italy ITA 173.99 84.57
Japan JPN 16.58 5.33
Korea KOR 2.89 4.34
Luxembourg LUX 58.32 15.32
Mexico MEX 61.83 46.63
Netherlands NLD 104.37 66.80
New Zealand NZL 3.44 2.17
Norway NOR 48.25 28.23
Poland POL 6.30 7.65
Portugal PRT 98.02 107.33
Romania ROM 0.51 0.53
Russian Federation RUS 0.61 0.72
Singapore SGP 40.16 42.04
South Africa ZAF 335.38 216.95
Spain ESP 106.23 91.30
Sweden SWE 91.31 9.14
Switzerland CHE 94.05 19.76
Turkey TUR 78.59 65.70
United Kingdom GBR 1178.37 1160.60
United States USA 1936.38 771.69
The table reports the summary statistics for financial R&D expenditure (in Million
USD) across 32 countries, over the period from 1996 to 2009.
Table A4
Placebo test.
Bank asset growth Log Z -score ROA change
Model 1 Model 2 Model 3
R&D Intensity in
Manufacturing
Industry
1.320 4.498 0.005
[1.743] [9.591] [0.009]
Overall Activities
Restrictions
−0.009 −0.036 0.001 ∗∗∗
[0.015] [0.081] [0.0 0 0]
Entry into Banking
Requirements
−0.010 −0.033 0.003 ∗∗∗
[0.013] [0.164] [0.001]
Official Supervisory
Power
0.009 −0.060 −0.001 ∗∗∗
[0.014] [0.063] [0.0 0 0]
Capital Regulatory
Index
−0.041 0.025 0.001 ∗∗∗
[0.036] [0.185] [0.0 0 0]
Financial Statement
Transparency
0.014 0.221 −0.004 ∗∗∗
[0.023] [0.199] [0.001]
Tier 1 Capital Ratio −0.216 ∗∗∗ −0.938 0.061 ∗∗∗
[0.059] [1.014] [0.024]
Other Earning Assets −0.121 ∗∗ 2.142 ∗∗∗
[0.058] [0.585]
Bank Market Share −0.067 1.191 ∗∗∗ 0.025
[0.082] [0.416] [0.017]
Loan to Asset Ratio −0.0 0 0 0.562 0.013 ∗∗∗
[0.055] [0.450] [0.004]
Too-big-to-fail 0.018 −0.282 −0.002
[0.039] [0.370] [0.004]
HHI 0.058 −0.472 −0.054 ∗∗∗
[0.086] [0.323] [0.013]
Foreign Bank
Ownership
−0.298 0.302 −0.003
[0.390] [0.828] [0.003]
Other Country Controls Yes Yes Yes
Country Fixed Effects Yes Yes No
Time Fixed Effects Yes Yes No
Observations 6174 5879 1196
Adjusted R 2 0.107 0.113 0.083
This table reports the placebo test, using R&D intensity in manufacturing industry
as the measure instead of Financial R&D Intensity. The dependent variables are Bank
Asset Growth and Log Z -score as in Table 2 , and ROA Change as in Table 3 . Detailed
variable definitions and descriptions can be found in Appendix Table A1 . The sam-
ple size is reduced in some models due to data limitation. Heteroskedasticity-robust
standard errors clustering within countries are reported in brackets. ∗ significant at
10%; ∗∗ significant at 5%; ∗∗∗ significant at 1%.
Table A3
Correlation matrix.
1 2 3 4 5 6 7 8 9
Financial R&D Intensity (Value Added) 1
Financial R&D Intensity (Cost) 0.501 ∗∗∗ 1
(0.0 0 0)
Off-Balance-Sheet Items/Total Assets 0.042 0.112 ∗∗ 1
(0.440) (0.042)
Securitization/GDP -0.071 0.045 −0.111 1
(0.372) (0.579) (0.178)
R&D Intensity in Service Industry 0.309 ∗∗∗ 0.164 ∗∗∗ 0.192 ∗∗∗ 0.347 ∗∗∗ 1
(0.0 0 0) (0.007) (0.0 0 0) (0.0 0 0)
R&D Intensity in Manufacturing Industry 0.314 ∗∗∗ 0.035 −0.174 ∗∗ 0.148 0.224 ∗∗∗ 1
(0.0 0 0) (0.611) (0.022) (0.129) (0.001)
Private Credit 0.290 ∗∗∗ 0.098 ∗∗ −0.081 0.551 ∗∗∗ 0.176 ∗∗∗ 0.471 ∗∗∗ 1
(0.0 0 0) (0.048) (0.132) (0.0 0 0) (0.004) (0.0 0 0)
Stock Market Cap 0.291 ∗∗∗ 0.274 ∗∗∗ 0.036 0.213 ∗∗∗ 0.211 ∗∗∗ 0.489 ∗∗∗ 0.530 ∗∗∗ 1
(0.0 0 0) (0.0 0 0) (0.507) (0.007) (0.0 0 0) (0.0 0 0) (0.0 0 0)
Log GDP Per Capita 0.227 ∗∗∗ −0.074 −0.067 0.247 ∗∗∗ 0.361 ∗∗∗ 0.551 ∗∗∗ 0.659 ∗∗∗ 0.366 ∗∗∗ 1
(0.0 0 0) (0.148) (0.241) (0.002) (0.0 0 0) (0.0 0 0) (0.0 0 0) (0.0 0 0)
This table reports the correlation matrix between measures of Financial R&D Intensity and other variables in our analysis. Observations are for each country each year from
1996 to 2009. Detailed variable definitions and descriptions can be found in Appendix Table A1. P -values are reported in the parentheses below the correlation coefficients. ∗ , ∗∗ , ∗∗∗ represent statistical significance at the 10%, 5% and 1% level respectively.

50 T. Beck et al. / Journal of Banking and Finance 72 (2016) 28–51
D
D
D
D
F
F
F
F
S
S
G
G
G
H
H
H
H
J
K
K
L
L
L
N
R
R
R
References
Abiad, Abdul , Enrica, Detragiache , Thierry, Tressel , 2010. A new database of financial
reforms. IMF Staff Papers 57, 281–302 .
Abiad, A. , Mody, A. , 2005. Financial reform: What shakes it? What shapes it. Amer-ican Economic Review 95, 66–88 .
Acharya, ViralV. , Schnabl, Philipp , Suarez, Gustavo , 2013. Securitization without risktransfer. Journal of Financial Economics 107, 515–536 .
Aghion, Philippe , Howitt, Peter , Mayer-Foulkes, David , 2005. The effect of financialdevelopment on convergence: Theory and evidence. Quarterly Journal of Eco-
nomics 120, 173–222 .
Akhavein, Jalal , Scott Frame, W. , White, LawrenceJ. , 2005. The diffusion of financialinnovations: An examination of the adoption of small business credit scoring by
large banking organizations. The Journal of Business 78, 577–596 . Allen, Franklin , Carletti, Elena , 2006. Credit risk transfer and contagion. Journal of
Monetary Economics 53, 89–111 . Allen, Franklin , Gale, Douglas , 1991. Arbitrage, short sales and financial innovation.
Econometrica 59, 1041–1068 . Allen, Franklin , Gale, Douglas , 1994. Financial Innovation and Risk Sharing. MIT
Press, Cambridge, MA .
Arcand, Jean-Louis , Berkes, Enrico , Panizza, Ugo , 2015. Too much finance. Journal ofEconomic Growth 20, 105–148 .
Barth, James R., Gerard Caprio, and Ross Levine, 2001. Bank Regulation and Super-vision: A New Database, in Robert Litan and Richard Herring, Eds., “Brookings-
Wharton Papers on Financial Services”, 2001, Brookings Institution Press; Wash-ington, D.C.
Barth, JamesR. , Caprio, Gerard , Levine, Ross , 2006. Rethinking Bank Regulation: Till
Angels Govern. Cambridge University Press . Barth, JamesR. , Caprio, Gerard , Levine, Ross , 2008. Bank Regulations are Changing:
For Better or Worse. World Bank Research Working papers, December 2008 . Basu, Susanto , Inklaar, Robert , Christina Wang, J , 2011. The value of risk: Measuring
the services of U.S. commercial banks. Economic Inquiry 49 (1), 226–245 . Beck, Thorsten , Jonghe, OlivierDe , Schepens, Glenn , 2013. Bank competition and
stability: Cross-country heterogeneity. Journal of Financial Intermediation 22,
218–244 . Beck, Thorsten , Demirguc-Kunt, Asli , Laeven, Luc , Levine, Ross , 2008. Finance, firm
size, and growth. Journal of Money, Credit and Banking 40, 1379–1405 . Beck, Thorsten , Demirgüç-Kunt, Asli , Levine, Ross , 20 0 0. A new database on finan-
cial development and structure. World Bank Economic Review 14, 597–605 . Beck, Thorsten , Levine, Ross , 2002. Industry growth and capital allocation: does hav-
ing a market- or bank-based system matter. Journal of Financial Economics 64,
147–180 . Beck, Thorsten , Levine, Ross , Loayza, Norman , 20 0 0. Financial intermediation and
growth: causality and causes. Journal of Monetary Economics 46, 31–77 . Bekaert, Geert , Harvey, CampbellR. , Lundblad, Christian , 2005. Does financial liber-
alization spur growth? Journal of Financial Economics 77, 3–55 . Bekaert, Geert , Harvey, CampbellR. , Lundblad, Christian , Siegel, Stephan , 2007.
Global growth opportunities and market integration. Journal of Finance 62,
1081–1137 . Bekaert, Geert , Harvey, CampbellR. , Lundblad, ChristianT. , Siegel, Stephan , 2011.
What segments equity markets? Review of Financial Studies 24, 3841–3890 . Beltratti, Andrea , Stulz, RenéM. , 2012. The credit crisis around the globe: Why did
some banks perform better? Journal of Financial Economics 105, 1–17 . Berger, AllenN. , 2003. The economic effects of technological progress: evidence from
the banking industry. Journal of Money, Credit and Banking 35, 141–176 .
Berger, AllenN. , Scott Frame, W. , Miller, NathanH. , 2005. Credit scoring and theavailability, price, and risk of small business credit. Journal of Money, Credit,
and Banking 37 (2), 191–222 . Blackburn, Keith , Hung, Victor , 1998. A theory of growth, financial development and
trade. Economica 65, 107–124 . Boyd, JohnH. , Nicolo, GianniDe , Jalal, AbuAl , 2006. Bank Risk Taking and Competi-
tion Revisited: New Theory and New Evidence. IMF Working Paper No. 297 . Braun, Matias , Larrain, Borja , 2005. Finance and the business cycle: International,
inter-industry evidence. Journal of Finance 60, 1097–1128 .
Brunnermeier, MarkusK. , 2009. Deciphering the liquidity and credit crunch20 07–20 08. Journal of Economic Perspectives 23, 77–100 .
Calomiris, Charles , (January), 2009. Financial innovation, regulation, and reform.Cato Journal 29, 65–91 .
Cetorelli, Nicola , Gambera, Michele , 2001. Banking market structure, financial de-pendence and growth: International evidence from industry data. The Journal
of Finance 56 (2), 617–648 .
Cohen, Wesley M. , Klepper, Steven , 1996. Firm size and the nature of innovationwithin industries: the case of process and product R&D. Review of Economics
and Statistics 78, 232–243 . Dell’Ariccia, G. , Deniz, I. , Laeven, L.A. , 2008. Credit Booms and Lending Standards:
Evidence from the Subprime Mortgage Market. International Monetary FundWorking Paper .
Demirgüç-Kunt, Asli , Huizinga, Harry , 2010. Bank activity and funding strategies:
the impact on risk and returns. Journal of Financial Economics 98, 626–650 . Devereux, MichaelB. , Yu, Changhua , 2014. International Financial Integration and
Crisis Contagion. National Bureau of Economic Research Working Paper SeriesNo. 20526 .
DeYoung, Robert., 2001. The financial performance of pure play internet banks. Eco-nomic Perspectives Federal Reserve Bank of Chicago 25: First Quarter, pp. 60–
75.
eYoung, Robert , 2005. The performance of internet-based business models: evi-dence from the banking industry. Journal of Business 78, 893–947 .
eYoung, Robert , Lang, William W. , Nolle, DanielL. , 2007. How the Internet affectsoutput and performance at community banks? Journal of Banking & Finance 31
(4), 1033–1060 . jankov, Simeon , McLiesh, Caralee , Shleifer, Andrei , 2007. Private credit in 129 coun-
tries. Journal of Financial Economics 84, 299–329 . uffie, D. , Rahi, R. , 1995. Financial market innovation and security design: an intro-
duction. Journal of Economic Theory 65, 1–42 .
Elul, R. , 1995. Welfare effects of financial innovation in incomplete marketseconomies with several consumption goods. Journal of Economic Theory 65,
43–78 . isman, Raymond , Love, Inessa , 2004. Financial development and intersectoral allo-
cation: A new approach. Journal of Finance 59, 2785–2807 . isman, Raymond , Love, Inessa , 2007. Financial dependence and growth revisited.
Journal of the European Economic Association 5, 470–479 .
rame, W.S. , Padhi, M. , Woolsey, L. , 2004. The effect of credit scoring on smallbusiness lending in low- and moderate income areas. Financial Review 39 (1),
35–54 . rame, W.S. , Srinivasan, A. , Woosley, L. , 2001. The effect of credit scoring on small
business lending. Journal of Money, Credit, and Banking 33 (3), 813–825 . cott, FrameW. , White, LawrenceJ. , 2004. Empirical studies of financial innovation:
lots of talk, little action. Journal of Economic Literature 42, 116–144 .
cott, FrameW. , White, LawrenceJ. , 2009. Technological Change, Financial Innova-tion, and Diffusion in Banking. Federal Reserve Bank of Atlanta Working Paper
2009-10. March 2009 . ennaioli, Nicola , Shleifer, Andrei , Vishny, Robert , 2012. Neglected risks, financial
innovation, and financial fragility. Journal of Financial Economics 104, 452–468 .erardi, KristopherS. , Rosen, HarveyS. , Willen, PaulS. , 2010. The impact of deregula-
tion and financial innovation on consumers: The case of the mortgage market.
The Journal of Finance 65, 333–360 . reenwood, Jeremy , Jovanovic, Boyan , 1990. Financial development, growth, and the
distribution of income. Journal of Political Economy 98, 1076–1107 . Grinblatt, Mark , Longstaff, FrancisA. , 20 0 0. Financial innovation and the role of
derivative securities: An empirical analysis of the Treasury STRIPS program.Journal of Finance 55, 1415–1436 .
elpman, E. , 1993. Innovation, imitation, and intellectual property rights. Economet-
rica 61, 1247–1280 . enderson, B.J. , Pearson, N.D. , 2011. The dark side of financial innovation: a case
study of the pricing of a retail financial product. Journal of Financial Economics100, 227–247 .
ouston, Joel , James, Christopher , 1995. CEO compensation and bank risk: Is com-pensation in banking structured to promote risk taking. Journal of Monetary
Economics 36, 405–431 .
ouston, Joel , Lin, Chen , Lin, Ping , Ma, Yue , 2010. Creditor rights, information shar-ing, and bank risk taking. Journal of Financial Economics 96, 485–512 .
Johnson, S. , Kwak, J. , 2010. 13 Bankers: The Wall Street Takeover and the Next Fi-nancial Meltdown. Pantheon Books, New York .
orda, Oscar , Schularick, Moritz , Taylor, AlanM. , 2013. When credit bites back. Jour-nal of Money, Credit and Banking 45, 3–28 .
Keys, B.J. , Mukherjee, T. , Seru, A. , Vig, V. , 2010. Did securitization lead to laxscreening? Evidence from subprime loans. Quarterly Journal of Economics 125,
307–362 .
ing, RobertG. , Levine, Ross , 1993a. Finance, entrepreneurship, and growth: theoryand evidence. Journal of Monetary Economics 32, 513–542 .
King, RobertG. , Levine, Ross , 1993b. Finance and growth: Schumpeter might beright. The Quarterly Journal of Economics 108, 717–737 .
roszner, Randall , Laeven, Luc , Klingebiel, Daniela , 2007. Banking crises, financialdependence, and growth. Journal of Financial Economics 84, 187–228 .
Laeven, Luc , Levine, Ross , 2009. Bank governance, regulation and risk taking. Journal
of Financial Economics 93, 259–275 . Laeven, Luc , Levine, Ross , Michalopoulos, Stelios , 2015. Financial innovation and en-
dogenous growth. Journal of Financial Intermediation 24, 1–24 . erner, Josh , Tufano, Peter , 2011. The consequences of financial innovation: a coun-
terfactual research agenda. Annual Review of Financial Economics 3, 41–85 . evine, Ross , 2005. Finance and growth: Theory and evidence. In: Aghion, P.,
Durlauf, S. (Eds.), Handbook of Economic Growth. North-Holland Elsevier Pub-
lishers, Amsterdam . oayza, Norman , Rancière, Romain , 2006. Financial development, financial fragility,
and growth. Journal of Money Credit and Banking 38 (4), 1051–1076 . Merton, Robert C. , 1992. Financial innovation and economic performance. Journal of
Applied Corporate Finance 4, 12–22 . orden, L. , Silva, BustonC. , Wagner, W. , 2014. Financial innovation and bank behav-
ior: Evidence from credit markets. Journal of Economic Dynamics and Control
43, 130–145 . addatz, Claudio , 2006. Liquidity needs and vulnerability to financial underdevelop-
ment. Journal of Financial Economics 80, 677–722 . ajan, RaghuramG. , 2006. Has finance made the world riskier. European Financial
Management 12, 499–533 . Rajan, Raghuram , Zingales, Luigi , 1998. Financial dependence and growth. American
Economic Review 88, 559–586 .
Rancière, Romain , Tornell, Aaron , Westermann, Frank , 2006. Decomposing the ef-fects of financial liberalization: Crises vs. growth. Journal of Banking and Fi-
nance 30, 3331–3348 . ancière, Romain , Tornell, Aaron , Westermann, Frank , 2008. Systemic crises and
growth. Quarterly Journal of Economics 123, 359–406 .

T. Beck et al. / Journal of Banking and Finance 72 (2016) 28–51 51
R
R
R
S
S
S
T
W
W
W
ioja, Felix , Valev, Neven , 2004. Finance and the sources of growth at various stagesof economic development. Economic Inquiry 42, 127–140 .
oss, StephenA. , 1976. Options and efficiency. Quarterly Journal of Economics 1,75–89 .
oy, AndrewD. , 1952. Safety first and the holding of assets. Econometrica 20,431–449 .
aretto, Alessio , Tookes, HeatherE. , 2013. Corporate leverage, debt maturity, andcredit supply: The role of credit default swaps. Review of Financial Studies 26,
1190–1247 .
chroth, Enrique , 2003. Innovation, Differentiation, and the Choice of an Under-writer: Evidence from Equity-linked Securities. Mimeo, HEC, University of Lau-
sanne .
ubrahmanyam, MartiG. , Tang, Dragon Yongjun , Wang, Sarah Qian , 2014. Does thetail wag the dog?: The effect of credit default swaps on credit risk. Review of
Financial Studies 27, 2927–2960 . ufano, Peter , 2003. Financial innovation: the last 200 years and the next. In: Con-
stantinides, George M., Harris, Milton, Stulz, René M. (Eds.), The Handbook ofthe Economics of Finance. JAI Press, Inc. .
agner, Wolf , 2007a. Financial development and the opacity of banks. EconomicsLetters 97, 6–10 .
agner, Wolf , 2007b. The liquidity of bank assets and banking stability. Journal of
Banking and Finance 31, 121–139 . ang, Y. , Xia, H. , 2014. Do lenders still monitor when they can securitize loans.
Review of Financial Studies 27, 2354–2391 .