Journal of Bangladesh Agricultural University ...
12
Cite This Article Hasan, M.R., Islam, M.A., Kameyama, H., Bau, H. 2020. Profitability and Technical Efficiency of Vegetable Production in Bangladesh. Journal of Bangladesh Agricultural University, 18(4): 1042–1053. https://doi.org/10.5455/JBAU.8013 J Bangladesh Agril Univ 18(4): 1042–1053, 2020 https://doi.org/10.5455/JBAU.8013 ISSN 1810-3030 (Print) 2408-8684 (Online) Journal of Bangladesh Agricultural University Journal home page: http://baures.bau.edu.bd/jbau Profitability and Technical Efficiency of Vegetable Production in Bangladesh Md. Rashidul Hasan 1 , M. Ariful Islam 2 , Hiroshi Kameyama 3 , Hu Bai 4 1 Department of Agribusiness and Marketing, Sher-e-Bangla Agricultural University, Dhaka, Bangladesh 2 Agricultural Economics Division, Bangladesh Rice Research Institute (BRRI), Gazipur, Bangladesh 3 Faculty of Agriculture, Kagawa University, 2393 Ikenobe, Miki, Kagawa, Japan 4 Faculty of Agriculture, Ehime University, 3-5-7 Tarumi, Matsuyama, Ehime 790-8566, Japan ARTICLE INFO ABSTRACT There is a substantial variation in profitability and efficiency among vegetables farms in Bangladesh. This study examined the level of profitability and technical efficiency of bean, brinjal and tomato production in Bangladesh. The study documented the crucial problems of vegetables producing farms. Data were collected through a field survey of 213 vegetable farmers selected by multi-stage random sampling technique in three districts from May to July 2014. Profitability of vegetable was analyzed using conventional farm income of farmers and the Benefit-Cost Ratio (BCR). Cobb-Douglas stochastic frontier production function model was used to estimate the farm level technical efficiencies. Analysis found that farmer’s average age was 44.4 years. They had 5.51 years of education, 1.42 numbers of agricultural training and 12.2 years of farming experience. Results showed that total costs were Tk. 196,198 (US$ 2,312.56)/ha for bean, Tk. 220,047 (US$ 2,593.66)/ha for brinjal, and Tk. 240,063 (US$ 2,829.59)/ha for tomato production. Net margin was Tk. 28,601 (US$ 337.11)/ha for bean, Tk. 36,557 (US$ 430.89)/ha for brinjal and Tk. 49,762 (US$ 586.53)/ha for tomato production. The net margin and the BCR indicated that the above mentioned vegetables were profitable in the study areas. Cobb- Douglas stochastic frontier production function indicated that agricultural training and number of adult households reduce the vegetable producers’ inefficiency. Overall technical efficiency was 87.3 % and there is opportunity for increasing technical efficiency by taking different management practices. Lack of capital and low prices of vegetables were the major problem of farmers. Department of Agricultural Extension (DAE) may provide some training to the farmers about storage of vegetables to ensure fair price of vegetables. Government may provide loan with a low interest rate which may solve capital shortage of farmers. There is scope for same type of further research in other vegetables producing districts in Bangladesh. Article history Received: 06 Oct 2020 Accepted: 25 Nov 2020 Published: 30 Dec 2020 Keywords Vegetables, Profitability, Benefit-Cost Ratio, Technical efficiency Correspondence Md. Rashidul Hasan : [email protected] Copyright ©2020 by authors and BAURES. This work is licensed under the Creative Commons Attribution International License (CC By 4.0). Introduction Bangladesh is a densely populated country and its population is increasing. The projected population was 163.08 million in the year 2017 and 165.21 million in the year 2018 (BBS, 2016). So, it is necessary to increase food production for the country’s increasing population. Agriculture is the main source of income and employment for the poor people. Agriculture is an important component in the GDP of Bangladesh and it contributed 14.17% of GDP in the year 2016-2017 (BBS, 2017). Vegetables and crops sub-sector also contributes an important share to the agricultural GDP which is near about 9.71 % (BER, 2018). Vegetable contributes an important share of the total agricultural export in Bangladesh (Islam et al., 2020). Moreover, this country is still shortage of per capita vegetable consumption against per capita vegetable requirement. Per capita vegetable consumption is 166.1 grams per day whereas per capita consumption of fruits is 44.8 grams. WHO/FAO minimum recommended level of vegetables and fruits is 400 grams per day (FAO, 2014). So, it is necessary to increase the production of vegetables and fruits to reach the recommended level of consumption. Farmers produce vegetables for their own consumption and sell. Vegetables are important for the economic and nutritional point of view (Akter et al., 2011). Farmers who are engaged in the production of vegetables often earn higher incomes than those engaged in the production of cereal crops alone (Weinberger and Lumpkin, 2005). Moreover, fresh vegetables are important sources of vitamin and minerals (Hasan et al., 2014a). In Bangladesh, vegetables are grown in two different seasons, one is summer (Kharif) vegetables and another is winter (Rabi) vegetables. The major winter
Transcript of Journal of Bangladesh Agricultural University ...
Cite This Article
Hasan, M.R., Islam, M.A., Kameyama, H., Bau, H. 2020. Profitability and Technical Efficiency of Vegetable Production in Bangladesh. Journal of Bangladesh Agricultural University, 18(4): 1042–1053. https://doi.org/10.5455/JBAU.8013
J Bangladesh Agril Univ 18(4): 1042–1053, 2020 https://doi.org/10.5455/JBAU.8013
ISSN 1810-3030 (Print) 2408-8684 (Online)
Journal of Bangladesh Agricultural University
Journal home page: http://baures.bau.edu.bd/jbau
Profitability and Technical Efficiency of Vegetable Production in Bangladesh
Md. Rashidul Hasan1, M. Ariful Islam2, Hiroshi Kameyama3, Hu Bai4 1Department of Agribusiness and Marketing, Sher-e-Bangla Agricultural University, Dhaka, Bangladesh 2Agricultural Economics Division, Bangladesh Rice Research Institute (BRRI), Gazipur, Bangladesh 3Faculty of Agriculture, Kagawa University, 2393 Ikenobe, Miki, Kagawa, Japan 4Faculty of Agriculture, Ehime University, 3-5-7 Tarumi, Matsuyama, Ehime 790-8566, Japan
ARTICLE INFO ABSTRACT
There is a substantial variation in profitability and efficiency among vegetables farms in Bangladesh. This study examined the level of profitability and technical efficiency of bean, brinjal and tomato production in Bangladesh. The study documented the crucial problems of vegetables producing farms. Data were collected through a field survey of 213 vegetable farmers selected by multi-stage random sampling technique in three districts from May to July 2014. Profitability of vegetable was analyzed using conventional farm income of farmers and the Benefit-Cost Ratio (BCR). Cobb-Douglas stochastic frontier production function model was used to estimate the farm level technical efficiencies. Analysis found that farmer’s average age was 44.4 years. They had 5.51 years of education, 1.42 numbers of agricultural training and 12.2 years of farming experience. Results showed that total costs were Tk. 196,198 (US$ 2,312.56)/ha for bean, Tk. 220,047 (US$ 2,593.66)/ha for brinjal, and Tk. 240,063 (US$ 2,829.59)/ha for tomato production. Net margin was Tk. 28,601 (US$ 337.11)/ha for bean, Tk. 36,557 (US$ 430.89)/ha for brinjal and Tk. 49,762 (US$ 586.53)/ha for tomato production. The net margin and the BCR indicated that the above mentioned vegetables were profitable in the study areas. Cobb-Douglas stochastic frontier production function indicated that agricultural training and number of adult households reduce the vegetable producers’ inefficiency. Overall technical efficiency was 87.3 % and there is opportunity for increasing technical efficiency by taking different management practices. Lack of capital and low prices of vegetables were the major problem of farmers. Department of Agricultural Extension (DAE) may provide some training to the farmers about storage of vegetables to ensure fair price of vegetables. Government may provide loan with a low interest rate which may solve capital shortage of farmers. There is scope for same type of further research in other vegetables producing districts in Bangladesh.
Article history Received: 06 Oct 2020
Accepted: 25 Nov 2020 Published: 30 Dec 2020
Keywords Vegetables,
Profitability,
Benefit-Cost Ratio, Technical efficiency
Correspondence Md. Rashidul Hasan
Copyright ©2020 by authors and BAURES. This work is licensed under the Creative Commons Attribution International License (CC By 4.0).
Introduction
Bangladesh is a densely populated country and its population is increasing. The projected population was 163.08 million in the year 2017 and 165.21 million in the year 2018 (BBS, 2016). So, it is necessary to increase food production for the country’s increasing population. Agriculture is the main source of income and employment for the poor people. Agriculture is an important component in the GDP of Bangladesh and it contributed 14.17% of GDP in the year 2016-2017 (BBS, 2017). Vegetables and crops sub-sector also contributes an important share to the agricultural GDP which is near about 9.71 % (BER, 2018). Vegetable contributes an important share of the total agricultural export in Bangladesh (Islam et al., 2020). Moreover, this country is still shortage of per capita vegetable consumption against per capita vegetable requirement. Per capita
vegetable consumption is 166.1 grams per day whereas per capita consumption of fruits is 44.8 grams. WHO/FAO minimum recommended level of vegetables and fruits is 400 grams per day (FAO, 2014). So, it is necessary to increase the production of vegetables and fruits to reach the recommended level of consumption. Farmers produce vegetables for their own consumption and sell. Vegetables are important for the economic and nutritional point of view (Akter et al., 2011). Farmers who are engaged in the production of vegetables often earn higher incomes than those engaged in the production of cereal crops alone (Weinberger and Lumpkin, 2005). Moreover, fresh vegetables are important sources of vitamin and minerals (Hasan et al., 2014a). In Bangladesh, vegetables are grown in two different seasons, one is summer (Kharif) vegetables and another is winter (Rabi) vegetables. The major winter
Hasan et al.
1043
vegetables are winter brinjal, cauliflower, cabbage, water gourd, rabi pumpkin, tomato, radish, bean, bengali spinach, red amaranth, and carrot. Conversely, major summer vegetables are summer pumpkin, summer brinjal, lady’s finger, ridge gourd, bitter gourd, arum, ash gourd, cucumber, long bean, Indian spinach, snake gourd, sponge gourd, green papaya, and green banana. The area and production of summer vegetables are 191,477 hectares and 1660,993 metric tons respectively in the year 2016-2017 (BBS, 2017). In the same year, the area and production of winter vegetables are 217,872 hectares and 2363,939 metric tons respectively (BBS, 2017). The data imply that the area and production of vegetables in the country are increasing substantially in recent years. But sometimes farmers do not get expected price and profit by selling their vegetables. In the developing countries, these high-value crops tend to have higher profit variability due to variability in yields and prices (Weinberger and Genova II, 2005). It is necessary to investigate the level of profitability and technical efficiency in producing vegetables in Bangladesh. Some previous research highlights different aspect of vegetable production (Ogundari, and OJO, 2007; Adil et al., 2007; Lokapur et al., 2014; Shende and Meshram, 2015; Rajendran et al., 2015; Wahid et al., 2017; Kumar et al., 2018; Subedi et al., 2020) in different countries. Few socioeconomic studies were done earlier on some vegetables production (Mowla, 1998; Monayem et al., 1998; Ali et al., 2008; Khan et al., 2009; Nahar, 2009; Mamun et al., 2010; Zaman et al., 2010; Akter et al., 2011; Khayer et al., 2011, Somajpoti et al., 2016) in Bangladesh but no study emphasized on analyzing the profitability and technical efficiency of popular vegetables production at the same time in a single research in the well-known vegetables producing area. To overcome the existing research gap the present study is undertaken in three well-known vegetables producing districts namely Mymensingh, Rajshahi, and Cumilla in Bangladesh and three popular vegetables namely Bean, Brinjal and Tomato are selected. Key research questions of the present study are i) What are the socioeconomic characteristics of vegetable growers ii) Are vegetables production profitable for farmers? iii) Are vegetables farms fully efficient to produce different vegetables? iv) What are the problems of farmers to produce different vegetables? The broad objective of the present study is to examine the profitability and technical efficiency of different vegetables in Bangladesh. The specific objective of this research is to identify the socioeconomic characteristics of vegetable growers. The study assesses the level of profitability in selected vegetable and examines the efficiency of different vegetable producing farms. Finally, the study documents the crucial problems of vegetables producing farmers in
the study area. This study will help to formulate future research and policy, which will help to increase vegetables production in Bangladesh. Materials and Methods
The selection of area and vegetables were based on total production. According to BBS (2015) Dhaka division ranked second, Rajshahi division ranked fourth and Chattogram division ranked fifth in brinjal production in the year 2013-2014. Rajshahi division ranked first, Chattogram division ranked third and Dhaka division ranked fourth position in tomato production. Dhaka division ranked first and Chattogram division ranked third in bean production. Three districts namely, Mymensingh from Dhaka division, Rajshahi from Rajshahi division, and Cumilla from Chattogram division were purposively selected for the present study. According to BBS (2014) winter vegetables were ranked by the volume of production and tomato ranked first, brinjal ranked second and bean ranked eighth in the year 2013-2014. Three vegetables namely tomato, brinjal and bean were selected for the present study. The multi-stage random sampling technique was followed to select the sample. A total of 213 farmers were randomly selected from Char Kalibari village under Sadar Upazila of Mymensingh district, Quithipur village under Rajshahi Sadar Upazila of Rajshahi district and Nimshar village under Burichong Upazila of Cumilla district (presented in Table 1). Data were collected through field survey using a semi-structured interview schedule in the period of May to July 2014. Revenues and costs of vegetables were calculated for four months of the production season. Hasan et al. (2014b) used different equations to calculate the profitability of vegetables. The present study also used the similar equations to compute the profitability of different vegetables and the equations are as follows:
Total variable cost = Seed and seedling cost +
Power tiller cost + Hired labor cost + Fertilizer
cost + Pesticides cost + Irrigation cost + Bamboo
cost.
Total cost = Family labor cost + Total variable cost
+ Interest on operating capital + Land rent.
Total revenue = Total production × Average
selling price
Gross margin = Total revenue - Total variable cost
Net margin = Total revenue - Total cost
Benefit-Cost Ratio (Variable cost basis) =Total revenue
Total variable cost
Benefit-Cost Ratio (Total cost basis) =Total revenue
Total cost

Profitability and Farm Efficiency of Vegetable Production
1044
Table 1. Distribution of sample farmers in the study areas
Study areas No. of farms under each vegetable category
Total households Bean Brinjal Tomato
Mymensingh 24 30 21 75 Rajshahi - 30 24 54 Cumilla 24 30 30 84
Total 48 90 75 213
Cobb-Douglas production frontier model (Aigner et al., 1977) was used to estimate vegetables farm’s technical efficiency. The model was specified as Y = f (Xiβi) + εi i = 1, 2, ……………n (1) Where Y is output, Xi denotes the actual input vector, βi is a vector of parameters associated with Xi and ε is the error term that is composed of two elements. That is: ε = Vi – Ui (2) Where Vi is the symmetric disturbances assumed to be identically, independently, and normally distributed as N (0, σv
2). Ui is a one-sided error term that is independent of Vi and is normally distributed as (0, σu
2). Following Jondrow et al. (1982), technical efficiency estimation is given by the mean of the conditional distribution of inefficiency term Ui given ε; and thus defined by
E (Ui/εi) = σuσv
σ(
𝑓(εiλ)/σ
1−𝐹 (εiλ)/σ−
εiλ
σ) (3)
Where, λ = σu/ σv, σ2 = σu
2 + σv2 while f and F represent
the standard normal density and cumulative distribution function respectively evaluated at εjλ/σ. The farm-specific technical efficiency is defined in terms of observed output (Yi) to the corresponding frontier output (Yi
*) using the available technology derived from the result of the equation (3) as above as:
TEi = Yi/Yi* =
𝐸(Yi|𝑢i ,Xi)
𝐸(Yi|𝑢i =0,Xi) = E [exp (-Ui)/εi] (4)
TE takes value 0 to 1, where 0 indicates a fully inefficient farm and 1 indicates a fully efficient farm. The Cobb-Douglas functional form has been used by many researchers in the developing countries (Brave-Ureta et al., 1997; Ajibefun et al., 2002; Ogundari, K. and S. O. OJO, 2007; Aminu et al., 2013; Alam et al., 2011, Todsadee et al., 2012). The Cobb-Douglas functional form for the vegetable farms in the study area is specified as follows: In Yi = β0 + β1In X1i + β2In X2i + β3In X3i + β4In X4i + β5In X5i + β6In X6i + β7In X7i + β8In X8i + β9In X9i + β10In X10i + β11In X11i + β12In X12i + β13In X13i + β14In X14i +Vi –Ui (5)
Where, In = Natural logarithm, Yi = Vegetables yield (Kg/ha), X1 = Seed (Kg/ha), X2 = Power tiller cost (Tk. /ha), X3 = Family labor (man-days), X4 = Hired labor (man-days), X5 = TSP (Kg. /ha), X6 = DAP dummy using value 1 if the farmer used DAP, 0 for otherwise, X7 = MoP (Kg /ha), X8 = Zinc Sulfate dummy using value 1 if the farmer used Zinc Sulfate, 0 for otherwise, X9 = Gypsum dummy using value 1 if the farmer used Gypsum, 0 for otherwise, X10 = Boric Acid dummy using value 1 if farmer used Boric Acid, 0 for otherwise, X11 = Manure (kg/ha), X12 = Pesticides (liter/ha), X13 = Irrigation cost (Tk./ha), X14 = Land (ha), β0 = Constant, βi = Coefficient of parameter, i = 1, …………….,14, Vi is an independently and identically distributed random error and Ui is a non-negative variable, associated with technical inefficiency in production. i = 1, 2,…………, 213. Very few farmers used DAP, Zinc Sulfate, Gypsum, and Boric Acid and we used dummy variables for those inputs. “If zero cases are a significant proportion of the total number of sample observations, then the procedure may result in seriously biased estimators of the parameters of the production function. The problem can be solved by the use of a dummy variable such that efficient estimators are obtained using the full data set but no bias is introduced” (Battese et al., 1996 and Battese, 1997). The technical inefficiency effects, Ui was defined (Coelli, 1995) as: Ui = δ0 +δj Zi (6) Z1 = Age of farmer (years), Z2 = Farmer education (Years of schooling), Z3 = Extension contact dummy using value 1 if the farmer made contact with extension worker, 0 for otherwise, Z4 = Farm size (ha), Z5 = Received agricultural training dummy showing value 1 if the farmer is trained, 0 otherwise, Z6 = Adult household family members (number), Z7 = Credit dummy showing value 1 if farmer received any credit, 0 otherwise, δ0 = Constant, δj = Unknown parameters to be estimated, i = 1, ……………., j; i = 1, 2,…………, 213 These socioeconomic variables are included in the model to determine their possible influence on the cost inefficiency of the farms. We test the presence of cost inefficiency using generalized likelihood-ratio statistics, as follows:
Hasan et al.
1045
λ = - ln (Ho1
HA ) (7)
Where, Ho: Inefficiency does not exist in the model. HA: Inefficiency exists in the model. The vegetables producers were asked to give their opinion about the eight selected problems. The weights were given for each response and a four-point rating scale was used to rank each problem. Weights 0, 1, 2 and 3 stand for no problem confrontation, low problem confrontation, medium problem confrontation, and high problem confrontation respectively. By adding weights of responses to the problems, we get a problem confrontation score. The problem confrontation score ranges from 0 to 24, where 0 indicates ‘no problem’ and 24 indicating ‘highest problem’. Hossain and Miah, (2011) and Hasan et al., (2014b) used the Problem Confrontation Index (PCI) in their studies. The Problem Confrontation Index was computed by using the following formula: PCI= Ph×3 + Pm×2+Pl×1+Pn×0 (8) Where, PCI = Problem Confrontation Index, Ph= Percentage of farmers with “high problem”; Pm= Percentage of farmers with “moderate problem”, Pl= Percentage of farmers with “low problem”, Pn= Percentage of farmers with “no problem”; The Problem Confrontation Index of the individual problems could range from 0 to 300, where 0 indicates “no problem” and 300 indicating “high problem” confrontation. Results and Discussion
Socioeconomic characteristics of sample farmers
Data in Table 2 shows socioeconomic characteristics of farmers in different districts. Vegetable farmers’ average age was 44.4 years and the farmers had 5.51 years of education. Farmers got 1.42 numbers of agricultural training and they had 12.2 years of farming experience. On average, farmers contacted local extension workers 1.26 times for solving their problems. Farmers’ average farm size was 0.48 hectares and the survey plot area was 0.04 hectares. An average family size of the sample households was 3.24 and the average adult household member was 2.1. In the farmer’s family, 52.7% of members were dependent. On average, the farmer took Tk. 11,784.5 credits and 36.3% of farmers received credit from different sources. Structure of inputs used for bean production
Data in Table 3 shows the structure of inputs used in one hectare of land for bean production in different districts. On average, farmer’s used 6.4 kg seed, 139.25 man-days family labor and 140.75 man-days hired labor for bean production. They also used 505.01 kg urea, 313.69 kg
Triple Super Phosphate (TSP), 22.86 kg Diammonium Phosphate, 84.84 kg Muriate of Potash (MoP), 28.67 kg Zinc Sulfate, 1.28 kg Gypsum, and 8.36 kg Boric Acid. Urea is the main fertilizer used by the farmers and 469.29 kg urea used in Mymensingh and 540.74 kg in Cumilla district. On average, 358.33 kg cow dung, 64.94 liters pesticides, and 65.54 times irrigation were used. Structure of inputs used for brinjal production
Table 4 shows the structure of inputs used in a hectare of land for brinjal production in different districts. On average, farmer’s used 2.58 kg seed, 180.61 man-days family labor and 119.23 man-days hired labor. They used 514.92 kg urea, 216.99 kg Triple Super Phosphate (TSP), 43.69 kg Diammonium Phosphate, 85.16 kg Muriate of Potash (MoP), 42.44 kg Zinc Sulfate, and 6.78 kg Boric Acid. An average, 523.62 kg urea used in Mymensingh, 498.87 kg in Cumilla, and 522.27 kg in the Rajshahi district. On average, 1,112.12 kg cow dung, 76.22 liters pesticides, and 64.76 times irrigation were used. The table reveals that farmers of the Rajshahi district used more cow dung and pesticides than the farmers of Mymensingh and Cumilla district for brinjal production. Structure of inputs used for tomato production
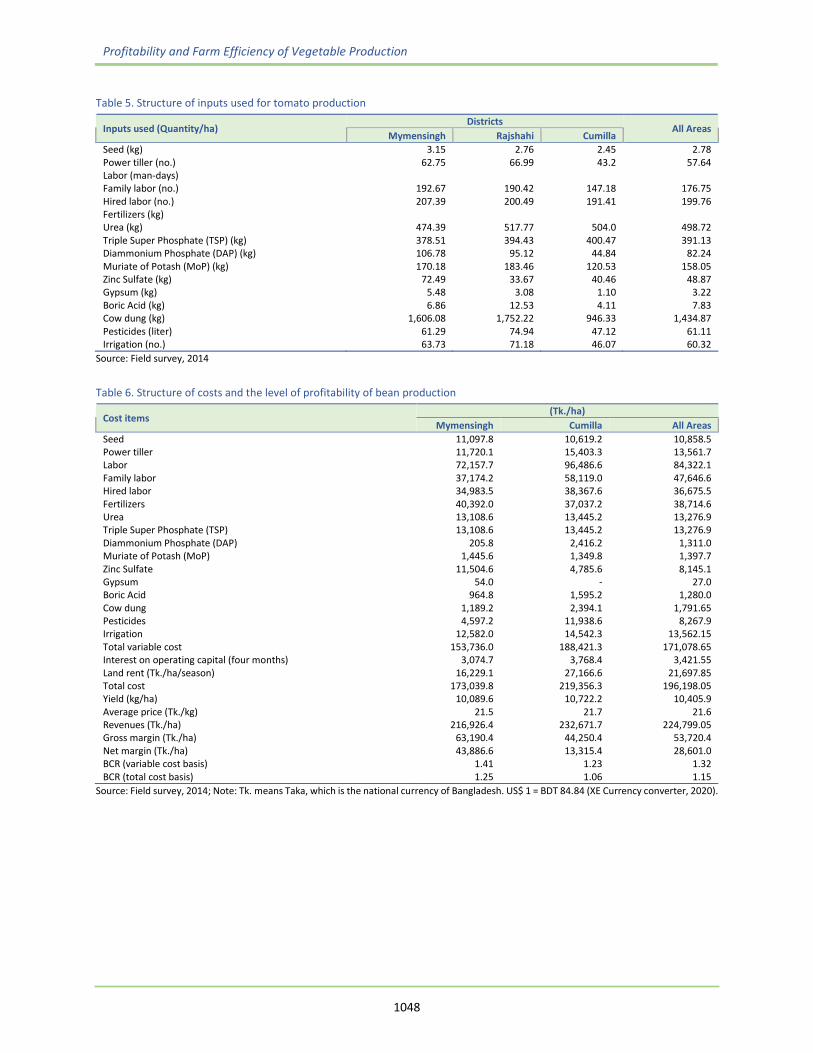
Table 5 shows the structure of inputs used in a hectare of land for tomato production in different districts. On average, farmer’s used 2.78 kg seed, 176.75 man-days family labor and 199.76 man-days hired labor. They used 498.72 kg urea, 391.13 kg Triple Super Phosphate (TSP), 82.24 kg Diammonium Phosphate, 158.05 kg Muriate of Potash (MoP), 48.87 kg Zinc Sulfate, 3.22 kg gypsum, and 7.83 kg Boric Acid. More urea used in Rajshahi than Mymensingh and Cumilla district. On average, 1,434.87 kg cow dung, 61.11 liters pesticides, and 60.32 times irrigation were used for tomato production. Farmers of the Rajshahi district used more cow dung and pesticides than the farmers of Mymensingh and Cumilla district. Profitability of bean production
Table 6 shows the profitability of bean production in Mymensingh and Cumilla districts. On average per hectare cost of seed, power tiller, labor, fertilizer, pesticide and irrigation were Tk. 10,859 (US$ 127.98)/ha, Tk. 13,562 (US$ 159.85)/ha, Tk. 84,322 (US$ 993.89)/ha, Tk. 38,715 (US$ 456.32)/ha, Tk. 8,268 (US$ 97.45)/ha and Tk. 13,562 (US$ 159.85)/ha. Total cost of bean production was Tk. 196,198 (US$ 2,312.56)/ha, and total revenues from bean was Tk. 224,799 (US$ 2649.68)/ha. Gross margin was Tk. 53,720 (US$ 633.19)/ha and net margin was Tk. 28,601 (US$ 337.11)/ha. BCR based on the variable cost was 1.32 and BCR based on the total cost was 1.15, which indicates that bean production was profitable in both districts. Bean production was more profitable in the Mymensingh than the Cumilla district.

Profitability and Farm Efficiency of Vegetable Production
1046
Bithi (2014) found that the total cost of bean production was Tk. 148,183/ha, gross margin was Tk. 242,500/ha, net margin was Tk. 94,317/ha and BCR was 1.63 in Gopalgonj district of Bangladesh. Chowdhuri et al.,
(2014) found that the total cost of bean production was Tk. 162,337/ha, gross margin was Tk. 347,028/ha, net margin was Tk. 184,691/ha and BCR was 2.14 in Narshingdi district of Bangladesh.
Table 2. Different socioeconomic characteristics of the sample farmers
Particulars Mymensingh Rajshahi Cumilla All Areas
Age (years) 43.5 45.3 44.4 44.4 Education (years) 4.1 6.4 6.05 5.51 Number of training (lifetime) 1.4 1.2 1.66 4.26 Years of farming experience 14.8 11.7 10.3 12.2 Extension contact (per year) 1.1 1.4 1.3 1.26 Farm size (hectare) 0.57 0.35 0.54 0.48 Survey plot area (hectare) 0.05 0.03 0.05 0.04 Family size (no.) 3.02 3.1 3.6 3.24 Adult household member (no.) 2.0 2.1 2.2 2.1 Household dependent member (%) 46.2 48.1 63.8 52.7 Formal Credit used (Tk.) 6,740.0 13,185.1 15,428.5 11,784.5 The average number of credit users 36.0 38.0 35.0 36.3
Source: Field survey, 2014
Table 3. Structure of inputs used for bean production
Inputs used (Quantity/ha) Districts
All areas Mymensingh Cumilla
Seed (kg) 6.2 6.6 6.4 Power tiller (no.) 44.73 58.28 51.5 Labor (man-days) Family labor (no.) 119.74 158.76 139.25 Hired labor (no.) 142.72 138.78 140.75 Fertilizers (kg) Urea (kg) 469.29 540.74 505.01 Triple Super Phosphate (TSP) (kg) 298.26 329.12 313.69 Diammonium Phosphate (DAP) (kg) 6.86 38.87 22.86 Muriate of Potash (MoP) (kg) 79.70 89.98 84.84 Zinc Sulfate (kg) 25.44 31.90 28.67 Gypsum (kg) 2.57 - 1.28 Boric Acid (kg) 6.43 10.29 8.36 Cow dung (kg) 237.84 478.82 358.33 Pesticides (liter) 40.76 89.12 64.94 Irrigation (no.) 55.76 75.33 65.54
Source: Field survey, 2014
Table 4. Structure of inputs used for brinjal production
Inputs used (Quantity/ha) Districts
All Areas Mymensingh Rajshahi Cumilla
Seed (kg) 2.40 3.09 2.25 2.58 Power tiller (no.) 33.65 40.32 37.0 36.99 Labor (man-days) Family labor (no.) 163.10 214.04 164.71 180.61 Hired labor (no.) 119.61 88.98 149.11 119.23 Fertilizers (kg) Urea (kg) 523.62 522.27 498.87 514.92 Triple Super Phosphate (TSP) (kg) 240.46 200.91 209.61 216.99 Diammonium Phosphate (DAP) (kg) 39.78 68.78 22.53 43.69 Muriate of Potash (MoP) (kg) 79.76 99.78 75.95 85.16 Zinc Sulfate (kg) 59.14 40.06 28.14 42.44 Gypsum (kg) - - - - Boric Acid (kg) 6.86 6.86 6.62 6.78 Cow dung (kg) 1,160.24 1,255.24 920.89 1,112.12 Pesticides (liter) 66.61 89.53 72.54 76.22 Irrigation (no.) 57.03 78.38 58.88 64.76
Source: Field survey, 2014
Hasan et al.
1047
Profitability of brinjal production
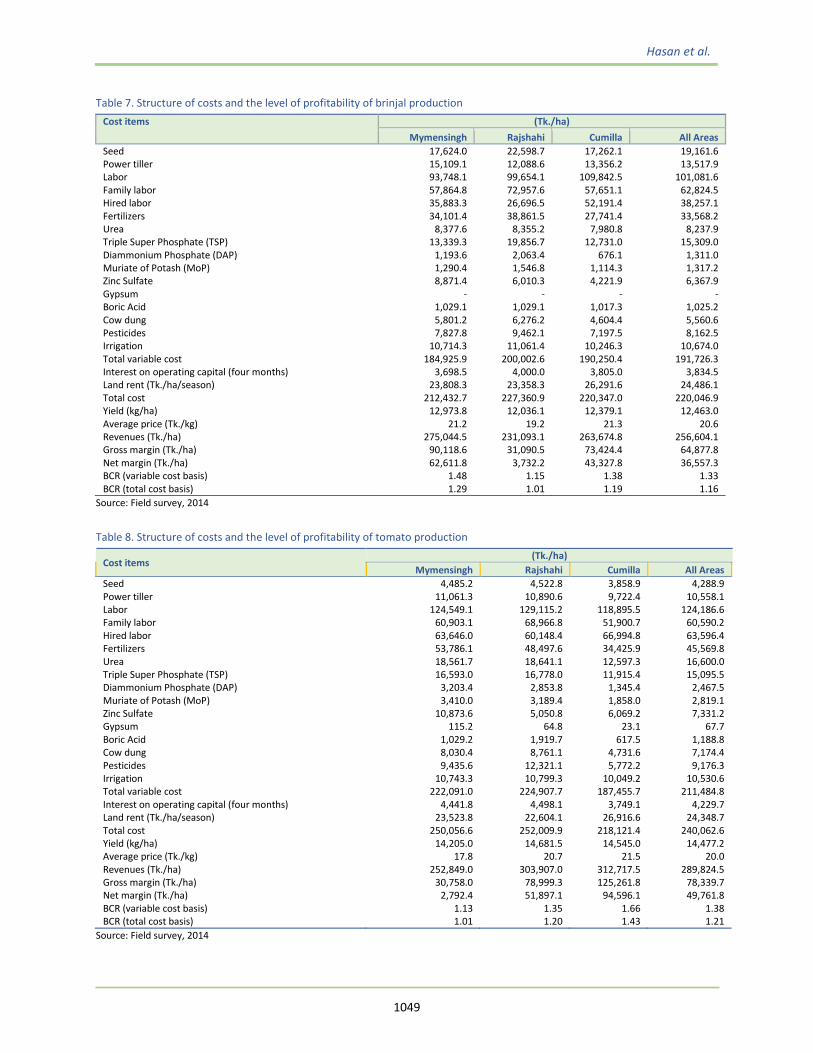
Table 7 shows the profitability of brinjal production in different districts. On average, per hectare cost of seed, power tiller, labor, fertilizer, pesticides and irrigation were Tk. 19,162 (US$ 225.85)/ha, Tk. 13,518 (US$ 159.33)/ha, Tk. 101,082 (US$ 1,191.43)/ha, Tk. 33,568 (US$ 395.66)/ha, Tk. 8,163 (US$ 96.21)/ha and Tk. 10,674 (US$ 125.81)/ha respectively. Total cost of brinjal production was Tk. 220,047 (US$ 2,593.66)/ha, and total revenues from brinjal was Tk. 256,604 (US$ 3,024.56)/ha. Gross margin was Tk. 64,878 (US$ 764.70)/ha and net margin was Tk. 36,557 (US$ 430.89)/ha. BCR based on the variable cost was 1.33 and BCR based on the total cost was 1.16, which indicates that brinjal production was profitable in three districts. Brinjal production was more profitable in Mymensingh than Cumilla and Rajshahi district. Chowdhuri et al., (2014) found that total cost of brinjal production was Tk. 241,277/ha, gross margin was Tk. 483,500/ha, net margin was Tk. 242,223/ha and BCR was 2.0 in Narshingdi district of Bangladesh. Rahman et al., (2016) found that total cost of brinjal production was Tk. 144,656/ha, gross margin was Tk. 461,954/ha, net margin was Tk. 317,298/ha and BCR was 3.29 in Jamalpur district of Bangladesh. Profitability of tomato production
Table 8 shows the profitability of tomato production in different districts. On average, per hectare cost of seed, power tiller, labor, fertilizer, pesticides and irrigation were Tk. 4,289 (US$ 50.55)/ha, Tk. 10,558 (US$ 124.44)/ha, Tk. 124,187 (US$ 1,463.77)/ha, Tk. 45,570 (US$ 537.12)/ha, Tk. 9,176 (US$ 108.16)/ha and Tk. 10,531 (US$ 124.12)/ha respectively. Total cost of tomato production was Tk. 240,063 (US$ 2,829.59)/ha, and total revenues from tomato was Tk. 289,825 (US$ 3,416.13)/ha. Gross margin was Tk. 78,340 (US$ 923.38)/ha and net margin was Tk. 49,762 (US$ 586.53)/ha. BCR based on the variable cost was 1.38 and BCR based on the total cost was 1.21, which indicates that tomato production was profitable in three districts. Tomato production was more profitable in Cumilla than Mymensingh and Rajshahi district. Hajong et al., (2018) found that the total cost of summer tomato production was Tk. 584,822/ha, gross margin was Tk. 1542,300/ha, net margin was Tk. 957,478/ha and BCR was 2.64 in Jashore district of Bangladesh. Mitra and Sharmin, (2019) found that total cost of tomato production was Tk. 228,058/ha, gross margin was Tk. 526,664/ha, net margin was Tk. 298,606/ha and BCR was 2.31 in Mymensingh district of Bangladesh. Efficiency of vegetables producing farms
The maximum likelihood estimates of the parameters for the Cobb-Douglas frontier production function is
presented in Table 9. We specified the model using a double log form and normalized by urea fertilizer amount to satisfy the homogeneity condition. The estimated coefficients of the variable labor (both family and hired), TSP, and irrigation were positive and significant at the 1% level. An increase in the magnitude of labor, TSP and irrigation would result in a corresponding increase of the vegetable yield. However, the sign of the estimated coefficient of power tiller was negative and statistically significant at the 10% level. An increase in the magnitude of power tiller cost would decrease in a corresponding vegetable yield. This result is not logical. It might be due to most of the farmers’ rent power tiller from other power tiller owner farmers. Sometimes they imposed more money per unit of land and farmers had to pay more money. Among the inefficiency factors (equation 6), the coefficients of agricultural training (dummy) and the number of adult members were negative and significant at the 10% level. The estimated coefficient of agricultural training (dummy) was negative indicating that if the farmers received more agricultural training, their inefficiency in vegetable production would decrease. The estimated coefficient of adult household members indicated that the availability of more adult members in the household would decrease the level of inefficiency in vegetable production substantially. The overall producers’ technical efficiency was 87.3 %, implying that there is scope for increasing the efficiency of the vegetable farms by taking different management practices. Mitra and Yunus, (2018) found that technical efficiency of tomato farms was 0.83 imply that tomato farmers can reduce their input use by 17% to get the same level of output. The study found that education, training, and high yielding variety adoption had a positive effect on efficiency while the age of tomato farmers had a negative effect on efficiency. Khandoker et al., (2016) found that the cost of labor, land preparation, seed, TSP, farming experience had a positive and significant effect on bean production in different areas of Bangladesh. They also found that the cost of labor, land preparation, insecticides, education and experience had a positive and significant effect on brinjal production. The frequency distribution of farms efficiency
The frequency distribution of technical efficiency estimates is shown in Table 10. The technical efficiencies (TE) range between 0.36 and 0.97, with a mean of 0.87. Only one farm had a technical efficiency range between 0.36 – 0.50 and six vegetable farms have technical efficiencies range between 0.50 – 0.70. The highest number of farms had technical efficiencies range between 0.71 - 0.90 and 122 vegetable farms belong in this group.
Profitability and Farm Efficiency of Vegetable Production
1048
Table 5. Structure of inputs used for tomato production
Inputs used (Quantity/ha) Districts
All Areas Mymensingh Rajshahi Cumilla
Seed (kg) 3.15 2.76 2.45 2.78 Power tiller (no.) 62.75 66.99 43.2 57.64 Labor (man-days) Family labor (no.) 192.67 190.42 147.18 176.75 Hired labor (no.) 207.39 200.49 191.41 199.76 Fertilizers (kg) Urea (kg) 474.39 517.77 504.0 498.72 Triple Super Phosphate (TSP) (kg) 378.51 394.43 400.47 391.13 Diammonium Phosphate (DAP) (kg) 106.78 95.12 44.84 82.24 Muriate of Potash (MoP) (kg) 170.18 183.46 120.53 158.05 Zinc Sulfate (kg) 72.49 33.67 40.46 48.87 Gypsum (kg) 5.48 3.08 1.10 3.22 Boric Acid (kg) 6.86 12.53 4.11 7.83 Cow dung (kg) 1,606.08 1,752.22 946.33 1,434.87 Pesticides (liter) 61.29 74.94 47.12 61.11 Irrigation (no.) 63.73 71.18 46.07 60.32
Source: Field survey, 2014
Table 6. Structure of costs and the level of profitability of bean production
Cost items (Tk./ha)
Mymensingh Cumilla All Areas
Seed 11,097.8 10,619.2 10,858.5 Power tiller 11,720.1 15,403.3 13,561.7 Labor 72,157.7 96,486.6 84,322.1 Family labor 37,174.2 58,119.0 47,646.6 Hired labor 34,983.5 38,367.6 36,675.5 Fertilizers 40,392.0 37,037.2 38,714.6 Urea 13,108.6 13,445.2 13,276.9 Triple Super Phosphate (TSP) 13,108.6 13,445.2 13,276.9 Diammonium Phosphate (DAP) 205.8 2,416.2 1,311.0 Muriate of Potash (MoP) 1,445.6 1,349.8 1,397.7 Zinc Sulfate 11,504.6 4,785.6 8,145.1 Gypsum 54.0 - 27.0 Boric Acid 964.8 1,595.2 1,280.0 Cow dung 1,189.2 2,394.1 1,791.65 Pesticides 4,597.2 11,938.6 8,267.9 Irrigation 12,582.0 14,542.3 13,562.15 Total variable cost 153,736.0 188,421.3 171,078.65 Interest on operating capital (four months) 3,074.7 3,768.4 3,421.55 Land rent (Tk./ha/season) 16,229.1 27,166.6 21,697.85 Total cost 173,039.8 219,356.3 196,198.05 Yield (kg/ha) 10,089.6 10,722.2 10,405.9 Average price (Tk./kg) 21.5 21.7 21.6 Revenues (Tk./ha) 216,926.4 232,671.7 224,799.05 Gross margin (Tk./ha) 63,190.4 44,250.4 53,720.4 Net margin (Tk./ha) 43,886.6 13,315.4 28,601.0 BCR (variable cost basis) 1.41 1.23 1.32 BCR (total cost basis) 1.25 1.06 1.15
Source: Field survey, 2014; Note: Tk. means Taka, which is the national currency of Bangladesh. US$ 1 = BDT 84.84 (XE Currency converter, 2020).
Hasan et al.
1049
Table 7. Structure of costs and the level of profitability of brinjal production
Cost items (Tk./ha)
Mymensingh Rajshahi Cumilla All Areas
Seed 17,624.0 22,598.7 17,262.1 19,161.6 Power tiller 15,109.1 12,088.6 13,356.2 13,517.9 Labor 93,748.1 99,654.1 109,842.5 101,081.6 Family labor 57,864.8 72,957.6 57,651.1 62,824.5 Hired labor 35,883.3 26,696.5 52,191.4 38,257.1 Fertilizers 34,101.4 38,861.5 27,741.4 33,568.2 Urea 8,377.6 8,355.2 7,980.8 8,237.9 Triple Super Phosphate (TSP) 13,339.3 19,856.7 12,731.0 15,309.0 Diammonium Phosphate (DAP) 1,193.6 2,063.4 676.1 1,311.0 Muriate of Potash (MoP) 1,290.4 1,546.8 1,114.3 1,317.2 Zinc Sulfate 8,871.4 6,010.3 4,221.9 6,367.9 Gypsum - - - - Boric Acid 1,029.1 1,029.1 1,017.3 1,025.2 Cow dung 5,801.2 6,276.2 4,604.4 5,560.6 Pesticides 7,827.8 9,462.1 7,197.5 8,162.5 Irrigation 10,714.3 11,061.4 10,246.3 10,674.0 Total variable cost 184,925.9 200,002.6 190,250.4 191,726.3 Interest on operating capital (four months) 3,698.5 4,000.0 3,805.0 3,834.5 Land rent (Tk./ha/season) 23,808.3 23,358.3 26,291.6 24,486.1 Total cost 212,432.7 227,360.9 220,347.0 220,046.9 Yield (kg/ha) 12,973.8 12,036.1 12,379.1 12,463.0 Average price (Tk./kg) 21.2 19.2 21.3 20.6 Revenues (Tk./ha) 275,044.5 231,093.1 263,674.8 256,604.1 Gross margin (Tk./ha) 90,118.6 31,090.5 73,424.4 64,877.8 Net margin (Tk./ha) 62,611.8 3,732.2 43,327.8 36,557.3 BCR (variable cost basis) 1.48 1.15 1.38 1.33 BCR (total cost basis) 1.29 1.01 1.19 1.16
Source: Field survey, 2014
Table 8. Structure of costs and the level of profitability of tomato production
Cost items (Tk./ha)
Mymensingh Rajshahi Cumilla All Areas
Seed 4,485.2 4,522.8 3,858.9 4,288.9 Power tiller 11,061.3 10,890.6 9,722.4 10,558.1 Labor 124,549.1 129,115.2 118,895.5 124,186.6 Family labor 60,903.1 68,966.8 51,900.7 60,590.2 Hired labor 63,646.0 60,148.4 66,994.8 63,596.4 Fertilizers 53,786.1 48,497.6 34,425.9 45,569.8 Urea 18,561.7 18,641.1 12,597.3 16,600.0 Triple Super Phosphate (TSP) 16,593.0 16,778.0 11,915.4 15,095.5 Diammonium Phosphate (DAP) 3,203.4 2,853.8 1,345.4 2,467.5 Muriate of Potash (MoP) 3,410.0 3,189.4 1,858.0 2,819.1 Zinc Sulfate 10,873.6 5,050.8 6,069.2 7,331.2 Gypsum 115.2 64.8 23.1 67.7 Boric Acid 1,029.2 1,919.7 617.5 1,188.8 Cow dung 8,030.4 8,761.1 4,731.6 7,174.4 Pesticides 9,435.6 12,321.1 5,772.2 9,176.3 Irrigation 10,743.3 10,799.3 10,049.2 10,530.6 Total variable cost 222,091.0 224,907.7 187,455.7 211,484.8 Interest on operating capital (four months) 4,441.8 4,498.1 3,749.1 4,229.7 Land rent (Tk./ha/season) 23,523.8 22,604.1 26,916.6 24,348.7 Total cost 250,056.6 252,009.9 218,121.4 240,062.6 Yield (kg/ha) 14,205.0 14,681.5 14,545.0 14,477.2 Average price (Tk./kg) 17.8 20.7 21.5 20.0 Revenues (Tk./ha) 252,849.0 303,907.0 312,717.5 289,824.5 Gross margin (Tk./ha) 30,758.0 78,999.3 125,261.8 78,339.7 Net margin (Tk./ha) 2,792.4 51,897.1 94,596.1 49,761.8 BCR (variable cost basis) 1.13 1.35 1.66 1.38 BCR (total cost basis) 1.01 1.20 1.43 1.21
Source: Field survey, 2014

Profitability and Farm Efficiency of Vegetable Production
1050
Table 9. Maximum likelihood estimates of Cobb-Douglas stochastic frontier production model
Name of variables Coefficients Robust SE P>|z|
Constant 2.97 0.612 0.353 lnSeed 0.36NS 2.60 0.887 lnPower tiller -0.087* 0.05 0.092 Labor (man-days) lnFamily labor 0.94*** 0.193 0.000 lnHired labor 1.21*** 0.172 0.000 Fertilizers lnTriple Super Phosphate (TSP) 0.36*** 0.123 0.003 lnDiammonium Phosphate dummy (DAP) 0.096** 0.047 0.041 lnMuriate of Potash (MoP) 0.041NS 0.102 0.684 lnZinc Sulfate dummy -0.029NS 0.037 0.437 lnGypsum dummy -0.064NS 0.106 0.546 lnBoric Acid dummy 0.0002NS 0.053 0.997 lnCow dung 0.054NS 0.049 0.279 lnPesticides -0.388NS 0.243 0.111 lnIrrigation 0.124*** 0.048 0.010 lnLand -0.045NS 0.062 0.472
Inefficiency variables
Age of respondent (years) 0.037NS 0.029 0.207 Farmer education (Years of schooling) 0.10NS 0.11 0.381 Extension contact (dummy) -0.455NS 0.51 0.377 Farm size (ha) -0.89NS 0.50 0.991 Received agricultural training (dummy) -0.009* 0.86 0.074 Adult members in the household -1.27* 0.68 0.062 Credit dummy 0.17NS 0.40 0.664 Constant -1.98NS 2.13 0.353 Mean efficiency 87.3%
Diagnostic statistics
Log pseudo-likelihood 36.03 Wald chi-square 600.56*** Sigma square-v (σ2
v) -3.686999*** 0.2701283 Sigma square-u (σ2
u) -2.813792*** 0.3516889
Lamda (λ = 𝛅𝐯
𝛅𝐮 ) 1.54 0.061
Likelihood ratio test H0: δu=0 (H0 = no inefficiency in the model)
4.83**
Number of observation 213 ***,**and*indicates significance at the 1%,5%and 10% levels of probability respectively and NS = not significant
Table 10.Summary of farmers’ technical efficiency of different vegetable-growing farms
Efficiency level Technical efficiency
Frequency Percentage
0.36-0.50 1 0.47 0.51-0.70 6 2.82 0.71-0.90 122 57.28 0.91-0.97 84 39.44 Mean efficiency 0.87 Minimum 0.37 Maximum 0.97
Source: Field survey, 2014
Hasan et al.
1051
Table 11. Major problems of vegetables production
Items of problems
Mymensingh (n=75)
Percentage of farmers PCI
Rank order
No Low Moderate High
Lack of capital 14.7 0 29.3 56.0 226.6 1
Low prices of vegetables 16.0 0 26.7 57.3 225.3 2
Price fluctuation 38.6 4.0 18.7 38.7 157.5 3
Lack of storage facilities 13.4 37.3 37.3 12.0 147.9 4
High prices of inputs 48.0 5.3 25.4 21.3 120.0 5
Disease damage 21.3 50.7 22.7 5.3 112.0 6
Insect damage 56.0 22.7 16.0 5.3 70.6 7
Unavailability of inputs 66.7 20.0 12.0 1.3 47.9 8
Rajshahi (n = 54)
Low prices of vegetables 16.7 0 25.9 57.4 224.0 1
Lack of capital 18.5 9.3 31.5 40.7 194.4 2
Price fluctuation 27.8 12.9 27.8 31.5 163.0 3
High prices of inputs 27.8 11.1 37.0 24.1 157.4 4
Disease damage 22.2 42.6 31.5 3.7 116.7 5
Lack of storage facilities 48.2 14.8 25.9 11.1 99.9 6
Insect damage 38.9 44.4 16.7 0 77.8 7
Unavailability of inputs 79.6 11.1 7.4 1.9 31.6 8
Cumilla (n = 84)
Low prices of vegetables 19.1 2.4 23.8 54.7 214.1 1
Lack of capital 27.4 0 20.2 52.4 197.6 2
Price fluctuation 25.0 8.3 29.8 36.9 178.6 3
High prices of inputs 32.1 3.6 28.6 35.7 167.9 4
Disease damage 19.0 46.4 29.8 4.8 120.4 5
Lack of storage facilities 36.9 30.9 27.4 4.8 100.1 6
Unavailability of inputs 47.6 38.1 14.3 0 66.7 7
Insect damage 66.7 19.0 13.1 1.2 48.8 8
Source: Field survey, 2014
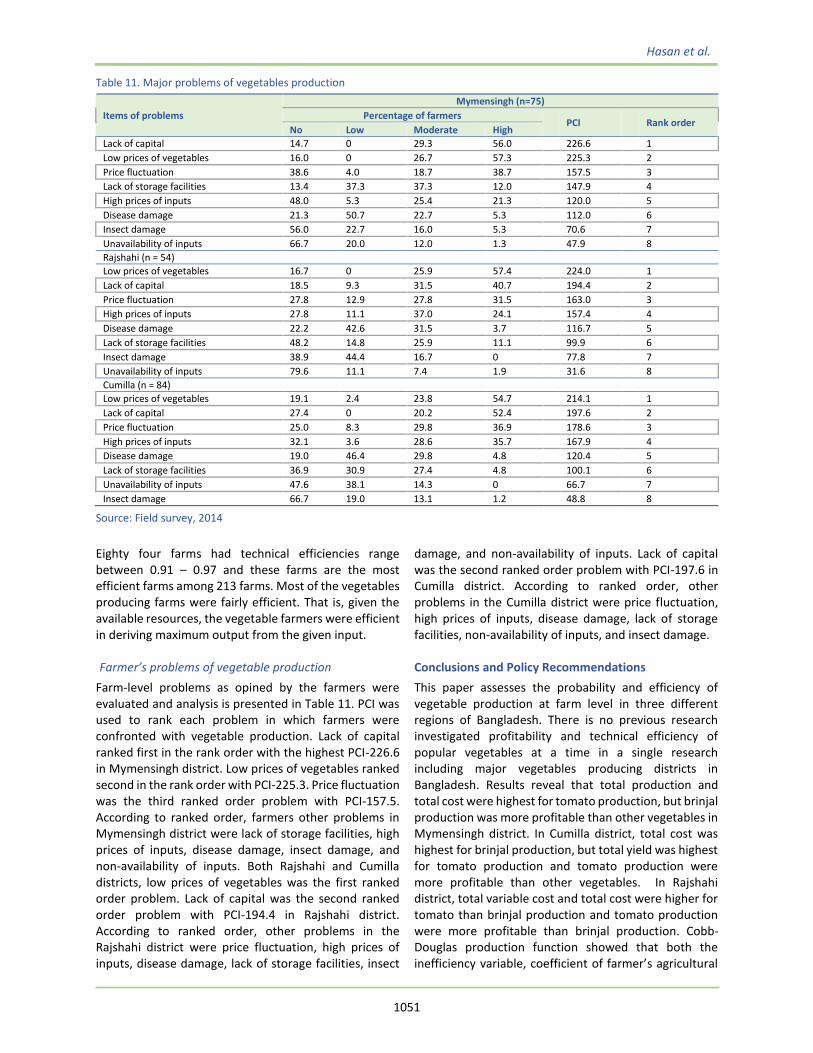
Eighty four farms had technical efficiencies range between 0.91 – 0.97 and these farms are the most efficient farms among 213 farms. Most of the vegetables producing farms were fairly efficient. That is, given the available resources, the vegetable farmers were efficient in deriving maximum output from the given input. Farmer’s problems of vegetable production
Farm-level problems as opined by the farmers were evaluated and analysis is presented in Table 11. PCI was used to rank each problem in which farmers were confronted with vegetable production. Lack of capital ranked first in the rank order with the highest PCI-226.6 in Mymensingh district. Low prices of vegetables ranked second in the rank order with PCI-225.3. Price fluctuation was the third ranked order problem with PCI-157.5. According to ranked order, farmers other problems in Mymensingh district were lack of storage facilities, high prices of inputs, disease damage, insect damage, and non-availability of inputs. Both Rajshahi and Cumilla districts, low prices of vegetables was the first ranked order problem. Lack of capital was the second ranked order problem with PCI-194.4 in Rajshahi district. According to ranked order, other problems in the Rajshahi district were price fluctuation, high prices of inputs, disease damage, lack of storage facilities, insect
damage, and non-availability of inputs. Lack of capital was the second ranked order problem with PCI-197.6 in Cumilla district. According to ranked order, other problems in the Cumilla district were price fluctuation, high prices of inputs, disease damage, lack of storage facilities, non-availability of inputs, and insect damage. Conclusions and Policy Recommendations
This paper assesses the probability and efficiency of vegetable production at farm level in three different regions of Bangladesh. There is no previous research investigated profitability and technical efficiency of popular vegetables at a time in a single research including major vegetables producing districts in Bangladesh. Results reveal that total production and total cost were highest for tomato production, but brinjal production was more profitable than other vegetables in Mymensingh district. In Cumilla district, total cost was highest for brinjal production, but total yield was highest for tomato production and tomato production were more profitable than other vegetables. In Rajshahi district, total variable cost and total cost were higher for tomato than brinjal production and tomato production were more profitable than brinjal production. Cobb-Douglas production function showed that both the inefficiency variable, coefficient of farmer’s agricultural
Profitability and Farm Efficiency of Vegetable Production
1052
training (dummy) and adult household size (number) were negative and significant at the 10% level. It implied that more agricultural training (dummy) and more adult household size may raise the vegetable producers’ efficiency. It is evident that the vegetable producers’ efficiency may increase by increasing farmer’s agricultural training in the study area. The overall technical efficiency was 87.3 % and still, there is some scope for increasing the farm’s efficiency. Farmer’s mentioned different problems for producing vegetables in the study area. Based on the findings of the study the following recommendation may be followed to increase vegetables production in Bangladesh: i. The study found that the vegetable farms
efficiency increased by increasing farmer’s
agricultural training in the study area. So it is
necessary to increase training facilities for the
farmers by the government organizations and
NGOs to increase farm’s efficiency.
ii. The research found that vegetable farms are not
fully efficient in production and still, there is some
scope to increase the farm’s efficiency by using
efficient management practices and efficient use
of inputs.
iii. According to the farmers’ opinion, there were
several problems in vegetable production, and out
of those, lack of capital, low prices of vegetables,
and price fluctuation, were the important ones.
Lack of capital may be solved by agricultural policy
to provide farmers credit with a low-interest rate.
Low prices of vegetables and price fluctuation may
be solved to give training to the farmers about
modern storage technologies and marketing
practices by DAE.
iv. Finally, government continuous support and
favorable agricultural policy will increase
vegetable production in Bangladesh.
Conflict of Interests
The authors declare that there is no conflict of interests regarding the publication of this paper. References
Adil, S.A., Chattha, M.W.A., Hassan, S., and Maqbool, A., 2007. Economics of vegetable production by farm location. Pakistan Journal of Agricultural Sciences, 44(1):179-183.
Aigner, D.J., Lovell, C.A.K., and Schmidt, P., 1977. Formulation and estimation of stochastic frontier function models. Journal of Econometrics, 6(1): 21-37.
Akter, A., Hoque, F., Mukul, A.Z.A., Kamal, M.R., and Rasha, R.K., 2016. Financial analysis of winter vegetables production in a selected area of Brahmanbaria district in Bangladesh. International Research Journal of Agricultural and Food Sciences, 1(6):120-127.
Akter, S., Islam, M.S., and Rahman, M.S., 2011. An economic analysis of winter vegetables production in some selected areas of Narsinghi district. Journal of the Bangladesh Agricultural University, 9(2): 241–246.
Alam, M.S., Islam, M.S., and Islam, M.A., 2011. Farmer’s efficiency enhancement through input management: The issue of USG application in modern rice. Bangladesh Journal of Agricultural Research, 36(1):129-141.
Ali, M.Y., Ahmed, M.M., and Islam, M.B., 2008. Homestead vegetable gardening: meeting the need of year round vegetable requirement of farm family. Paper presented in the National workshop on multiple cropping held at Bangladesh Agricultural Research Council, Farm gate, Dhaka-1215, Bangladesh.
Ajibefun, I. A., Battese, G. E., and Kada, R., 2002. Technical efficiency, technological change and productivity of hired and family labor in the Japanese rice industry. Empirical Economics Letters, 1(1): 21-31.
Aminu, F.O., Ayinde, I.A., and Ambali, O.I., 2013. Effect of ill health on technical efficiency of dry season vegetables farmers in Ojo local government area of Lagos State Nigeria. World Journal of Agricultural Research, 1(6): 108-113.
Bangladesh Bureau of Statistics (BBS), 2014. Yearbook of Agricultural Statistics of Bangladesh.
Agricultural Statistics Division, Ministry of planning, Government of the People’s Republic of Bangladesh, Dhaka, Bangladesh.
Bangladesh Bureau of Statistics (BBS), 2015. Yearbook of Agricultural Statistics of Bangladesh.
Agricultural Statistics Division, Ministry of planning, Government of the People’s Republic of Bangladesh, Dhaka, Bangladesh.
Bangladesh Bureau of Statistics (BBS), 2016. Statistical Pocketbook of Bangladesh. Statistics and Informatics Division, Ministry of Planning, Government of the People’s Republic of Bangladesh, Dhaka.
Bangladesh Bureau of Statistics (BBS), 2017. Yearbook of Agricultural Statistics of Bangladesh.
Agricultural Statistics Division, Ministry of planning, Government of the People’s Republic of Bangladesh, Dhaka, Bangladesh.
Bangladesh Economic Review (BER), 2018. Economic Adviser’s Wing. Finance Division,
Ministry of Finance, Government of the People’s Republic of Bangladesh, Dhaka, Bangladesh.
Battese, G.E., Malik, S. J., and Gill, M.A., 1996. An investigation of technical inefficiencies of production of wheat farmers in four districts of Pakistan. Journal of Agricultural Economics, 47(1): 37-49.
Battese, G.E., 1997. A note on the estimation of Cobb-Douglas production functions when some explanatory variables have zero values. Journal of Agricultural Economics, 48(2): 250-252.
Bithi, S.Z., 2014. Comparative economic analysis of bean and bottle gourd production in selected area of Gopalgonj district. M.S. Thesis, Department of Agricultural Economics, Sher-e-Bangla Agricultural University, Dhaka, Bangladesh.
Bravo-Ureta, Boris, E., and Antonio Pinheiro, E., 1997. Technical, economic and allocative efficiency in peasant farming: Evidence from the Dominican Republic. The Developing Economics, 35 (1): 48-67.
Coelli, T.J., 1995. Recent developments in frontier modeling and efficiency Measurement.
Australian Journal of Agricultural Economics, 39 (3): 219-245. Chowdhuri, N.Y., Haque, S., Shammi, S.A., Jannat, A., and Sannyashi,
P.R., 2014. Profitability analysis of winter vegetables production in a selected area of Narshingdi district in Bangladesh. Progressive Agriculture, 25: 47-53.
Food and Agriculture Organization of the United Nations (FAO), 2014. Country nutrition paper
Bangladesh, International conference on nutrition 21 years later, 19-20 November 2014, Rome, Italy.
Hajong, P., Sikder, B., Mondal, S., and Islam, M.A., 2018. Adoption and profitability of summer
Hasan et al.
1053
tomato cultivation in Jashore district of Bangladesh. Bangladesh Journal of Agricultural Research, 43(4): 575-585.
Hasan, M.R., Hu, B., and Islam, M. A., 2014a. Profitability of important summer vegetables in
Keranigonj Upazilla of Bangladesh. Journal of the Bangladesh Agricultural University, 12(1): 111–118.
Hasan, M.R., Mutatisse, A.A., Nakamoto, E., and Bai, H., 2014b. Profitability of cauliflower and bean production in Bangladesh. Bangladesh Journal of Extension Education, 26(1&2): 63-75.
Hossain, M.S., and Miah, M.A.M., 2011. Poor farmers’ problem confrontation in using manure towards integrated plant nutrition system. Bangladesh Journal of Extension Education, 23 (1&2): 139-147.
XE currency converter, 2020. Online currency converter. https://www.xe.com/currencyconverter/convert/?Amount=1&From=
USD&To=BDT (Accessed on 26/9/2020). Islam, M.S., Salehin, F., and Nayeem, A.R., 2020. Cauliflower cultivation
productivity and resource utilization of Agro-economics: A study on selected areas of Jamalpur district in Bangladesh. Globus An International Journal of Management and IT, 11(2): 10-16.
Jondrow, J., Lovell, C.A.K., Materov, V., and Schmidt, P., 1982. On the estimation of technical efficiency in the stochastic frontier production function model. Journal of Econometrics, 19 (2&3): 233-38.
Khan, M.H.A., Ali, M.Y., Quayyum, M.A., Nazrul, M.I., and Hossain, M.J., 2009. Year round homestead vegetable production: A means of reducing poverty and nutritional deficiency for small farm. Bangladesh Journal of Agricultural Research, 34(1): 169-174.
Khayer, U., Akhter, S., and Mondal, R.K., 2011. Comparative economics of bean and bottle gourd production in some selected areas of Bangladesh. Developing Country Studies, 1(2): 34-40.
Khandoker, S., Miah, M.A.M., Khatun, M., Akhter, N., and Kundu, N.D., 2016. Profitability and resource use efficiency of winter vegetables production in selected areas of Bangladesh. Bangladesh Research Publications Journal, 12(2): 127-137.
Kumar, A., Rohila, A.K., and Pal, V.K., 2018. Profitability and resource use efficiency in vegetable cultivation in Haryana: Application of Cobb-Douglas production model. Indian Journal of Agricultural Sciences, 88 (7): 153-157.
Lokapur, S., Kulkarni, G.N., Gamanagatti, P.B., and Gurikar, R., 2014. Resource use efficiency of major vegetables in Belgaum district in Karnataka. International Research Journal of Agricultural Economics and Statistics, 5(1): 108-110.
Mamun, M.H.A., Bashar, H.M.K., Islam, M.S., Howlader, M.H.K., and Hasan, M.S., 2010. A case study on homestead vegetables cultivation: food security and income. International Journal of Sustainable Crop Production, 5(1): 5-10.
Monayem, M.A., Rahman, A.K.M.M., Haque, A.K.M.H., and Jabbar, M.A., 1998. Economics of some winter vegetables production and their farm level marketing in five villages of Comilla District. Research report, Agricultural Economics Division, BARI, Joydebpur, Gazipur, Bangladesh.
Mowla, M.G., 1998. An economic analysis of some selected winter vegetables in a selected area of Norsingdi District. M.S. Thesis, Department of Agricultural Economics, Bangladesh
Agricultural University, Mymensingh, Bangladesh. Mitra, S., and Sharmin, S., 2019. Risk attitudes and financial profitability
of tomato farmers- A study in Bangladesh. Journal of Agricultural Sciences-Sri Lanka, 14(3): 207-217. doi.org/10.4038/jas.v14i3.8604
Mitra, S., and Yunus, M., 2018. Determinants of tomato farmers efficiency in Mymensingh district of Bangladesh: Data envelopment analysis approach. Journal of the Bangladesh Agricultural University, 16(1): 93-97.
Nahar, A., 2009. An economic study of year round vegetables production in selected areas of
Jessore District. M.S. Thesis, Department of Agricultural Economics, Bangladesh Agricultural University, Mymensingh, Bangladesh.
Ogundari, K. and Ojo, S.O., 2007. Economic efficiency of small scale food crop production in Nigeria: A Stochastic Frontier Approach. Journal of Social Sciences, 14(2): 123-130.
Rahman, M.Z., Kabir, H., and Khan, M., 2016. A study on brinjal production in Jamalpur district through profitability analysis and factors affecting the production. Journal of the Bangladesh Agricultural University, 14(1): 113-118.
Rajendran, S., Sefa, V.A., Karanja, D.K., Musebe, R., Romney, D., Makaranga, M.A., Samali,
S., and Kessy, R.F., 2015. Technical efficiency of traditional African vegetable production: A case study of smallholders in Tanzania. Journal of Development and Agricultural Economics, 7(3): 92-99.
Shende, N.V., and Meshram, R.R., 2015. American International Journal of Research in Formal, Applied and Natural Sciences, 11(1): 46-54.
Somajpoti, P., Ahmed, J.U., Mannaf, M., Mozahid, M.N., and Alam, 2016. Economics of cauliflower and cabbage production in selected areas of Sylhet district. Journal of the Sylhet Agricultural University, 3(2): 253-262.
Subedi, M., Pandey, M., Ojha, R.K., and Acharya, B., 2020. Production economics and resource use efficiency of tomato under open field condition in Kapilvastu, Nepal. Journal of Agriculture and Natural Resources, 3(1): 282-289.
Todsadee, A., Kameyama, H., Ngamsomsuk, K., and Yamauchi, K., 2012. Production efficiency of broiler farming in Thailand: A stochastic frontier approach. Journal of Agricultural Science, 4(12): 221-231.
Wahid, U., Ali, S., and Hadi, N.A., 2017. On the estimation of technical efficiency of tomato growers in Malakand. Sarhad Journal of Agriculture, 33(3): 357-365.
Weinberger, K., and Genova II., C.A., 2005. Vegetable production in Bangladesh:
Commercialization and rural livelihoods. Technical Bulletin no. 33, Taiwan: AVRDC-The World Vegetable Centre, Tainan, Taiwan.
Weinberger, K., and Lumpkin, T.A., 2005. Horticulture for poverty alleviation—the unfunded
revolution. Shanhua, Taiwan: AVRDC – The World Vegetable Center, AVRDC Publication No. 05-613, Working Paper No. 15, 20.
Zaman, M., Hemel, R.A., and Ferdous, T., 2010. Comparative profitability of winter vegetables in a selected area of Dhaka district, ASA University Review, 4(1): 217-223.