Journal of Applied Research on Industrial Engineering · Journal of Journal of Applied Research on...
14
Journal of Applied Research on Industrial Engineering Journal of Applied Research on Industrial Engineering Vol. 1, No. 5/6 (2014) 293-306 Proposing a Decision Making System in Three-Dimensional Concurrent Engineering by Considering the Investment Risk Soran Davoudi *1 , Mahmoud Shahrokhi 2 1 Department Of Industrial Engineering , Najafabad Branch, Islamic Azad University, Najaf abad, Iran ([email protected]) 2 Engineering Department, University of Kurdistan, Sanandaj, P. O. Box: 416, Iran ([email protected]) A B S T R A C T A R T I C L E I N F O One of the great challenges of most of the investment companies is the analysis of investment risk costs in the development of new products, in the initial stages of production. This study develops the appropriate methods for the analysis of kinds of investment risk costs, within the three-dimensional concurrent engineering. This study presents a suggested model based on multi- objective programming and multi-attribute decision-making. This model considers the qualitative and quantitative parameters relevant to the process of new product creation, such as supply chain parameters, and investment risk for each project in the early stages of product design. And at the end, it identifies and selects the best design with minimum of investment risk cost. Article history : Received: 9 September 2014 Received in revised format: 15 December 2014 Accepted: 20 December 2014 Available online: 30 December 2014 Keywords : Three-dimensional Concurrent Engineering, Multi-Attribute Decision Making ELECTRE III, Fuzzy Decision Making Method, Risk Investment 1. Introduction Nowadays, globalization of markets and trade, transformation of rules of global trade and business processes and the effects of information technology on global trade, has changed the economical and manufacturing affairs, and this, in turn, has had a profound effect on engineering techniques in various fields especially in the field of new product creation process. Due to the growing changes in opinion and tastes of customers, organizations must develop and introduce their products and services to the markets with high performance, low cost and in the fastest possible time and the industry * soran davoudi: Tell: +98 9188722831 E-mail address: [email protected]
Transcript of Journal of Applied Research on Industrial Engineering · Journal of Journal of Applied Research on...

Journal of
Applied Research on Industrial Engineering
Journal of Applied Research on Industrial Engineering
Vol. 1, No. 5/6 (2014) 293-306
Proposing a Decision Making System in Three-Dimensional Concurrent
Engineering by Considering the Investment Risk
Soran Davoudi*1, Mahmoud Shahrokhi2 1 Department Of Industrial Engineering , Najafabad Branch, Islamic Azad University, Najaf abad, Iran ([email protected])
2 Engineering Department, University of Kurdistan, Sanandaj, P. O. Box: 416, Iran ([email protected])
A B S T R A C T A R T I C L E I N F O
One of the great challenges of most of the investment companies is the analysis of investment
risk costs in the development of new products, in the initial stages of production. This study
develops the appropriate methods for the analysis of kinds of investment risk costs, within the
three-dimensional concurrent engineering. This study presents a suggested model based on multi-
objective programming and multi-attribute decision-making. This model considers the qualitative
and quantitative parameters relevant to the process of new product creation, such as supply chain
parameters, and investment risk for each project in the early stages of product design. And at the
end, it identifies and selects the best design with minimum of investment risk cost.
Article history : Received: 9 September 2014
Received in revised format: 15 December 2014
Accepted: 20 December 2014
Available online: 30 December 2014
Keywords : Three-dimensional
Concurrent Engineering,
Multi-Attribute Decision
Making ELECTRE III,
Fuzzy Decision Making
Method, Risk
Investment
1. Introduction
Nowadays, globalization of markets and trade, transformation of rules of global trade and business
processes and the effects of information technology on global trade, has changed the economical and
manufacturing affairs, and this, in turn, has had a profound effect on engineering techniques in
various fields especially in the field of new product creation process. Due to the growing changes in
opinion and tastes of customers, organizations must develop and introduce their products and services
to the markets with high performance, low cost and in the fastest possible time and the industry
*soran davoudi: Tell: +98 9188722831 E-mail address: [email protected]

Journal of Applied Research on Industrial Engineering Vol. 1, No. 5/6 (2014) 293-306
294
should bring into conformity the product design and production processes with rapid change of
customers’ needs.
Concurrent Engineering is a systematic approach to united and concurrent design of products and its
dependent processes like production and support. This approach initially causes all elements of
product life cycle, including quality, cost, scheduling and customer needs to be taken into
consideration (Winner et al., 1988).
According to published researches, although more than 60 percent of production cost is spent in the
production stage , more than 70 percent of a commodity production cost is affected by decisions at the
design stage (Andersen et al.,1986).
It reflects the growing importance of appropriate design in reducing manufacturing costs. Nowadays
researchers have developed methods to solve these problems and keep competitiveness in the market
that concurrent engineering (CE) is the most important one among them.
One of the main disadvantages of CE was that the supply chain design was not considered in the
early stages of product design. Decisions related to supply chain, that was taken at the last stages of
CE, put organizations for the introduction of new products in the costly situation to solve some of the
logistical problems (Fine et al.,2005). Moreover, concurrent engineering focused more on the internal
organization of companies (Balasubramanian, 2001). In 1998, Fine published a book (Fine, 1998) in
which he introduced a simple and powerful model with joint decisions that considers all of the three
fields at the same time. This approach called concurrent engineering, or in an abbreviated form 3D-
CE, takes into consideration three fields of design, manufacturing process, and the supply chain as a
single structure and takes decisions in the fields of product development by adopting united approach
of these three fields.(Ayag and Ozdemir, 2009 )
The present study emphasizes that in the position of making decisions, investors of a design or
developers and manufacturers should consider investment risk as one of the important criteria for
selection of product design. This subject is considerable in the respect that decisions taken at the stage
of product design, manufacturing process or supply chain have a great impact on the investment risk
of that product. Furthermore, at the time of devising different alternatives for the product,
computation and evaluation of investment risk has had a significant role in selection of design and in
the primary stages it’s possible to increase the level of investment risk to an acceptable extent with
changes in the early designs and decisions. In this way and in the primary stages, it can prevent the
future disadvantages with an optimal decision.
It should be mentioned that economic growth and general prosperity growth, regardless of
investment and important factors in the investment environment, is not possible in the long-term.
Therefore, the main objective is to enhance the ability of managers and engineers to understand the
concepts and modeling and analysis of investment risk in the stages of product design and process.
The presented model in this paper consists of two main parts: the first part is the qualitative and
quantitative assessment, in this section after determination of candidate design models, the best of the
manufacturing processes relating to each model and determination of pieces suppliers or sub-
assemblies of each design is achieved via linear programming. As most of the qualitative factors
cannot be analyzed by mathematical models; in the continuance of this phase, some qualitative factors
of design are assessed with verbal terms. Indeed, this phase computes the qualitative and quantitative
factors. The second part is the phase of selection. In this part, the results of the previous phase are
assessed by ELimination Et Choix Traduisant la REalité method (ELECTRE III) and are selected as a
best design alternative for producing a new product.
This paper consists of the following parts: part 2 is the review of literature of three-dimensional
concurrent engineering and investment risk. Part 3 describes the basic concepts that are needed in this
paper. Part 4 describes a proposed model for the selection of best product design, process, and supply

Journal of Applied Research on Industrial Engineering Vol. 1, No. 5/6 (2014) 293-306
295
chain with considering investment risk. Part 5 presents a numeral example for investigating the effect
of suggested model. And part 6 presents results and recommendations for future research.
2. Literature Review
Although most of the studies have investigated concurrent engineering, few have focused on
mathematical programming or techniques of optimization in this regard and most of the studies till
now have been focused on issues, analysis, and qualitative techniques. Moreover, there are very few
studies regarding supply chain modeling in product creation phase, costs of product life cycle, the
simultaneous consideration of qualitative and quantitative objectives, and simultaneous investigation
of objectives.
From a quantitative modeling perspective, (Lamghabbar et al.,2004) utilized a mathematical
technique to find optimal amounts of product and process design. In this paper, qualitative loss
function appears as an objective function and manufacturing needs, product features, its dimensional
extent and ability of the process as a limitation. The authors, also, conducted a parametric analysis of
the objective function by using an interactive ideal programming technique. Schniederjans and Hong
(1996) created an ideal programming approach to model decision-making in CE by considering the
conflicting objectives of cost and time. In a study in 2001, Feng et al. (2001) developed a quantitative
model that simultaneously determined the range of variations in product design and suppliers
selection for different pieces.
Fine et al. (2005) presented a quantitative model of three-dimensional concurrent engineering. They
assessed conflictions among different functions by using an ideal programming technique in this
model. This technique, with the assumption of strategic relation between product design, process
design and supply chain design, minimizes deviation from the determined ideal level for different
objectives (quality, cost, received time, joint action and dependence).
Sheidpor et al. (2013) offered a collaborative decision making process by using multi-objective
programming in three-dimensional concurrent engineering to solve the problems of process design
and supply chain product. In this method, they took into consideration the ideas of decision-makers to
assess supplier candidates and to determine the importance of decision-making criteria regarding the
lack of sufficient information in primary stages of design. They investigated selection of best form of
product design, process and supply chain with solving of a numerical example in two phases: fuzzy
and non-fuzzy. This investigation revealed absolutely different results of these two phases. Moreover,
they offered a new approach of three-dimensional concurrent engineering in another paper in the same
year. This method is based on multi-objective linear programming and TOPSIS method that presents
best form of product design, process and supply chain. At the end, they investigate the effectiveness
of this approach with a numerical example(Sheidpor et al. (2013)).
Shahrokhi et al. (2011) presented the technique of linear programming with fuzzy logic approach
for new product design and supply chain management to select the appropriate supplier. Furthermore,
in the same year in another article of a synthetic approach, they presented a model for supply chain
management process by using a multi-objective programming and fuzzy logic (Shahrokhi et al.
(2011)).
In 2009, regarding to the complexity and uncertainty of data, Vale and Vázquez-Bustelo (2009)
presented a model for concurrent engineering and optimization of new product design . In 2010,
Avent and Annalisa (2010) presented a conceptual approach of design structure matrix application in
united concurrent engineering for the design of space systems to increase the speed in performing the
tasks.
Demolay et al. (2013 ) described an approach of new product relations management application in
the field of product life cycle and this approach is capable of concurrent design of the product and

Journal of Applied Research on Industrial Engineering Vol. 1, No. 5/6 (2014) 293-306
296
assembly programming. The feasibility of this approach has been examined by a concrete example
and its’ associated benefits has been reported in form of a case study of mechanical assembly.
Mess et al. (2013) has investigated design of airbus aircrafts and aerospace industry by using
concurrent engineering technique which has been successful for several decades and they have
explained its results and introduced other methods and patterns of concurrent engineering.
3. Background
This paper includes the following concepts that have been explained in detail in presented
references.
Investment risk (Parker, 2008)
Methods of decision-making:
MOLP (Tiwari et al., 1987)
ELECTRE III Method (Xiaoting Wang and Evangelos Triantaphyllou, 2005)
Fuzzy collections concepts (Chen, 2004)
4. Proposed Model
In this study, we have developed a model based on three-dimensional concurrent engineering that
selects the best product design from among several alternatives of design selection with consideration
of the investment risk criteria. This model is designed in two parts:
4.1. Qualitative and quantitative assessment phase
4.2. Selection phase
4.1. Quantitative and Qualitative Assessment
quantitative assessment
A multi-objective linear programming model is created to select the best design model for
quantitative assessment of factors. This model has two objectives of pieces supply cost (build or buy)
and creation time of the product.
For this purpose, the following assumptions have been considered:
1. demand is probable and is estimated in a format (framework) of optimistic,
pessimistic, and balanced scenarios.
2. The costs of purchase, assembly or construction of the piece are clear.
3. The time of the purchase, assembly or construction of the piece is known.
4. The average quality (defective rate) of each purchased piece or constructed one is
known.
5. supplier’s capacity (internal and external) is known and fixed.
6. Product assembly operations begin after providing all pieces by suppliers.
7. There are different suppliers for each major component that is supplied from outside
of the factory.
8. Some of major components are constructed inside the factory and for that pieces there
are various manufacturing processes for selection.
9. Costs of ordering and maintenance are computed for one period. And the ordering
costs to the suppliers are independent from different types of ordered pieces.
10. Depending on the kind of the process, the hour of work force is different.

Journal of Applied Research on Industrial Engineering Vol. 1, No. 5/6 (2014) 293-306
297
11. The reliability of each major component of the product is identified and fixed, and
there are different reliabilities for each piece regarding the kinds of suppliers.
12. Block diagrams of reliability can be different for each product design.
13. The shipping cost of the defective commodity is the responsibility of the supplier.
The developed multi-objective linear programming of mathematical model will be explained for
quantitative assessment of parameters.
Indexes
m=1,2,…,M Index of assembly processes
𝑗 = 1, 2, … , 𝐽 Index of genuine pieces
𝑦 = 1,… , 𝛶 Index of work force specialty
𝜆 = 1,… , 𝛬 Index of raw material quality
𝑙 = 1,2, … , 𝐿 Index of kind of design
𝑠 = 0,… , 𝑠1… , 𝑆 Index of suppliers
i = {
1 ∶ optimistic2 ∶ balanced3 ∶ pessimistic
Index of status
Parameters of the Problem:
𝐷𝑖: Total projected product demand
𝑐𝑎𝑝𝑗𝑠: Purchase capacity or j piece construction from the s supplier
𝑐𝑗𝑠: The cost of purchase of j piece from the s supplier for external suppliers
𝐶𝑗𝑘𝑚: The cost of j piece assembly with k piece in the m assembly process
𝑇𝑗𝑠1 : Required time for supplying j piece from the s supplier on the basis of day
𝑇𝑗𝑘𝑚2 : Required time for j piece assembly with k piece in the m assembly process on the basis of
minute
𝑇3: Required time for product design on the basis of day
𝜃𝑚: The efficiency of m assembly process (ratio of useful time of the process to the total time
available)
𝑒𝑚: Production rates of defective product for m assembly process
ℎ: Rate of return on investment in terms of percent
𝑛𝑗: The existing number of j piece in product design
𝑅𝑗𝑠: Reliability of purchased j piece from the s supplier
𝑎𝑗𝑘𝑚: The assembly order of j piece with k piece in the m assembly process
𝑂𝑠: The ordering cost to the s supplier
𝑣𝑚: requirements Capital investment for the equipment or personnel in the assembly process
𝑁𝑠𝛾𝑗: Man-hours of human resources required of expertise 𝛶 to produce j piece in the s process
φγ: The cost of required human resources of expertise for each person per hour
𝐹𝑠𝛿𝑗: The required raw material of 𝛿 qualitative type to produce j piece in the s process

Journal of Applied Research on Industrial Engineering Vol. 1, No. 5/6 (2014) 293-306
298
πδ: The cost of per unit of the required raw material of δ qualitative type
g: The number of daily work hours for production of each piece
𝑏𝑖: L product design Efficiency at the end of the period in the i status
𝑏:̅ Efficiency average in each three status
𝑞: The price of unit product at the end of the period
ϑ: The tax rate for L product design
𝐶𝑖′: The total cost of product production in the i status
𝑇𝑖′: The total time of product production in the i status
𝐶̅: Costs average in each three status
𝑇:̅ The total time average in each three status
Pi: occurrence Probability of each i status
wjs {
∀ s = 0,… , s1 𝑇ℎ𝑒 new investment 𝑐𝑜𝑠𝑡 𝑓𝑜𝑟 𝑒𝑎𝑐ℎ 𝑝𝑖𝑒𝑐𝑒
∀ s = s1, … , S The maintenance cost for each piece
Decision Variables:
djs: Purchase amount of j piece from the s supplier
ujs: If j piece is purchased from the s supplier 1, otherwise 0
ym: If m assembly process is chosen 1, otherwise 0
us: If s supplier is chosen 1, otherwise 0
The purposes and limitations of the model are as the following:
min Z1 = ∑ ym
(
(∑∑ njCjs
s
s=s1
djs
J
j=1
) +
(
∑ nj∑djs
s1
s=0
J
j=1
((∑Nsγj
Υ
γ=1
φγ) + (∑Fsδj
Λ
δ=1
πδ))
)
)
M
m=1
+∑ (D
1 − em) ym∑∑ajkm
K
k=1j≠k
J
j=1
M
m=1
Cjkm +∑Os
S
s=1
us + ∑ 𝑦𝑚
𝑀
𝑚=1
∑∑(ℎ𝐶𝑗𝑠 + 𝑤𝑗𝑠)
𝑆
𝑠=1
𝐽
𝑗=1
𝑑𝑗𝑠
(1)
min Z2 = ∑ (1 − em) ym
D
M
m=1
∑∑Tjs1djs +
S
s=1
J
j=1
∑ (1
θm × g × 60) ym∑∑ajkmTjkm
K
k=1j≠k
J
j=1
M
m=1
+ T3 (2)
R = f(ujs, rjs) ≥ 0.9 (3)
∑ ym
M
m=1
∑∑njdjs
S
s=0
J
j=1
= (njD
1 − em) ym ∀ m, j (4)
ymdjs ≤ capjs ∀ m, j, s (5)

Journal of Applied Research on Industrial Engineering Vol. 1, No. 5/6 (2014) 293-306
299
∑ ym
M
m=1
∑∑ujs
S
s=0
J
j=1
≤ 3 ∀ m, s (6)
∑ ym
M
m=1
∑∑ujs
S
s=0
J
j=1
≤ Mus ∀ m, s (7)
∑ ym = 1
M
m=1
(8)
djs ≤ Mujs (9)
djs ≥ ujs (10)
ujs, ym, us ∈ {0,1} (11)
djs ≥ 0 ∀ m, j, s (12)
Purpose 1, the total costs, including purchasing costs of pieces, product construction, ordering costs,
assembly costs, and new investment costs, minimizes the costs for manufacturing of each piece. Here,
the internal construction costs of pieces are considered as a function of the quality of the raw material
and specialty of required workforce.
In the proposed model, purpose 2 minimizes the spent time to introduce new product to the market
which includes purchase time, or piece construction of a product, construction time of a product
(pieces assembly) and the estimated time of design. Also indicates pieces maintenance costs and new
required investment in the process of pieces manufacturing. The most important maintenance costs of
commodities in the stocks are the missed opportunity cost of investment. In fact, it is called costs of
investment sleep. Also, the other costs of commodity maintenance in stocks such as stock rent,
destruction, taxes, depreciation, and etc. has a significant impact on manufacturing costs.
In addition to these cases, this purpose includes costs of investment sleep arising from new
investments in the manufacture line that has a great role in determining the extent of manufacturing.
Reliability is the probability of success in functions of a product. Paying attention to the reliability
of a system and the proper application of skills and its’ tools is effective in achieving the goals and
identified results of the product. Another important role of reliability lies in the field of reduction
costs. When the restoration of defective elements imposes the non-profitable high costs to the
collection, at this time, the reliability requirements can be considered as one of the main goals.
Therefore, high reliability can guarantee a high extent of safety with minimum expense of costs. The
(3) relation of this model selects reliability from among the existing reliabilities for each piece (each
piece has different and various reliabilities regarding to the variability of suppliers) by using a zero
and one variable, and the criteria for this selection are the relations of (9) and (10), i.e., regarding to
the 4 purposes of this model, when one purchases the j piece from the s supplier, the variable ujs will
be one and its reliability will be considered in computations and by using diagram block of reliability
that the unit of design has presented, the total reliability of each design and process will be computed.
The relations of (4) and (5) show the limitations of product demand and limitations of suppliers’
capacity for each piece. The limitation of (6) indicates the company’s strategy to reduce dependency
on each supplier. This limitation means that the number of piece types that are purchased from a
supplier should not exceed from a certain level (here are three pieces). The (7) limitation shows pieces
suppliers. The (8) limitation means that only one process can be selected for product assembly. The

Journal of Applied Research on Industrial Engineering Vol. 1, No. 5/6 (2014) 293-306
300
(9) and (10) limitations show that if a piece’s order be given to one supplier, that supplier lies in the
collection of selected suppliers. The (11) and (12) limitation also shows zero, one, and positive
variables.
The above proposed model is non-linear, due to the product of ym and djs variables. To make this
model linear, the relation of ym × djs = xmjs1 is formed and the following relations are added to the
limitations of the problem.
xmjs1 ≤ Mym
(13) 𝑥𝑚𝑗𝑠1 ≥ 𝑀 (𝑦𝑚 − 1) + 𝑑𝑗𝑠
𝑑𝑗𝑠 ≥ 𝑥𝑚𝑗𝑠1
This mathematical model is solved individually for any number of design candidate and each case of
Optimistic, Balanced and pessimistic scenarios, Then the results will be one with using the below
relations.
∑ 𝐶𝑖′3
𝑖=1 𝑃𝑖 (14) → Cost criteria for The selected process of each design.
∑ 𝑇𝑖′3
𝑖=1 𝑃𝑖 (15) → Time criteria for The selected process of each design.
Then, the rate of investment efficiency is computed by using parameters obtained in the previous
step and the following equation for each selected design.
𝑏𝑖′ =
(𝑞𝐷𝑖 − 𝐶′)(1 − 𝜗)
𝐶′ (16)
The numerator represents income after paying taxes (net income) for each product design. In the
next step of the algorithm will computed investment risk for each design by using the rate efficiency,
and then these result are used as a criterion to select the best product design .
∑ (𝑏𝑖′ − �̅�)
23𝑖=1 𝑃𝑖 → investment risk criteria for The selected process of each design.
The best answers are recorded For all three objectives of cost, time and risk investment and
transmitted to the ELECTRE III decision matrix.
Qualitative Assessment
In the real world, most of the information that are related to the product creation process is
ambiguous or uncertain (Buyukozkan and Feyzıoglu (2004)) and most of the information are
expressed as inaccurate expressions such as
‘low’ or ‘high’. For this purpose, the experts use linguistics expressions to express some factors of
product design that has a qualitative nature and cannot make them models.
Since verbal expressions are shown with fuzzy numbers, it’s necessary to change them to concrete
numbers in order to be able to use them in ELECTRE III decision matrix.
So, this study uses the method of Liou and Wang (1992). In this method, the absolute value of the
triangular fuzzy numbers (a, b, c) is achieved on the basis of level of decision-maker confidence.
4.2. Selection
The best form of design, process, and suppliers is identified by using the explained procedures of the
ELECTRE III method, while the relative importance of objectives is achieved with the fuzzy
hierarchical analytical method (FAHP).
Journal of Applied Research on Industrial Engineering Vol. 1, No. 5/6 (2014) 293-306
301
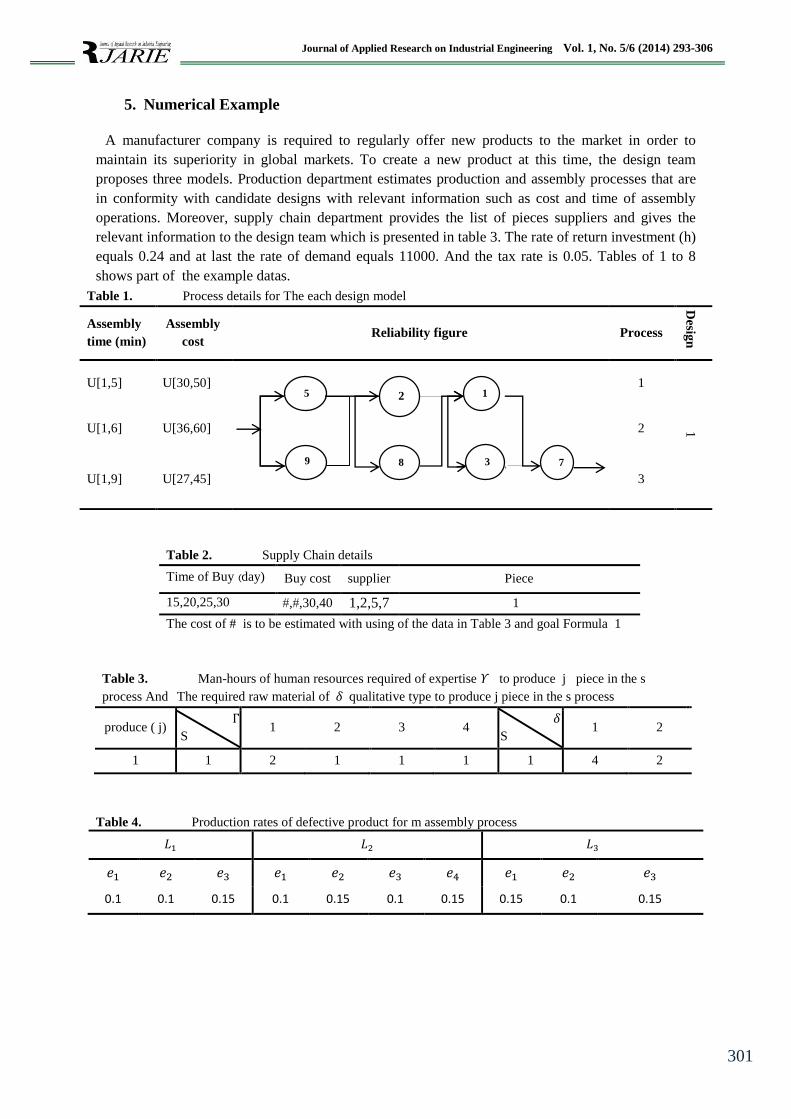
5. Numerical Example
A manufacturer company is required to regularly offer new products to the market in order to
maintain its superiority in global markets. To create a new product at this time, the design team
proposes three models. Production department estimates production and assembly processes that are
in conformity with candidate designs with relevant information such as cost and time of assembly
operations. Moreover, supply chain department provides the list of pieces suppliers and gives the
relevant information to the design team which is presented in table 3. The rate of return investment (h)
equals 0.24 and at last the rate of demand equals 11000. And the tax rate is 0.05. Tables of 1 to 8
shows part of the example datas.
Table 1. Process details for The each design model
Desig
n
Process Reliability figure Assembly
cost
Assembly
time (min)
1
1
U[30,50] U[1,5]
2 U[36,60] U[1,6]
3 U[27,45] U[1,9]
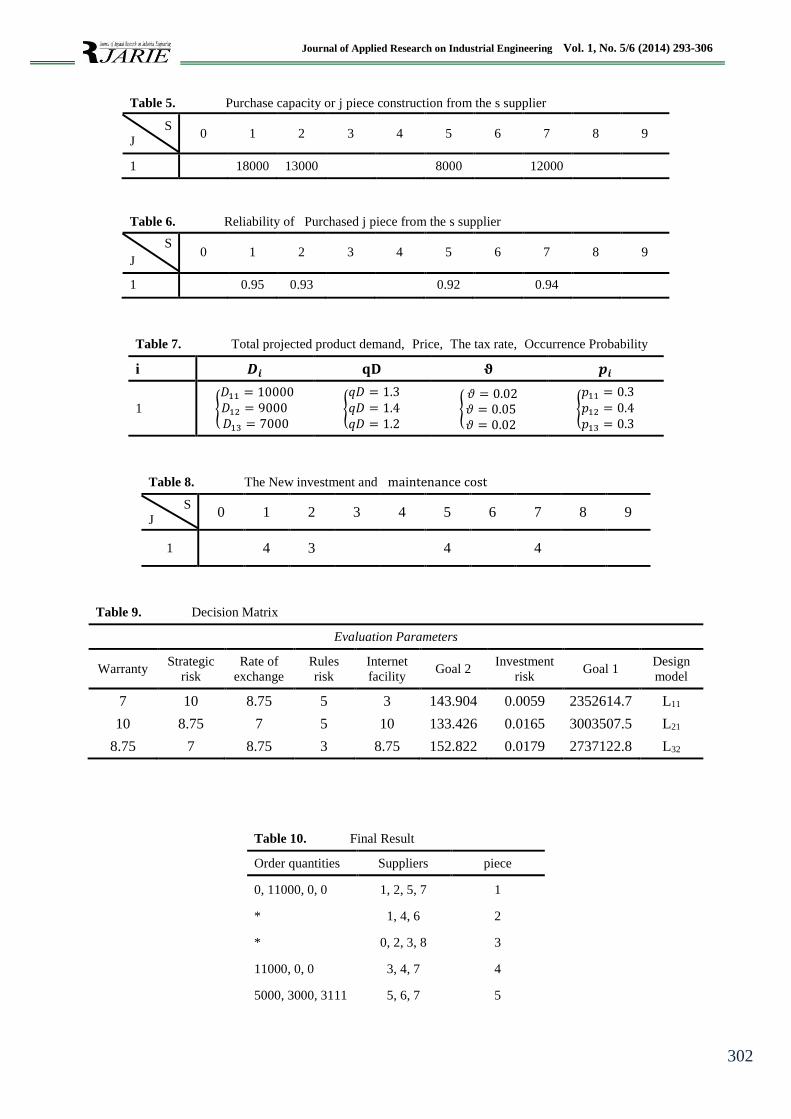
Table 2. Supply Chain details
Piece supplier Buy cost Time of Buy )day)
1 1,2,5,7 #,#,30,40 15,20,25,30
The cost of # is to be estimated with using of the data in Table 3 and goal Formula 1
Table 3. Man-hours of human resources required of expertise 𝛶 to produce j piece in the s
process And The required raw material of 𝛿 qualitative type to produce j piece in the s process
produce ( j) Γ
S 1 2 3 4
𝛿
S 1 2
1 1 2 1 1 1 1 4 2
Table 4. Production rates of defective product for m assembly process
𝐿1 𝐿2 𝐿3
𝑒1 𝑒2 𝑒3 𝑒1 𝑒2 𝑒3 𝑒4 𝑒1 𝑒2 𝑒3
0.1 0.1 0.15 0.1 0.15 0.1 0.15 0.15 0.1 0.15
5
9
2
8
1
3 7
Journal of Applied Research on Industrial Engineering Vol. 1, No. 5/6 (2014) 293-306
302
Table 6. Reliability of Purchased j piece from the s supplier
S
J 0 1 2 3 4 5 6 7 8 9
1 0.95 0.93 0.92 0.94
Table 7. Total projected product demand, Price, The tax rate, Occurrence Probability
𝒑𝒊 𝛝 𝐪𝐃 𝑫𝒊 i
{
𝑝11 = 0.3𝑝12 = 0.4𝑝13 = 0.3
{ 𝜗 = 0.02𝜗 = 0.05𝜗 = 0.02
{
𝑞𝐷 = 1.3𝑞𝐷 = 1.4𝑞𝐷 = 1.2
{
𝐷11 = 10000𝐷12 = 9000 𝐷13 = 7000
1
Table 8. The New investment and maintenance cost
9 8 7 6 5 4 3 2 1 0 S
J
4 4 3 4 1
Table 9. Decision Matrix
Evaluation Parameters
Warranty Strategic
risk Rate of
exchange Rules
risk Internet
facility Goal 2
Investment
risk Goal 1
Design
model
7 10 8.75 5 3 143.904 0.0059 2352614.7 L11
10 8.75 7 5 10 133.426 0.0165 3003507.5 L21
8.75 7 8.75 3 8.75 152.822 0.0179 2737122.8 L32
Table 10. Final Result
Order quantities Suppliers piece
0, 11000, 0, 0 1, 2, 5, 7 1
* 1, 4, 6 2
* 0, 2, 3, 8 3
11000, 0, 0 3, 4, 7 4
5000, 3000, 3111 5, 6, 7 5
Table 5. Purchase capacity or j piece construction from the s supplier
S
J 0 1 2 3 4 5 6 7 8 9
1 18000 13000 8000 12000

Journal of Applied Research on Industrial Engineering Vol. 1, No. 5/6 (2014) 293-306
303
Table 10. Final Result
Order quantities Suppliers piece
13000, 9222, 0, 0 0, 1, 8, 9 6
4111, 7000, 0 4, 8, 9 7
* 3, 5, 9 8
9000, 0, 2111, 0 0, 2, 4, 6 9
* 0, 1, 2 10
11111, 0, 0, 0 2, 5, 7, 9 11
* 0, 6, 7, 8 12
Figure 1. The Computer program of ELECTRE III
Step 1: qualitative and quantitative assessment of parameters: according to the proposed model
steps, the multi-objective linear programming problem is solved for all of the candidate design models
and the best answers are recorded in decision matrix of ELECTRE III. Also, the qualitative objectives
of the problem are determined and then they will be assessed by using linguistic expressions.

Journal of Applied Research on Industrial Engineering Vol. 1, No. 5/6 (2014) 293-306
304
quantitative assessment :
Selecting the first objective and solve it. The extent of low limit of each function is achieved by
maximizing the function, extent of high limit and minimizing the function. Determining the
membership function of each objective, certain solving of problem as equivalent of fuzzy
optimization and maximizing the total level of satisfaction separately for each design model. At the
end, the quantitative Criteria are computed by using relevant relations (14), (15) and (16).
Qualitative assessment of parameters: in this step, first, the problems qualitative objective is set and
then it will be assessed by using linguistic expressions. Since linguistic expressions are expressed as
triangular fuzzy numbers, they should be transmitted to absolute numbers in order to be able to use
them in the final assessment by ELECTRE III. This is done by Liou and Wangs’ method
This step results are available in Table 9 .
Step 2: final assessment by using the ranking method ELECTRE III by using the results of the
previous two steps, decision matrix is made ( table 9). The weight of objectives is achieved by fuzzy
hierarchical analytical method (FAHP).
𝑊 = [𝑤1, … , 𝑤8] = [0.22,0.2,0.18,0.16,0.09,0.08,0.044,0.026]
Finally these data’s are entered to the computer program of ELECTRE III method (Figure 1) to
select the best design.
Final ranking is obtained by using this method is in the Figure 1.
As a result, the most favored option is the L21 design model. Order quantity of each piece to
suppliers is shown in the table (10).
6. Conclusion
The major differences will appear by comparing the presented proposed model and earlier works.
Previous research was mainly focused on quality issues. But this model, with an innovative approach,
simultaneously considers qualitative and quantitative parameters of product creation. This model has
some other advantages, including:
1. Making decisions about purchasing or construction of pieces
2. Considering some strategies of companies in the process of new product creation such
as reducing dependency to external suppliers
3. Considering some of product life cycle costs as warranty cost of the product.
4. Considering multiple objectives simultaneously, including product creation cost,
product introduction time to the market and investment risks and cost of future
development
5. Considering investment risks as a valuable criteria in the product market and the capital
market.
6. Including attention to all aspects related to investment risks, including interest rate risk,
strategic risk, exchange rate risk and rules risk.
7. Considering the product reliability criteria as a constraint for selecting the best design.
7. Recommendations for Further Research
The following points are presented as suggestions for development in this field:

Journal of Applied Research on Industrial Engineering Vol. 1, No. 5/6 (2014) 293-306
305
1. Using a concrete example to investigate effectiveness on company’s success.
2. Considering information technology with extensive measures to operationalize this
approach.
3. Entering uncertainties (probable and fuzzy) in different sections of this approach.
4. Prediction and estimation of costs in competitive market
8. References
Andersen, M., Kohler, S. and Lund, T. (1986). “Design for Assembly”. IFS Publications, London.
Avnet, M. and Annalisa L. (2010). “An application of the Design Structure Matrix to Integrated
Concurrent Engineering”. Journal of Acta Astronautica, Vol. 66, No. 5–6, pp. 937-949.
Ayag, Z. and Ozdemir, R.G. (2009) . “A hybrid approach to concept selection through fuzzy analytic
network process”. Journal of Computers & Industrial Engineering, Vol. 56, No. 1, pp. 368–
379.
Balasubramanian, R. (2001). “Concurrent engineering–a powerful enabler of supply chain
management”. Quality Progress, Vol. 34, No. 6, pp. 47-53.
Buyukozkan, G. and Feyzıoglu, O. (2004). “A fuzzy-logic-based decision-making approach for new
product development”. International Journal of Production Economics, Vol. 90, No. 1, pp.
27–45.
Chen, H. (2004). A research based on fuzzy AHP for multi-criteria supplier selection in supply chain.
Master thesis, National Taiwan University of Science and Technology, Department of
Industrial Management (ETD).
Demoly, F., Dutartre, O., Yan, X., Eynard, B., Kiritsis, D. and Gomes, S. (2013). “Product
relationships management enabler for concurrent engineering and product lifecycle
management”. Journal of Computers in Industry, Vol. 64, No. 7, pp. 833-848 .
Feng, C.X., Wang, J. and Wang, J.S. (2001). “An optimization model for concurrent selection of
tolerances and suppliers”. Journal of Computers & Industrial Engineering, Vol. 40, No. 1-2,
pp. 15–33.
Fine, C. (1998). Clockspeed, Perseus Books, NewYork, NY.
Fine, C.H., Golany, B. and Naseraldin, H. (2005). “Modeling tradeoffs in three-dimensional
concurrent engineering: a goal programming approach”. Journal of Operations Management,
Vol. 23, no. 3-4, pp. 389–403.
Lamghabbar, A., Yacout, S. and Ouali, M.S. (2004) . “Concurrent optimization of the design and
manufacturing stages of product development”. International Journal of Production
Research, Vol. 42, No. 21, pp. 4495-4512.
Liou, T. S. and Wang, M.T. (1992). “Ranking fuzzy numbers with integral value”. Fuzzy Sets and
Systems, Vol. 50, No. 3, pp. 247–255.
Mas, F. Menéndez, J.L. Oliva, and Ríos, M.J. ( 2013). “Collaborative Engineering: An Airbus Case
Study”. Article Procedia Engineering, Vol. 63, No. 1, pp. 336-345.
Parker, j. (2008). “Risk management, risk management dimensions, definition and application of
financial organizations”. Financial Research, Vol. 13-14, No. 4, pp. 125-144 (In Persian).
Schniederjans, M.J. and Hong, S. (1996). “Multi-objective concurrent engineering: A goal
programming approach”. IEEE Transactions on Engineering Management, Vol. 43, No. 2,
pp. 202-209.
Shahrokhi, M., Bernard, A. and Shidpour, H. (2011). “A Hybrid Method to Select Best Process and
Suppliers”, in the Concurrent Engineering Environment World Congress, Vol. 18, No. 1.

Journal of Applied Research on Industrial Engineering Vol. 1, No. 5/6 (2014) 293-306
306
Shahrokhi, M., Bernard, A. and Shidpour, H. (2011). “An Integrated Method Using Intuitionistic
Fuzzy Set and Linear Programming for Supplier Selection Problem”. World Congress, Vol.
18, No. 1.
shidpour, H., Bernard, A. and Shahrokhi, M. (2013) . “A Group Decision-making Method based on
Intuitionistic Fuzzy Set in the Three Dimensional Concurrent Engineering Environment: A
Multi-Objective Programming Approach”. Procedia CIRP, Vol. 7, No. 1, pp. 533-538.
shidpour, H., Bernard, A. and Shahrokhi, M. (2013). “A multi-objective programming approach,
integrated into the TOPSIS method, in order to optimize product design; in three-dimensional
concurrent engineering”. Computers & Industrial Engineering, Vol. 64, No. 4, pp. 875-885.
Tiwari, R.N., Dharmar, S. and Rao, J.K. (1987), “Fuzzy Goal Programming An Addituie Model”.
Fuzzy Sets and systems. Vol. 24, No. 1, pp. 27-34.
Valle, S. and Vázquez-Bustelo, D. (2009). “Concurrent engineering performance: Incremental versus
radical innovation”. International Journal of Production Economics, Vol. 119, No. 1, pp. 136-
148.
Winner, R.J., Pennell J.P., Bertend H.E. and Slusarczuk M.M.G. (1988). The Role of Concurrent
Engineering in Weapon System Acquisition, IDA Report R-338, Institute for Defense
Systems Analysis, Alexandra VA.
Xiaoting Wang, Evangelos Triantaphyllou (2005). “Ranking Irregularities When Evaluating
Alternatives by Using Some Electre Methods”.