Journal of Alloys and Compounds -...
8
Journal of Alloys and Compounds 479 (2009) 549–556 Contents lists available at ScienceDirect Journal of Alloys and Compounds journal homepage: www.elsevier.com/locate/jallcom Influence of Ag 2 O on some physical properties of LiF–TiO 2 –P 2 O 5 glass system M. Nagarjuna, T. Satyanarayana, Y. Gandhi, N. Veeraiah ∗ Department of Physics, Acharya Nagarjuna University, Nuzvid Campus, Nuzvid 521 201, A.P., India article info Article history: Received 11 December 2008 Received in revised form 23 December 2008 Accepted 30 December 2008 Available online 6 January 2009 Keywords: Amorphous materials Dielectric response Electron paramagnetic resonance abstract LiF–TiO 2 –P 2 O 5 glasses mixed with different concentrations of Ag 2 O (ranging from 0 to 1.5mol%) were prepared. The samples were characterized by X-ray diffraction, scanning electron microscopy. The optical absorption and ESR spectral studies of these glasses have indicated that the titanium ions exist in Ti 3+ state in addition to Ti 4+ state in these samples. The IR spectral studies exhibit bands due to TiO 4 and TiO 6 structural units in addition to the conventional bands due to various phosphate structural groups. From the studies it is observed that the degree of disorder in the glass network increases with the increase in the concentration of Ag 2 O from 0 to 1.0mol%. Studies on dielectric properties of these glasses over a range of frequency and temperature have also been carried out. These studies have indicated that as the concentration of Ag 2 O is increased up to 1.0mol%, the insulating strength of the glasses decreases where as the rigidity of the glasses seems to increase when the concentration of Ag 2 O is raised from 1.0 to 1.5 mol%. The a.c. conductivity seems to be predominantly ionic in nature in the glass samples containing Ag 2 O up to 1.0 mol%. © 2009 Elsevier B.V. All rights reserved. 1. Introduction In recent years, there has been an enormous amount of research on improving the physical properties and the chemical durability of phosphate glasses by introducing a number of glass formers and modifiers such as V 2 O 5 , Cr 2 O 3 , Fe 2 O 3 , Al 2 O 3 , Ga 2 O 3 , Sb 2 O 3 , etc., into P 2 O 5 glass network [1–10]. Among various such metal oxides, TiO 2 is expected to be more effective in improving the chemical durabil- ity of the phosphate glasses. Normally, the ions of titanium, exist in the glass in Ti 4+ state and participate in the glass network forming with TiO 4 , TiO 6 and some times with TiO 5 (comprising of trigo- nal bipyramids) structural units [11,12]. However, there are reports suggesting that these ions may also exist in Ti 3+ valence state in some of the glass matrices [13,14]. Further, the inclusion of Ti 4+ ions into the phosphate network makes these glasses useful for optically operated devices, since the empty or unfilled d-shells of Ti ions contribute more strongly to the non-linear polarizabilities. Silver oxide mixed lithium titanium phosphate glasses can be considered as super ionic solids. Mixed electronic and ionic, pure electronic or pure ionic conduction is expected in these glasses depending upon the composition of the glass constituents. The materials that exhibit mixed conduction mechanism find numer- ous applications such as cathodes in electro chemical cells, smart windows, etc. Electronic conduction in this type of materials is pre- dicted due to polaron hopping where as the ionic conduction is ∗ Corresponding author. Tel.: +91 9440015188; fax: +91 8656 235551. E-mail address: [email protected] (N. Veeraiah). expected due to the diffusion of alkali ions or any other dopant ions like silver. Though, a considerable number of studies on certain silver phos- phate glasses are available [15,16] still there is a lot of scope to investigate the role of silver ions (especially in the presence of transition metal ions like titanium in small quantities) on the con- duction mechanism in lithium fluoro phosphate glasses. In view of such practical importance of these glasses, this paper is devoted to report the results of investigations on dielectric relaxation and a.c. conduction phenomena and to analyze the results of these studies with the aid of the data on spectroscopic studies (optical absorption, ESR, IR) of LiF–TiO 2 –P 2 O 5 glasses mixed with different concentra- tions of silver ions. 2. Experimental methods For the present study, a particular composition (39.5 − x)LiF–0.5TiO2– 60P2O5:xAg2O with eight values of x ranging from 0 to 1.5 is chosen. The detailed compositions are as follows: A0: 39.5LiF–0.5TiO2–60P2O5 A2: 39.3LiF–0.5TiO2–60P2O5:0.2Ag2O A4: 39.1LiF–0.5TiO2–60P2O5:0.4Ag2O A6: 38.9LiF–0.5TiO2–60P2O5:0.6Ag2O A8: 38.7LiF–0.5TiO2–60P2O5:0.8Ag2O A10: 38.5LiF–0.5TiO2–60P2O5:1.0Ag2O A12: 38.3LiF–0.5TiO2–60P2O5:1.2Ag2O A15: 38.0LiF–0.5TiO2–60P2O5:1.5Ag2O Analytical grade reagents of P2O5, LiF, Ag2O and TiO2 powders in appropriate amounts (all in mol%) were thoroughly mixed in an agate mortar and melted in a platinum crucible at 650 ± 10 ◦ C in a PID temperature controlled furnace for about 0925-8388/$ – see front matter © 2009 Elsevier B.V. All rights reserved. doi:10.1016/j.jallcom.2008.12.132
-
Upload
phamnguyet -
Category
Documents
-
view
216 -
download
0
Transcript of Journal of Alloys and Compounds -...
I
MD
a
ARR2AA
KADE
1
oomPiitwnssioT
cedmowd
0d
Journal of Alloys and Compounds 479 (2009) 549–556
Contents lists available at ScienceDirect
Journal of Alloys and Compounds
journa l homepage: www.e lsev ier .com/ locate / ja l l com
nfluence of Ag2O on some physical properties of LiF–TiO2–P2O5 glass system
. Nagarjuna, T. Satyanarayana, Y. Gandhi, N. Veeraiah ∗
epartment of Physics, Acharya Nagarjuna University, Nuzvid Campus, Nuzvid 521 201, A.P., India
r t i c l e i n f o
rticle history:eceived 11 December 2008eceived in revised form3 December 2008ccepted 30 December 2008vailable online 6 January 2009
a b s t r a c t
LiF–TiO2–P2O5 glasses mixed with different concentrations of Ag2O (ranging from 0 to 1.5 mol%) wereprepared. The samples were characterized by X-ray diffraction, scanning electron microscopy. The opticalabsorption and ESR spectral studies of these glasses have indicated that the titanium ions exist in Ti3+
state in addition to Ti4+ state in these samples. The IR spectral studies exhibit bands due to TiO4 and TiO6
structural units in addition to the conventional bands due to various phosphate structural groups. Fromthe studies it is observed that the degree of disorder in the glass network increases with the increase
eywords:morphous materialsielectric responselectron paramagnetic resonance
in the concentration of Ag2O from 0 to 1.0 mol%. Studies on dielectric properties of these glasses overa range of frequency and temperature have also been carried out. These studies have indicated that asthe concentration of Ag2O is increased up to 1.0 mol%, the insulating strength of the glasses decreaseswhere as the rigidity of the glasses seems to increase when the concentration of Ag2O is raised from 1.0 to1.5 mol%. The a.c. conductivity seems to be predominantly ionic in nature in the glass samples containing
Ag2O up to 1.0 mol%.. Introduction
In recent years, there has been an enormous amount of researchn improving the physical properties and the chemical durabilityf phosphate glasses by introducing a number of glass formers andodifiers such as V2O5, Cr2O3, Fe2O3, Al2O3, Ga2O3, Sb2O3, etc., into
2O5 glass network [1–10]. Among various such metal oxides, TiO2s expected to be more effective in improving the chemical durabil-ty of the phosphate glasses. Normally, the ions of titanium, exist inhe glass in Ti4+ state and participate in the glass network formingith TiO4, TiO6 and some times with TiO5 (comprising of trigo-al bipyramids) structural units [11,12]. However, there are reportsuggesting that these ions may also exist in Ti3+ valence state inome of the glass matrices [13,14]. Further, the inclusion of Ti4+
ons into the phosphate network makes these glasses useful forptically operated devices, since the empty or unfilled d-shells ofi ions contribute more strongly to the non-linear polarizabilities.
Silver oxide mixed lithium titanium phosphate glasses can beonsidered as super ionic solids. Mixed electronic and ionic, purelectronic or pure ionic conduction is expected in these glassesepending upon the composition of the glass constituents. The
aterials that exhibit mixed conduction mechanism find numer-us applications such as cathodes in electro chemical cells, smartindows, etc. Electronic conduction in this type of materials is pre-icted due to polaron hopping where as the ionic conduction is
∗ Corresponding author. Tel.: +91 9440015188; fax: +91 8656 235551.E-mail address: [email protected] (N. Veeraiah).
925-8388/$ – see front matter © 2009 Elsevier B.V. All rights reserved.oi:10.1016/j.jallcom.2008.12.132
© 2009 Elsevier B.V. All rights reserved.
expected due to the diffusion of alkali ions or any other dopant ionslike silver.
Though, a considerable number of studies on certain silver phos-phate glasses are available [15,16] still there is a lot of scope toinvestigate the role of silver ions (especially in the presence oftransition metal ions like titanium in small quantities) on the con-duction mechanism in lithium fluoro phosphate glasses. In view ofsuch practical importance of these glasses, this paper is devoted toreport the results of investigations on dielectric relaxation and a.c.conduction phenomena and to analyze the results of these studieswith the aid of the data on spectroscopic studies (optical absorption,ESR, IR) of LiF–TiO2–P2O5 glasses mixed with different concentra-tions of silver ions.
2. Experimental methods
For the present study, a particular composition (39.5 − x)LiF–0.5TiO2–60P2O5:xAg2O with eight values of x ranging from 0 to 1.5 is chosen. The detailedcompositions are as follows:
A0: 39.5LiF–0.5TiO2–60P2O5
A2: 39.3LiF–0.5TiO2–60P2O5:0.2Ag2OA4: 39.1LiF–0.5TiO2–60P2O5:0.4Ag2OA6: 38.9LiF–0.5TiO2–60P2O5:0.6Ag2OA8: 38.7LiF–0.5TiO2–60P2O5:0.8Ag2OA10: 38.5LiF–0.5TiO2–60P2O5:1.0Ag2O
A12: 38.3LiF–0.5TiO2–60P2O5:1.2Ag2OA15: 38.0LiF–0.5TiO2–60P2O5:1.5Ag2OAnalytical grade reagents of P2O5, LiF, Ag2O and TiO2 powders in appropriateamounts (all in mol%) were thoroughly mixed in an agate mortar and melted in aplatinum crucible at 650 ± 10 ◦C in a PID temperature controlled furnace for about
550 M. Nagarjuna et al. / Journal of Alloys and Compounds 479 (2009) 549–556
Table 1Summary of data on physical parameters of LiF–TiO2–P2O5–Ag2O glasses.
Glass Density (g/cm3) Average molecular weight Concentration of Ag+ ions Ni (×1021 ions/cm3) Inter ionic distance of Ag+ ions ri (Å) Polaron radius, rp (Å)
A0 2.323 95.80 – – –A2 2.338 96.22 2.93 6.99 2.82A4 2.340 96.6 5.83 5.55 2.24A 4.86 1.96A 4.418 1.78A 4.10 1.65A 3.87 1.56
1qXCS
suowit∼p0rntBa∼
3
mcai
trcoaaitAaioasti
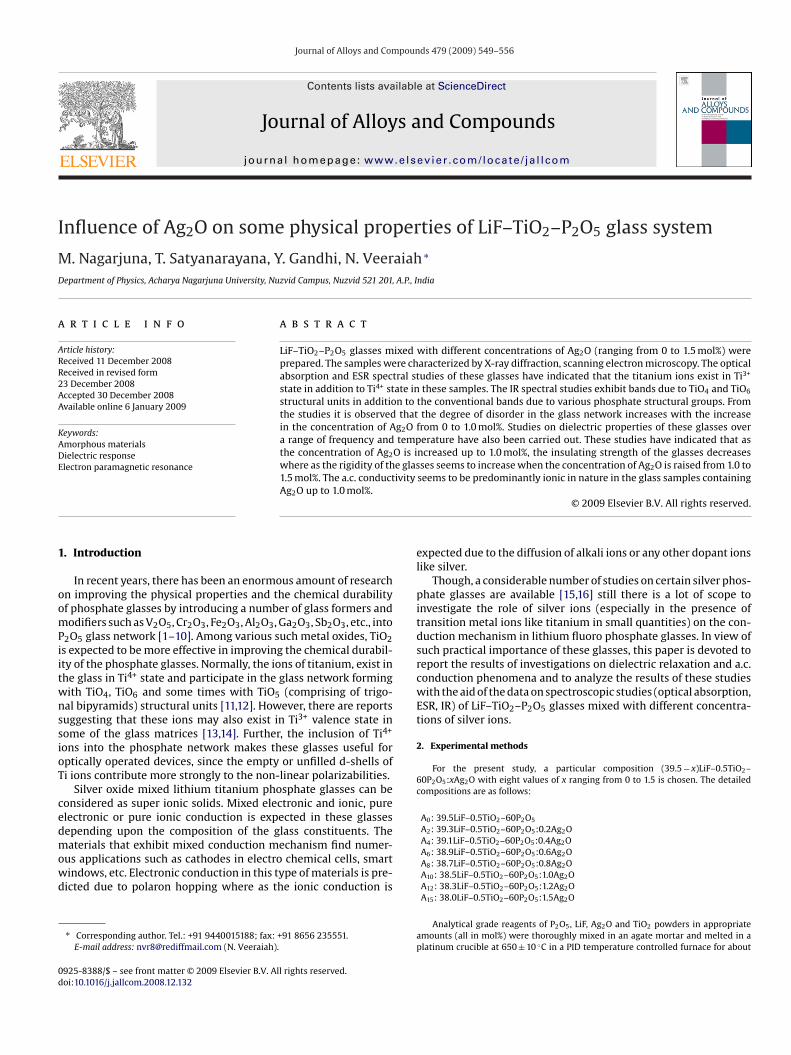
Fig. 1. XRD patterns of LiF–TiO2–P2O5:Ag2O glasses.
TS
G
AAAAAAAA
6 2.344 97.05 8.738 2.346 97.46 11.5910 2. 354 97.87 14.4812 2.359 98.28 17.32
h. The resultant bubble free melt was then poured in a brass mould and subse-uently annealed at 250 ◦C. The amorphous nature of the samples was verified by-ray diffraction technique (using Xpert’s PRO analytical X-ray diffractometer withu K� radiation) and scanning electron microscopy studies using HITACHI S-3400Ncanning Electron Microscope.
The density of the glasses was determined to an accuracy of ±0.0001, by thetandard principle of Archimedes’ using o-xylene (99.99% pure) as the buoyant liq-id. For evaluating the density, the mass of the samples was measured to an accuracyf 0.1 mg using Ohaus digital balance Model AR2140. Infrared transmission spectraere recorded on a JASCO-FT/IR-5300 spectrophotometer to a resolution of 0.1 cm−1
n the spectral range 400–2000 cm−1 using potassium bromide pellets (300 mg) con-aining pulverized sample (1.5 mg). These pellets were pressed in a vacuum die at680 MPa. The optical absorption spectra of the glasses were recorded at room tem-erature in the spectral wavelength range covering 300–900 nm to a resolution of.1 nm using JASCO Model V-670 UV–vis–NIR spectrophotometer. The electron spinesonance (ESR) spectra of the fine powders of the samples were recorded at liquiditrogen temperature on JEOL JES-TES100 X-band EPR spectrometer. The dielec-ric measurements were carried out on LCR Meter (Hewlett-Packard Model-4263) in the frequency range 102–105 Hz and in the temperature range 30–300 ◦C. Theccuracy in the measurement of dielectric constant is ∼0.001 and that of loss is10−4.
. Results
From the measured values of density d and calculated averageolecular weight M̄, various physical parameters such as silver ion
oncentration Ni and mean silver ion separation ri of these glassesre evaluated using the conventional formulae and are presentedn Table 1.
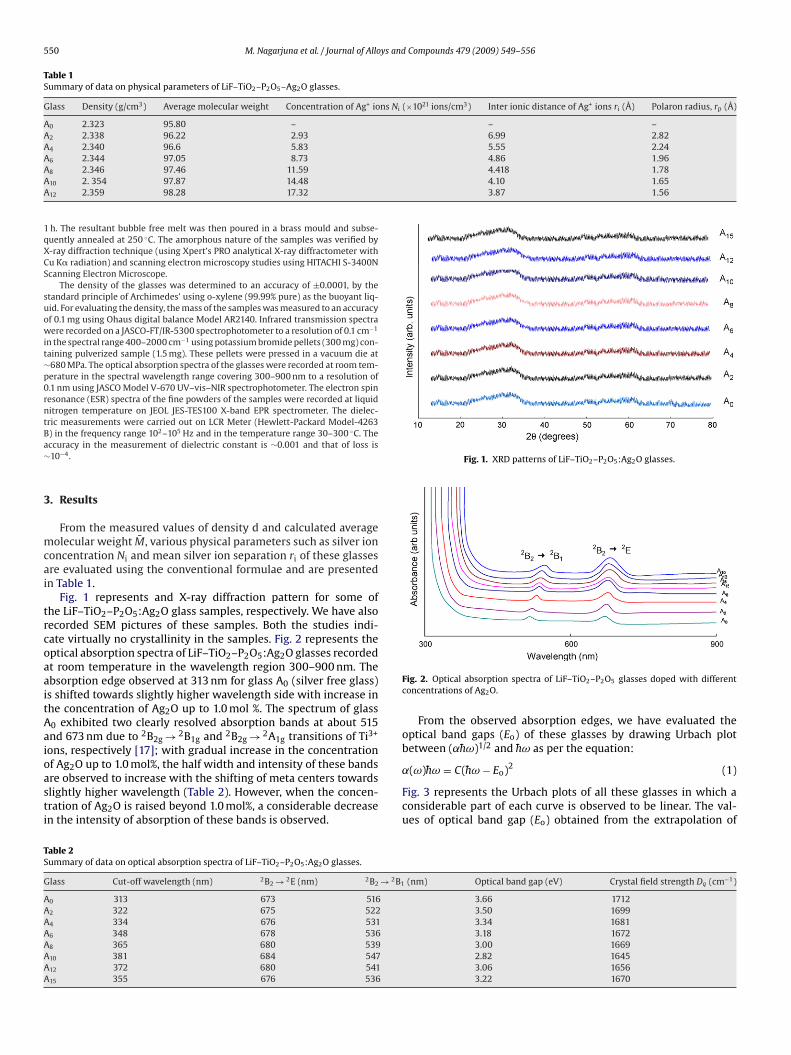
Fig. 1 represents and X-ray diffraction pattern for some ofhe LiF–TiO2–P2O5:Ag2O glass samples, respectively. We have alsoecorded SEM pictures of these samples. Both the studies indi-ate virtually no crystallinity in the samples. Fig. 2 represents theptical absorption spectra of LiF–TiO2–P2O5:Ag2O glasses recordedt room temperature in the wavelength region 300–900 nm. Thebsorption edge observed at 313 nm for glass A0 (silver free glass)s shifted towards slightly higher wavelength side with increase inhe concentration of Ag2O up to 1.0 mol %. The spectrum of glass0 exhibited two clearly resolved absorption bands at about 515nd 673 nm due to 2B2g → 2B1g and 2B2g → 2A1g transitions of Ti3+
ons, respectively [17]; with gradual increase in the concentration
f Ag2O up to 1.0 mol%, the half width and intensity of these bandsre observed to increase with the shifting of meta centers towardslightly higher wavelength (Table 2). However, when the concen-ration of Ag2O is raised beyond 1.0 mol%, a considerable decreasen the intensity of absorption of these bands is observed.able 2ummary of data on optical absorption spectra of LiF–TiO2–P2O5:Ag2O glasses.
lass Cut-off wavelength (nm) 2B2 → 2E (nm) 2B2 → 2B1
0 313 673 5162 322 675 5224 334 676 5316 348 678 5368 365 680 53910 381 684 54712 372 680 54115 355 676 536
Fig. 2. Optical absorption spectra of LiF–TiO2–P2O5 glasses doped with differentconcentrations of Ag2O.
From the observed absorption edges, we have evaluated theoptical band gaps (Eo) of these glasses by drawing Urbach plotbetween (˛h̄ω)1/2 and h̄ω as per the equation:
˛(ω)h̄ω = C(h̄ω − Eo)2 (1)
Fig. 3 represents the Urbach plots of all these glasses in which aconsiderable part of each curve is observed to be linear. The val-ues of optical band gap (Eo) obtained from the extrapolation of
(nm) Optical band gap (eV) Crystal field strength Dq (cm−1)
3.66 17123.50 16993.34 16813.18 16723.00 16692.82 16453.06 16563.22 1670
M. Nagarjuna et al. / Journal of Alloys and Compounds 479 (2009) 549–556 551
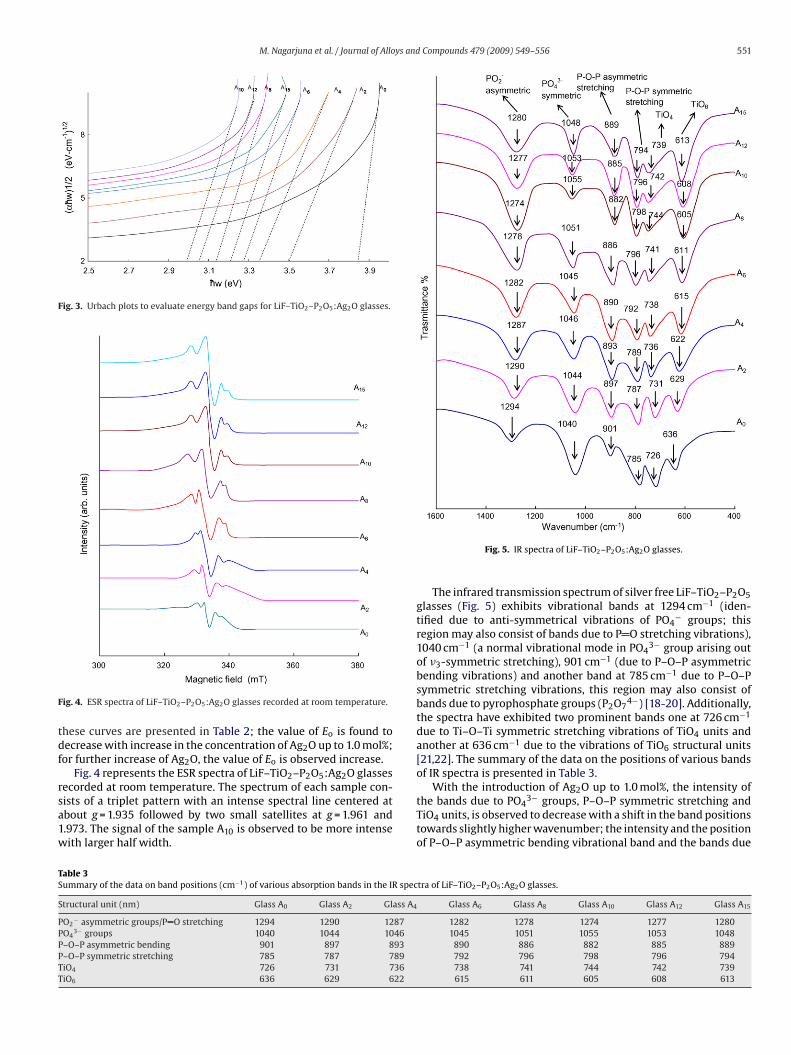
Fig. 3. Urbach plots to evaluate energy band gaps for LiF–TiO2–P2O5:Ag2O glasses.
F
tdf
rsa1w
TS
S
PPPPTT
ig. 4. ESR spectra of LiF–TiO2–P2O5:Ag2O glasses recorded at room temperature.
hese curves are presented in Table 2; the value of Eo is found toecrease with increase in the concentration of Ag2O up to 1.0 mol%;or further increase of Ag2O, the value of Eo is observed increase.
Fig. 4 represents the ESR spectra of LiF–TiO2–P2O5:Ag2O glassesecorded at room temperature. The spectrum of each sample con-
ists of a triplet pattern with an intense spectral line centered atbout g = 1.935 followed by two small satellites at g = 1.961 and.973. The signal of the sample A10 is observed to be more intenseith larger half width.able 3ummary of the data on band positions (cm−1) of various absorption bands in the IR spec
tructural unit (nm) Glass A0 Glass A2 Glass A4
O2− asymmetric groups/P O stretching 1294 1290 1287
O43− groups 1040 1044 1046
–O–P asymmetric bending 901 897 893–O–P symmetric stretching 785 787 789iO4 726 731 736iO6 636 629 622
Fig. 5. IR spectra of LiF–TiO2–P2O5:Ag2O glasses.
The infrared transmission spectrum of silver free LiF–TiO2–P2O5glasses (Fig. 5) exhibits vibrational bands at 1294 cm−1 (iden-tified due to anti-symmetrical vibrations of PO4
− groups; thisregion may also consist of bands due to P O stretching vibrations),1040 cm−1 (a normal vibrational mode in PO4
3− group arising outof �3-symmetric stretching), 901 cm−1 (due to P–O–P asymmetricbending vibrations) and another band at 785 cm−1 due to P–O–Psymmetric stretching vibrations, this region may also consist ofbands due to pyrophosphate groups (P2O7
4−) [18-20]. Additionally,the spectra have exhibited two prominent bands one at 726 cm−1
due to Ti–O–Ti symmetric stretching vibrations of TiO4 units andanother at 636 cm−1 due to the vibrations of TiO6 structural units[21,22]. The summary of the data on the positions of various bandsof IR spectra is presented in Table 3.
With the introduction of Ag2O up to 1.0 mol%, the intensity of
the bands due to PO43− groups, P–O–P symmetric stretching andTiO4 units, is observed to decrease with a shift in the band positionstowards slightly higher wavenumber; the intensity and the positionof P–O–P asymmetric bending vibrational band and the bands due
tra of LiF–TiO2–P2O5:Ag2O glasses.
Glass A6 Glass A8 Glass A10 Glass A12 Glass A15
1282 1278 1274 1277 12801045 1051 1055 1053 1048890 886 882 885 889792 796 798 796 794738 741 744 742 739615 611 605 608 613

552 M. Nagarjuna et al. / Journal of Alloys and Compounds 479 (2009) 549–556
Ft
tiwrIst
(0aFLwaup
oeεepo
icaimt
A10.The ac conductivity �ac is calculated at different temperatures
using the equation:
�ac = ωεo ε′ tan ı (3)
Table 4Summary of data on dielectric loss of LiF–TiO2–P2O5:Ag2O glasses.
Glass Temperature regionof relaxation (◦C)
(tan ımax)avg Activation energyfor dipoles (eV)
A0 119–140 0.0074 3.86A2 114–130 0.0091 3.50A4 99–122 0.0112 3.34
ig. 6. Variation of dielectric constant and dielectric loss with frequency at roomemperature for LiF–TiO2–P2O5:Ag2O glasses.
o P O stretching vibrations and TiO6 structural units exhibited anncreasing trend in this concentration range of Ag2O. Nevertheless,
hen the concentration of dopant is increased beyond 1.0 mol% aeversal trend in the intensity of these bands has been observed.t may be noted here that the band positions of various phosphatetructural groups observed for the present glass samples are foundo be well within the ranges reported in the literature [23,24].
The dielectric constant ε′ and loss tan ı at room temperature30 ◦C) of silver free glass at 100 kHz are measured to be 5.4 and.004, respectively. The values of ε′ and tan ı of all the samplesre found to increase considerably with decrease in frequency.ig. 6 represents the variation of dielectric constant and loss ofiF–TiO2–P2O5 glasses doped with different concentrations of Ag2Oith frequency, measured at room temperature; the parameters, ε′
nd tan ı are observed to increase with the concentration of Ag2Op to 1.0 mol% and for further increase of Ag2O the vales of thesearameters observed to decrease.
The temperature dependence of ε′ at different frequencies forne of the glasses, viz., A6, and that of the glasses doped with differ-nt concentrations of Ag2O at 1 kHz are shown in Fig. 7. The value of′ is found to exhibit a considerable increase at higher temperaturesspecially at lower frequencies; the rate of increase of ε′ with tem-erature is found to be the highest for the glass containing 1.0 mol%f Ag2O.
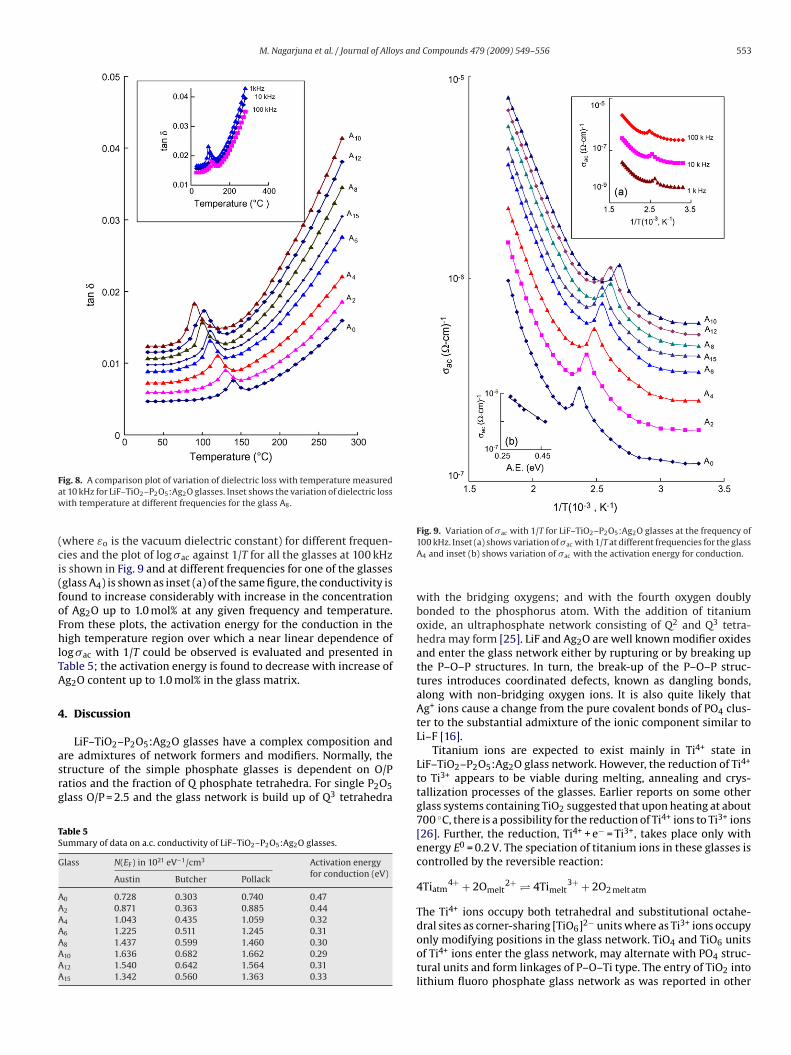
The temperature dependence of tan ı of glass A8 (glass contain-ng 0.8 mol% of Ag2O) at different frequencies (as an inset) and a
omparison plot of variation of tan ı with temperature, measured atfrequency of 10 kHz are presented in Fig. 8. The curves have exhib-ted distinct maxima; with increasing frequency the temperatureaximum shifts towards higher temperature and with increasing
emperature the frequency maximum shifts towards higher fre-
Fig. 7. Comparison plot of variation of dielectric constant with temperature mea-sured at 1 kHz for LiF–TiO2–P2O5:Ag2O glasses. Inset shows the variation of dielectricconstant with temperature for the glass A6 at different frequencies.
quency, indicating the dielectric relaxation character of dielectriclosses of these glasses. Further, the observations on dielectric lossvariation with temperature indicate an increase in the broadnessand (tan ı)max of relaxation curves with a shift of tan ımax towardslower temperature with increase in the concentration of Ag2O upto 1.0 mol%.
The effective activation energy Wd, for the dipoles is evaluatedfor all the glasses using the relation:
f = fo e−Wd/kT , (2)
and furnished in Table 4 along with other pertinent data on dielec-tric loss. The activation energy is found to be the lowest for the glass
A6 87–110 0.0134 3.26A8 80–106 0.0156 3.14A10 60–90 0.0183 2.98A12 70–95 0.0165 3.25A15 85–107 0.0143 3.38
M. Nagarjuna et al. / Journal of Alloys and Compounds 479 (2009) 549–556 553
Faw
(ci(foFhlTA
4
asrg
TS
G
AAAAAAAA
ig. 8. A comparison plot of variation of dielectric loss with temperature measuredt 10 kHz for LiF–TiO2–P2O5:Ag2O glasses. Inset shows the variation of dielectric lossith temperature at different frequencies for the glass A8.
where εo is the vacuum dielectric constant) for different frequen-ies and the plot of log �ac against 1/T for all the glasses at 100 kHzs shown in Fig. 9 and at different frequencies for one of the glassesglass A4) is shown as inset (a) of the same figure, the conductivity isound to increase considerably with increase in the concentrationf Ag2O up to 1.0 mol% at any given frequency and temperature.rom these plots, the activation energy for the conduction in theigh temperature region over which a near linear dependence of
og �ac with 1/T could be observed is evaluated and presented inable 5; the activation energy is found to decrease with increase ofg2O content up to 1.0 mol% in the glass matrix.
. Discussion
LiF–TiO2–P2O5:Ag2O glasses have a complex composition and
re admixtures of network formers and modifiers. Normally, thetructure of the simple phosphate glasses is dependent on O/Patios and the fraction of Q phosphate tetrahedra. For single P2O5lass O/P = 2.5 and the glass network is build up of Q3 tetrahedraable 5ummary of data on a.c. conductivity of LiF–TiO2–P2O5:Ag2O glasses.
lass N(EF) in 1021 eV−1/cm3 Activation energyfor conduction (eV)
Austin Butcher Pollack
0 0.728 0.303 0.740 0.472 0.871 0.363 0.885 0.444 1.043 0.435 1.059 0.326 1.225 0.511 1.245 0.318 1.437 0.599 1.460 0.3010 1.636 0.682 1.662 0.2912 1.540 0.642 1.564 0.3115 1.342 0.560 1.363 0.33
Fig. 9. Variation of �ac with 1/T for LiF–TiO2–P2O5:Ag2O glasses at the frequency of100 kHz. Inset (a) shows variation of �ac with 1/T at different frequencies for the glassA4 and inset (b) shows variation of �ac with the activation energy for conduction.
with the bridging oxygens; and with the fourth oxygen doublybonded to the phosphorus atom. With the addition of titaniumoxide, an ultraphosphate network consisting of Q2 and Q3 tetra-hedra may form [25]. LiF and Ag2O are well known modifier oxidesand enter the glass network either by rupturing or by breaking upthe P–O–P structures. In turn, the break-up of the P–O–P struc-tures introduces coordinated defects, known as dangling bonds,along with non-bridging oxygen ions. It is also quite likely thatAg+ ions cause a change from the pure covalent bonds of PO4 clus-ter to the substantial admixture of the ionic component similar toLi–F [16].
Titanium ions are expected to exist mainly in Ti4+ state inLiF–TiO2–P2O5:Ag2O glass network. However, the reduction of Ti4+
to Ti3+ appears to be viable during melting, annealing and crys-tallization processes of the glasses. Earlier reports on some otherglass systems containing TiO2 suggested that upon heating at about700 ◦C, there is a possibility for the reduction of Ti4+ ions to Ti3+ ions[26]. Further, the reduction, Ti4+ + e− = Ti3+, takes place only withenergy E0 = 0.2 V. The speciation of titanium ions in these glasses iscontrolled by the reversible reaction:
4Tiatm4+ + 2Omelt
2+ � 4Timelt3+ + 2O2 melt atm
The Ti4+ ions occupy both tetrahedral and substitutional octahe-dral sites as corner-sharing [TiO ]2− units where as Ti3+ ions occupy
6only modifying positions in the glass network. TiO4 and TiO6 unitsof Ti4+ ions enter the glass network, may alternate with PO4 struc-tural units and form linkages of P–O–Ti type. The entry of TiO2 intolithium fluoro phosphate glass network as was reported in other
5 ys and
a
wa
T
P
o
he
i6tissTlptTes
nncoidillwtTlt
nBend
54 M. Nagarjuna et al. / Journal of Allo
lkali phosphate glasses may be visualized as follows:
P2O5 ≡ 2[POO3/2]; TiO2 ≡ [TiO4/2];
TiO2 + 2[POO3/2] ⇒ [TiO6/2]2− + 2[PO4/2]+
Entry of TiO6 octahedral in to LiF–TiO2–P2O5:Ag2O glass net-ork may twist or distort the interconnected chains of PO4 units
nd increase the randomness of the glass network.The ingress of Ag+ ions are expected to modify P–O–Ti and
i–O–Ti linkages as
–O–Ti + Ag2O → P–O–Ag+ + Ti–O − Ag+
r
As a consequence a disruption in the PO4 and TiO4 tetra-edra with the creation of a number of bonding defects arexpected.
Using Tanabe–Sugano diagrams for d1 ions, the bands observedn the optical absorption spectra in the regions 510–550 nm and70–685 nm are assigned to 2B2g → 2B1g and 2B2g → 2A1g transi-ions of 3d1 electron of the Ti3+ ions, respectively. With the gradualncrease in the concentration of dopant Ag2O up to 1.0 mol% in theample, these bands have exhibited red shift with increasing inten-ity. So one can conclude that: (i) an increase in the concentration ofi3+ ions or decrease in the concentration of Ti4+ ions and (ii) weakerigand field of existing Ti3+ ions in these samples. The ligand fieldarameter Dq (crystal field strength) is evaluated using energies ofhese transitions and the values obtained are furnished in Table 2.he variation of the parameter Dq with the concentration of Ag2Oxhibited the lowest value for the glass A10. This dependence is justimilar to optical band gap.
As mentioned earlier, Ag+ ions and the octahedrally coordi-ated Ti3+ ions act as modifiers similar to lithium ions and induceon-bridging oxygens (NBOs) in the glass network. The higher theoncentration of these modifier ions, the higher is the concentrationf NBOs in the glass matrix. Because of these reasons an increasen the degree of localization of electrons there by an increase in theonor centers in the glass network is expected. The gradual increase
n the concentration of Ag+ ions and Ti3+ ions causes a creation ofarge number of donor centers; subsequently, the excited states ofocalized electrons originally trapped on Ti3+ sites begin to overlap
ith the empty 3d states on the neighboring Ti4+ sites. As a result,he impurity band becomes more extended into the main band gap.his development might have shifted the absorption edge to theower energy (Table 2) which leads up to a significant shrinkage inhe band gap as observed.
The higher concentration of Ti4+ ions that participate in the glass
etwork, the lower is the concentration of NBOs in the glass matrix.ecause of this reason a decrease in the degree of localization oflectrons or a decrease in the donor centers in the glass–ceramicetwork is expected. The presence of smaller concentration of theseonor centers increases the optical band gap and shifts the absorp-Compounds 479 (2009) 549–556
tion edge towards lower wavelength side as observed for the glassesA12 and A15.
In the ESR spectrum the central line at g = 1.94 is due to tetrago-nally compressed octahedral sites of Ti3+ ions with |xy〉 ground state
[27,28] where as the auxiliary components are due to the hyper-fine interaction of an unpaired electron with two equivalent I = 1/2nuclear spins. Based up on the earlier reports [29,30], it seems rea-sonable to attribute the observed triplet to TiF2+ molecular ion. Therelatively highest intensity and half-width of the signal observedfor the spectrum of the sample A10 suggests a larger concentrationof reduced Ti4+ ions in to Ti3+ ions in this sample.
The IR spectra of these glasses appears to be dominatedby orthophosphate structural units; however, the band due topyrophosphate structural units lies around 1090 cm−1, which is nottoo far from the band position of PO4
3− units. Hence the observedband at about 1050 cm−1 in the spectra of these glasses may be con-sidered as the superposition of these two bands, especially in thespectrum of more disordered glass. The same is true for metaphos-phate groups also, because the band due to these groups is expectedat about 1280 cm−1 [31].
If silver and trivalent titanium ions act as modifiers, the �-bondof P O may be ruptured, creating new non-bridging oxygens. Evenif Ti4+ ions enter substitutional positions with octahedral units inthe glass network, the PO4 structural units are subjected to per-turbations (like bonding, compression and chemical interactions)due to change in the environment and the incompatibility in ionsize. As a result, PO4 structural units undergo structural distortionsinvolving changes in bond lengths and angles of P–O bonds. Forthese reasons we expect decrease in the intensity, PO4
3− symmetricstretching and a band due to P–O–P symmetric/Ti–O–P stretchingvibrations in the IR spectra. The observed gradual decrease in theintensity of these bands in the spectra of the glasses A0–A10 maybe ascribed to these reasons. The observed increase in the inten-sity of these symmetrical bands and simultaneous decrease in theintensity of the bands due to P–O–P asymmetric vibrations in thespectra of the glasses A10–A15 suggests that, in the networks of theseglasses, the titanium ions mostly occupy tetrahedral positions andtheir positions are less disturbed by silver ions.
In general, the dielectric constant of a material is due toelectronic, ionic, dipolar and space charge polarizations. Out ofthese, the space charge contribution depends on the perfectionof the glasses. Recollecting the data, on dielectric properties, forLiF–TiO2–P2O5:Ag2O glasses, the slight increase in the dielectricconstant and loss at room temperature, particularly at low frequen-cies can be ascribed to the defects produced in the glass networkthat contribute to the space charge polarization. With the gradualincrease of Ag2O up to 1.0 mol% in the glass network, the values ofε′, tan ı and �ac are found to increase at any frequency and temper-ature and the activation energy for a.c. conduction is observed todecrease; such variations of these parameters are obviously due tolarger space charge polarization owing to the enhanced degree of
disorder in the glass network.To be more specific, the concentration of Ag2O is increased upto 1.0 mol% in the glass network, there is a growing presence of Ti3+
ions in the glass network; these ions similar to Li+ and Ag+ ionsdisrupt the glass network as mentioned earlier. The defects thus
M. Nagarjuna et al. / Journal of Alloys and Compounds 479 (2009) 549–556 555
Ff
pwitgcttvp
wiaad
ε
ε
pstsεirs
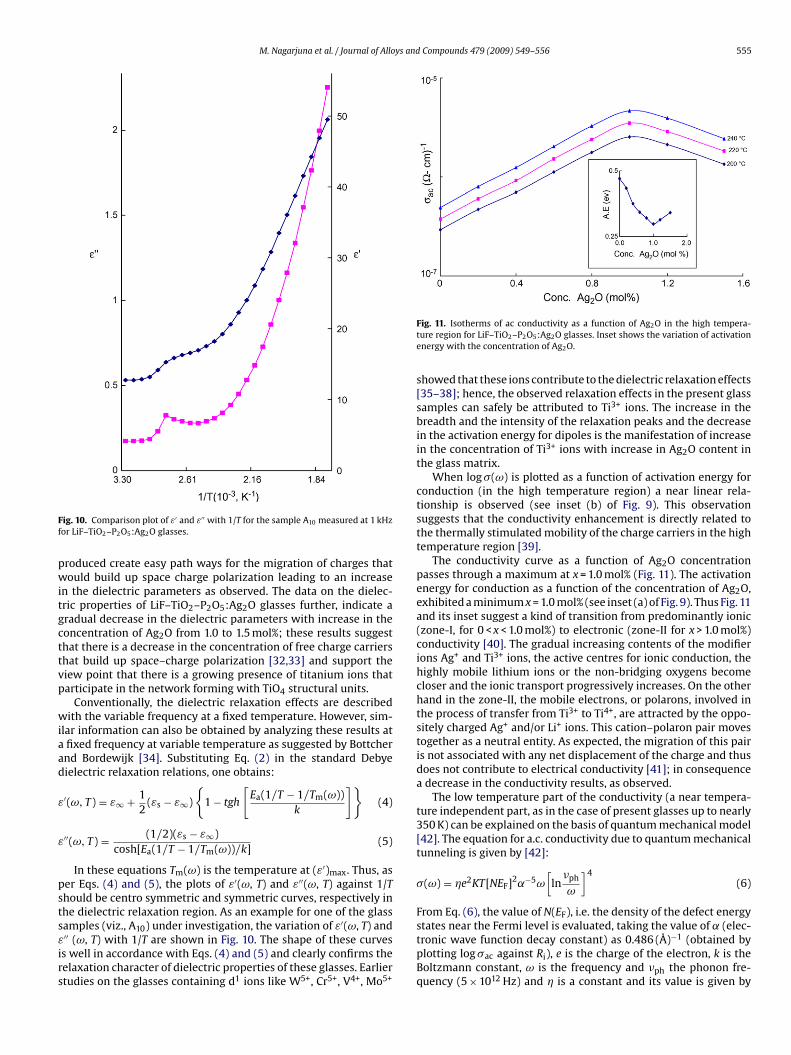
ig. 10. Comparison plot of ε′ and ε′′ with 1/T for the sample A10 measured at 1 kHzor LiF–TiO2–P2O5:Ag2O glasses.
roduced create easy path ways for the migration of charges thatould build up space charge polarization leading to an increase
n the dielectric parameters as observed. The data on the dielec-ric properties of LiF–TiO2–P2O5:Ag2O glasses further, indicate aradual decrease in the dielectric parameters with increase in theoncentration of Ag2O from 1.0 to 1.5 mol%; these results suggesthat there is a decrease in the concentration of free charge carriershat build up space–charge polarization [32,33] and support theiew point that there is a growing presence of titanium ions thatarticipate in the network forming with TiO4 structural units.
Conventionally, the dielectric relaxation effects are describedith the variable frequency at a fixed temperature. However, sim-
lar information can also be obtained by analyzing these results atfixed frequency at variable temperature as suggested by Bottchernd Bordewijk [34]. Substituting Eq. (2) in the standard Debyeielectric relaxation relations, one obtains:
′(ω, T) = ε∞ + 12
(εs − ε∞)
{1 − tgh
[Ea(1/T − 1/Tm(ω))
k
]}(4)
′′(ω, T) = (1/2)(εs − ε∞)cosh[Ea(1/T − 1/Tm(ω))/k]
(5)
In these equations Tm(ω) is the temperature at (ε′)max. Thus, aser Eqs. (4) and (5), the plots of ε′(ω, T) and ε′′(ω, T) against 1/Thould be centro symmetric and symmetric curves, respectively inhe dielectric relaxation region. As an example for one of the glass
′
amples (viz., A10) under investigation, the variation of ε (ω, T) and′′ (ω, T) with 1/T are shown in Fig. 10. The shape of these curvess well in accordance with Eqs. (4) and (5) and clearly confirms theelaxation character of dielectric properties of these glasses. Earliertudies on the glasses containing d1 ions like W5+, Cr5+, V4+, Mo5+Fig. 11. Isotherms of ac conductivity as a function of Ag2O in the high tempera-ture region for LiF–TiO2–P2O5:Ag2O glasses. Inset shows the variation of activationenergy with the concentration of Ag2O.
showed that these ions contribute to the dielectric relaxation effects[35–38]; hence, the observed relaxation effects in the present glasssamples can safely be attributed to Ti3+ ions. The increase in thebreadth and the intensity of the relaxation peaks and the decreasein the activation energy for dipoles is the manifestation of increasein the concentration of Ti3+ ions with increase in Ag2O content inthe glass matrix.
When log �(ω) is plotted as a function of activation energy forconduction (in the high temperature region) a near linear rela-tionship is observed (see inset (b) of Fig. 9). This observationsuggests that the conductivity enhancement is directly related tothe thermally stimulated mobility of the charge carriers in the hightemperature region [39].
The conductivity curve as a function of Ag2O concentrationpasses through a maximum at x = 1.0 mol% (Fig. 11). The activationenergy for conduction as a function of the concentration of Ag2O,exhibited a minimum x = 1.0 mol% (see inset (a) of Fig. 9). Thus Fig. 11and its inset suggest a kind of transition from predominantly ionic(zone-I, for 0 < x < 1.0 mol%) to electronic (zone-II for x > 1.0 mol%)conductivity [40]. The gradual increasing contents of the modifierions Ag+ and Ti3+ ions, the active centres for ionic conduction, thehighly mobile lithium ions or the non-bridging oxygens becomecloser and the ionic transport progressively increases. On the otherhand in the zone-II, the mobile electrons, or polarons, involved inthe process of transfer from Ti3+ to Ti4+, are attracted by the oppo-sitely charged Ag+ and/or Li+ ions. This cation–polaron pair movestogether as a neutral entity. As expected, the migration of this pairis not associated with any net displacement of the charge and thusdoes not contribute to electrical conductivity [41]; in consequencea decrease in the conductivity results, as observed.
The low temperature part of the conductivity (a near tempera-ture independent part, as in the case of present glasses up to nearly350 K) can be explained on the basis of quantum mechanical model[42]. The equation for a.c. conductivity due to quantum mechanicaltunneling is given by [42]:
�(ω) = �e2KT[NEF]2˛−5ω[
ln�ph
ω
]4(6)
From Eq. (6), the value of N(EF), i.e. the density of the defect energy
states near the Fermi level is evaluated, taking the value of ˛ (elec-tronic wave function decay constant) as 0.486 (Å)−1 (obtained byplotting log �ac against Ri), e is the charge of the electron, k is theBoltzmann constant, ω is the frequency and �ph the phonon fre-quency (5 × 10¹² Hz) and � is a constant and its value is given by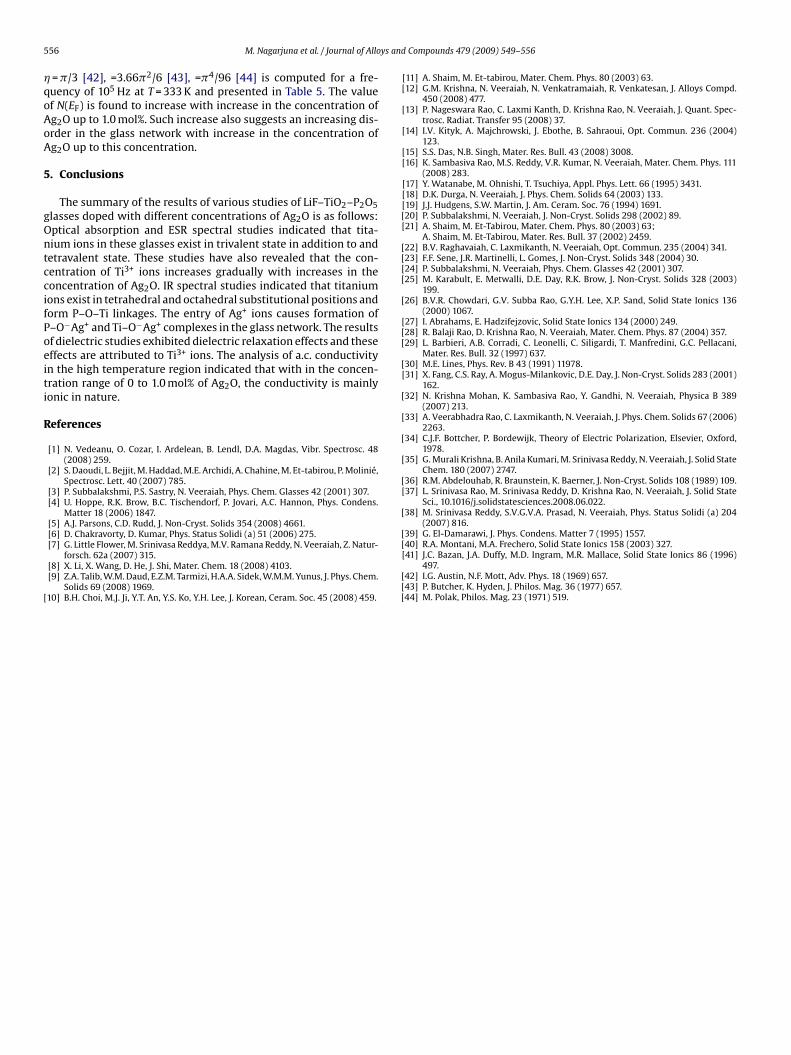
5 ys and
�qoAoA
5
gOntccifPoeiti
R
[
[
[[[[
[
[[
[
[
[
[
[
[
[
[
56 M. Nagarjuna et al. / Journal of Allo
= �/3 [42], =3.66�2/6 [43], =�4/96 [44] is computed for a fre-uency of 105 Hz at T = 333 K and presented in Table 5. The valuef N(EF) is found to increase with increase in the concentration ofg2O up to 1.0 mol%. Such increase also suggests an increasing dis-rder in the glass network with increase in the concentration ofg2O up to this concentration.
. Conclusions
The summary of the results of various studies of LiF–TiO2–P2O5lasses doped with different concentrations of Ag2O is as follows:ptical absorption and ESR spectral studies indicated that tita-ium ions in these glasses exist in trivalent state in addition to andetravalent state. These studies have also revealed that the con-entration of Ti3+ ions increases gradually with increases in theoncentration of Ag2O. IR spectral studies indicated that titaniumons exist in tetrahedral and octahedral substitutional positions andorm P–O–Ti linkages. The entry of Ag+ ions causes formation of–O−Ag+ and Ti–O−Ag+ complexes in the glass network. The resultsf dielectric studies exhibited dielectric relaxation effects and theseffects are attributed to Ti3+ ions. The analysis of a.c. conductivityn the high temperature region indicated that with in the concen-ration range of 0 to 1.0 mol% of Ag2O, the conductivity is mainlyonic in nature.
eferences
[1] N. Vedeanu, O. Cozar, I. Ardelean, B. Lendl, D.A. Magdas, Vibr. Spectrosc. 48(2008) 259.
[2] S. Daoudi, L. Bejjit, M. Haddad, M.E. Archidi, A. Chahine, M. Et-tabirou, P. Molinié,Spectrosc. Lett. 40 (2007) 785.
[3] P. Subbalakshmi, P.S. Sastry, N. Veeraiah, Phys. Chem. Glasses 42 (2001) 307.[4] U. Hoppe, R.K. Brow, B.C. Tischendorf, P. Jovari, A.C. Hannon, Phys. Condens.
Matter 18 (2006) 1847.[5] A.J. Parsons, C.D. Rudd, J. Non-Cryst. Solids 354 (2008) 4661.[6] D. Chakravorty, D. Kumar, Phys. Status Solidi (a) 51 (2006) 275.
[7] G. Little Flower, M. Srinivasa Reddya, M.V. Ramana Reddy, N. Veeraiah, Z. Natur-forsch. 62a (2007) 315.[8] X. Li, X. Wang, D. He, J. Shi, Mater. Chem. 18 (2008) 4103.[9] Z.A. Talib, W.M. Daud, E.Z.M. Tarmizi, H.A.A. Sidek, W.M.M. Yunus, J. Phys. Chem.
Solids 69 (2008) 1969.10] B.H. Choi, M.J. Ji, Y.T. An, Y.S. Ko, Y.H. Lee, J. Korean, Ceram. Soc. 45 (2008) 459.
[
[[[
Compounds 479 (2009) 549–556
[11] A. Shaim, M. Et-tabirou, Mater. Chem. Phys. 80 (2003) 63.[12] G.M. Krishna, N. Veeraiah, N. Venkatramaiah, R. Venkatesan, J. Alloys Compd.
450 (2008) 477.[13] P. Nageswara Rao, C. Laxmi Kanth, D. Krishna Rao, N. Veeraiah, J. Quant. Spec-
trosc. Radiat. Transfer 95 (2008) 37.[14] I.V. Kityk, A. Majchrowski, J. Ebothe, B. Sahraoui, Opt. Commun. 236 (2004)
123.[15] S.S. Das, N.B. Singh, Mater. Res. Bull. 43 (2008) 3008.[16] K. Sambasiva Rao, M.S. Reddy, V.R. Kumar, N. Veeraiah, Mater. Chem. Phys. 111
(2008) 283.[17] Y. Watanabe, M. Ohnishi, T. Tsuchiya, Appl. Phys. Lett. 66 (1995) 3431.[18] D.K. Durga, N. Veeraiah, J. Phys. Chem. Solids 64 (2003) 133.[19] J.J. Hudgens, S.W. Martin, J. Am. Ceram. Soc. 76 (1994) 1691.20] P. Subbalakshmi, N. Veeraiah, J. Non-Cryst. Solids 298 (2002) 89.
[21] A. Shaim, M. Et-Tabirou, Mater. Chem. Phys. 80 (2003) 63;A. Shaim, M. Et-Tabirou, Mater. Res. Bull. 37 (2002) 2459.
22] B.V. Raghavaiah, C. Laxmikanth, N. Veeraiah, Opt. Commun. 235 (2004) 341.23] F.F. Sene, J.R. Martinelli, L. Gomes, J. Non-Cryst. Solids 348 (2004) 30.24] P. Subbalakshmi, N. Veeraiah, Phys. Chem. Glasses 42 (2001) 307.25] M. Karabult, E. Metwalli, D.E. Day, R.K. Brow, J. Non-Cryst. Solids 328 (2003)
199.26] B.V.R. Chowdari, G.V. Subba Rao, G.Y.H. Lee, X.P. Sand, Solid State Ionics 136
(2000) 1067.[27] I. Abrahams, E. Hadzifejzovic, Solid State Ionics 134 (2000) 249.28] R. Balaji Rao, D. Krishna Rao, N. Veeraiah, Mater. Chem. Phys. 87 (2004) 357.29] L. Barbieri, A.B. Corradi, C. Leonelli, C. Siligardi, T. Manfredini, G.C. Pellacani,
Mater. Res. Bull. 32 (1997) 637.30] M.E. Lines, Phys. Rev. B 43 (1991) 11978.
[31] X. Fang, C.S. Ray, A. Mogus-Milankovic, D.E. Day, J. Non-Cryst. Solids 283 (2001)162.
32] N. Krishna Mohan, K. Sambasiva Rao, Y. Gandhi, N. Veeraiah, Physica B 389(2007) 213.
33] A. Veerabhadra Rao, C. Laxmikanth, N. Veeraiah, J. Phys. Chem. Solids 67 (2006)2263.
34] C.J.F. Bottcher, P. Bordewijk, Theory of Electric Polarization, Elsevier, Oxford,1978.
35] G. Murali Krishna, B. Anila Kumari, M. Srinivasa Reddy, N. Veeraiah, J. Solid StateChem. 180 (2007) 2747.
36] R.M. Abdelouhab, R. Braunstein, K. Baerner, J. Non-Cryst. Solids 108 (1989) 109.[37] L. Srinivasa Rao, M. Srinivasa Reddy, D. Krishna Rao, N. Veeraiah, J. Solid State
Sci., 10.1016/j.solidstatesciences.2008.06.022.38] M. Srinivasa Reddy, S.V.G.V.A. Prasad, N. Veeraiah, Phys. Status Solidi (a) 204
(2007) 816.39] G. El-Damarawi, J. Phys. Condens. Matter 7 (1995) 1557.
40] R.A. Montani, M.A. Frechero, Solid State Ionics 158 (2003) 327.[41] J.C. Bazan, J.A. Duffy, M.D. Ingram, M.R. Mallace, Solid State Ionics 86 (1996)497.
42] I.G. Austin, N.F. Mott, Adv. Phys. 18 (1969) 657.43] P. Butcher, K. Hyden, J. Philos. Mag. 36 (1977) 657.44] M. Polak, Philos. Mag. 23 (1971) 519.


![Journal of Alloys and Compounds - nimte.ac.cn...thermal transport properties between magnetic refrigerants and heat-exchange medium [24]. Therefore, the Fe-based glassy alloys with](https://static.fdocuments.in/doc/165x107/60d2bd31873414242c6a7eb3/journal-of-alloys-and-compounds-nimteaccn-thermal-transport-properties-between.jpg)