
JOURNAL OF AGRICULTURAL ENGINEERING AND TECHNOLOGY (JAET)niae.net/journals/vol20-1.pdf · Journal...
100
Journal of Agricultural Engineering and Technology (JAET), Volume 20 (No. 1) June, 2012 Nigerian Institution of Agricultural Engineers © www.niae.net i JOURNAL OF AGRICULTURAL ENGINEERING AND TECHNOLOGY (JAET) EDITORIAL BOARD Editor-In-Chief Professor A. P. Onwualu, FAS Raw Materials Research and Development Council (RMRDC) 17 Aguiyi Ironsi Street, Maitama District, PMB 232 Garki, Abuja, Nigeria. [email protected] ; [email protected] Phone: 08037432497 Prof. B. Umar – Editor, Power and Machinery Adamawa State Polytechnic, Yola, Adamawa State, Nigeria. E-mail: [email protected] Phone: 08023825894 Prof. A. A. Olufayo – Editor, Soil and Water Engineering Agricultural Engineering Department, Federal University of Technology, Akure, Ondo State, Nigeria. E-mail: [email protected] Phone: 08034708846 Prof. A. Ajisegiri – Editor, Food Engineering College of Engineering, University of Agriculture, Abeokuta, Ogun State, Nigeria. E-mail: [email protected] Phone: 08072766472 Prof. K. Oje – Editor, Processing and Post Harvest Engineering Agric. and Bio-resources Engineering Department, University of Ilorin, Kwara State, Nigeria. E-mail: [email protected] Phone: 08033853895 Dr. A. El-Okene - Editor, Structures and Environmental Control Engineering Agricultural Engineering Department, Ahmadu Bello University, Zaria, Kaduna State, Nigeria. E-mail: [email protected] Phone: 08023633464 Prof. D. S. Zibokere – Editor, Environmental Engineering Agric. and Environmental Engineering Dept., Niger Delta University, Wilberforce Island, Yenegoa. E-mail: [email protected] Phone: 08037079321 Prof. C. C. Mbajiorgu – Editor, Emerging Technologies Agricultural and Bioresources Engineering Department, University of Nigeria, Nsukka, Nigeria. E-mail: [email protected] Phone: 07038680071 Prof. (Mrs) Z. D. Osunde – Editor, Processing and Post Harvest Engineering Agricultural Engineering Department, Federal University of Technology, Minna, Niger State, Nigeria. E-mail: [email protected] Phone: 08034537068 Mr. Y. Kasali – Business Manager National Centre for Agricultural Mechanization, PMB 1525, Ilorin, Kwara State, Nigeria. E-mail: [email protected] Phone: 08033964055 Mr. J. C. Adama – Editorial Assistant Agricultural Engineering Department, University of Agriculture, Umudike, Abia State, Nigeria. E-mail: [email protected] Phone: 08052806052 Dr. B. O. Ugwuishiwu – Editorial Assistant Agricultural and Bioresource Engineering Department, University of Nigeria, Nsukka, Nigeria. E-mail: [email protected] Phone: 08043119327 Miss I. C. Olife – Technical Assistant to Editor-In-Chief Raw Materials Research and Development Council, Abuja, Nigeria. E-mail: [email protected] Phone: 08033916555
-
Upload
nguyenquynh -
Category
Documents
-
view
225 -
download
0
Transcript of JOURNAL OF AGRICULTURAL ENGINEERING AND TECHNOLOGY (JAET)niae.net/journals/vol20-1.pdf · Journal...

Journal of Agricultural Engineering and Technology (JAET), Volume 20 (No. 1) June, 2012
Nigerian Institution of Agricultural Engineers © www.niae.net i
JOURNAL OF AGRICULTURAL ENGINEERING AND TECHNOLOGY (JAET)
EDITORIAL BOARDEditor-In-Chief
Professor A. P. Onwualu, FASRaw Materials Research and Development Council (RMRDC)
17 Aguiyi Ironsi Street, Maitama District, PMB 232 Garki, Abuja, [email protected]; [email protected] Phone: 08037432497
Prof. B. Umar – Editor, Power and MachineryAdamawa State Polytechnic, Yola, Adamawa State, Nigeria.E-mail: [email protected] Phone: 08023825894
Prof. A. A. Olufayo – Editor, Soil and Water EngineeringAgricultural Engineering Department, Federal University of Technology, Akure, Ondo State, Nigeria.E-mail: [email protected] Phone: 08034708846
Prof. A. Ajisegiri – Editor, Food EngineeringCollege of Engineering, University of Agriculture, Abeokuta, Ogun State, Nigeria.E-mail: [email protected] Phone: 08072766472
Prof. K. Oje – Editor, Processing and Post Harvest EngineeringAgric. and Bio-resources Engineering Department, University of Ilorin, Kwara State, Nigeria.E-mail: [email protected] Phone: 08033853895
Dr. A. El-Okene - Editor, Structures and Environmental Control EngineeringAgricultural Engineering Department, Ahmadu Bello University, Zaria, Kaduna State, Nigeria.E-mail: [email protected] Phone: 08023633464
Prof. D. S. Zibokere – Editor, Environmental EngineeringAgric. and Environmental Engineering Dept., Niger Delta University, Wilberforce Island, Yenegoa.E-mail: [email protected] Phone: 08037079321
Prof. C. C. Mbajiorgu – Editor, Emerging TechnologiesAgricultural and Bioresources Engineering Department, University of Nigeria, Nsukka, Nigeria.E-mail: [email protected] Phone: 07038680071
Prof. (Mrs) Z. D. Osunde – Editor, Processing and Post Harvest EngineeringAgricultural Engineering Department, Federal University of Technology, Minna, Niger State, Nigeria.E-mail: [email protected] Phone: 08034537068
Mr. Y. Kasali – Business ManagerNational Centre for Agricultural Mechanization, PMB 1525, Ilorin, Kwara State, Nigeria.E-mail: [email protected] Phone: 08033964055
Mr. J. C. Adama – Editorial AssistantAgricultural Engineering Department, University of Agriculture, Umudike, Abia State, Nigeria.E-mail: [email protected] Phone: 08052806052
Dr. B. O. Ugwuishiwu – Editorial AssistantAgricultural and Bioresource Engineering Department, University of Nigeria, Nsukka, Nigeria.E-mail: [email protected] Phone: 08043119327
Miss I. C. Olife – Technical Assistant to Editor-In-ChiefRaw Materials Research and Development Council, Abuja, Nigeria.E-mail: [email protected] Phone: 08033916555

Journal of Agricultural Engineering and Technology (JAET), Volume 20 (No. 1) June, 2012
Nigerian Institution of Agricultural Engineers © www.niae.net ii
Aims and Scope
The main aim of the Journal of Agricultural Engineering and Technology (JAET) is to provide a mediumfor dissemination of high quality Technical and Scientific information emanating from research onEngineering for Agriculture. This, it is hoped will encourage researchers in the area to continue todevelop cutting edge technologies for solving the numerous engineering problems facing agriculture inthe third world in particular and the world in general.
The Journal publishes original research papers, review articles, technical notes and book reviews inAgricultural Engineering and related subjects. Key areas covered by the journal are: Agricultural Powerand Machinery; Agricultural Process Engineering; Food Engineering; Post-Harvest Engineering; Soil andWater Engineering; Environmental Engineering; Agricultural Structures and Environmental Control;Waste Management; Aquacultural Engineering; Animal Production Engineering and the EmergingTechnology Areas of Information and Communications Technology (ICT) Applications, Computer BasedSimulation, Instrumentation and Process Control, CAD/CAM Systems, Biotechnology, BiologicalEngineering, Biosystems Engineering, Bioresources Engineering, Nanotechnology and RenewableEnergy. The journal also considers relevant manuscripts from related disciplines such as other fields ofEngineering, Food Science and Technology, Physical Sciences, Agriculture and Environmental Sciences.
The Journal is published by the Nigerian Institution of Agricultural Engineers (NIAE), A Division ofNigerian Society of Engineers (NSE). The Editorial Board and NIAE wish to make it clear that statementsor views expressed in papers published in this journal are those of the authors and no responsibility isassumed for the accuracy of such statements or views. In the interest of factual recording, occasionalreference to manufacturers, trade names and proprietary products may be inevitable. No endorsement ofa named product is intended nor is any criticism implied of similar products that are not mentioned.
Submission of an article for publication implies that it has not been previously published and is not beingconsidered for publication elsewhere. The Journal’s peer review policy demands that at least tworeviewers give positive recommendations before the paper is accepted for publication. Prospectiveauthors are advised to consult the Guide for Authors which is available in each volume of the Journal.Four copies of the manuscript should be sent to:
The Editor-In-ChiefJournal of Agricultural Engineering and Technology (JAET)℅ The Editorial OfficeNational Centre for Agricultural Mechanization (NCAM)P.M.B. 1525Ilorin, Kwara State,Nigeria.
Papers can also be submitted directly to the Editor-In-Chief or any of the Sectional Editors. Those whohave access to the internet can submit electronically as an attached file in MS Word [email protected]; [email protected]. All correspondence with respect to status of manuscriptshould be sent to the Technical Assistant to the Editor In Chief at [email protected].
Journal of Agricultural Engineering and Technology (JAET), Volume 20 (No. 1) June, 2012
Nigerian Institution of Agricultural Engineers © www.niae.net iii
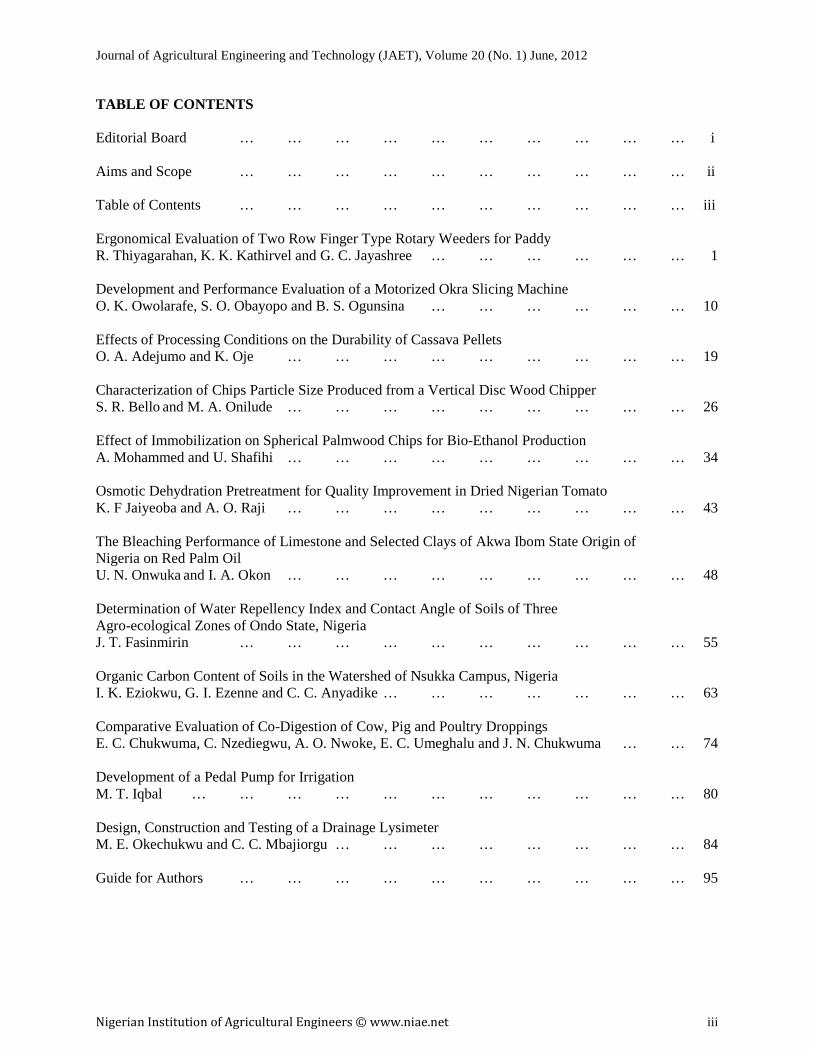
TABLE OF CONTENTS
Editorial Board … … … … … … … … … … i
Aims and Scope … … … … … … … … … … ii
Table of Contents … … … … … … … … … … iii
Ergonomical Evaluation of Two Row Finger Type Rotary Weeders for PaddyR. Thiyagarahan, K. K. Kathirvel and G. C. Jayashree … … … … … … 1
Development and Performance Evaluation of a Motorized Okra Slicing MachineO. K. Owolarafe, S. O. Obayopo and B. S. Ogunsina … … … … … … 10
Effects of Processing Conditions on the Durability of Cassava PelletsO. A. Adejumo and K. Oje … … … … … … … … … 19
Characterization of Chips Particle Size Produced from a Vertical Disc Wood ChipperS. R. Bello and M. A. Onilude … … … … … … … … … 26
Effect of Immobilization on Spherical Palmwood Chips for Bio-Ethanol ProductionA. Mohammed and U. Shafihi … … … … … … … … … 34
Osmotic Dehydration Pretreatment for Quality Improvement in Dried Nigerian TomatoK. F Jaiyeoba and A. O. Raji … … … … … … … … … 43
The Bleaching Performance of Limestone and Selected Clays of Akwa Ibom State Origin ofNigeria on Red Palm OilU. N. Onwuka and I. A. Okon … … … … … … … … … 48
Determination of Water Repellency Index and Contact Angle of Soils of ThreeAgro-ecological Zones of Ondo State, NigeriaJ. T. Fasinmirin … … … … … … … … … … 55
Organic Carbon Content of Soils in the Watershed of Nsukka Campus, NigeriaI. K. Eziokwu, G. I. Ezenne and C. C. Anyadike … … … … … … … 63
Comparative Evaluation of Co-Digestion of Cow, Pig and Poultry DroppingsE. C. Chukwuma, C. Nzediegwu, A. O. Nwoke, E. C. Umeghalu and J. N. Chukwuma … … 74
Development of a Pedal Pump for IrrigationM. T. Iqbal … … … … … … … … … … … 80
Design, Construction and Testing of a Drainage LysimeterM. E. Okechukwu and C. C. Mbajiorgu … … … … … … … … 84
Guide for Authors … … … … … … … … … … 95

Journal of Agricultural Engineering and Technology (JAET), Volume 20 (No. 1) June, 2012
Nigerian Institution of Agricultural Engineers © www.niae.net 1
ERGONOMICAL EVALUATION OF TWO ROW FINGER TYPEROTARY WEEDERS FOR PADDY
R. Thiyagarahan1, K. K. Kathirvel2 and G. C. Jayashree3
1Agricultural Engineering College and Research Institute,Tamil Nadu Agricultural University, Kumulur, India
[email protected] Engineering College and Research Institute,Tamil Nadu Agricultural University, Coimbatore, India
3Indian Institute of Crop Processing Technology, Tanjavur, [email protected]
ABSTRACT
Ergonomic evaluation of farm tools is necessary to improve the fit between the physical demands of thetools and the worker who performs the work. The maximum aerobic capacity of selected ten subjectsvaried from 1.86 to 2.26 l min- for two row finger type rotary weeder for paddy (W1). The energy cost of tworow finger type rotary weeder for paddy (W1) is 30.80kJ min-1. Based on the analysis of results, weederranked as I in terms of minimum value of heat rate, energy cost of work, AWL, LCP, ODR and BPDSwere chosen and suitable ergonomic design refinement was incorporated in the two row finger type rotaryweeder for enhanced comfort of the operator without jeopardizing the efficiency of the tool. The two rowfinger type rotary weeder (W3) with ergo refinements enhanced the comfort of the subject with 15.16,21.69, 21.68, 21.70, 36.37, 21.78 and 36.54 per cent reduction in heart rate, oxygen consumption, energyexpenditure, AWL, LCP Overall Discomfort Rating and Body Part Discomfort Score respectively. Thepercentage reduction in force requirement for pushing and pulling was found to be 30.14 and 40.18 percent respectively.
KEYWORDS: Weeding, rotary weeders, ergonomics, heart rate, oxygen consumption, paddy.
1. INTRODUCTION
Agriculture is an industry with a marginal primitive image. Gradual advances in agricultural management,production and distribution system are indications of transformation of traditional agriculture to industrialbase. Wide variations in agriculture evidently suggest that application of ergonomics would certainlydiffer with farm practices. There are generally accepted methods for assessing implications of ergonomicsin agriculture. One is tangible, i.e., pertaining to cost-benefit ratio and considered as the measure of majorimportance. Particularly in the traditional farming, there are concerns related to drudgery, slow pace ofwork, and other issues of work organization (e.g., primitive tools and methods), where ergonomics mightbring solution by contributing to the work efficiency and productivity justified factors. For example, re-designed pedal threshers, wheel hoe weeders and multi row seeders can be seen as replacement of age-oldmethods. The ergo-design refinement will compensate for the initial negation that the devices imposehigh physiological load should not be implemented. This discipline specifies application of those worksciences relating human performance to the improvement of work system in farming activity.
Weeding in developing countries is performed manually with traditional hand tools like khurpi and spade.But these tools are used in squating and bending postures. In these postures, the energy consumption fora given load is 30-50% more as compared to standing /sitting posture (Grandjean, 1988). Traditionalweeders are used in undesirable postures according to ergonomic criteria; involve repetitive movement ofbody parts which may lead to musculoskeletal disorders (Rainbird and O’Neill, 1995). Recently somewheel hand hoes have also been developed which have long handle facility to be used in ‘standing-bending’posture according to one’s stature. However, these weeders have not been evaluated ergonomically and noinformation is available on body part discomfort and fatigue experienced by the subjects operating them. Inspite of improved farm mechnization, the use of hand tools is inevitable in certain agricultural operations.

Journal of Agricultural Engineering and Technology (JAET), Volume 20 (No. 1) June, 2012
Nigerian Institution of Agricultural Engineers © www.niae.net 2
Commonly used and high energy demanding tools like two row finger type rotray weeder for paddy (W1) isselected to analyse their ergonomics.
The objective of this work was to carry out ergonomic evaluation of a two row finger type rotary forpaddy.
2. MATERIALS AND METHODS
2.1 The Rotary Weeder
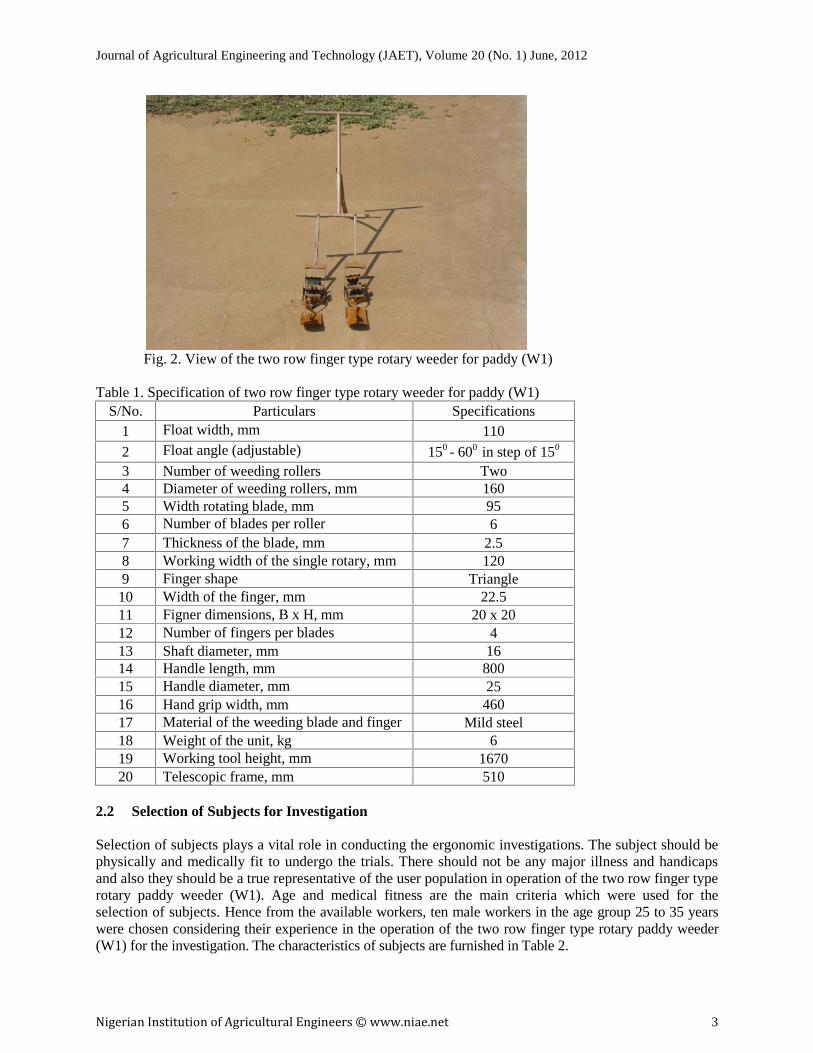
The weeder consists of weeding roller, long handle, and telescopic support frame for roller, float, rollersand blade. The roller consists of six blades attached to a shaft and the shaft in turn is fitted to a hubprovided in the roller housing. Each blade has four triangular shaped fingers weeding operation. A float isprovided in the front portion for preventing the unit from sinking into the puddled soil and for smoothoperation. Rollers and housing are fixed to a telescopic support frame and the frame is fitted to a longhandle. The weeder disturbs the topsoil and increases the aeration. The schematic view of the two row fingertype rotary weeder is shown in Fig.1 and the specification of the rotary weeder for operation in paddy field isfurnished in Table 1. The pictorial view is given in Fig. 2.
Fig. 1.Two row finger type rotary weeder (W1)
Journal of Agricultural Engineering and Technology (JAET), Volume 20 (No. 1) June, 2012
Nigerian Institution of Agricultural Engineers © www.niae.net 2
Commonly used and high energy demanding tools like two row finger type rotray weeder for paddy (W1) isselected to analyse their ergonomics.
The objective of this work was to carry out ergonomic evaluation of a two row finger type rotary forpaddy.
2. MATERIALS AND METHODS
2.1 The Rotary Weeder
The weeder consists of weeding roller, long handle, and telescopic support frame for roller, float, rollersand blade. The roller consists of six blades attached to a shaft and the shaft in turn is fitted to a hubprovided in the roller housing. Each blade has four triangular shaped fingers weeding operation. A float isprovided in the front portion for preventing the unit from sinking into the puddled soil and for smoothoperation. Rollers and housing are fixed to a telescopic support frame and the frame is fitted to a longhandle. The weeder disturbs the topsoil and increases the aeration. The schematic view of the two row fingertype rotary weeder is shown in Fig.1 and the specification of the rotary weeder for operation in paddy field isfurnished in Table 1. The pictorial view is given in Fig. 2.
Fig. 1.Two row finger type rotary weeder (W1)
Journal of Agricultural Engineering and Technology (JAET), Volume 20 (No. 1) June, 2012
Nigerian Institution of Agricultural Engineers © www.niae.net 3
Fig. 2. View of the two row finger type rotary weeder for paddy (W1)
Table 1. Specification of two row finger type rotary weeder for paddy (W1)S/No. Particulars Specifications
1 Float width, mm 110
2 Float angle (adjustable) 150 - 600 in step of 150
3 Number of weeding rollers Two4 Diameter of weeding rollers, mm 1605 Width rotating blade, mm 956 Number of blades per roller 67 Thickness of the blade, mm 2.58 Working width of the single rotary, mm 1209 Finger shape Triangle
10 Width of the finger, mm 22.511 Figner dimensions, B x H, mm 20 x 2012 Number of fingers per blades 413 Shaft diameter, mm 1614 Handle length, mm 80015 Handle diameter, mm 2516 Hand grip width, mm 46017 Material of the weeding blade and finger Mild steel18 Weight of the unit, kg 619 Working tool height, mm 167020 Telescopic frame, mm 510
2.2 Selection of Subjects for Investigation
Selection of subjects plays a vital role in conducting the ergonomic investigations. The subject should bephysically and medically fit to undergo the trials. There should not be any major illness and handicapsand also they should be a true representative of the user population in operation of the two row finger typerotary paddy weeder (W1). Age and medical fitness are the main criteria which were used for theselection of subjects. Hence from the available workers, ten male workers in the age group 25 to 35 yearswere chosen considering their experience in the operation of the two row finger type rotary paddy weeder(W1) for the investigation. The characteristics of subjects are furnished in Table 2.

Journal of Agricultural Engineering and Technology (JAET), Volume 20 (No. 1) June, 2012
Nigerian Institution of Agricultural Engineers © www.niae.net 4
2.3 Calibration of Subjects
To evaluate the physiological workload using heart rate, the relationship between heart rate (HR) andoxygen consumption rate (OCR) must be determined for each subject (Brockway, 1978 and Durnin,1978). Both variables have to be measured in the laboratory at a number of sub maximal loads. Thisprocess is called calibration of subjects. With linear relationship of the heart rate and the oxygenconsumption, the oxygen consumption (OCR) during the field trials can be predicted from the calibrationcharts (Bridger, 1995). The heart rate of the selected subjects was measured using Polar Vantage NVcomputerized heart rate monitor. The oxygen consumption rate of the selected ten subjects while runningon the treadmill was measured using computerized ambulatory metabolic measurement system Metamax-II. Ten selected subjects were asked to report every day in the morning after taking breakfast. It was alsoensured that they had a good sleep the previous night, that they were free from the influence of stimulantssuch as alcoholic drinks, cigarettes etc., and have no cardiac disease. Prior to the test, their resting heartrate, oxygen consumption rate, blood pressure were measured. Six sub maximal loads (Varying trackspeed on treadmill) were applied by means of controls in the treadmill (Astrand and Rodahl, 1977). Thistest was conducted on the treadmill and the experiment was conducted at natural environmentalcondition (28.3 + 2.1o C and 73 + 8.4 R.H) in the Human Engineering Laboratory at AgriculturalEngineering College & Research Institute, TNAU, Coimbatore. The maximum heart rate attainable by theeach subject was computed by the following relationship (Astrand, 1960 and Maritz et al., 1961).
Maximum heart rate = 190 - (Age in years – 25) x 0.62 ----- (1)
Table 2. Selected subjects for two row finger type rotary weeder for paddy (W1)
S/No. SubjectAge
(Year)Weight
(Kg)Height(cm)
Maximum heartrate, beats min-1
Maximum aerobic capacity(VO2 max), l min-1
1 I 31 63 152 186.28 2.205
2 II 30 58 153 186.90 2.180
3 III 32 69 158 185.66 2.260
4 IV 27 51 161 188.76 2.000
5 V 28 58 162 188.14 2.055
6 VI 29 54 154 187.52 2.095
7 VII 30 57 157 186.90 2.195
8 VIII 31 61 159 189.38 1.860
9 IX 28 53 156 188.14 1.950
10 X 29 65 155 187.52 2.080
2.4 Ergonomical Evaluation of the two Row Finger Type Rotary Weeder for Paddy (W1)
Ergonomical evaluation of the two row finger type rotary paddy weeder was conducted for assessing theirsuitability with the ten selected subjects. The evaluation was carried out in terms of Heart rate and oxygenconsumption rate, Energy cost of operation, Acceptable Work Load (AWL), Limit of ContinuousPerformance (LCP), Over all Discomfort Rating (ODR), Body Part Discomfort Score (BPDS) and Forcerequired for the operation of rotary weeder.
The experiment was conducted with two row finger type rotary weeder (W1) in puddled field of wetland inAgricultural Research Station at Bhavanisagar. The mean and maximum temperatures varied from 27.5 to31.50C and 33.4 to 37.5C respectively during the period of evaluation. The trials with two row rotaryweeder (W1) were performed starting from three weeks to six weeks of planting. The field selected fortrial was planted with the CO 47 and improved ponni variety of paddy. The subjects were trained well for
Journal of Agricultural Engineering and Technology (JAET), Volume 20 (No. 1) June, 2012
Nigerian Institution of Agricultural Engineers © www.niae.net 5
the operation of the weeder. The trial was conducted between 8.00 am and 5.00 pm and the subjects wereasked to report at the field at 7.30 am. Each trial started with taking five minutes data for physiologicalresponses of the subjects while resting on a stool under shade. After rest period of half an hour, subjectoperated the implement. Each trial was conducted for a period of 20 minutes. The heart rate wasmeasured with the computerized heart rate monitor. The same procedure was repeated for all the subjects.The values of heart rate, oxygen consumption and the energy expenditure for all the subjects wereaveraged to get the mean values for the two row finger type rotary weeder (W1). The percentagedistribution of heart rate during the operation of the two row finger type rotary weeder (W1) for paddywas also calculated.
The actual rest time taken for each subject two row finger type rotary weeder were found from the heartrate response curves of respective operations. The rest time was measured from cease of operation (afterattaining fatigue) till the heart rate of the subject reaches the resting level. The resting time taken wasaveraged to arrive at the mean value for the two row finger type rotary weeder.
The trials for discomfort rating for the two row finger type rotary weeder were carried out in the samefield where physiological measurements were taken. The subject was allowed to take rest for a period ofhalf an hour prior to the test. The trial time was fixed as 45 minutes of operation for two-row type rotarypaddy weeder. At the end of each trial with the two row finger type rotary weeder, the subject was askedto indicate his overall discomfort level on the 10-point rating scale. The values were tabulated. The sameprocedure was repeated for two row finger type rotary weeder with all the selected subjects. Weederoperation is associated with two types of forces: the pulling force and pushing force. The handle of theweeder was modified to accommodate the ‘Novatech’ type load cell. The load cell was connected to theindicator. The force in pulling as well as pushing was recorded. The measurement was taken for all thesubjects and the values were averaged.
2.5 Ergonomic Design Refinements
The ergo-design refinement will compensate for the initial negation that the devices impose highphysiological load should not be implemented. On the other hand, there are situations where ergo-designalternatives might be perceptible in terms of health and comfort. Based on the ergonomical evaluation ofthe two row finger type rotary weeder for paddy (W1) the subject’s feedback, ODR and BPDS andsuitable ergonomic design refinements were incorporated for enhanced comfort of the operator withoutjeopardizing the efficiency of the tool of men labour. The weeder with ergonomic design features viz,two-row rotary type paddy weeder (W2) was evaluated. A comparison of the existing model and the toolwith ergonomic design refinements was made with the ergonomical evaluation parameters to ascertain theimproved comfort of the operator.
3. RESULTS AND DISCUSSION
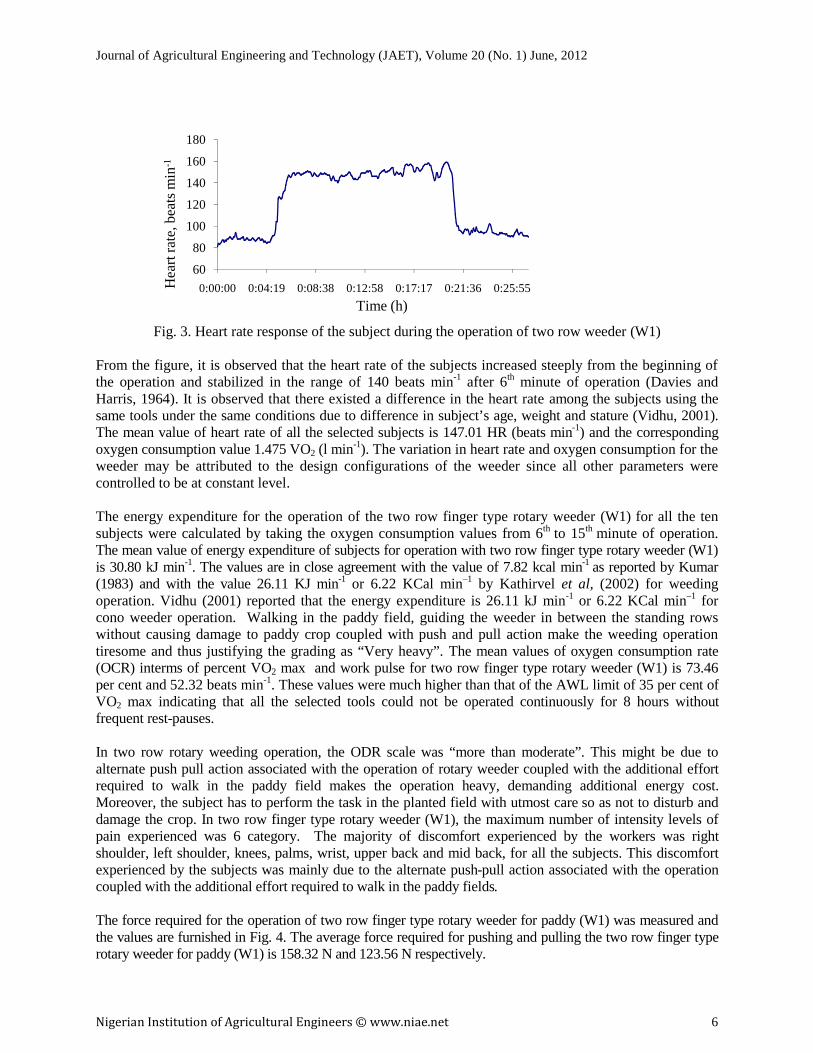
The maximum heart rate of all the selected subjects was computed using equation 1. The maximumaerobic capacity of the selected ten subjects for the weeder varied from 1.86 to 2.26 l min-1. (Nag, 1981,Vidhu 2001, Sivakumar 2002). The heart rate response of a sample subject with respect to time for theoperation of two row finger type rotary weeder is depicted in Fig. 3.
Journal of Agricultural Engineering and Technology (JAET), Volume 20 (No. 1) June, 2012
Nigerian Institution of Agricultural Engineers © www.niae.net 6
Fig. 3. Heart rate response of the subject during the operation of two row weeder (W1)
From the figure, it is observed that the heart rate of the subjects increased steeply from the beginning ofthe operation and stabilized in the range of 140 beats min-1 after 6th minute of operation (Davies andHarris, 1964). It is observed that there existed a difference in the heart rate among the subjects using thesame tools under the same conditions due to difference in subject’s age, weight and stature (Vidhu, 2001).The mean value of heart rate of all the selected subjects is 147.01 HR (beats min-1) and the correspondingoxygen consumption value 1.475 VO2 (l min-1). The variation in heart rate and oxygen consumption for theweeder may be attributed to the design configurations of the weeder since all other parameters werecontrolled to be at constant level.
The energy expenditure for the operation of the two row finger type rotary weeder (W1) for all the tensubjects were calculated by taking the oxygen consumption values from 6th to 15th minute of operation.The mean value of energy expenditure of subjects for operation with two row finger type rotary weeder (W1)is 30.80 kJ min-1. The values are in close agreement with the value of 7.82 kcal min-1 as reported by Kumar(1983) and with the value 26.11 KJ min-1 or 6.22 KCal min–1 by Kathirvel et al, (2002) for weedingoperation. Vidhu (2001) reported that the energy expenditure is 26.11 kJ min-1 or 6.22 KCal min–1 forcono weeder operation. Walking in the paddy field, guiding the weeder in between the standing rowswithout causing damage to paddy crop coupled with push and pull action make the weeding operationtiresome and thus justifying the grading as “Very heavy”. The mean values of oxygen consumption rate(OCR) interms of percent VO2 max and work pulse for two row finger type rotary weeder (W1) is 73.46per cent and 52.32 beats min-1. These values were much higher than that of the AWL limit of 35 per cent ofVO2 max indicating that all the selected tools could not be operated continuously for 8 hours withoutfrequent rest-pauses.
In two row rotary weeding operation, the ODR scale was “more than moderate”. This might be due toalternate push pull action associated with the operation of rotary weeder coupled with the additional effortrequired to walk in the paddy field makes the operation heavy, demanding additional energy cost.Moreover, the subject has to perform the task in the planted field with utmost care so as not to disturb anddamage the crop. In two row finger type rotary weeder (W1), the maximum number of intensity levels ofpain experienced was 6 category. The majority of discomfort experienced by the workers was rightshoulder, left shoulder, knees, palms, wrist, upper back and mid back, for all the subjects. This discomfortexperienced by the subjects was mainly due to the alternate push-pull action associated with the operationcoupled with the additional effort required to walk in the paddy fields.
The force required for the operation of two row finger type rotary weeder for paddy (W1) was measured andthe values are furnished in Fig. 4. The average force required for pushing and pulling the two row finger typerotary weeder for paddy (W1) is 158.32 N and 123.56 N respectively.
60
80
100
120
140
160
180
0:00:00 0:04:19 0:08:38 0:12:58 0:17:17 0:21:36 0:25:55Hea
rt ra
te, b
eats
min
-1
Time (h)

Journal of Agricultural Engineering and Technology (JAET), Volume 20 (No. 1) June, 2012
Nigerian Institution of Agricultural Engineers © www.niae.net 7
Fig. 4. Force required for the operation two row rotary weeder for paddy (W1)
To accommodate the variations in the anthropometric data of farm workers working with weeders, ahandle with height adjustability of 25 cm was provided in the finger type rotary weeders and a grip wasalso inserted in the handle to prevent from scale like formation in the palm. A cotter pin was provided onboth the weeding rollers in order to prevent the disengagement of weeding rolls at the time of weedingoperation.
The tool with ergonomic design features two row finger rotary type paddy weeder (Fig 5) was evaluated.A comparison of the existing model (W1) and the tools with ergonomic design refinements (W2) wasmade with the following measured parameters to ascertain the improved comfort of the operator.
Fig. 5. Existing model and ergo-refined model
The heart rate values for operation with improved two row rotary weeder (W2) was at 124.72 beats min-1
0
50
100
150
200
I II III IV
Forc
e (N
)
Journal of Agricultural Engineering and Technology (JAET), Volume 20 (No. 1) June, 2012
Nigerian Institution of Agricultural Engineers © www.niae.net 7
Fig. 4. Force required for the operation two row rotary weeder for paddy (W1)
To accommodate the variations in the anthropometric data of farm workers working with weeders, ahandle with height adjustability of 25 cm was provided in the finger type rotary weeders and a grip wasalso inserted in the handle to prevent from scale like formation in the palm. A cotter pin was provided onboth the weeding rollers in order to prevent the disengagement of weeding rolls at the time of weedingoperation.
The tool with ergonomic design features two row finger rotary type paddy weeder (Fig 5) was evaluated.A comparison of the existing model (W1) and the tools with ergonomic design refinements (W2) wasmade with the following measured parameters to ascertain the improved comfort of the operator.
Fig. 5. Existing model and ergo-refined model
The heart rate values for operation with improved two row rotary weeder (W2) was at 124.72 beats min-1
IV V VI VII VIII IX XSubjects
Pushing
Pulling
Journal of Agricultural Engineering and Technology (JAET), Volume 20 (No. 1) June, 2012
Nigerian Institution of Agricultural Engineers © www.niae.net 7
Fig. 4. Force required for the operation two row rotary weeder for paddy (W1)
To accommodate the variations in the anthropometric data of farm workers working with weeders, ahandle with height adjustability of 25 cm was provided in the finger type rotary weeders and a grip wasalso inserted in the handle to prevent from scale like formation in the palm. A cotter pin was provided onboth the weeding rollers in order to prevent the disengagement of weeding rolls at the time of weedingoperation.
The tool with ergonomic design features two row finger rotary type paddy weeder (Fig 5) was evaluated.A comparison of the existing model (W1) and the tools with ergonomic design refinements (W2) wasmade with the following measured parameters to ascertain the improved comfort of the operator.
Fig. 5. Existing model and ergo-refined model
The heart rate values for operation with improved two row rotary weeder (W2) was at 124.72 beats min-1

Journal of Agricultural Engineering and Technology (JAET), Volume 20 (No. 1) June, 2012
Nigerian Institution of Agricultural Engineers © www.niae.net 8
and the corresponding oxygen consumption value were 1.155 l min-1. The energy expenditure value wasdetermined as 24.12 kJ min-1. The operation was also graded as “heavy". The energy cost of operation interms of VO2 max and work pulse of the subjects for improved two row finger type weeder (W3) is 57.52per cent and 31.02 beats min-1 respectively. The discomfort rating for the operation of weeding withimproved two-row rotary weeder (W3) by the subjects varied from 5.2 to 6.1 and the mean value was 5.6,which was scaled as “more than moderate discomfort”. The force required for the operation of improvedtwo-row rotary weeders for paddy is illustrated in Fig. 6.
Fig. 6 Force required for improved two row finger type rotary weeder (W2) for paddy
The force required for pushing and pulling the improved two row finger type rotary weeder withergonomic design improvements varied from 85.64 to 134.29N and 65.92 to 93.88N. It is clearly seen thatthere was a considerable reduction in all the parameters for the rotary weeder. This reduction of all theparameters for improved weeder compared to existing weeder is due to the fact that the existing weederwas modified according to the suitability of the workers for increased comfort and ease of operation.
4. CONCLUSION
For weeding operation in paddy field with two row finger type rotary weeder W1, the mean value of heartrate is 147.01 beats min-1 and the corresponding oxygen consumption value is 1.475 l min-1. From themean value of oxygen consumption, the energy expenditure for two row finger type rotary weeder W1was computed as 30.80 kJ min-1. The operation of finger type rotary weeder was graded as "very heavy".The oxygen consumption rate in terms of VO2 max for two row finger type (W1) rotary weeder for paddyis 73.46 per cent. The overall discomfort rate for two row finger type rotary weeder (W1) is 7.16.Themajority of discomfort experienced by the workers in the operation two row finger type rotary weeder(W1) was in right shoulder, left shoulder, knees, palms and midback during the operation of rotaryweeder. It may be due to the alternate push-pull action associated with the operation coupled with theadditional effort required to walk in the paddy fields. The push and pull force for finger type rotary weederwere 158.32 N and 123.56 N. The two row finger type rotary weeder (W2) with improved ergonomicdesign features enhanced the comfort of the subject with 15.16, 21.69, 21.68, 21.70, 36.37, 21.78 and36.54 per cent reduction in heart rate, oxygen consumption, energy expenditure, AWL, LCP OverallDiscomfort Rating and Body Part Discomfort Score respectively when compared to the available model.The percentage reduction in force requirement for pushing and pulling was found to be 30.14 and 40.18 percent respectively.
0
50
100
150
I II III IV
For
ce (N
)
Journal of Agricultural Engineering and Technology (JAET), Volume 20 (No. 1) June, 2012
Nigerian Institution of Agricultural Engineers © www.niae.net 8
and the corresponding oxygen consumption value were 1.155 l min-1. The energy expenditure value wasdetermined as 24.12 kJ min-1. The operation was also graded as “heavy". The energy cost of operation interms of VO2 max and work pulse of the subjects for improved two row finger type weeder (W3) is 57.52per cent and 31.02 beats min-1 respectively. The discomfort rating for the operation of weeding withimproved two-row rotary weeder (W3) by the subjects varied from 5.2 to 6.1 and the mean value was 5.6,which was scaled as “more than moderate discomfort”. The force required for the operation of improvedtwo-row rotary weeders for paddy is illustrated in Fig. 6.
Fig. 6 Force required for improved two row finger type rotary weeder (W2) for paddy
The force required for pushing and pulling the improved two row finger type rotary weeder withergonomic design improvements varied from 85.64 to 134.29N and 65.92 to 93.88N. It is clearly seen thatthere was a considerable reduction in all the parameters for the rotary weeder. This reduction of all theparameters for improved weeder compared to existing weeder is due to the fact that the existing weederwas modified according to the suitability of the workers for increased comfort and ease of operation.
4. CONCLUSION
For weeding operation in paddy field with two row finger type rotary weeder W1, the mean value of heartrate is 147.01 beats min-1 and the corresponding oxygen consumption value is 1.475 l min-1. From themean value of oxygen consumption, the energy expenditure for two row finger type rotary weeder W1was computed as 30.80 kJ min-1. The operation of finger type rotary weeder was graded as "very heavy".The oxygen consumption rate in terms of VO2 max for two row finger type (W1) rotary weeder for paddyis 73.46 per cent. The overall discomfort rate for two row finger type rotary weeder (W1) is 7.16.Themajority of discomfort experienced by the workers in the operation two row finger type rotary weeder(W1) was in right shoulder, left shoulder, knees, palms and midback during the operation of rotaryweeder. It may be due to the alternate push-pull action associated with the operation coupled with theadditional effort required to walk in the paddy fields. The push and pull force for finger type rotary weederwere 158.32 N and 123.56 N. The two row finger type rotary weeder (W2) with improved ergonomicdesign features enhanced the comfort of the subject with 15.16, 21.69, 21.68, 21.70, 36.37, 21.78 and36.54 per cent reduction in heart rate, oxygen consumption, energy expenditure, AWL, LCP OverallDiscomfort Rating and Body Part Discomfort Score respectively when compared to the available model.The percentage reduction in force requirement for pushing and pulling was found to be 30.14 and 40.18 percent respectively.
IV V VI VII VIII IX XSubjects
Pushing
Pulling
Journal of Agricultural Engineering and Technology (JAET), Volume 20 (No. 1) June, 2012
Nigerian Institution of Agricultural Engineers © www.niae.net 8
and the corresponding oxygen consumption value were 1.155 l min-1. The energy expenditure value wasdetermined as 24.12 kJ min-1. The operation was also graded as “heavy". The energy cost of operation interms of VO2 max and work pulse of the subjects for improved two row finger type weeder (W3) is 57.52per cent and 31.02 beats min-1 respectively. The discomfort rating for the operation of weeding withimproved two-row rotary weeder (W3) by the subjects varied from 5.2 to 6.1 and the mean value was 5.6,which was scaled as “more than moderate discomfort”. The force required for the operation of improvedtwo-row rotary weeders for paddy is illustrated in Fig. 6.
Fig. 6 Force required for improved two row finger type rotary weeder (W2) for paddy
The force required for pushing and pulling the improved two row finger type rotary weeder withergonomic design improvements varied from 85.64 to 134.29N and 65.92 to 93.88N. It is clearly seen thatthere was a considerable reduction in all the parameters for the rotary weeder. This reduction of all theparameters for improved weeder compared to existing weeder is due to the fact that the existing weederwas modified according to the suitability of the workers for increased comfort and ease of operation.
4. CONCLUSION
For weeding operation in paddy field with two row finger type rotary weeder W1, the mean value of heartrate is 147.01 beats min-1 and the corresponding oxygen consumption value is 1.475 l min-1. From themean value of oxygen consumption, the energy expenditure for two row finger type rotary weeder W1was computed as 30.80 kJ min-1. The operation of finger type rotary weeder was graded as "very heavy".The oxygen consumption rate in terms of VO2 max for two row finger type (W1) rotary weeder for paddyis 73.46 per cent. The overall discomfort rate for two row finger type rotary weeder (W1) is 7.16.Themajority of discomfort experienced by the workers in the operation two row finger type rotary weeder(W1) was in right shoulder, left shoulder, knees, palms and midback during the operation of rotaryweeder. It may be due to the alternate push-pull action associated with the operation coupled with theadditional effort required to walk in the paddy fields. The push and pull force for finger type rotary weederwere 158.32 N and 123.56 N. The two row finger type rotary weeder (W2) with improved ergonomicdesign features enhanced the comfort of the subject with 15.16, 21.69, 21.68, 21.70, 36.37, 21.78 and36.54 per cent reduction in heart rate, oxygen consumption, energy expenditure, AWL, LCP OverallDiscomfort Rating and Body Part Discomfort Score respectively when compared to the available model.The percentage reduction in force requirement for pushing and pulling was found to be 30.14 and 40.18 percent respectively.

Journal of Agricultural Engineering and Technology (JAET), Volume 20 (No. 1) June, 2012
Nigerian Institution of Agricultural Engineers © www.niae.net 9
REFERENCES
Astrand, I. 1960. Aerobic work capacity in men and women. Acta Physiologica Scandinavica. Vol.4,Supplement 169.
Astrand, P.O. and K. Rodahl. 1977. A Textbook of work physiology. New York, Mc. Graw Hill.Bridger, R. S. 1995. Introduction to Ergonomics. McGraw-Hill, Inc, New York: 205-210.Brockway, J.W. 1978. Escape from the chamber, alternate method for large animal calorimetry. Proc.
Nut. Soc., 31(1): 13-18.Davis, C.T.M. and Harris, E.A. 1964. Heart rate during transition from rest to exercise in relation to
exercise tolerance. Journal of applied Physiology. 19(5): 857-862.Durnin, J.C.G.A. 1978. Indirect calorimetry in Man. A critique on practical problems. Proc. Nut. Soc.,
37(1): 5-11.Grandjean, E. 1988. Fitting the task to the man, A text book of Occupational Ergonomics, Taylor &
Francis.Kathirvel, K., vidhu, K P., Manian, R and Senthilkumar, T. 2002. Ergonomic evaluation of direct paddy
seeder. A paper presented at 37th ISAE convention held at Udaipur.Kumar, V. J. F. 1983. Energetic of manual weeding. Unpublished M.E. (Ag) thesis. Dept. of farm
Machinery, Tamil Nadu Agricultural University, Coimbatore.Martiz, Morrison, J.F., Peters, J.N., Strydon, B and Wyndham, C.H.1961. A practical method of estimating
an individual maximum oxygen uptake. Ergonomics, 4(2).Nag, P.K. 1981. Predicting maximal oxygen uptake of workers engaged in agricultural tasks. Human
Ergology, 10: 25-33.Rainbird G; O’Neil D. 1995. Occupational disorders affecting agricultural workers in tropical developing
countries. Applied Ergonomics, 26: 187-193.Sivakumar, S.S. 2002. Investigation on the performance evaluation of drum seeder as influenced by
machine, ergonomic and crop parameters. PhD Thesis. Department of Farm Machinery, Tamil NaduAgricultural University, Coimbatore, India.
Vidhu, K.P.2001. An investigation on ergonomic evaluation of selected rice farming equipment.Unpublished M.E. (Ag.) Thesis, Department of Farm Machinery, Tamil Nadu AgriculturalUniversity, Coimbatore, India.

Journal of Agricultural Engineering and Technology (JAET), Volume 20 (No. 1) June, 2012
Nigerian Institution of Agricultural Engineers © www.niae.net 10
DEVELOPMENT AND PERFORMANCE EVALUATION OFA MOTORIZED OKRA SLICING MACHINE
O.K. Owolarafe1, S.O. Obayopo2 and B.S.Ogunsina1
1Department of Agricultural and Environmental Engineering,Obafemi Awolowo University, Ile Ife, Nigeria
2Department of Mechanical Engineering, Obafemi Awolowo University, Ile Ife, NigeriaEmail: [email protected]
ABSTRACT
A simple motorized device was designed and constructed for okra slicing using locally availablematerials. The slicing mechanism was based on the high shear stress that is generated when a knife edgeis brought into contact with a non-fibrous bio-material causing the knife to move in a direction parallel toits edge and perpendicular to the direction of the applied force. The device was evaluated based on slicingefficiency and throughput time of the okra fruits. The machine was tested with replicated experimentalruns using 400g, 500g, 1000g and 1150g of Okra. The machine gave the best slicing efficiency of 85.7%and throughput of 21 kg/hr.
KEYWORDS: Okra, motorised slicer, through put, slicing efficiency.
1. INTRODUCTION
In many West African markets and some other regions of the world, okra or lady’s finger (Abelmoschusesculentus L.) is one of the most popular vegetables. It is a widely cultivated vegetable crop in most partsof the world. It’s most valuable part is the tender, non-fibrous, immature pod which is usually eaten as afried or cooked fruit-vegetable. Okra pod is rich in minerals, vitamins, carbohydrate, protein and containssizable amounts of essential amino acids (Adeboye and Oputa, 1996; Okra food, 2003). Informationregarding the physical properties of okro have been properly documented in previous studies (Owolarafeand Shotonde, 2004). The mucilage that okra contains is known to be good for detoxifying intestinal tractand softening the bowel in human nutrition; and industrially, it is a valuable material for gum and paperglacing (Makose and Peter, 1990).
About 10% of the world’s annual okra production comes from West Africa with Nigeria as the leadingproducer (Burkil, 1997). In South-Western Nigeria, the three known cultivars of okra are yaaya orkògbóyè, which has long slender pods; kúdìkán or ilá-òjò, which has short, sturdy pods and ilá-ìròkòwhich has long sturdy pods though less preferred for food by consumers because of its characteristicobjectionable taste (Farinde et al., 2007). In most producing countries, vegetable farmers in rural areasearn their living from okra sales; however, it is very perishable like many other vegetables. The pods areusually picked at a very early stage when still tender or when close to their maximum size but not yetfibrous usually about 6-7 days after flowering (Schippers, 2000). The traditional method of preservingfresh okra pods which involves spreading it in the air for few hours during cold weather only makes itpreserve for just 3-4 days (Schippers, 2000). When fresh okra cannot be sold for more than 2 days, ittends to become tough and unsuitable for use as a fresh vegetable. Traditionally, the unsold lot areprocessed by slicing and sun-drying to preserve it for later use. This processing method, apart fromforestalling seasonal wastage extends its availability from one season to the other. At the village level,dried okra slices are usually stored in gourds, baskets and clay-pots. Usually the product is usuallypowdered just before use especially during the dry season when most leafy vegetables are very seldomfound. Powdered okra is usually cooked with fish and meat or pomo into a slimy draw-soup that is widelyeaten with swallow foods like eba, foofo or pounded yam in Nigeria.
The major unit operations that have been associated with mechanized okra processing are slicing, drying,grinding and packaging (Owolarafe et al., 2007). Slicing is essentially carried out to increase the surface
Journal of Agricultural Engineering and Technology (JAET), Volume 20 (No. 1) June, 2012
Nigerian Institution of Agricultural Engineers © www.niae.net 11
area in order to increase drying rate and it is the most laborious and time consuming. Slicing is basically acutting process in which a sharp knife is brought into close contact with the tender pod and forcing it toshear through the pod, thereby reducing it into small irregular discs. For most non-fibrous bio-materials,the compressive stress applied by a cutting tool increases pressure in the cell wall at the point of contact.This generates high shear stress at the point of indentation and causes the cutting tool to move in adirection parallel to its edge and perpendicular to the direction of the applied force. A manually operateddevice developed by Owolarafe et al. (2007) based on this mechanism has been adopted as a unit of anintegrated system for okra processing by rural women in South-Western Nigeria because it reduced thedrudgery associated with manual slicing appreciably.
In this report, another step forward has been taken to motorize the okra slicing device with the ultimateaim of curbing the overall seasonal losses associated with okra thereby increasing obtainable income ofokra farmers.
2. MACHINE DESIGN AND PERFORMANCE TESTS
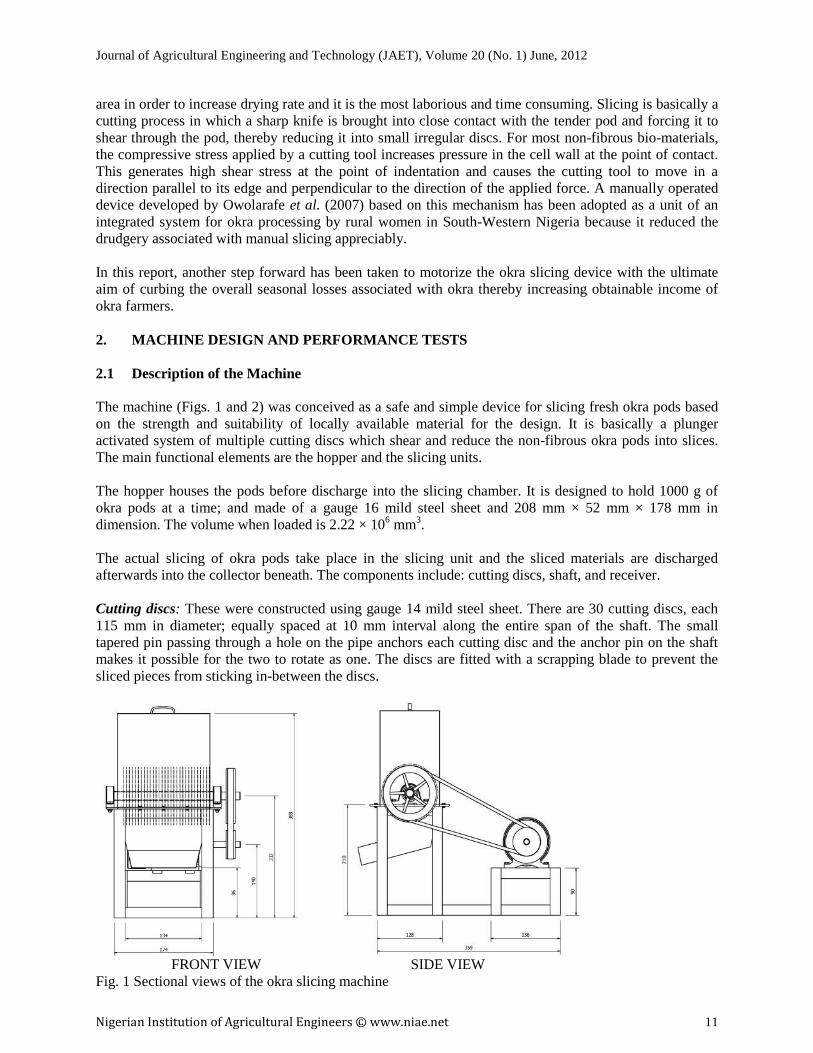
2.1 Description of the Machine
The machine (Figs. 1 and 2) was conceived as a safe and simple device for slicing fresh okra pods basedon the strength and suitability of locally available material for the design. It is basically a plungeractivated system of multiple cutting discs which shear and reduce the non-fibrous okra pods into slices.The main functional elements are the hopper and the slicing units.
The hopper houses the pods before discharge into the slicing chamber. It is designed to hold 1000 g ofokra pods at a time; and made of a gauge 16 mild steel sheet and 208 mm × 52 mm × 178 mm indimension. The volume when loaded is 2.22 × 106 mm3.
The actual slicing of okra pods take place in the slicing unit and the sliced materials are dischargedafterwards into the collector beneath. The components include: cutting discs, shaft, and receiver.
Cutting discs: These were constructed using gauge 14 mild steel sheet. There are 30 cutting discs, each115 mm in diameter; equally spaced at 10 mm interval along the entire span of the shaft. The smalltapered pin passing through a hole on the pipe anchors each cutting disc and the anchor pin on the shaftmakes it possible for the two to rotate as one. The discs are fitted with a scrapping blade to prevent thesliced pieces from sticking in-between the discs.
FRONT VIEW SIDE VIEWFig. 1 Sectional views of the okra slicing machine

Journal of Agricultural Engineering and Technology (JAET), Volume 20 (No. 1) June, 2012
Nigerian Institution of Agricultural Engineers © www.niae.net 12
TOP VIEW ISOMETRIC PROJECTION
Fig. 2: Orthographic and Isometric Projections of the Experimental Machine
Shaft: The shaft upon which the cutting dics are mounted is 16.7 mm in diameter. The shaft/cutting discsassembly is born by two support bearings. One of its ends is pinned to the pulley and the shaft driven byan electric motor.
Reciever: This consists of a 210 mm × 162 mm × 87 mm container which has a handle. The frame,dimension 256 mm × 162 mm × 210 mm simply acts as support for other parts of the machine. It wasmade of 18 mm × 18 mm square mild steel pipe.
An exploded view of the machine is show in Fig. 3 and the prototype in Fig. 4.
2.2 Shaft Design
The design parameters for the shaft material are:Allowable shear stress, Ss = 4.0 X 10 6 N/m2 (for shaft with a key way)Length of shaft, Ls = 0.29 mDensity of mild steel, ρs = 7622 kg /m3
For a rotating shaft with gradually applied load, the bending fatigue factor, kb = 1.5and the tensional fatigue factor kt = 1.0 (Hall et al., 1993).The load on the shaft will be due to:(a) Mass of the plunger, which can be determined by calculating the overall volume of the plunger:Volume = Area × ThicknessArea of plunger = (180 × 210) + (160 × 210) (160 × 55 × 2) + (55 × 210 × 2) = 112 100 mm2
Therefore, volume = 112 100 × 2 = 224200 mm = 2. 24 × 10 – 4 m 3

Journal of Agricultural Engineering and Technology (JAET), Volume 20 (No. 1) June, 2012
Nigerian Institution of Agricultural Engineers © www.niae.net 13
Fig. 3: An Exploded View of the Machine
Fig. 4: A pictorial View of the Protype
Mass = Density x Volume = 7622 × 2.242 × 10 -4 = 1.71 kgWeight of plunger = 1.71 × 9. 81 = 16.76 N(b) Mass of okra pods = 1000g =1 kgWeight = 1.0 kg × 9.81 m/s2 = 9. 81 N(c) Mass of the cutting discs

Journal of Agricultural Engineering and Technology (JAET), Volume 20 (No. 1) June, 2012
Nigerian Institution of Agricultural Engineers © www.niae.net 14
Number of cutting discs, n = 30For one cutting disc, thickness (t) = 2 mm = 0.002 m and diameter (d) = 115 mm = 0.115 m
Surface area of a disc,4
2dAd
Ad = 1.04 × 10 -2 m2
Volume of a disc = 1.038 × 10 -2 m2 × 0.002 mVd = 2.08 × 10⁻⁵ m3
The volume of 30 discs = 30 × 2.079 × 10-5 = 6. 237 × 10-4m3 = 623 700 mm3
Mass of 30 discs = Density × Volume = 7622 × 6.237 × 10-4 = 4. 75 kgWeight of 30 discs = 4.75 × 9.81 = 46.60 N
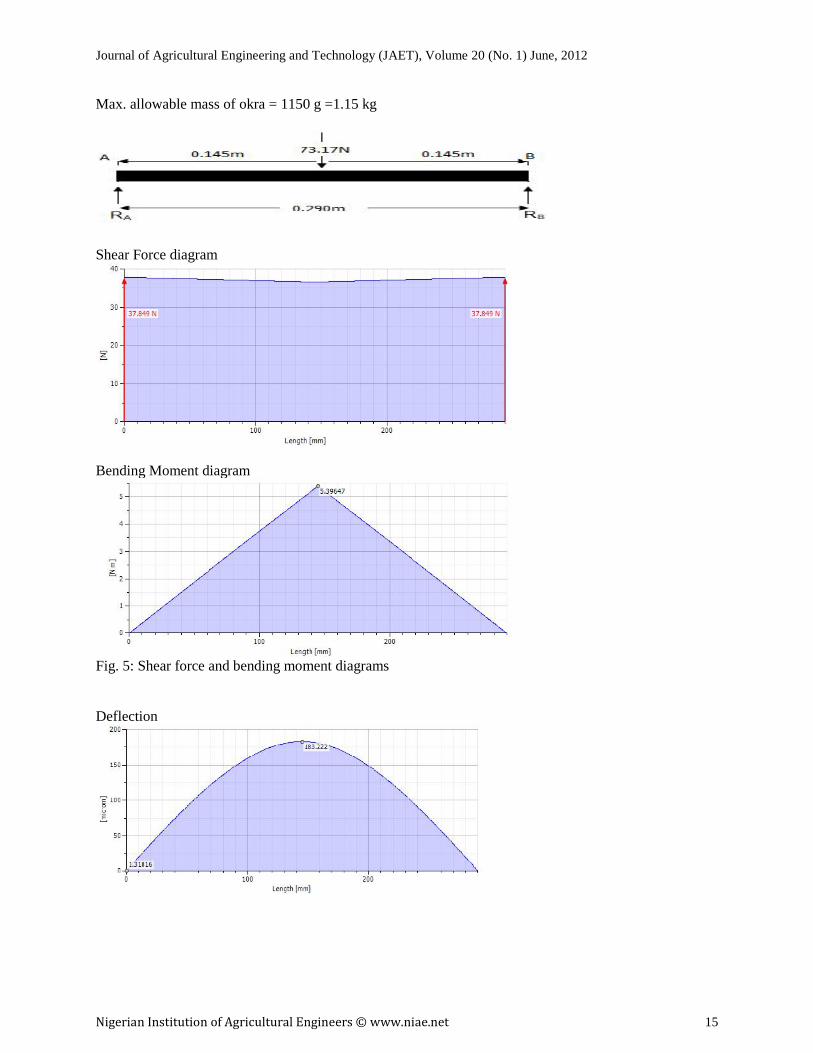
Therefore, the equivalent load on shaft Wt is given by the sum of the weights of 30 discs, the plunger andthe okra pods i.e = 46.60 + 16.76 + 9.81 = 73. 17 N
2.3 Analysis of Loads Acting on the Shaft
As shown in Fig. 5, the sum of upward forces = sum of downward forcesi.e. RA + RB = Wt, where RA and RB represent the reactions at points A and B respectively.
Taking moment about point B0.290 RA = 73. 17 X 0.145
RA = 585.3629.0
61.10 N
RB = Wt - RA = 73.17 – 36.585 = 36.585 N
At point A, the shearing force SFA =36.585 N; and at point B, SFB = 36.585 NFor moments,
0 AM 0 BM
Maximum bending moment, Mb = 0.145 × 36.585 = 5.305 Nm
Torsional moment, Mt =)(
)(9550
rpmn
kWP Nm (Hall et al; 1983)
For the electric motor Power, P = 1.5 kWand the expected/number of revolution per mins is 400 rpm
Therefore, Mt =400
5.19550 = 35.8 Nm
According to Hall et al (1983), the required shaft diameter can be obtained by the formula
)()(163
ttbbs
MKMKS
d
= 226
)5.1305.5()0.181.35()1040(
16
= 1.273 × 10-7 × 36.68
d = 0.01671 m = 16. 71 mm
The shear force and bending moment diagrams are shown in Fig. 5a whereas the deflection, bendingstress and shear stress diagrams are shown in Fig. 6.
2.4 Hopper Cage Design
Bulk density of okra pod = 450. 42kg / m3
Journal of Agricultural Engineering and Technology (JAET), Volume 20 (No. 1) June, 2012
Nigerian Institution of Agricultural Engineers © www.niae.net 15
Max. allowable mass of okra = 1150 g =1.15 kg
Shear Force diagram
Bending Moment diagram
Fig. 5: Shear force and bending moment diagrams
Deflection

Journal of Agricultural Engineering and Technology (JAET), Volume 20 (No. 1) June, 2012
Nigerian Institution of Agricultural Engineers © www.niae.net 16
Bending Stress
Shear Stress
Fig. 6: Deflection shear stress and bending stress diagrams
The required volume of hopper = maximum volume of okra that can be loaded at a time.
= kgmkg 3/42.450
15.11
= 0.0025532 m3 = 2.55 × 10⁻³ m3 or 2. 55 × 10-9 mm3
2.5 Machine Testing and Evaluation
The hopper was loaded with okra pods and the motor was switched on, turning the shaft and hence thecutting discs in the clockwise direction to effect slicing. Since a variable speed electric motor was used, at200 rpm and 300 rpm, the performance of the machine was low; whereas at 400 rpm, the performance ofthe device was high. The plunger secures and presses the okra pods against the cutting discs to generate aforce high enough to shear through it to effect slicing..
The machine was tested with 400 g, 500 g, 1000 g and 1150 g mass of okra pods and its performance wasevaluated on the basis of the slicing efficiency and the through-put time. Each run was replicated thrice.The through-put of the machine was obtained as a ratio of the weight of okra pods to the time it takes toslice the pods completely. The slicing () is given by the efficiency expression below.
3. RESULTS AND DISCUSSION
The average slicing efficiency ( ) was 85.7 % (Table 1) and the thorough-put was calculated as 21.05kg/h.

Journal of Agricultural Engineering and Technology (JAET), Volume 20 (No. 1) June, 2012
Nigerian Institution of Agricultural Engineers © www.niae.net 17
Motorization of the device and the ability to turn the shaft at a relatively higher speed of 400 rpm is amarked improvement over the previous manually operated type which operated at 60 rpm (Owolarafe etal., 2007).
Table 1. Test results of machine efficiencyWeight of okra loaded into
hopper, (g)Mass of sliced okra pods
(g)Efficiency
(%)400 340 85500 420 841000 910 911150 950 82.6
Average efficiency 85.7
The need for an appreciable force to keep the okra pods pressed against the slicing blades is realizablethrough motorization. More importantly, the drudgery associated with manually operated type gotmarkedly reduced, the rate of slicing increased and consequently higher thoroughput achievable. Theaverage slicing efficiency and thorough-put of the motorized device was better than 77.4 % and 8.4 kg/hobtained for the manually operated version. Fig. 7 shows the sliced and unsliced portion of okra podsobtained during machine testing. Some of the okra pods were sliced along the okra pod length and gotmechanically damaged. This may be due to the fact that different sizes of okra were fed into the machine.However, this has no negative implication in the process since the overall idea of slicing in okroprocessing is to reduce the size and increase its surface area to hasten drying and later crushing into grittypowder.
Fig. 7: Okra pods showing the quality of slices during performance tests
4. CONCLUSION
A motorised okra slicing device has been developed using locally available materials as an improvementon an existing manually operated prototype. The machine which simulates traditional okra slicing,consists of a feeding, slicing and collecting units. The machine has the capacity to slice about 1.15 kg ofokra pods in a batch. The slicing efficiency and throughput were approximately 86.7% and 21 kg/hrrespectively. The device is a step further in okro processing in Nigeria and other places in sub-SaharaAfrican region where preservation of okro in sliced and dried form is important.
REFERENCES
Adeboye, O.C. and Oputa, C.O. 1996. Effect of Galex on Growth and Fruit Nutrient Composition ofOkra. Ife J. Agric. 18 (1/2): 1-9.
Burkil, H.M. 1997. The Useful Plants of West Tropical Africa. 2nd Edition. Vol 4, Families M-R, RoyalBotanical Gardens, Kew, UK. 969 pp.
Farinde, A.J. Owolarafe O.K. and Ogungbemi. O.I. 2007. An Overview of Production, Processing,Marketing and Utilization of Okra in Egbedore Local Government Area of Osun State, Nigeria.

Journal of Agricultural Engineering and Technology (JAET), Volume 20 (No. 1) June, 2012
Nigerian Institution of Agricultural Engineers © www.niae.net 18
Agricultural Engineering International: The CIGR Ejournal. Manuscript No. MES 07 002. Vol. IX.July, 2007.
Hall, A., Hollowenko, S.A.R., and Laughin, A.G. 1983. Theory and Problems of Machine Design.Schuam’s Outline Series, McGraw Hill Book Co, New York.
Makose, B.L. and Peter, K.V. 1990. Okra. Review of Research on Vegetable and Tuber Crops. TechnicalBulletin 16. Kerala Agricultural University Press Mannuthy, Kerala, pp 109.
Okra Food. 2003. www.foodreference.com Accessed on April 10, 2003.Owolarafe, O.K. and Shotonde, H.O. 2004. Some Physical Properties of Fresh Okra Fruit. J. Food Eng. 3:
299-304.Owolarafe, O.K, Muritala O.A and Ogunsina, B.S. 2007. Development of an okra slicing device. J. Food
Sci. Techn. 44(4): 426-429.Schippers, R.R. 2000. African Indigenous Vegetables. An Overview of the Cultivated Species. Chatham,
UK: Natural Resources Institute/ACP-EU Technical Centre for Agricultural and Rural Cooperation.Pp 103-116

Journal of Agricultural Engineering and Technology (JAET), Volume 20 (No. 1) June, 2012
Nigerian Institution of Agricultural Engineers © www.niae.net 19
EFFECTS OF PROCESSING CONDITIONS ON THE DURABILITY OF CASSAVA PELLETS
O. A. Adejumo1 and K. Oje2
1National Centre for Agricultural Mechanization, Ilorin, Kwara State, Nigeria.2Department of Agricultural Engineering and Biosystem, University of Ilorin, Kwara State, Nigeria.
E-mail: [email protected]
ABSTRACT
In this study, an experimental rig attached to a Testometrics Universal Testing Machine for the purpose ofextrusion was used to investigate the effects of processing conditions on Durability property of cassavapellets. The parameters considered were machine speeds of 1.5mm/min, 2.5mm/min, 3.5mm/min,4.5mm/min, die diameters of 6mm, 8mm, 10mm, 12mm and cassava dough of moisture content levels48.5%w.b, 50.5%w.b, 52.5%w.b and 54.5%w.b.
Result of the Statistical Analysis of Variance showed that all the parameters and their interactions weresignificant on durability property of cassava pellets at 5% level. Further analysis by Duncan’s MultipleRange Test reveals that durability increased with increase in the levels of the process condition. Qualitypellets can be obtained when cassava dough is conditioned into moisture contents level of above45.5%w.b and moisture content level below 54.5%w.b.
KEYWORDS: Durability, pellets, cassava, processing, durability, moisture content.
1. INTRODUCTION
Cassava is a high energy yielding and continuous crop in Nigeria (Okeke, 1980). Its use as an alternativeto conventional energy feedstuffs like maize could help reduce cost of feed and alleviate the problem ofdirect competition between livestock and humans for maize. Out of the over 10 million of cassavaproduced yearly in Nigeria, 90%is used as human consumption while the remainder is used largely asanimal feed and for other industrial product locally.
Improvement in cassava variety in Nigeria has led to phenomenal growth in production thus makingNigeria the number two producer in the world after Brazil, thus creating alternative use of cassava andmarket outlet .In Nigeria, a poultry feed trial has shown that if cassava root and leaves were combine in aratio of four to one , the mixture could replace maize in poultry feed and reduce feed cost without a lossin weight gain or egg production . Cassava pellets are estimated to account for more than 85% of allcassava products used in the manufacturing of animal feedstuff in Europe. Pelleting simplifies transportand handling operations as pellet are uniform in shapes and size and are less fragile than other forms:-italso reduces storage space required by about 25%.
Durability, which is the ability of the pellet to withstand destructive loads and forces during transport, isthe most important descriptor of the physical quality of pellets. (Tabil and Sokhansanj,1997). Singh andSingh (1982) reported that pellets made by using molasses as binder has the highest combustionefficiency of 70.1% followed by that of mixture of sodium silicate and molasses, 45.3% and then by thatof sodium silicate, 34.8%. But the maximum bulk density and durability of pellet was observed whensodium silicate was used as the binder at 30N/mm2. This is because sodium silicate has a good bindingcharacteristic but poor combustion property as compared to others. Also the quality of binder is anotherfactor, the bulk density and durability increases with increase in quantity of binder.
Tabil et al. (1996) did a study for improving the physical quality of alfalfa pellets by controlling andoptimizing the manufacturing process. The process conditions investigated were stream conditioningtemperatures, die geometry (length to diameter or c/d ratio), hammer mill screen sizes used in grindingdry chops, and die speed. They reported that higher conditioning temperature of 95ºC resulted in

Journal of Agricultural Engineering and Technology (JAET), Volume 20 (No. 1) June, 2012
Nigerian Institution of Agricultural Engineers © www.niae.net 20
improved durability of processed pellets. The durability of samples was generally better using the smallerdie (higher l/d ratio). The hammer mill screen size did not show any effect on pellet durability. Finally,they reported that high durable pellets are obtained at low die speed (250rpm).
The main objective of this research work is to investigate the effect of some machine parameters andmoisture content of preparation of Cassava dough on the durability property of Cassava pellets. Thespecific objective is to determine the effect of the speed of the pelleting machine, die diameter of theextrusion rig, and moisture content during preparation of the cassava dough on the durability of Cassavapellet.
2. MATERIALS AND METHODS
2.1 The Testing Facility
The materials used for this experiment are classified into two groups namely: the Cassava powder and theMechanical extrusion rig.
The Cassava tubers used in the processing of Cassava powder were bought from Idofian market inIfelodun Local Government area of Kwara State. The tubers were processed by peeling using localknives. They were then washed to remove the dirt and chipped with the aid of the Cassava chippingmachine available at National Centre for Agric. Mechanization Central Workshop Ilorin (NCAM). Thechips were dried using the NCAM batch drier and milled into powder using the NCAM dry-millingmachine. The mechanical extrusion process involves the application of a compressive force on theCassava material enclosed in a cylinder with replaceable die. This extrusion RIG was mounted on theTestometrics Universal Testing Machine (Model M500 50KN) as shown in Figure 1.
The mechanical extrusion rig is an existing rig attached to the Universal Testing Machine in theEngineering Material Testing Laboratory. The experiment was run with four levels of machinespeed(1.5mm/min, 2.5mm/min, 3.5mm/min, and 4.5mm/min),four levels die diameters(6mm,8mm,10mm,and 12mm) and four levels of moisture of preparation of the cassavamaterial.(48.5%w.b,50.5%w.b,52.5%w.b and 54.5%w.b). The experimental setup of theTESTOMETRICS Universal Testing Machine used in this experiment is shown in Fig. 1. A sample of1.5 kg of cassava dough was weighed and transferred into the press cage cylinder. Using the Jug Mode ofthe U T M, the compression piston was moved to touch the cassava material in the cylinder.
Fig. 1: The Piston-Cylinder assemblyon the Universal Testing Machine.

Journal of Agricultural Engineering and Technology (JAET), Volume 20 (No. 1) June, 2012
Nigerian Institution of Agricultural Engineers © www.niae.net 21
2.2 Durability Measurement
An existing tumbling machine constructed in NCAM was used for the determination of the durability ofthe cassava pellets. This was achieved by loading 1 kg sample of the pellets at 10% w.b into the canisterof the tester. The experiment was replicated three times.
The impeller was then run for 10min at 50rpm (ASAE Standards 1989). Durability was expressed as thepercent ratio of crumbled pellet (retained on sieve hole) after tumbling to the original sample mass. It ismathematically expressed as:
100pbt
patp M
MD (ASAE Standard, 1989)
Where, Dp= Durability of Pellet (%), Mpat = Mass of the Pellet after tumbling (grm), Mpbt = Mass of thePellet before tumbling (grm).
2.3 Experimental Design
A 4 x 3 factorial experiment using Randomized Complete Block Design (RCBD) was used to evaluate theeffect of machine speed, moisture content of cassava dough and die Diameter on the Durability of cassavapellets. The ranges of the factors were selected based on the review of literatures and preliminarylaboratory investigations. The factors in the factorial design are four levels each of machine speed,moisture content and die diameter. Each test was performed in three replicates making a total of 192values that were individually tested and measured.
Data obtained form the measured parameters from the mechanical extrusion experiment were statisticallyanalysed for the Analysis of Variance (ANOVA) and further tests to compare the means of the measuredparameters at each level of the process condition using Duncan’s Multiple Range Test (DMRT) was alsoperformed using the Statistical Package for Science and Social Science (SPSS) Version 11.0.
3. RESULTS AND DISCUSSION
3.1 General Effect of Parameters
The result of the statistical analysis shows that all the main factors and their interactions were significantat 5 percent level (Table 1). This shows that moisture content, speed, die diameter and all theircombinations had effect on durability of cassava pellets. This is in agreement with the studies carried outby other researchers like Jenifer. et al, (2004).
Table 1. Analysis of Variance Table (ANOVA)Source Sum off Squares Df Mean Square F-value F-Prob.Corrected Model 26757.799 63 424.727 4.453 *<0.0001Intercept 190317.19 1 190317.19 20366.982 *<0.0001MD 16320.869 3 5440.290 582.198 *<0.0001S 1296.559 3 432.186 46.251 *<0.0001D 3717.209 3 1239.070 132.600 *<0.0001MD * S 1841.764 9 204.640 21.900 *<0.0001MD * D 1334.922 9 148.325 15.873 *<0.0001S * D 406.845 9 45.205 4.838 *<0.0001MD * S * D 1839.631 27 68.134 7.291 *<0.0001Error 1196.083 128 9.344Total 218271.08 192*Significant at 5% level.MD=Moisture content, S=speed, D=Die diameter

Journal of Agricultural Engineering and Technology (JAET), Volume 20 (No. 1) June, 2012
Nigerian Institution of Agricultural Engineers © www.niae.net 22
3.2 Effect of Moisture Content on Durability
From Table 1 it is seen that the moisture content of the cassava dough had significant effect on thedurability of the cassava pellets at 5% level. In order to know the level(s) of moisture that contributedmore to the changes in durability of cassava pellets, Duncan’s Multiple Range Test was employed. Theresult of the comparison is as shown in Table 2.
From the table, moisture content level 48.5%wb had the highest mean value of durability followed bymoisture content level 50.5%wb, then moisture content 52.5%wb and the least mean value of durability isat moisture content 54.5%wb. This is in support of the statement made by Jennifer et al (2004) thatincrease in moisture content reduces durability. This might be as a result of weakness in the binding forcethat occurs as moisture content increases thereby reducing the durability of pellets produced. Therefore, itmay be concluded that the higher the moisture content level, the lower the binding force, the lower thedurability of pellets produced.
3.3 Effect of Die Diameter on Durability
From Table 1 it is seen that the die diameter of the extraction rig had significant effect on the durability ofcassava pellets at 5% level. In order to know the levels of the die diameter that contributed to thesignificant effect on the cassava pellets, Duncan’s Multiple Range Test was employed and the summaryof the analysis is shown in Table 3.
From the table, die diameter level 6mm had the highest mean value of durability followed by die diameter8mm then die diameter 10mm and the least mean value of durability is at die diameter 12mm. Moreover,all the mean values of durability are all significantly different at 5% level
This is in support of the conclusion made by Hill and Pulkinen (1988) that more durable pellets resultedfrom using small die sand less durable pellets resulted from large dies. This may be as a result of lowbinding force produced when the area of contact increase during compression because larger diediameters will give room for increase in area of contact while small die diameter will give decrease in thearea of contact.
Table 2. Effect of moisture content on durabilityMoisture content %(wb) Durability %48.550.552.554.5
44.28 A
34.13 B
28.76 C
18.76 D
Table 3. Effect of Die diameter on durabilityDie diameter Durability %6mm8mm10mm12mm
36.79 D
34.76 C
28.15 B
26.24 A
Table 4. Effect of speed on durabilitySpeed mm|min Durability
681012
34.16 C
30.47 B
27.70 A
33.60 C

Journal of Agricultural Engineering and Technology (JAET), Volume 20 (No. 1) June, 2012
Nigerian Institution of Agricultural Engineers © www.niae.net 23
Means with the same letters are not significantly different at 5% level using Duncan’s Multiple RangeTest.
3.4 Effect of Speed on Durability
From Table 1 it is seen that the speed of the machine had significant effect on the durability of cassavapellets produced at 5% level. In order to know the levels of the speed of the machine that contributedgreatly to the durability of the pellets, Duncan’s Multiple Range Test was employed and the summary ofthe mean values of the durability is as shown in Table 4.
From Table 4.0, it is seen that speed level 1.5mm/min had highest mean value of durability followed byspeed level 4.5mm/min, then 2.5mm/min while speed level 3.5mm/min had the least mean value ofdurability. According to Tabil (1996), speed affects how the material is compressed in the holes of thepelleting dies. Therefore, high durable cassava pellet were produced from low speed level of 1.5mm/min.In other words, effectiveness increases when particles sizes or inter-particle distance reduces whichresulted from levels of the speed during compression in pellet extrusion Pietsch (1984).
3.5 Effect of Moisture Content on Durability at Different Speed Levels
From Table 1 it can be seen that the interactions between the moisture content of the cassava dough andthe speed of the machine had significant effect on the durability of cassava pellets at 5% level and this isas shown in Figure 2. The figure shows that the trend of the durability of the pellets produced at thevarious speed levels decreased with increase in moisture content. Therefore, all the durability decreasedas the moisture content increased. This confirms the statement that increases in moisture content reducesdurability. This is in agreement with the findings of Jennifer et al (2004). This might be as a result of theweakness created within the particles of the cassava dough thereby reducing the binding force in thedough which affects the durability of cassava pellets produced.
3.6 Effect of Die Diameter on Durability at Different Moisture Content Levels
From Table 1, it can be seen that the interaction between the die diameter of the extraction rig and themoisture content of the cassava dough had significant effect on the durability of cassava pellets producedat 5% level and this is shown in Figure 3.
From Figure 3, it can be seen that the trend of durability reduces as the die diameter increases. Even thedurability trend for moisture level 54.5%wb that showed an initial increase in trend also reduced down theline as the die diameter increased. This is in agreement with the findings of other researcher like Hill et al.(1988). It may be concluded that as moisture content increases, if die diameter also increase, bindingforce will reduce.
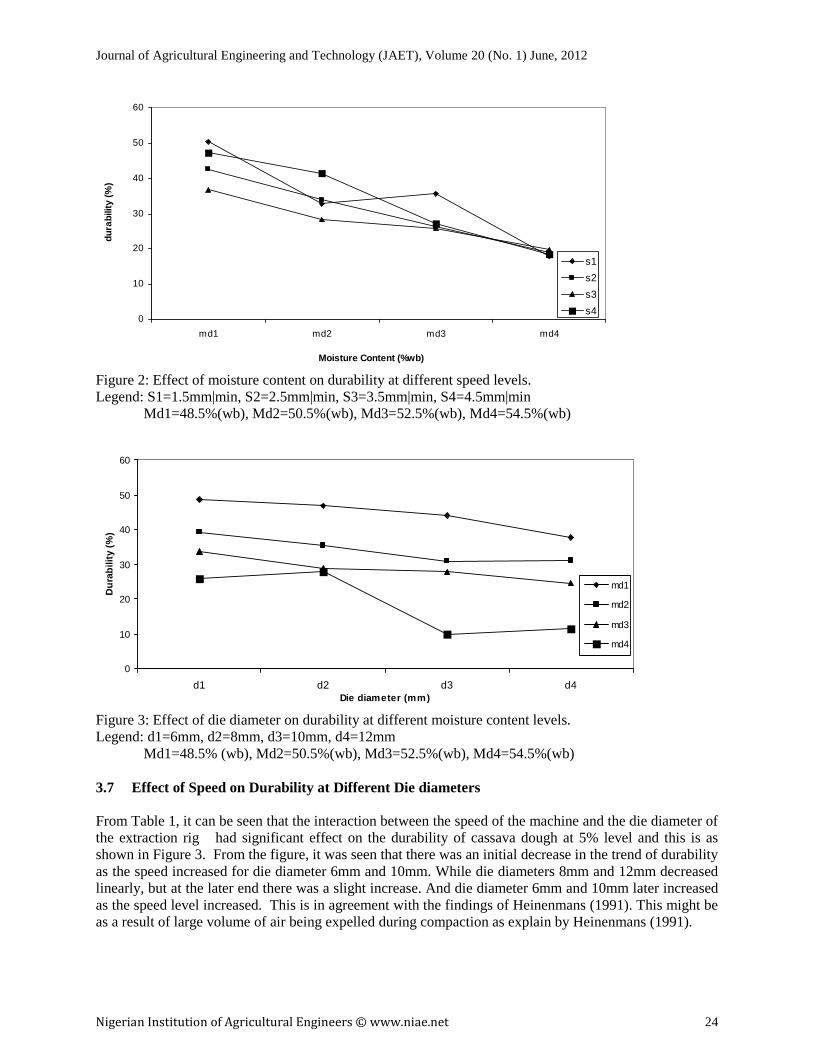
Journal of Agricultural Engineering and Technology (JAET), Volume 20 (No. 1) June, 2012
Nigerian Institution of Agricultural Engineers © www.niae.net 24
Figure 2: Effect of moisture content on durability at different speed levels.Legend: S1=1.5mm|min, S2=2.5mm|min, S3=3.5mm|min, S4=4.5mm|min
Md1=48.5%(wb), Md2=50.5%(wb), Md3=52.5%(wb), Md4=54.5%(wb)
Figure 3: Effect of die diameter on durability at different moisture content levels.Legend: d1=6mm, d2=8mm, d3=10mm, d4=12mm
Md1=48.5% (wb), Md2=50.5%(wb), Md3=52.5%(wb), Md4=54.5%(wb)
3.7 Effect of Speed on Durability at Different Die diameters
From Table 1, it can be seen that the interaction between the speed of the machine and the die diameter ofthe extraction rig had significant effect on the durability of cassava dough at 5% level and this is asshown in Figure 3. From the figure, it was seen that there was an initial decrease in the trend of durabilityas the speed increased for die diameter 6mm and 10mm. While die diameters 8mm and 12mm decreasedlinearly, but at the later end there was a slight increase. And die diameter 6mm and 10mm later increasedas the speed level increased. This is in agreement with the findings of Heinenmans (1991). This might beas a result of large volume of air being expelled during compaction as explain by Heinenmans (1991).
0
10
20
30
40
50
60
md1 md2 md3 md4
Moisture Content (%wb)
dura
bilit
y (%
)
s1s2s3s4
0
10
20
30
40
50
60
d1 d2 d3 d4Die diameter (mm)
Dur
abili
ty (%
)
md1
md2
md3
md4
Journal of Agricultural Engineering and Technology (JAET), Volume 20 (No. 1) June, 2012
Nigerian Institution of Agricultural Engineers © www.niae.net 25
4. CONCLUSION
From this research work, it can be concluded that,- Durable cassava pellet was obtained at lower die speed of 1.5mm/min and higher die speed of
4.5mm/min. This might be as a result of the increase in the effectiveness as particles size or inter-particle sizes distance reduces due to changes in the levels of speed during compression process inpellet extrusion. (Pietsch 1984).
- The higher the moisture4 content, the lower the binding force. Therefore the lower the durability.- As the die diameter level increases, the durability decreases. This might be due to the decrease in
the contact area.
REFERENCES
ASAE, 1989. Standard S269.4- Cubes, Pellets, and Crumbles – definitions and methods for determiningdensity, durability, and moisture content ASAE DEC 96. Standard S358.2 moisture measurementforages ASAE, ST Joseph,MI.
Heinemans, H. 1991. The interaction of practical experience and the construction of new Pelleting andCooling machinery. Advances in feed Technology. 6: 24-38.
Hill, B. and D. A. Pulkinen 1988. A Study of Factors affecting Pellet Durability and Pelleting Efficiencyin the Production of Dehydration Alfalfa Pellets. Saskatchewan Dehydrators Association, pp.20-23
Jennifer, M .C, Fasina, O. O, Yucheng, F, and German Mills 2004. An AE\CSAE Annual InternationalMeeting presentation .Paper no: 046005.
Leaver, R .H. 1985. Pelleting dies: Characteristics and selection. sprout -waldron feed pointer 26:1-6.Nweke, F .I 1988. COSCA project description. COSCA working paper no 1. Collabo study of cassava in
Africa.IITA, Ibadan,Nigeria.Hill, B. and D. A. Pulkinen 1988. A Study of Factors affecting Pellet Durability and Pelleting Efficiency
in the Production of Dehydration Alfalfa Pellets. Saskatchewan Dehydrators Association, pp.20-23Pietsch, W. 1984. Size enlargement methods and equipment part 2. Agglomerate bonding and strength. In
handbook of powder science and Technology, eds. M. E.Fayed and Lotten. 231-252. New York, NY:Van Nostrand Rei
Singh. A. and Singh Y. 1982. Briquetting of paddy straw. Journal of Agriculural Mechanization In Asia,Africa and Latin America Autum 1982: 42-44.
Tabil,L . G, Sokhansanj,S and Tyler R . T 1997. Performance of different binders during AlfalfaPelleting. Canadian Agricultural Engineering. V39 :17- 23.
Tabil, L. 1996. Pelleting and binding characteristic of alfalfa. Unpublished Ph. D Thesis. Department andBiosource Engineering University of Saskatchewan, Saskatoon, SK.

Journal of Agricultural Engineering and Technology (JAET), Volume 20 (No. 1) June, 2012
Nigerian Institution of Agricultural Engineers © www.niae.net 26
CHARACTERIZATION OF CHIPS PARTICLE SIZE PRODUCEDFROM A VERTICAL DISC WOOD CHIPPER
S. R. Bello1 and M. A. Onilude2
1Department of Agricultural Engineering Technology, Federal College of Agriculture Ishiagu,Ebonyi State, Nigeria.
2Department of Agricultural and Environmental Engineering, University of Ibadan, NigeriaEmail: [email protected]
ABSTRACT
Wood chip production in Nigeria is limited by the unavailability of chip size reduction equipments.However, wood feedstock conversion into valuable chips for pulp production, furnace/domestic heating,agricultural and environmental uses could make wood wastes have high market value. The collectedwood chip samples were classified based on SCAN-CM 40:01 method. The true size distributions weredetermined by chip measurement based on TAPPI 257 method. These results were compared withcommercially available data on machine specifications and chip size distribution. Chips produced wereclassified into five classes; Oversize (45 mm ≤ F1 ≤ 60 mm), Over-thick (16 mm ≤ F2 ≤ 45 mm), Largeaccept (8 mm ≤ F3a ≤ 16 mm), Small accept (3 mm ≤ F3b ≤ 8 mm), Pin chips (1 mm ≤ F4 ≤ 3mm, and Fine(F5 ≤ 3mm). Proportions of particle size distribution are; oversize particles (4.3%), accepted chips (86.6%), pin chip (5.4%) and fines (2.7%).
KEYWORDS: Assortment, chipper, chip class, chip distribution, wood processing, particle sizedistribution.
1. INTRODUCTION
The desire for good quality chip in pulp industry is a strong factor in the design of chipper machines. Therange of chip sizes obtainable in chippers include; 25.4-76.2mm (1 to 3 inches) in length, 12.7-25.4mm(1/2 to 1 inches) in width, and (6.25-25.4) mm (¼ - 1 inch) thick (Maker, 2004). Wood chips expectedfrom the machine are typically rectangular in shape, and of average dimensions of 25.4mm (1inches) inlength, 19.05mm (0.75 inches) in width and 19.05mm (0.57 inch) thickness (Maker, 2004).
A literature search indicates that specific homogeneous chip sizes are rarely obtainable in existingchippers (Brill, 1985; CWC, 1997; Jones et al., 2003). Chips produced by chipper machines has variablesizes which when screened classified the chips into sizes can have various uses such as being spread as aground cover, being pressed into particleboard or fiberboards, or being fed into a digester duringpapermaking. The use of wood waste in animal bedding is known to be widespread (CALU, 2005).
Dry woodchip has been used as an alternative to straw under sheep and cattle housed in sheds (Frost etal., 2005). The wood products industry in Nigeria is limited by the ability of processors to engineer woodreduction process to meet market specifications. However, in parts of the country where wood feed stockand fiber has high potential markets, there is an emphasized need to design and test wood reductionsystems thus justifying the basis for this research work.
The huge amount of wood residue produced by wood-based industries notably sawmills and woodrecovered from construction and demolition activities are hardly well utilized, thereby constituting wastedump sites, but when properly processed serve as a readily available cheap resources for other industrialand domestic uses. Adetogun (2008) observed that considering the economic value of wood waste, asignificant portion of them does not adequately meet the needs of the consumer industries while manyhave different attributes because of the diversity in sources of the tree species. These variations include;the presence of foreign or non-wood contaminants, mix-up of different species with varying properties(chemicals and physical) and variable moisture content of the recovered wood.
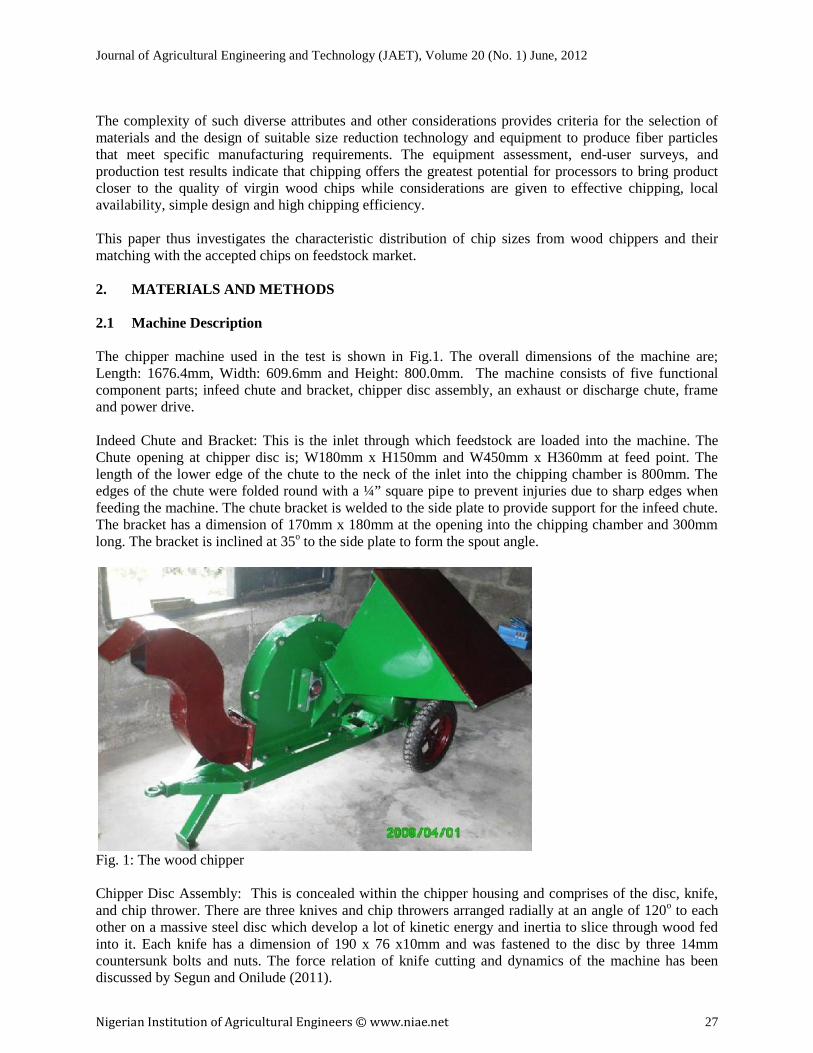
Journal of Agricultural Engineering and Technology (JAET), Volume 20 (No. 1) June, 2012
Nigerian Institution of Agricultural Engineers © www.niae.net 27
The complexity of such diverse attributes and other considerations provides criteria for the selection ofmaterials and the design of suitable size reduction technology and equipment to produce fiber particlesthat meet specific manufacturing requirements. The equipment assessment, end-user surveys, andproduction test results indicate that chipping offers the greatest potential for processors to bring productcloser to the quality of virgin wood chips while considerations are given to effective chipping, localavailability, simple design and high chipping efficiency.
This paper thus investigates the characteristic distribution of chip sizes from wood chippers and theirmatching with the accepted chips on feedstock market.
2. MATERIALS AND METHODS
2.1 Machine Description
The chipper machine used in the test is shown in Fig.1. The overall dimensions of the machine are;Length: 1676.4mm, Width: 609.6mm and Height: 800.0mm. The machine consists of five functionalcomponent parts; infeed chute and bracket, chipper disc assembly, an exhaust or discharge chute, frameand power drive.
Indeed Chute and Bracket: This is the inlet through which feedstock are loaded into the machine. TheChute opening at chipper disc is; W180mm x H150mm and W450mm x H360mm at feed point. Thelength of the lower edge of the chute to the neck of the inlet into the chipping chamber is 800mm. Theedges of the chute were folded round with a ¼” square pipe to prevent injuries due to sharp edges whenfeeding the machine. The chute bracket is welded to the side plate to provide support for the infeed chute.The bracket has a dimension of 170mm x 180mm at the opening into the chipping chamber and 300mmlong. The bracket is inclined at 35o to the side plate to form the spout angle.
Fig. 1: The wood chipper
Chipper Disc Assembly: This is concealed within the chipper housing and comprises of the disc, knife,and chip thrower. There are three knives and chip throwers arranged radially at an angle of 120o to eachother on a massive steel disc which develop a lot of kinetic energy and inertia to slice through wood fedinto it. Each knife has a dimension of 190 x 76 x10mm and was fastened to the disc by three 14mmcountersunk bolts and nuts. The force relation of knife cutting and dynamics of the machine has beendiscussed by Segun and Onilude (2011).

Journal of Agricultural Engineering and Technology (JAET), Volume 20 (No. 1) June, 2012
Nigerian Institution of Agricultural Engineers © www.niae.net 28
The chip thrower is produced from a piece of 50 x 50x 5mm angle iron, and 190mm in length. Thefunction of the disc assembly is to develop enough inertia to chip wood fed into it and to eject the chipsthrough the chip discharge chute. The side plates and the housing configurations provide a covering forthe disc and also cause a pressure buildup in the chipping chamber.
Exhaust/Discharge Chute is a long vertical spout attached to the peripheral end of the machine andcoupled to the side plates by fasteners. It has an s-configuration and a vertical height of 600mm asrecommended for most mobile chippers. The overall dimensions of the chute are (600 x 450 x 95mm).Chip delivery is controlled by a flap attached to the rear of the chute which can be adjusted verticallythrough 180o for chip control.
The Frame: The frame consists of two long square steel tubing of dimension 50mm x50mm x 5mm withbrackets for components attachment and a land wheel for mobility and easy movement within forest. Italso provides mobility for the machine’s bulk weight for convenience, quick and easy transport whencoupled to the drawbar of a tractor. The two back wheels were connected by a 600mm long, 25.4mmdiameter shaft simply supported on frictionless bearings and a supporting stand in front for stability. Adrawbar attachment is provided for tractor coupling and transport. The chipper assembly and the powerdrive were fastened to the frame by bolts and nuts.
Power Drive: This is the prime mover of the machine and it is a 14Kw low speed electric motor withmaximum load speed of 1440rpm. The drive unit transmits power to the chipper through 812.8mmmaximum center distance with two B-type V-belts double grooved pulley arrangement.
2.2 Procedure for Performance Test
Performance tests were conducted and observations made. The feedstock assortment used for the test(Fig. 3) includes whole round logs with limbs trimmed off (diameter ranging from 2.54mm - 90mm), andoff-cuts from sawmill having assorted sizes sourced from sawmills and nearby field around Ibadan. Theaverage buck length of feedstock ranges between 300mm-1200mm. The wood samples are dry withmoisture content range between 15% and 27%.
Woods were fed at an estimated 5mms-1 feed rate. Each test session lasts for about 10minutes. Samplescollected from test for laboratory analysis were stored in polyethylene bags. All samples were screenedaccording to classification method used by (Brill, 1985, Spinelli et al., 2005 & Tom et al., 2008). Thechip fractions separated were examined for quality of cutting, size distribution and chip quality.
2.3 Chip Sampling Procedures
For the purpose of obtaining a representative sample from each test, random sampling procedures usingchip sample collection in accordance with TAPPI’s -257 Sampling and Preparing Wood for Analysis-strategy. Chips examined were classified based on SCAN-CM 40:01 classification reported by (Brill,1985).
3. RESULTS AND DISCUSSIONS
3.1 Particle Size Distribution of the Chips
Table 1 shows the particle size distribution of various chip sizes obtained from the test. The chip sizesrepresented in column 2 showed the relationship between uniformity indexes of each class and it isexpressed as content of accepted chips (main fractions), fine fractions and coarse fraction.

Journal of Agricultural Engineering and Technology (JAET), Volume 20 (No. 1) June, 2012
Nigerian Institution of Agricultural Engineers © www.niae.net 29
Table 1: Chip Size Distribution
ClassesMain Fraction >80% of
weightFine Fraction < 5%
of WeightCoarse Fraction < 5% of
WeightF1 45mm F 60mm <1 mm Max 1% > 60mmF2 16mm F 45mm <1 mm Max 1% > 45mmF3a 8mm F 16mm <1 mm Max 1% > 16mmF3b 3.5mm F 8mm <1 mm Max 1% > 8mmF4 1mm F 3.5mm <1 mm Max 1% > 3.5mmF5 F 3mm <1 mm Max 1% > 3mm
The main fraction of each class produced is over 80% of the total chip weight, fine fractions less than1mm within each class is less than 5% and the coarse fraction of maximum length less than 95mm is lessthan 1% in each class sampled. There are no dust particles, an indication of no grinding effect duringchipping, though this could largely dependent on the feedstock and the moisture content of wood withinthe FSP range of 27% mc (Bjurulf, 2006). The dimensional variations in the chips are consistent withaccept results obtained with commercial chippers (Maker, 2004; Kanidl, 2009)
The percentage-mean size distribution of the various chip sizes as a fraction of percentage total weight ofchipped samples is shown in Fig. 2.
Table 2: Classification of chip sizes by percentage mean distribution
ClassesOversize
(F1)45-60mm
Over-thick(F2)
16-45mm
Large Accept(F3a)
8-16mm
Small Accept(F3b)
3-8mm
Pin Chips(F4)
1-3mm
Fines(F5)
≤ 3mm% TotalWeight
4.3 7.1 25.8 53.7 5.4 2.7
Source: Experimental result, 2009
These values are represented in Fig. 2. From the table, it is evident that the presence of fines andoversized chips were extremely limited (2.7% and 4.3% respectively). No sample contained dust andparticles above the 60 mm threshold. The 3-16 mm range was represented in very high proportions (25.8to 53.7% by weight). This result when compared to those of Tom et al., 2008 in a bar chart presented inFig. 2 showed the similar pattern of distribution.
Fig. 2: Mean particle size classification by chipper
0102030405060
45 -60mm
16 -45mm
8 - 16mm
3.5 - 8mm
1 -3 mm ≤ 3mm
Oversize Over-thick
LargeAccept
SmallAccept
Pin Chips Fines
% T
OTA
L W
EIG
HT
PARTICLE SIZE DISTRIBUTION
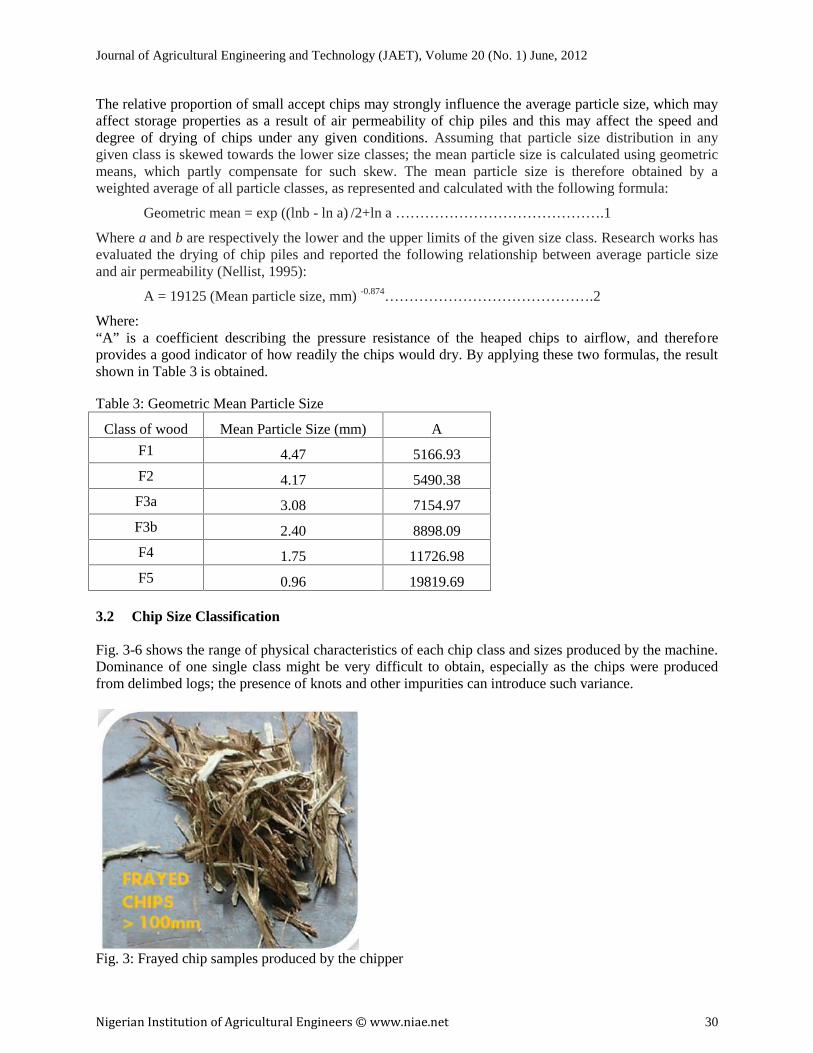
Journal of Agricultural Engineering and Technology (JAET), Volume 20 (No. 1) June, 2012
Nigerian Institution of Agricultural Engineers © www.niae.net 30
The relative proportion of small accept chips may strongly influence the average particle size, which mayaffect storage properties as a result of air permeability of chip piles and this may affect the speed anddegree of drying of chips under any given conditions. Assuming that particle size distribution in anygiven class is skewed towards the lower size classes; the mean particle size is calculated using geometricmeans, which partly compensate for such skew. The mean particle size is therefore obtained by aweighted average of all particle classes, as represented and calculated with the following formula:
Geometric mean = exp ((lnb - ln a) /2+ln a …………………………………….1
Where a and b are respectively the lower and the upper limits of the given size class. Research works hasevaluated the drying of chip piles and reported the following relationship between average particle sizeand air permeability (Nellist, 1995):
A = 19125 (Mean particle size, mm) -0.874…………………………………….2
Where:“A” is a coefficient describing the pressure resistance of the heaped chips to airflow, and thereforeprovides a good indicator of how readily the chips would dry. By applying these two formulas, the resultshown in Table 3 is obtained.
Table 3: Geometric Mean Particle Size
Class of wood Mean Particle Size (mm) A
F1 4.47 5166.93
F2 4.17 5490.38
F3a 3.08 7154.97
F3b 2.40 8898.09
F4 1.75 11726.98
F5 0.96 19819.69
3.2 Chip Size Classification
Fig. 3-6 shows the range of physical characteristics of each chip class and sizes produced by the machine.Dominance of one single class might be very difficult to obtain, especially as the chips were producedfrom delimbed logs; the presence of knots and other impurities can introduce such variance.
Fig. 3: Frayed chip samples produced by the chipper

Journal of Agricultural Engineering and Technology (JAET), Volume 20 (No. 1) June, 2012
Nigerian Institution of Agricultural Engineers © www.niae.net 31
The chip particles seen in Fig. 3 samples were products of off cuts from sawmill which are broadlycharacterized by fibrous nature with frayed ends. This could be as a result of the nature of tree and thesharp cutting edge of the knife, which could create more ripping action rather than cutting or slicing.Dimensions of chip range from L: >100mm W: 10mm T: 3mm.
Fig. 4: Oversized chip samples produced by the chipper
The range of particles in Fig. 4 shows almost an even proportion of L: (60-16) mm W: (20-10) mm T:(16-3) mm. The oversized chips are longer along the grains than the over-thick which has short lengthsbut wider thickness (16-45) mm. The products were both clean indicating a good quality chip obtainedfrom commercial wood chippers but do not meet the standard for pulp accepts. This product finds use infurnace and boiler heating as fuel, oriented strand board and horse gallop.
Fig.5: Accept chip samples produced by the chipper
The quantity of the accept chips (small and large) measured were in the range (Length: 3/4-inch (20mm)maximum, Thickness: < 3/4-inch (3mm to 16mm), and Width: < 3/4-inch). The quantity produced by themachine is substantial (86.6% by weight), a result which corresponds to those of (CWC, 1997; Spott,1982; and Bedair, 2008) thus the machine can serve a Kraft pulping operation. The proportions of Fines:(< 1/8-inch) maximum 5%, and Overs: (>3/4-inch) maximum, 5% of the gross found in the samplecorresponds to the specifications given by (CWC, 1997) for particleboard manufacturing.
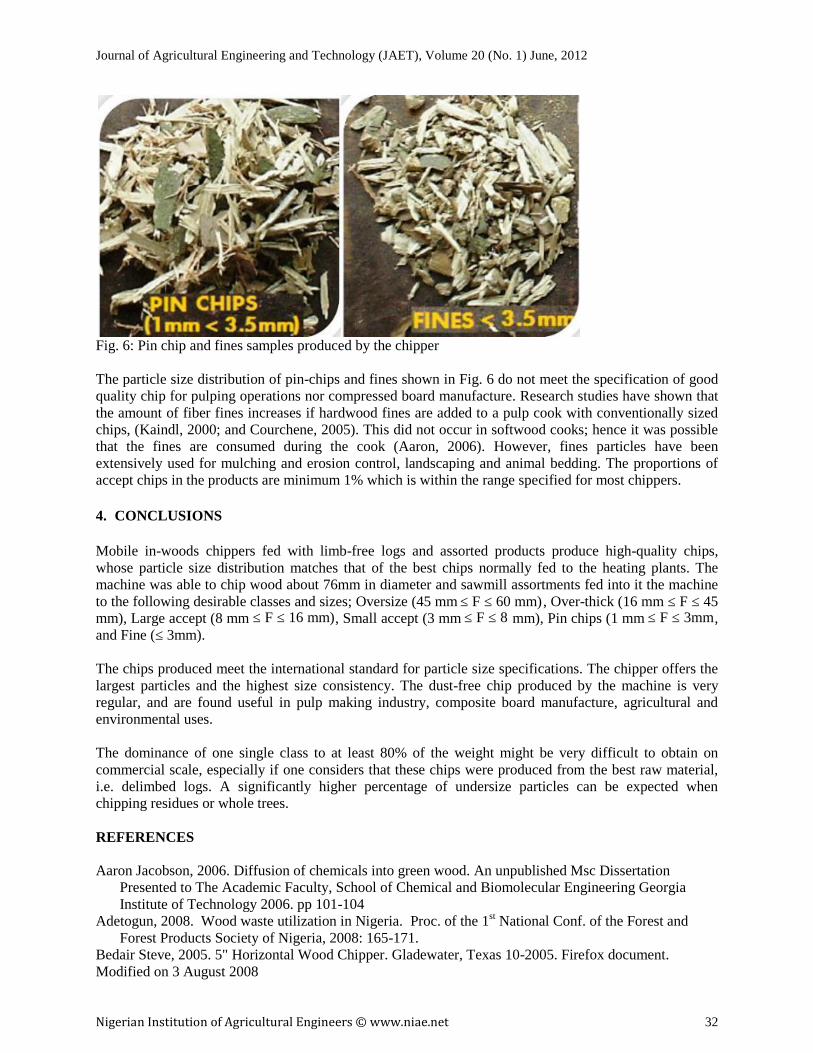
Journal of Agricultural Engineering and Technology (JAET), Volume 20 (No. 1) June, 2012
Nigerian Institution of Agricultural Engineers © www.niae.net 32
Fig. 6: Pin chip and fines samples produced by the chipper
The particle size distribution of pin-chips and fines shown in Fig. 6 do not meet the specification of goodquality chip for pulping operations nor compressed board manufacture. Research studies have shown thatthe amount of fiber fines increases if hardwood fines are added to a pulp cook with conventionally sizedchips, (Kaindl, 2000; and Courchene, 2005). This did not occur in softwood cooks; hence it was possiblethat the fines are consumed during the cook (Aaron, 2006). However, fines particles have beenextensively used for mulching and erosion control, landscaping and animal bedding. The proportions ofaccept chips in the products are minimum 1% which is within the range specified for most chippers.
4. CONCLUSIONS
Mobile in-woods chippers fed with limb-free logs and assorted products produce high-quality chips,whose particle size distribution matches that of the best chips normally fed to the heating plants. Themachine was able to chip wood about 76mm in diameter and sawmill assortments fed into it the machineto the following desirable classes and sizes; Oversize (45 mm ≤ F ≤ 60 mm) , Over-thick (16 mm ≤ F ≤ 45mm), Large accept (8 mm ≤ F ≤ 16 mm), Small accept (3 mm ≤ F ≤ 8 mm), Pin chips (1 mm ≤ F ≤ 3mm,and Fine (≤ 3mm).
The chips produced meet the international standard for particle size specifications. The chipper offers thelargest particles and the highest size consistency. The dust-free chip produced by the machine is veryregular, and are found useful in pulp making industry, composite board manufacture, agricultural andenvironmental uses.
The dominance of one single class to at least 80% of the weight might be very difficult to obtain oncommercial scale, especially if one considers that these chips were produced from the best raw material,i.e. delimbed logs. A significantly higher percentage of undersize particles can be expected whenchipping residues or whole trees.
REFERENCES
Aaron Jacobson, 2006. Diffusion of chemicals into green wood. An unpublished Msc DissertationPresented to The Academic Faculty, School of Chemical and Biomolecular Engineering GeorgiaInstitute of Technology 2006. pp 101-104
Adetogun, 2008. Wood waste utilization in Nigeria. Proc. of the 1st National Conf. of the Forest andForest Products Society of Nigeria, 2008: 165-171.
Bedair Steve, 2005. 5" Horizontal Wood Chipper. Gladewater, Texas 10-2005. Firefox document.Modified on 3 August 2008

Journal of Agricultural Engineering and Technology (JAET), Volume 20 (No. 1) June, 2012
Nigerian Institution of Agricultural Engineers © www.niae.net 33
Brill J., 1985. Effects of wood and chip quality on TMP properties, 1985 International MechanicalPulping Conference, proceedings, SPCI Stockholm: 153-161.
Bjurulf Anders, 2006. Chip Geometry Methods to impact the geometry of market chips. UnpublishedDoctoral thesis Swedish University of Agricultural Sciences Uppsala ISSN 1652-6880, ISBN 91-576-7110-9
CALU. 2005. Woodchip for animal bedding and compost. CALU Technical Note 050104 October 2005Courchene, C., 2005. Improving Fiber Quality for Tissue-Making. Georgia Institute of Technology, 2005,
p.13.CWC, 1997. Wood Waste Size Reduction Technology Study 1997, NIST MEP Environmental program
(# CDL-97-3) www.cwc.org.Frost D., McLean B. and Wildig J. 2005. The Multi-Use of Woodchip - From Animal Bedding to
Mushroom Production. Farm Woodland Forum Meeting, 29 June – 1 July 2005.Jones Trevor G, Song Guisheng George, Richardson John D, 2003. Chipper setting effects on chip size
distributions and mechanical pulp properties. Proceedings of the 57th Appita Annual Conference andExhibition, Melbourne, Australia 5-7 May 2003
Kaindl, 2000. Quality and dimension specifications for saw mill residue, wood chips with bark (spruce,fir, pine, larch, Douglas fir). Date modified; march 2nd 2009.
Maker M Timothy, 2004.Wood-Chip Heating Systems. A Guide for Institutional and CommercialBiomass Installations. Revised by Biomass Energy Resource Center Montpelier, Vermont,
Nellist M. 1995. The effect of particle size on the storage and drying of wood fuels. In. Hudson B. and P.Kofman [Ed.] Harvesting storage and road transportation of logging residues. Proceedings of aworkshop of IEA-BA-Task XII activity 1.2 held in October 1995 Glasgow, Scotland. FSL, Vejle(Denmark). pp: 59-70.
Segun R. Bello, 2009. Design, Construction and Performance Evaluation of a Disc Chipper. Anunpublished MSc Dissertation presented to the Department of Agricultural and EnvironmentalEngineering, University of Ibadan, Nigeria, 2009. pp 103-114
Segun R. Bello and Musiliu A. Onilude, 2011. Force Relations and Dynamics of Cutting Knife in aVertical Disc Mobile Wood Chipper. Leonardo Electronic Journal of Practices and TechnologiesIssue 18, January-June 2011 ISSN 1583-1078 p. 17-36 URL:http://lejpt.academicdirect.org/A18/017_034.htm
Spinelli Raffaele, Bruce R. Hartsough, and, Natascia Magagnotti, 2005. Testing Mobile Chippers forChip Size Distribution. International Journal of Forest Engineering.http://www.lib.unb.ca/Texts/JFE/July05/spinelli.pdf
Spott, 1982. Design Data. Compiled by faculty of mechanical Engineering P.S.G College of Technology,1982Coimbatore 641004 India.
Tom Kent, EndaCoates, Tom Dwyer & Sean Kelly, 2008. Physical Analysis of Woodchip. Power pointpresentation. Waterford Institute of Technology. Modified August 3rd 2008

Journal of Agricultural Engineering and Technology (JAET), Volume 20 (No. 1) June, 2012
Nigerian Institution of Agricultural Engineers © www.niae.net 34
EFFECT OF IMMOBILIZATION ON SPHERICAL PALMWOOD CHIPSFOR BIO-ETHANOL PRODUCTION
A. Mohammed and U. ShafihiDepartment of Chemical Engineering,
The Federal Polytechnic, P.M.B 55, Bida, Niger State, [email protected]
ABSTRACT
Production of ethanol using Saccharomyces cerevisiae immobilized on spherical palm wood chips in atubular reactor was successfully carried out. The work is aimed at determining the effect ofimmobilization on bio-ethanol production. An initial concentration of 30g/lit of glucose was used. After10 hours, glucose consumption was 87%; ethanol productivity was 16.7v/v. A yield of 36% was obtainedwith 30 g/lit of glucose used. Using the lineweaver-Burk plot and COMSOL Reaction Lab software, thekinetic parameter (Km and μm) estimated were 495.72 g/lit and 0.3 hr-1. In order to determine the growthrate, the mass of a single spherical chip was measured accurately and the shape of the plot was sigmoidal.The kinetic behavior of the process was studied with the aid of an appropriate mathematical model, whichtakes into account simultaneous mass transfer and reaction kinetics. Based on the experimentalobservations with an assuming temperature of 20oC at the center of the spherical chip, the Knudsendiffusivity calculated was 8.54 x 10⁻³ cm2/s. The Thiele-type modulus (Ø) is 1.094, which indicates thatmass transfer controls the process with a maximum rate of reaction 0.013 g lit-1 s-1.
KEYWORDS: Mathematical model, simulation, immobilization, mass transfer, bio ethanol.
1. INTRODUCTION
Research, development and industrialization of renewable energy are currently moving at a rapid paceworldwide. Bio-fuels play significant roles in decarbonisation of our future energy needs and act tomitigate deleterious impacts of greenhouse gas emissions (Walker, 2010). Bio-fuels are a wide range offuels which are in some way derived from biomass. The term covers solid biomass, liquid fuels andvarious biogases (Demirbas, 2009). Biofuels are gaining increased public and scientific attention, drivenby factors such as oil price spikes, the need for increased energy security, and concern over greenhousegas emissions from fossil fuels.
Bio-ethanol is an alcohol made by fermenting the sugar components of plant materials and it is mademostly from sugar and starch crops. With advanced technology being developed, cellulosic biomass, suchas trees and grasses, are also used as feed stocks for ethanol production. Ethanol can be used as a fuel forvehicles in its pure form, but it is usually used as a gasoline additive to increase octane and improvevehicle emissions. Bio-ethanol is widely used in the USA and in Brazil. Ethanol produced byfermentation has been found to serve considerably as transportation fuel for cars, trucks and trains(Ghasen, 2007). The production of ethanol is not limited, but constantly replenished by growing plantsand is advantageous over petroleum as a source of fuel in that petroleum source is steadily depleted withusage. Ethanol fuel has not been fully exploited because gasoline has been available, cheap and easy toproduce. However, there is an increasing demand for fuel today and the price differential between ethanoland gasoline is getting narrower (Ghasen, 2007).
There are lots of other alternative fuels such as methanol, methane, natural gas, propane, hydrogen, etc.Nevertheless, the remarkable characteristics of ethanol distinguish it as the best alternative fuel forautomobile. It has high latent heat of vaporization, high octane number and rating, and emission of toxiccompounds on its combustion is low (Akpan, 2005). Though ethanol has a lower heating value of about60% of typical regular gasoline, this low heating value is compensated for, by high latent heat ofvaporization of 361Btu/lb (839.686kJ/kg) which is more than twice that of gasoline, which is about

Journal of Agricultural Engineering and Technology (JAET), Volume 20 (No. 1) June, 2012
Nigerian Institution of Agricultural Engineers © www.niae.net 35
140Btu/Ib (325.64kJ/kg). Thus, when ethanol and gasoline are respectively burned in correctstoichiometric ratios, they have about equal volumetric efficiency. When gasoline is burned, it produceswater, carbon dioxide, carbon monoxide and other impurities such as oxides of sulphur and nitrogen, andheavy metals. On the other hand, pure ethanol is burned to produce carbon dioxide, water, and a muchlower amount of carbon monoxide. Hence, ethanol will be a better replacement for gasoline.
Ethanol is used as an automobile fuel by itself and can be mixed with gasoline to form gasohol. Ethanolcan be burned in the millions of existing vehicles engines with little or no modifications. According toRural Industries Research and Development Corporation (RIRDC) (Walker, 2010), ethanol may be usedas a fuel in several ways:
a) At level up to 10% ethanol may be blended with gasoline (E-10), and used in most modern carsengines with no modifications;
b) In Brazil a blend of approximately 22% ethanol (E22) in gasoline is used in many vehicles withonly minor modifications of engines;
c) In both USA and Brazil, some vehicles use pure, hydrous ethanol (an azeotrope of 96% ethanol and46% water). In each case vehicles require engines and fuel systems that are designed with the highlevels of ethanol in mind. Ethanol is also used in fuel cell for stationary power and automobiles.
Ethanol has been made since ancient times by the fermentation of sugars. All beverage ethanol and morethan half of industrial ethanol is still made by this process. Starch from potatoes, corn, or other cereals canbe the raw material. The yeast enzyme, and zymase, changes the simple sugars into ethanol and carbondioxide. The fermentation reaction, represented by the simple equation C6H12O6→ 2C2 H5OH + 2CO2 isactually very complex because impure cultures of yeast produce varying amounts of other substances,including fusel oil, glycerin, and various organic acids. The fermented liquid, containing from 7 to 12percent ethanol, is concentrated to 95 percent by a series of distillations.
The objective of this study is to investigate the possibility of producing ethanol from palm wood usingimmobilization technology.
2. METHODOLOGY
2.1 Materials
Micro-organism: A local strain of yeast was purchased from a pharmaceutical store in Bida, Niger state,Nigeria.
Culture Medium: The culture medium used for growing the organism consists of 5g glucose, and 0.5gyeast extract, 0.4g (NH4)2SO4, 0.25g CaCL2, respectively, 1.5g KH2PO4 and 2.25g Na2PO4 phosphatebuffer up to a total volume of distilled water, 500 ml.
Immobilization Support: Palm wood chips cut into spherical shape of approximately 2 cm diameterwere used as support for the immobilization of the cells.
Reactor Preparation: The immobilized cell reactor was a plug flow tubular reactor column, constructedwith a nominal diameter of 6 cm, borosilicate glass of 1.5 mm wall thickness and 70 cm length. Thecolumn was sterilized using a solution of sodium metabisulphate.
2.2 Experimental Procedure
Growth of Culture in Shake Flasks: Four conical flasks were sterilized at 15 psia and 121oC for 15mins with each containing 200 ml of nutrient broth. Each of the flasks was inoculated with S. cerevisieaand allowed to grow for 24 hrs on a shaker. This serve as the inoculums culture. After cooling, 100 μl of20 %( w/v) antibiotics (ampiclox) was added to the solution to prevent bacterial growth before

Journal of Agricultural Engineering and Technology (JAET), Volume 20 (No. 1) June, 2012
Nigerian Institution of Agricultural Engineers © www.niae.net 36
inoculation. The growth was monitored for 24 hrs using optical density measurement taken at 520 nmspectrophotometer, Cecil 1000 series (Cecil Instruments, Cambridge, UK) two hour intervals.
Immobilization: The cell support i.e. palm wood chip was treated by boiling until decolouration of waterstopped, to extract soluble contaminants after which it was sun dried for 2-3 days. The column reactorwas randomly packed with the cell support and its top plugged with cotton wool. The microbial cellsgrown in the shake flasks were transferred into the column with the aid of peristaltic pump (masterflexspeed controller). The cell solution was transferred into the reactor at a flow rate of 12 ml/min for 24 hrs.The cell solution was continuously re-circulated, and the extent of retention monitored bihourly by takingoptical density of the effluent at 520 nm using spectrophotometer, Cecil 1000 series (Cecil Instruments,Cambridge, UK) against water blank.
Growth Characteristics of Saccharomyces cerevisiae: In order to determine the growth of immobilizedcells, the dry weight of the chip on immobilization and the dry weight with substrate was taken at twohours intervals using a weighing balance, Adventurer series; model 73/23/EC Ohaus Corporation USA.The difference in each case was noted plotted and the result is shown in Fig 5.
2.3 Analysis
Glucose Assay: A sample of 0.5 g of dextrose was dissolved in 1000 ml distil water. 1 ml of the solutionwas variously taken for a serial dilution of 1000 ml, 500 ml, 250 ml, 100 ml and 50 ml. 20 ml of eachdilution was taken and 2 ml of copper reagent added to it. The solution was boiled for 12 minutes andallowed to cool. 2 ml of Arsenomolybdate was added to the solution followed by 5 ml water. The opticaldensity of each solution was determined at 520 nm using spectrophotometer, Cecil 1000 series (CecilInstruments, Cambridge, UK) against a blank.
Ethanol Assay: Ethanol assay was carried out using gas chromatography (Hp 5890 series) equipped witha flame ionization dictator.
Model Equation for Determining Controlled Process: The immobilized enzyme reaction is assumedirreversible, and can be represented as:
CBA
COOHHCOHC 2526126 22
As reaction occurs, substrate diffuse into the porous pellet particle and conversion (Reaction) takes placeat the active site, and the products diffuses out to the bulk of the solution (James and David, 1986).
For Mass Transfer with Reaction;Effectiveness factor η is defined as:
conditionsurfaceouteratevaluatedrate
pelletwholetheforrateactual (1)
sA
p
r
r (2)
Where pr = rate for the whole pellet based on unit mass of catalyst (mol/s.kg chip)
sAr = Rate on average surface of this particle (mol/s.kg)
sAp rr . (3)
Letdt
dNbe moles of substrate diffused/consumed per unit time, per unit chip. The rate equations are

Journal of Agricultural Engineering and Technology (JAET), Volume 20 (No. 1) June, 2012
Nigerian Institution of Agricultural Engineers © www.niae.net 37
sAbAms CCKrdt
dN)()(.)(4 2 External diffusion (4)
r
Aek dr
dCDr
dt
dN
.)(4 .
2 Diffusion through pellet (5)
Am
AA Ck
CVr
dt
dN
.max ------ Reaction at r (6)
Where Km = external mass transfer coefficient. (mol /s* m2*(mol/m3)), (Dk)e = Diffusivity of A throughthe porous layer (m2/s), rs= outer radius of the pellet particle (m), r = Distance A diffuses before reactionoccurs (m), CA = Substrate concentration (mol/m3), (CA)b = bulk concentration of A in (mol/m3), (CA)s =concentration of A at the surface of the pellet (mol/m3).Mass conservation expression is given by:
elementvolume
thewithiniof
onaccumulatiofrate
elementvolume
thewithiniof
productionofrate
elementvolume
ofoutiof
diffusionofrate
elementvolume
oiof
diffusionofRate
int ------- (7)
At Steady State:Rate of diffusion into volume element less the rate of diffusion out will equal the rate of disappearance ofreactant within the volume element.
Arr
Ae
r
Ae rrr
dr
dCDkr
dr
dCDkr .4)(4)(4 222
(8)
Take limit as Δr → 022 ...)( rr
dr
dCr
dr
dDk A
Ae
(9)
dr
dC
rdr
CdDkr AA
eA .2
.)(2
(10)
Assuming that intrinsic reaction kinetic of the immobilized enzyme catalyst reaction is express in terms ofMichaelis-Menten equation and
)(sAA rr
Am
AA Ck
CVr
.max (11)
Where Vmax = immEpimm Q ,.. (12)
Where Vmax = Maximum reaction rate (mol m-3s-1), CA = Substrate concentration on diffusion stream(mol/m3), km = Michaelis-Menten constant, rs = Reaction rate (mol/s.m2 ), imm = enzyme loading (μmol
enzyme/g support), immEQ , = immobilized enzyme specific gravity (μmol enzyme)-1p = Particle density
(gram/unit volume of support).

Journal of Agricultural Engineering and Technology (JAET), Volume 20 (No. 1) June, 2012
Nigerian Institution of Agricultural Engineers © www.niae.net 38
Rearranging equation (10), the differential equation becomes:
0)(
22
2
e
AAA
Dk
r
dr
dC
rdr
Cd(13)
Taking the boundary equations;
At the centre of the pellet; 0dr
dC A at r = 0
At the outer surface; CA= (CA)s at r = rs
Substituting equation (11) into equation (13)
0)(
.2 max2
2
Ame
AAA
CKDk
CV
dr
dC
rdr
Cd(14)
Equation (14) is referred to as Lane-Emden equation which can be solved analytically using MatLab,Mathematica, FEMLAB, Polymath or Matcad.
To express equation (14) in a dimensionless form:Using boundary conditions
1,1 rC A
0;0 rrd
dCA
and simplify the right hand side of equation (14)
A
A
sAek
sAA
s
A
C
C
CD
rr
rd
Cd
rrd
Cd
1
.9).()(
..
2 2
2
2
(15)
Where;
ek
ms
D
kVr
)(3max and
m
sA
k
C )(
= Thiele – type modulus (It has a physical interpretation of first order reaction), β = It measuresthe local rate of derivation from first order.
The effectiveness of the enzymes is:
surfaceernalthetheonCionconcentratwithreactionofrate
pellettheodiffusionofrate
sA int)(
int (16)
srr
A
Am
As
es
dr
dC
CK
CVr
Dkr
.
3
4)(4
max3
2
(17)
1max
.)(3
r
A
s
A
A
Am
s rd
Cd
r
C
CV
CK
r
Dk(18)

Journal of Agricultural Engineering and Technology (JAET), Volume 20 (No. 1) June, 2012
Nigerian Institution of Agricultural Engineers © www.niae.net 39
123
1
r
A
rd
Cd
(19)
Numerical solution of equation (15) by shooting method automatically gives the derivative at the externalsurface required in equation 19.
3. RESULTS AND DISCUSSION
3.1 Cells Immobilization
The immobilization was carried out by pumping the microbial culture in the shake flasks through thetubular column packed with spherical palmwood chips at an average rate of 12 ml/min for 24 hrs. Theextent of retention of the cells were measured using optical density readings of the effluent, taken atbihourly intervals and decline stopped after 20th hours. The result obtained is plotted as shown in Fig 1. Itwas observed, that the optical density decreased with time indicating a decrease in cell population of thebroth. Nyam (2002), Ogundayo and Bello (1993) reported the same trend while using an average flowrate of 5ml/min.
From the 20th hours, however, there was stability of immobilization. There was no further decrease in theoptical density reading till the end of the immobilization period. This indicates that the immobilizationwas stable. Also, the result indicates that at higher flow rate more time will be required to attainedstability. For stability to be attained, enough cells must have been absorbed on the palmwood chips andacclimatized such that no net absorption of cells was feasible. The degree of immobilization was found tobe 89% after 20 hours.
Fig 1: Cell Absorbance curve
3.2 Ethanol Production in Immobilized Tubular Reactor
The fresh feed was pumped at the rate of 5 ml/min using a variable speed Masterflex pump model 77200-50 in an up flow manner, while sugar and ethanol concentration was monitored during the course of thefermentation. The working volume of the tubular flow reactor after random packing was 1.79 dm3. Thetotal chips volume was 1.26 dm3. There was no evidence of leakage from the connectors, the matrix of thechip is permeable to substrate and product, ethanol and glucose were monitored in the output samplecollected. Glucose concentration of 30 g/lit was used for the research work and the results are shown inFig. 2 and Fig. 3.
00.20.40.60.8
11.21.41.6
0 10 20 30
Abs
orba
nce
time(hr)
abs

Journal of Agricultural Engineering and Technology (JAET), Volume 20 (No. 1) June, 2012
Nigerian Institution of Agricultural Engineers © www.niae.net 40
Fig 2: Concentration of substrate with time Fig 3: Concentration of Ethanol with time
Fig 2 shows that the concentration of the substrate (glucose) decreases with time from 30 g/lit to 11.2 g/litafter 24 hrs. There was a sharp reduction in glucose concentration after 6 hrs. This might be attributed tohigh enzyme activity as the substrate diffuses through the pores of the chips. The maximum rate ofreaction using Monod kinetic was 2.47 g lit-1 hr-1. Fig 3 shows ethanol production rate with a sigmoidalshape. The result shows a steady rise in ethanol concentration with time. After 8 hrs, there was a sharprise in ethanol production from 0.4 g/lit to 5.8 g/lit. This might be attributed to external diffusionallimitations as well as the flow rate of the substrate, which tend to increase the enzyme activities. Theenzyme activity tends to decrease as the concentration of ethanol increases from 5.8 g/lit to 6.2 g/lit. After20th hrs, there was a slight increase in ethanol production which indicates the enzyme is still active insidethe spherical chips.
Fig. 4 shows a lineweaver-Burk plot which shows the reciprocal reaction rate versus the reciprocalconcentration of substrate. The maximum reaction rate obtained using COMSOL Reaction Lab was 45.4g lit-1 h-1 with correlation coefficient of 0.99 at 95 % confidence level and standard deviation of 0.3799.
Fig 4 and 5 shows the rate of increase in mass of a single immobilized spherical chip as substratepercolate through it. There was a minimal increase in mass from 0 hr to 6 hrs, as the substrate is pumpcontinuously in an upward direction through a tubular pipe (Fig 5). This is attributed to low enzymeactivity and shock.
As the activities increases, there was a sharp increase in mass of the chip after 6 hrs as the substrate iscontinuously pumped. This is attributed to high consumption rate of substrate coupled with an increase incell division of S. cerevisiae. Although there was slight decrease in mass after 12 hrs of pumping and thismay be as a result of high ethanol concentration inside the chip and diffusional resistance of the chip.
Fig 4: Lineweaver-Burk plot Fig 5: Growth curve with respect to mass
05
101520253035
0 20 40
conc
entr
atio
n of
glu
cose
(g/l
it)
Time (hr)
cs
0
1
2
3
4
5
6
7
8
0 10 20 30
Conc
entr
atio
n of
Eth
anol
(g/l
it)
Time (hr)
cp
0
0.2
0.4
0.6
0.8
1
1.2
0 0.05 0.1
1/-r
A
1/Cs
1/-rA
Linear(1/-rA)
2.34
2.36
2.38
2.4
2.42
2.44
2.46
2.48
2.5
0 10 20 30
mas
s (g
)
Time (hr)
m

Journal of Agricultural Engineering and Technology (JAET), Volume 20 (No. 1) June, 2012
Nigerian Institution of Agricultural Engineers © www.niae.net 41
Radius (m)Fig 6: simulated plot of concentration against radius
3.3 Simulation
Wolfram Mathematica version 6.0.1.0 by Wolfram Research, Inc., was used to solve the model equation(differential equation) analytically using Shooting Method. The shooting method works by consideringthe boundary conditions as a multivariate function of initial conditions at some point, reducing theboundary value problem to finding the initial conditions that give a root. Fig 6 indicates that substrateconcentration decrease as it diffuses through the spherical palm chip from the outer surface of 1 cm radiusto the centre core.
4. CONCLUSION
Continuous ethanol production in a tubular reactor at a constant flow rate of 12 ml/min was successfullydone with high glucose concentration of 30 g/lit. Fermentation process shows little or no inhibition hencehigh yield of ethanol (36%). The results obtained indicate that the immobilization of S. cerevisiaepossesses the capacity to utilize high glucose concentration resulting to high ethanol yield. Fermentationusing a spherical palmwood chips shows a diffusionally controlled process. Immobilization technologycan be used to produce bio-fuel especially ethanol at a low cost with a high yield and productivity.
REFERENCES
Alan, W. 1985. Hand Book of Enzymes Biotechnology, Ellis Horwood Ltd, Chichester Halsted Press, 2nd
Edition, Division of John Wiley and Sons, New York. Pp 72 – 201.Akpan, U. G.; Kovo, A. S.; Abdullahi, M. and Ijah, U. J. J. Production of Ethanol from Maize Cobs and
Groundnut Shell. AU J. T. 9(2): 106-110. (2005).Bailey, J. E and Ollis, D. F., 1990. Biochemical Engineering Fundamentals. McGraw Hill inc., New
York. Chp 3, 4 and 8.Demirbas, A. 2009. Political, Economic and Environmental Impacts of Biofuels: A Review. Applied
Energy, 86: S108 – S117.Ghasen, D. N. 2007: Biochemical Engineering and biotechnology. 1st Edition, Elsevier B. V., UK. Pp. 10
– 120.Henry, C. V. and Celeste L. T., 1997. Fermentation and Biochemical Engineering Hand Book: Principles,
Process Design and Equipment. 2nd Edition, Noyes Publications, Westwood New Jersey. Pp 59.Fogler, H. S 2004. Element of Chemical Reaction Engineering. 3rd Edition, Prentice- Hall of India, New
Delhi. Pp. 383 – 406.James, M. L. 2009. Biochemical Engineering e-Book Version 2.32. Washington State University,
Pullman W A 99164 – 2710, Prentice- Hall Inc. Chp. 2.1 – 2.46.Octave, L 1999. Chemical Reaction Engineering. 3rd Edition, John Wiley and Sons, New York. Pp. 611 –
619.
0.002 0.004 0.006 0.008 0.010
29.9994
29.9996
29.9998
30.0000
Con g/dm3

Journal of Agricultural Engineering and Technology (JAET), Volume 20 (No. 1) June, 2012
Nigerian Institution of Agricultural Engineers © www.niae.net 42
Ogunbayo, A. O. and Bello. R. A. 1986. Immobilisation of Lactase on Palmwood Chips for LactoseHydrolysis. J N S h E. Vol. 5. No 2 pp. 1 – 5.
Walker G. M. 2010. Bioethanol. Science and Technology of Fuel Alcohol. M. Walker and VentusPublishing, UK. Pp. 31 – 79.
Wolfram Mathematica 6 Software, Version 6. 0.1.0 (1988 – 2007), Wolfram Research, Inc.

Journal of Agricultural Engineering and Technology (JAET), Volume 20 (No. 1) June, 2012
Nigerian Institution of Agricultural Engineers © www.niae.net 43
OSMOTIC DEHYDRATION PRETREATMENT FOR QUALITYIMPROVEMENT IN DRIED NIGERIAN TOMATO
K. F. Jaiyeoba1 and A. O. Raji2
1Department of Agricultural Science,Osun State College of Education, Ilesha, Nigeria.
2Department of Agricultural and Environmental Engineering,University of Ibadan, Ibadan, Nigeria.E-mail: [email protected]
ABSTRACT
Tomato (Lycoperscium esculentum) plays a very vital role in daily dietary intake because of its highnutritional values but its production is seasonal and geographical. They are usually in short supply duringthe dry season and preserving them in the fresh state for months has been a problem yet to be solved.There is no information yet on the drying of the indigenous varieties of Tomato in Nigeria despite theirhigher nutritional value. This study therefore investigated the optimum pretreatment conditions necessaryfor quality improvement with a view to improving their acceptance. Mechanism of mass transferphenomena of three major varieties available in south-western Nigeria market i.e. Roma-VF, wildcultivar (Koledowo) and the indigenous variety, Ibadan-Local tomato varieties pre-treated in a binary(sugar and salt) osmotic solution of different solution concentrations (45/15,40/20,50/10), temperature(30,40,50oC), time (30,60,90,120,180 min) and fruit to solution ratio of 1:10 were studied to describe theWater Loss (WL) and Solid Gains (SG). Results show a considerable water loss in the least accepted localvariety with a very minimal solid gain. This implies retention of quality and improvement on the waterypaste normally obtained in the unprocessed fruit. This, therefore indicates a promising approach toimproving the quality of the local variety to an acceptable level that will make the fruits popular.
KEYWORDS: Pretreatment, water loss, solid gain, tomato, dehydration, vegetable, fruit.
1. INTRODUCTION
Vegetables and fruits are important aspect of the diet throughout the world because of their nutritionalvalue (Ngoddy and Koronye, 1985). Tomato is a commercially important vegetable throughout the worldboth for the fresh-fruit market and the processed food industries (Artherton and Rudich, 1986). Indeveloping countries, they are usually in short supply during the dry season because they are perishablecrops which deteriorate within a few days after harvest (which occur mainly in the rainy season).Preserving these crops in the fresh state for months has been a problem that is yet to be solved (Tunde-Akintunde et al., 2003). However, in Nigeria dry season tomato like some other vegetables such aspepper, onions and green leaves are grown predominantly in the Northern part under irrigation due toecological factors.
There are several tomato cultivars grown in Nigeria, but their availability is sometimes restricted tocertain regions of the country. The three most commonly available cultivars in the Southwestern Nigeriamarkets are: Ibadan-Local, Roma-VF and Ife-1 (Koledowo) (Akanbi and Oludemi 2003). Ibadan-Local isa variety with higher fruit yield and longer fruiting tendency has received little or no significant attentionbecause of low production by the few peasant farmers in the region where it thrives hence the higherpreference of other cultivars to it.
Due to the high percentage of moisture content (70 - 90% wet basis), horticultural produce (fruit andvegetables) are noted to be liable to rapid deterioration in the developing countries resulting in heavylosses during handling and storage after harvest (Aworh and Olorunda, 1988, Erinle and Karikari, 1988,Oyeniran, 1988; NSPRI 1991; Singh and Singh, 1992). Drying is the most common form and animportant unit operation (Ojediran and Raji, 2010) for preparing food for preservation and it extends the

Journal of Agricultural Engineering and Technology (JAET), Volume 20 (No. 1) June, 2012
Nigerian Institution of Agricultural Engineers © www.niae.net 44
shelf-life of food. It brings about substantial reduction in weight and volume, minimizing packaging,storage and transportation costs (Okos et al., 1992, Doymaz, 2007; Zielinska and Markowski, 2010).Traditionally, tomatoes are dried in the open air and exposed to the sunlight which usually takes timedepending on the variety of tomato, the humidity in the air during the drying process, the thickness of theslices or pieces, and the efficiency of the dehydrator Pre-treatments which include alkaline dips,sulphiting, osmotic dehydration, etc have been used before drying with a view to improving the dryingcharacteristics and minimize adverse changes during drying. However the use of pretreatments whichexcludes chemical may have greater potential in food processing (Ade-Omowaye et al., 2003, (Jalali et al,2008). Osmotic Dehydration is useful as a pre-processing step prior to drying and freezing of foodsincluding fruit and vegetables, meat and seafood products (Lerici et al, 1985; Quintero-Ramos et al, 1993;Collignan and Raoult-Wack, 1994, Beaudry 2001, Segu et al., 2006). It is a pretreatment method which iscapable of reducing the moisture content of foods by 50% through a combination of osmosis, diffusion,flux interactions and shrinkage yielding dehydration (Ozen et al., 2002). It involves water outflow fromthe product to the solution, solute transfer from the solution to the product and leaching out of productsolutes to the solution.
Ibadan-local variety has lesser acceptability among tomato consumers majorly because of its less-red-color, high acid and water content and low percentage of solids making a watery paste or stew when usedin cooking. The challenge is to see to acceptability of this local variety through the adoption of a dryingmethod that will best suit the preservation of all the properties that are of importance to consumers in thisvariety (Ibadan-local) to produce an acceptable product on re-hydration. This is in line with theobservation of Garcia-Martinez et al. (2006) that the growing search for products is stimulating the foodindustry to look for new food preservation techniques.
This study therefore investigated osmotic dehydration as a pretreatment condition for three varieties oftomatoes. This is with a view to identifying the best pretreatment condition and drying method(s) that willbest preserve the qualities of the osmosized fruit.
2. MATERIALS AND METHODS
2.1 Osmotic Dehydration of Samples
The three tomato varieties were sorted for visual colour, size and physical damage. Osmotic solutionswere prepared by mixing a blend of 40g/20g, 45g/15g and 50g/10g of sucrose/Nacl with 100ml ofdistilled water to obtain a brix of 60 i.e. (60g of solute in 100g of distilled water.
Tomato samples (16g each) were placed in 250mL beakers, containing 160g of osmotic solution. Theexcess osmotic solution (fruit to solution ratio of 1:10) was used to limit concentration changes due touptake of water from the tomato and loss of solute to the fruit. The samples were then immersed in awater bath continuously stirred to maintain a uniform temperature not more than ±10C for the threetemperature levels 30, 40 and 50oC. Samples were removed from the osmotic solution at 0.5, 1.0, 1.5, 2.0and 3.0h of immersion, drained and the excess of solution at the surface was removed with absorbentpaper to eliminate posterior weight) and weighed using a top loading sensitive electronic balance(Mettler, P163). The water loss and solid gain were determined by gravimetric measurement. Alldeterminations were conducted in triplicate.
The solid gain represents the amount of solid that diffuses from the osmotic solution into the Tomato lessthe solid of the tomato that is lost to the solution. The values of water loss (WL) and solid gain (SG) havebeen presented by Mujica-Paz et. al., 2003 and modified by Agarry et al., 2008 as;
Mo
mtMtmoMoWL
…………………………… (1)
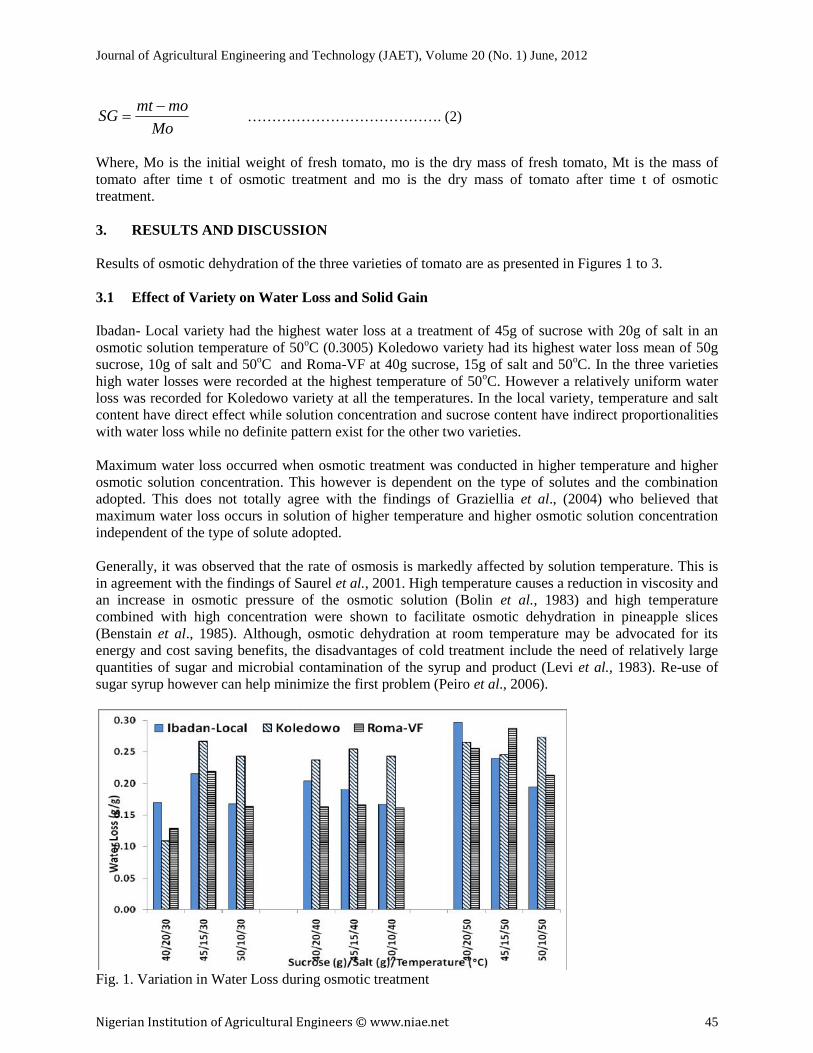
Journal of Agricultural Engineering and Technology (JAET), Volume 20 (No. 1) June, 2012
Nigerian Institution of Agricultural Engineers © www.niae.net 45
Mo
momtSG
…………………………………. (2)
Where, Mo is the initial weight of fresh tomato, mo is the dry mass of fresh tomato, Mt is the mass oftomato after time t of osmotic treatment and mo is the dry mass of tomato after time t of osmotictreatment.
3. RESULTS AND DISCUSSION
Results of osmotic dehydration of the three varieties of tomato are as presented in Figures 1 to 3.
3.1 Effect of Variety on Water Loss and Solid Gain
Ibadan- Local variety had the highest water loss at a treatment of 45g of sucrose with 20g of salt in anosmotic solution temperature of 50oC (0.3005) Koledowo variety had its highest water loss mean of 50gsucrose, 10g of salt and 50oC and Roma-VF at 40g sucrose, 15g of salt and 50oC. In the three varietieshigh water losses were recorded at the highest temperature of 50oC. However a relatively uniform waterloss was recorded for Koledowo variety at all the temperatures. In the local variety, temperature and saltcontent have direct effect while solution concentration and sucrose content have indirect proportionalitieswith water loss while no definite pattern exist for the other two varieties.
Maximum water loss occurred when osmotic treatment was conducted in higher temperature and higherosmotic solution concentration. This however is dependent on the type of solutes and the combinationadopted. This does not totally agree with the findings of Graziellia et al., (2004) who believed thatmaximum water loss occurs in solution of higher temperature and higher osmotic solution concentrationindependent of the type of solute adopted.
Generally, it was observed that the rate of osmosis is markedly affected by solution temperature. This isin agreement with the findings of Saurel et al., 2001. High temperature causes a reduction in viscosity andan increase in osmotic pressure of the osmotic solution (Bolin et al., 1983) and high temperaturecombined with high concentration were shown to facilitate osmotic dehydration in pineapple slices(Benstain et al., 1985). Although, osmotic dehydration at room temperature may be advocated for itsenergy and cost saving benefits, the disadvantages of cold treatment include the need of relatively largequantities of sugar and microbial contamination of the syrup and product (Levi et al., 1983). Re-use ofsugar syrup however can help minimize the first problem (Peiro et al., 2006).
Fig. 1. Variation in Water Loss during osmotic treatment

Journal of Agricultural Engineering and Technology (JAET), Volume 20 (No. 1) June, 2012
Nigerian Institution of Agricultural Engineers © www.niae.net 46
Solid gain was positively influenced in the wild (Koledowo) variety under all the conditions as presentedin Fig. 2. A negative effect under some treatments was noticed for both the Roma-VF and Ibadan-Localvarieties. However at the highest temperature investigated the solid gain improved for Roma-VF andIbadan Local. Although, the local variety lost some solids at this temperature but it gained solid at40/20/50. This behaviour indicates that Ibadan-Local variety relatively retains its original content in termsof solid content at nearly all the temperatures but lost water heavily. This can be explained form the veryhigh water content it has. Retention of its original content is an advantage as the pretreatment removal ofwater and retention of quality will ensure acceptance. Generally, there are no definite trends across thevarieties on the effect of solutes and temperature.
Fig. 2. Variation in Solid Gain during osmotic treatment
It can be seen that an increase in the quantity of salt used in the solution increases water loss as valuesrecorded favoured 20g of salt more than the combination with 10g. This is in agreement with the resultobtained by other researchers that addition of Nacl salt to osmotic solution increases the driving force fordrying and a synergistic effect between sugar and salt can also be observed. Lenart and Flink (1984) alsoagreed that the presence of salt in sucrose salt solution hindered the formation of a sucrose concentrationsurface layer on potato samples and improved the rates of water loss and solid gain. The effects becamemore visible when the time and temperature were increased i.e. higher water loss was recorded at highertemperature solution concentration. This agrees totally with the findings of Matusek and Merez (2000).
It can be observed from the result that solid gain depends on the concentration of the solute (Sugar andsalt proportion), the temperature of the osmotic solution and also the drying temperature – varietaldifference also favoured/affected the solid gain. Solid gain on the other hand was seen to be influenced bythe interaction of the temperature and concentration of the osmotic solution and this agrees with thefindings of Falade and Igbeka (2007). While solute transfer is assumed to be diffusion type the fact thatwater loss is greater than solid gain is attributed to an osmotic transport phenomenon across the semi-permeable cellular membranes.
This study has shown that a condition of 40/20/50 gives a considerable water loss and solid gain forIbadan Local which has a definite trend, as discussed, under pretreatment. Osmotic pretreatment is knownto lead to retention of appearance quality such as colour.
As presented in Figure 3, the samples were dried at the end of pretreatment with a view to obtaining thefinal moisture content. It was observed that in all the conditions the moisture content was reduced tobelow 12% from 96.5%, 95% and 96% while it went below 11% at the highest temperature of 50oC.This shows that further drying to the level for preservation will require little energy. The expected

Journal of Agricultural Engineering and Technology (JAET), Volume 20 (No. 1) June, 2012
Nigerian Institution of Agricultural Engineers © www.niae.net 47
retention of appearance quality and fast drying as well as the addition of salt which is meant to reduce thesour taste in Ibadan-Local are added advantages of the pretreatment method.
Fig. 3. Variation in Moisture Content during osmotic treatment
4. CONCLUSIONS
It can be concluded that Local variety responded favourably to all treatments after drying at 50oC and wascomparable to the other varieties of interest to consumers (Karathams et al., 1995). It is also noted that thelocal variety having lost enough moisture will reduce the watery paste it makes when used in makingstews. The study established that Ternary sucrose/Nacl solutions are suitable to dehydrate tomato fruitirrespective of the variety. Variety played an important role in determining the concentration and time ofprocess. This study will investigate further on improving the production and keeping quality of theIbadan-Local variety under the optimum pretreatment condition. Cost implication of pretreating the localvariety should be worked on by future researchers with a view to seeing to its cost effectiveness. Thesestudies will increase its acceptability and subsequently its marketability.
REFERENCES
Ade-Omowaye, B.I., O .P. Talens, A. Angerbuch and D. Tnorr 2003. Kinetics of Osmotic Dehydration ofRed Bell Pepper, an influence by pulse Electric Field Pre-Treatment. Food Research International 36:475-482.
Agarry, S.E, R.O. Yusuf and Owabor, C.N. 2008. Mass transfer in Osmotic Dehydration of Potato: Amathematical model approach. Journal of Engineering and Applied Sciences. 3(2). 190-198
Akanbi, C.T. and F.O. Oludemi 2003. Effect of processing and packaging on the lycopene content oftomato products International. Journal.of Food Production. 7:139-151.
Atherton, J.G. and J. Rudith 1986. The Tomato Crop. Chap man and Hall, London U.K.Aworh, O.C. and A.O. Olorunda 1988. Packaging and storage technology of fresh fruits and vegetables
with specific reference of tropical conditions. Proceedings of the National Workshops on “improvedpackaging and storage systems for fruits and vegetable in Nigeria” Ilorin.
Beaudry, C. 2001. Evaluation of drying methods on osmotically ehydrated cranberries. UnpublishedM.Sc. Thesis. Montreal,s QC: Department of Agricultural and Biosystems Engineering, McGillUniversity, Canada.

Journal of Agricultural Engineering and Technology (JAET), Volume 20 (No. 1) June, 2012
Nigerian Institution of Agricultural Engineers © www.niae.net 48
THE BLEACHING PERFORMANCE OF LIMESTONE AND SELECTED CLAYSOF AKWA IBOM STATE ORIGIN OF NIGERIA ON RED PALM OIL
U. N. Onwuka1 and I. A. Okon2
1Departmment of Agricultural and Bio-Resources Engineering,Michael Okpara University of Agriculture, Umudike, Nigeria.
[email protected] of Food Science and Technology,University of Uyo, Akwa Ibom State, Nigeria.
ABSTRACT
Composite adsorbent powders of various clays/limestone ratios in Uyo, Akwa Ibom state of Nigeria wereproduced and chemically activated with 5% tetraoxosulphate VI. The performance of the compositesadsorbent expressed as percentage bleaching action and free fatty acid (FFA) removal from red palm oilwas assessed and compared with that of imported fulmont bleaching earth. This work was conducted inUyo with the objective of reducing importation of fulmont bleaching earth by acid activated clays ofNigerian origin. Results obtained from U.V. Spectrophotometer absorbance techniques and titrationshows that adsorbents containing 20-50% clays (50-80% limestone) produced about 24.4 and 14.6%colour removal and 67% and 65% free fatty acid removal respectively at the bleaching temperature of100oC. This performance compared favourably well with commercial fuller's earth which produced about24.6 and 68% colour and free fatty acid removal respectively at the same bleaching temperature of 100oC.However, these results are better than those obtained from adsorbents containing 80-100% clays (0-20%limestone) which gave about 10.6 and 9.0% colour removal, 57 and 56% free fatty acid removalrespectively at the bleaching temperature of 100oC. The optimal performance of the composite adsorbentpowder studied was obtained from clays/limestone mixtures containing 50% clays at a bleachingtemperature of 100oC. The oil obtained by bleaching with this composite adsorbent was of the samequality with that bleached with fuller's earth (sample F). The statistical analysis obtained also conform tothis, as there was no significant difference between sample F (fuller's earth) and sample A (50:50clays/limestone) in all the tested parameters.
KEYWORDS: Bleaching, clay, composite-adsorbent, limestone, palm oil.
1. INTRODUCTION
Oils in their raw form contain impurities such as organic pigments, oxidation metals; trace metals andtraces of soaps (Camp and Harvey, 1994). For oils to be used effectively in most industrial processes,these impurities in them have to be extensively removed (Cornelius, 1983). The refining of these oilsespecially palm oil, through adsorptive bleaching, remains inevitable in the oil refining industry (Young,1981). Odoemelam, (1998) noted that the refining of red palm oil enhances the quality of the oil as edibleoil and also stabilizes by transforming the oil into a more durable product.
Bleaching process is a crucial step in the refining of palm oil. This is because it does not only remove thecoloured compounds and impurities but also influence the stability of the products (Okwara and Osoka2006). Ejike, (2002) reported three types of bleaching methods used in oil industry, namely: Heatbleaching which involves heating the oil at temperature above 1800C in the absence of oxygen; oxidativebleaching which involves oxidative reaction to discolour some pigments and adsorptive bleaching whichuses activated earth or clay (Okon, 2009). “Bleaching” process is always being misunderstood as just amere process of decolorisation of oils and fats. Bleaching is a process of selective removal of pigmentsand impurities by the physical and chemical (chemisorptions) interaction of an adsorbent with an oil or fatto improve its quality (Odumosu, 1985). This process refers to the art of removing not only the colourpigments but also dirt, trace metals and various organic impurities that promote oxidation (Mohd-Suria,2008). Another term that can be used to describe bleaching process is purification process of vegetable
Journal of Agricultural Engineering and Technology (JAET), Volume 20 (No. 1) June, 2012
Nigerian Institution of Agricultural Engineers © www.niae.net 49
oils (Cornelius, 1983). Effective adsorption requires a large surface and practically high specific surfacearea (m2/g) of a very porous absorbent (Bek-Nielson, 1976).
The channels by which molecules react to this surface must be negotiable by the molecules concerned.The nature of the process must allow acceptable firm bonds, chemical or physical, between it and theadsorbate (Pritchard, 1975). Therefore, in order to have maximum attainment of bleaching performancean efficient bleaching earth is produced which have surfaces of the correct chemical composition and poredistribution selectively attractive to the detrimental components present in crude triglyceride oils (Mohd-Suria, 2008).
Oils and fats are bleached in order to remove undesired colorants which can negatively affect the taste ofthe oil and in part because the colour would disturb the consumers, therefore on the whole, these colorantslimit use and marketability (Mohd- Suria, 2008). He also noted that, some particles or pigments thatpromote deterioration to oil quality is also being removed during bleaching process mainly due to theirpro-oxidative properties that promotes oxidation. During bleaching or purification, the oil is brought intocontact with a surface active adsorbent and then the undesired particles or other components areselectively retained on the pore surface and triglycerides escape (Oboh, 1989). Gradually, theconcentration of undesired particles on the available surface-active of the adsorbent and the concentrationremaining in the oil come into balance, so further exchange is negligible (Pritchard, 1975). Besttemperature for oil/absorbent (clay) must be chosen, as well as duration of contact because an excess ofeither factor will impart undesirable side effects to the process (Cornelius, 1983). In order to haveefficient use of adsorbent, any material like gum or soap should be removed at earlier stage (degumming)as the presence of these particles will compete for room on the adsorbent surface. That explains why aneffective degumming process is required in refining process of vegetable oils (Mohd- Suria, 2008).Theoretically, according to Oboh, (1989) coloured particles (or substances) that should be removedduring bleaching are present in the oil either in dissolved or in a colloidal form. For both types, theprocess reaction happens at the surface of bleaching agent.
The widely used bleaching earth in Nigeria is the fuller’s earth which is imported into the country. Asidefrom the high cost of importation of the fuller’s earth, Swoboda (1985) reported that the changes in thechemical composition of pre-bleached oils have a hampering effect on the bleaching capacities ofcommercial fuller’s earth. However, Nigeria is widely blessed with numerous clay mineral deposits,whose potentials for the production of bleaching earth has not been fully exploited (Okwara and Osoka,2006, Oboh, 1989 and Odoemelam, 1998). Sowemimo, (1989) and Njiribeako and Nwanya (2000)reported that a limestone/clay mixture at low and high activation temperatures (thermal activation)respectively resulted in an increased performance of the adsorbent capacities. However, there is paucity ofinformation or no reports on the performance of acid activated adsorbent composites of these mixtures.
This work seeks to investigate the bleaching performance of acid activated composite adsorbent systemderived from limestone and selected clays of Akwa Ibom State origin on colour and Free Fatty Acid(FFA) removal when used to bleach red palm oil.
2. MATERIALS AND METHODS
2.1 Source of Raw Materials
Red palm oil was obtained from Nigerian Institute for Oil Palm Research (NIFOR) Sub-Station, Abak,Akwa Ibom state; Limestone was obtained from United Cement Company (Unicem) Calabar, Cross RiverState and clays were obtained in Uruan Local Government area of Akwa Ibom State.
2.2 Preparation of the Composite Absorbents
The characterized clay and limestone samples were weighed and mixed by the ratios indicated in Table.1
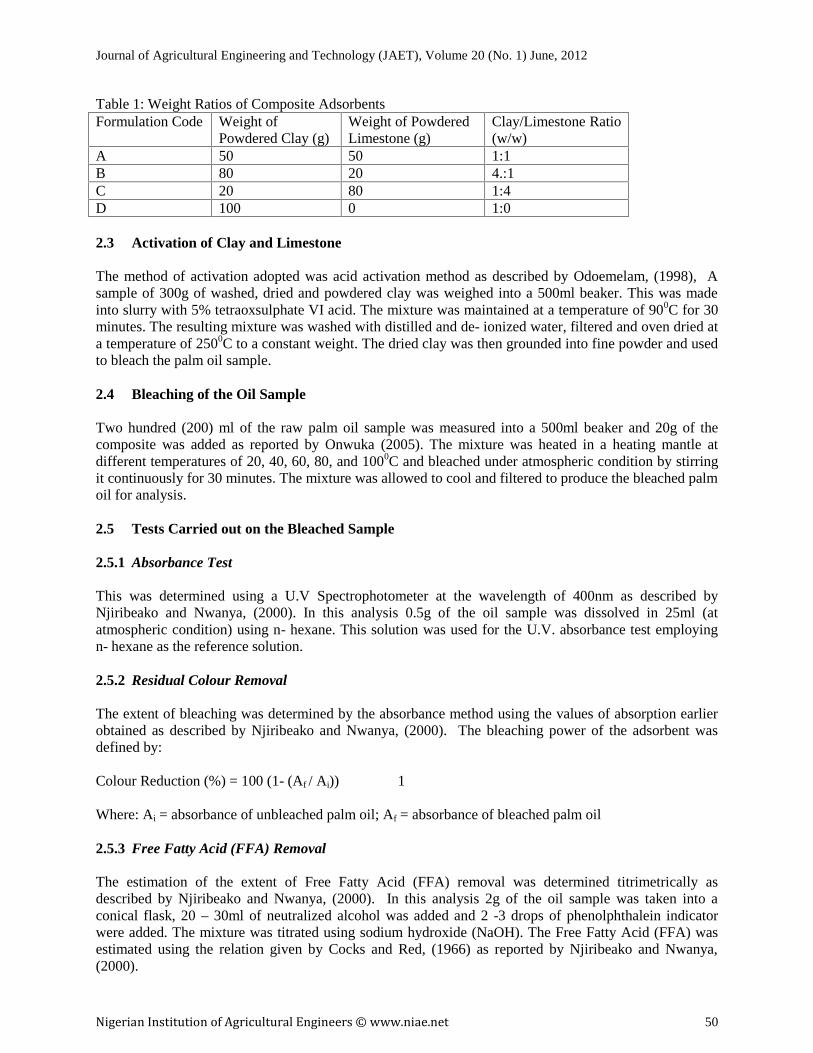
Journal of Agricultural Engineering and Technology (JAET), Volume 20 (No. 1) June, 2012
Nigerian Institution of Agricultural Engineers © www.niae.net 50
Table 1: Weight Ratios of Composite AdsorbentsFormulation Code Weight of
Powdered Clay (g)Weight of PowderedLimestone (g)
Clay/Limestone Ratio(w/w)
A 50 50 1:1B 80 20 4.:1C 20 80 1:4D 100 0 1:0
2.3 Activation of Clay and Limestone
The method of activation adopted was acid activation method as described by Odoemelam, (1998), Asample of 300g of washed, dried and powdered clay was weighed into a 500ml beaker. This was madeinto slurry with 5% tetraoxsulphate VI acid. The mixture was maintained at a temperature of 900C for 30minutes. The resulting mixture was washed with distilled and de- ionized water, filtered and oven dried ata temperature of 2500C to a constant weight. The dried clay was then grounded into fine powder and usedto bleach the palm oil sample.
2.4 Bleaching of the Oil Sample
Two hundred (200) ml of the raw palm oil sample was measured into a 500ml beaker and 20g of thecomposite was added as reported by Onwuka (2005). The mixture was heated in a heating mantle atdifferent temperatures of 20, 40, 60, 80, and 1000C and bleached under atmospheric condition by stirringit continuously for 30 minutes. The mixture was allowed to cool and filtered to produce the bleached palmoil for analysis.
2.5 Tests Carried out on the Bleached Sample
2.5.1 Absorbance Test
This was determined using a U.V Spectrophotometer at the wavelength of 400nm as described byNjiribeako and Nwanya, (2000). In this analysis 0.5g of the oil sample was dissolved in 25ml (atatmospheric condition) using n- hexane. This solution was used for the U.V. absorbance test employingn- hexane as the reference solution.
2.5.2 Residual Colour Removal
The extent of bleaching was determined by the absorbance method using the values of absorption earlierobtained as described by Njiribeako and Nwanya, (2000). The bleaching power of the adsorbent wasdefined by:
Colour Reduction (%) = 100 (1- (Af / Ai)) 1
Where: Ai = absorbance of unbleached palm oil; Af = absorbance of bleached palm oil
2.5.3 Free Fatty Acid (FFA) Removal
The estimation of the extent of Free Fatty Acid (FFA) removal was determined titrimetrically asdescribed by Njiribeako and Nwanya, (2000). In this analysis 2g of the oil sample was taken into aconical flask, 20 – 30ml of neutralized alcohol was added and 2 -3 drops of phenolphthalein indicatorwere added. The mixture was titrated using sodium hydroxide (NaOH). The Free Fatty Acid (FFA) wasestimated using the relation given by Cocks and Red, (1966) as reported by Njiribeako and Nwanya,(2000).

Journal of Agricultural Engineering and Technology (JAET), Volume 20 (No. 1) June, 2012
Nigerian Institution of Agricultural Engineers © www.niae.net 51
% FFA content = ( . 28. 02 )/ 2
Where: T.D = Titre Difference; N = Normality of NaOH used; Wt = weight of the sample;28.02=constant.
The FFA removal was then defined by the expression:
% FFA Removal = 100 (1 – ( / )) 3
Where: FFAi = FFA of palm oil before bleaching; FFAf = FFA of palm oil after bleaching.
3. RESULTS AND DISCUSSION
The raw palm oil used in this study has a free fatty acid content of 3.72% and absorbance value of 2.245.The results obtained from the analysis of the bleached palm oil sample are presented in Table.2. Theseresult obtained herein is consistent with that earlier reported by Njiribeako and Nwanya, (2000) where thebleaching power increased with increase in bleaching temperature.
Table 2. Physicochemical properties of oils given different treatmentsPhysicochemicalcomposition
Sample F Sample A Sample B Sample C Sample D
Absorbance Value (%) 1.45a 1.45a 1.36+bc 1.37b 1.34bc
% Colour Removal (%) 20.38a 20.16a 11.56bc 12.34b 9.02bc
Titratable FFA Content (%) 3.36a 3.34a 3.29ab 3.29ab 3.26b
% Free Fatty AcidsRemoval (%)
64.00a 62.20a 57.40ab 56.80ab 54.20b
a,b,c, - values in the same row with different superscripts are significantly different and those with thesame superscripts are not significantly different at 5% level of significance.
KeySample F - Fuller's earth bleached oilSample A - 1:1 composite of clays/limestone bleached oilSample B - 4:1 composite of clays/limestone bleached oilSample C - 1:4 composite of clays/limestone bleached oilSample D - 1:0 composite of clays/limestone bleached oil
3.1 The Bleaching Performance of Clay/Limestone Ratio
The effect of composition on the degree of bleaching for the activation of clay/limestone mixture at 5%tetraoxosulphate VI acid is shown in Figure 1. It could be observed that bleaching efficacy increased withmass fraction of clay up to a maximum at 50% and then declined, recording its lowest at 100% clay.Thus, it is established that the maximum performance is obtained with composite adsorbent containing1:1 clay/limestone. This is in agreement with that earlier reported by Njiribeako and Nwanya, (2000)though using thermal activation in their own case.

Journal of Agricultural Engineering and Technology (JAET), Volume 20 (No. 1) June, 2012
Nigerian Institution of Agricultural Engineers © www.niae.net 52
Bleaching is the removal of colour pigments; so, the bleaching performance was evaluated in terms ofpercentage of carotenoids removed from the oil sample after bleaching as shown in Figure2 which is agraph of percentage colour reduction against bleaching temperature. This graph explained the effect ofbleaching temperature on percentage colour removal by each of the composites and comparing same withfuller’s earth (sample F). From Figure 2, it is observed that each of the composite absorbents and fuller’searth had it maximum performance at 1000C of bleaching temperature except composites B and D whichhad theirs at 60 and 800C respectively. This lower temperature performance of sample B and D may be asa result of decrease in surface area associated with the collapse of the pore structure of the clay at hightemperature, since the percentage of clay in the two simples (B and D) was more than limestone. From thegraph it is observed that composite A competed favourably with sample F (fuller earth) and statisticallyfrom Table 2 it is also shown that there was no significant different (at 5% level) between these twosamples in terms of percentage colour removal.
0
5
10
15
20
25
30
100 80 20 50
% C
olou
r Re
mov
al
Fig.1 Graph of % Colour Reduction Vs Fraction of Clay inAdsorbent
100,oC bleachg temp,
80,oC bleachg temp
60,oC bleachg temp.
40 oC bleachg temp.
20 oC bleachg temp
Fraction of Clay in Adsorbent(%)
0
5
10
15
20
25
30
20 40 60 80 100
% C
olou
r Re
duct
ion
Fig 2 Graph of % Colour Reduction Vs BleachingTemperature
Sample D
Sample C
Sample B
Sample A
Sample F

Journal of Agricultural Engineering and Technology (JAET), Volume 20 (No. 1) June, 2012
Nigerian Institution of Agricultural Engineers © www.niae.net 53
The free fatty acid removal as a function of bleaching temperature is illustrated in Figure 3. From thisfigure, it could be observed that free fatty acid removal by composite adsorbent powders is facilitated byincrease in bleaching temperature and equal ratio of clay / limestone in the adsorbent. However, thisfinding disagreed with that earlier reported by Njiribeako and Nwanya, (2000) where the free fatty acidremoval by composite adsorbents powder was said to be facilitated by high limestone ratio in adsorbent.All the same, composite A, C and sample F (Fuller’s earth) all had their best performance at bleachingtemperature of 1000C while B and D both had at 800C. Statistically, the result obtained from Table 2indicates that the percentage free fatty acid removal of sample F and A where the same, (no significantdifferent at 5% level) between these two sample and sample B and C. However, there was a significantdifferent (at 5% level) between these samples and sample D, though samples B, C and D had nosignificant different. In general, sample F and A had the best bleaching performance of 64 and 62.2%respectively in term of free fatty acids removal.
Limestone behaves more or less like a base and its FFA removal is believed according to Njiribeako andNwanya, (2000) to involve neutralization and consequent entrapment of the reaction products on thematrix of the adsorbents. Thus, adsorbent A and fuller’s earth (F) had a bleaching power at 67% and 68%respectively at the bleaching temperature of 1000C as opposed to 65, 57 and 56% for B, C and Drespectively.
4. CONCLUSION AND RECOMMENDATION
The result of tests performed showed that a composite adsorbent system for effective removal of colourand free fatty acid from palm oil has been produced from activated clay and limestone mixtures. It isobserved that higher bleaching temperatures resulted in an increased performance of different adsorbentcompositions with decreased efficiency occurring with composites adsorbent with higher clay ratios.
In conclusion, it was found that the adsorbents derived from acid activation of clay/limestone mixturewere effective and the oil produced was of comparable quality with that bleached with imported fuller’searth. The most favourable (active) of all the composite was sample A (50:50 clay/limestone) as there wasno significant difference (at 5% level) between sample A and F in all the tested parameters. These datawill be useful in design of processes and plants for palm oil bleaching.
0
10
20
30
40
50
60
70
80
20 40 60 80 100
% F
FA R
emov
al
Fig 3 Graph of FFA Removal Vs Bleaching oC
Sample F
Sample A
Sample B
Sample C
Sample D

Journal of Agricultural Engineering and Technology (JAET), Volume 20 (No. 1) June, 2012
Nigerian Institution of Agricultural Engineers © www.niae.net 54
REFERENCES
Bek-Nielson, B. 1976. Quality Preservation and Testing of Malaysian Palm Oil from Fresh Bunch to theOil Refinery. (D. A. Earp and W. Newell eds). In: “The Proceeding of the Malaysian InternationalSymposium on Palm Oil Proceeding and Marketing” Held in Kuala Lumpur. Pp. 161-443
Champ, P. C. and Harvey, R. A. 1994. Lippincott’s Illustrated Reviews; Biochemistry, 2nd Ed. LippincottRaven Publishers, New Jersey, U.S.A, Pp 150-360.
Cornelius, J. A. 1983. Proceeding of Oil Palm Fruit and its Products. Report of the Tropical ProductsInstitute, G149. 56/62 Gray’s Inn Road, London, England. Pp 42-47.
Ejike, M.C. 2002. Silica Refining of Palm Oil. PIPOC Inter-Palm Oil Congress (Chemistry andTechnology): 29-30.
Mohd-Suria, A. Y. 2008. Refining and Down Streaming Processing of Palm Oil and Palm Kernel Oils. AWorld Wide Web, Document on Palm Oil.
Njiribeako, I. A. and Nwanya, I2000. Enhancing the Adsorptive Performance of Natural BleachingEarths from Limestone / Clay Mixtures. Journal of Chemical Society of Nigeria 25 (1) 54-57.
Odoemelam, S. A. 1998. The Bleaching Of Red Palm Oil by Selected Local Clays. Journal of ChemicalSociety of Nigeria. 25 (23): 32-34.
Odumosu, O. T. 1985. Spoilage in the Oils and Fats Industry and Principles Underling Methods ofPreservation. Nigerian Institute of Food Journal 2 (2): 93-98.
Okon, I. A. 2009. Refining of Oils. Students Industrial Work Experience Scheme Report At RiversVegetable Oil Company (RIVOC) Limited Pp. 21.
Okwara, C. A. and Osoka, E. C. 2006. Caustic Activation of Local Clay for Palm Oil Bleaching. Journalof Engineering and Applied Science 1 (4): 526-529.
Onwuka G. I. 2005. Fats In: Food Analysis and Instrumentation Theory and Practice. Naphtali PrintsAba. Pp. 102-106.
Pritchard, J. L. R. 1975. Refining of Palm Oil. Oil Palm News, (2): 5-13.Swoboda, P. A. T. 1985. Chemistry of Refining. Journal of American Oil Chemist Society, 62: 287.Young, F. V. C. 1981. The Refining of Palm Oil, PORIM Bulletin No 3: 6-29.
Journal of Agricultural Engineering and Technology (JAET), Volume 20 (No. 1) June, 2012
Nigerian Institution of Agricultural Engineers © www.niae.net 55
DETERMINATION OF WATER REPELLENCY INDEX AND CONTACT ANGLE OF SOILSOF THREE AGRO-ECOLOGICAL ZONES OF ONDO STATE, NIGERIA
J. T. FasinmirinDepartment of Agricultural Engineering, Federal University of Technology, Akure, Nigeria.
E-mail: [email protected]
ABSTRACT
Sorptivity (S) of soils of three agro-ecological zones of Ondo state, Nigeria (Ondo North, Ondo Centraland Ondo South) was used to determine the water-repellency index and angle of contact of water withsoil. The effects of soil bulk density, total porosity and organic matter content (OMC) on water repellencyindex (R) of sampled soils at three locations, representative of the zones were investigated. Soil sampleswere collected from six different points per location i.e Ikare (Ondo North), Iju-Itaogbolu (Ondo Central)and Igbokoda (Ondo South), for the determination of soil sorptivity and their hydro repellency index.Water sorptivity data of air-dried soil aggregates 5 cm in diameter and approximately spherical in shapewas determined by a steady-state flow using a mini-infiltrometer. The result of the particle sizedistribution showed that sampled soils in Ikare are clayey, while Itaogbolu ranged between sandy clayloam and clay loam and Igbokoda soils within the sandy clay loam and sandy loam. Soil samples withhigher organic matter content have greater water repellency index (R). The highest and lowest waterrepellency index, 2.8 and 1.7 was observed in the Ikare and Igbokoda, respectively having contact angles69.09° and 54.48°, respectively. The R value of Ikare soil was about 24 % higher than the observed R forIgbokoda. Ikare soils were characterized with highest organic matter content (3.5%), while Itaogbolusamples had the lowest OMC values (1.32%). The high correlation coefficients, r 2 = 0.76 and 0.73 at p= 0.05 between hydro-repellency index and organic matter content, and between angle of contact andorganic matter content, respectively showed that soil organic matter content significantly influence hydro-repellency in the three agro-ecological zones of Ondo state, Nigeria.
KEYWORDS: Sorptivity, hydro-repellency index, organic matter, contact angle, soil.
1. INTRODUCTION
Hydraulic properties of soil aggregates such as hydraulic conductivity, infiltration, sorptivity and moistureretention affect water and solute movement in soil aggregates (Gerke and kohne, 2002). The importanceof these hydraulic properties is mostly significant by the fact that large inter-aggregate pores are drainedoff first under prevalent field conditions and water and solutes transport are influenced by the propertiesof the individual aggregate and contact between them. (Horn and Smucker, 2005). Also, pore structuresaffects the hydraulic properties of soil aggregates (Horn and Smucker, 2005; Lipiec et al., 2007) and aremodified by soil compression and tillage practices (Kutilek et al., 2005; Lipiec et al., 2006). Wettability isone of the most important features of soils as it directly influences their physical, mechanical, chemical,biological and fertility properties. Majority of soils, especially cultivated ones are wettable, with rain-water appearing to infiltrate readily. However, for the past 30–40 years it has been evident, especially indry and hot climates, that soils water infiltration is restricted considerably or temporarily very limited(DeBano, 2000). A drop of water placed on the surface of these soils can take seconds to hours toinfiltrate, depending on the degree of soil sorptivity. Compacted aggregates characterized with increasedcontribution of finer pores reduces the accessibility of water for roots due to its availability only at morenegative pore water pressures (Horn and Smucker, 2005). Other authors acknowledge the influence ofhigh pH values, particularly above 6.5 on the reduction of water repellency of some soils (Mataix-soleraand Doerr., 2004), which may be indirectly linked to the specific surface area and texture of the soil(Doerr et al., 2006; Woche et al., 2005). Hallet (2001) and Vogelmann et al. (2010) reported the reductionin infiltration of water into the soil and the resulting reduction in available water for seed germination aswell as growth and development of the plant. Furthermore, increase in surface water may reduce the rateof infiltration, especially in slope, and increase the risk of erosion as observed by Shakesby et al. (2000).
Journal of Agricultural Engineering and Technology (JAET), Volume 20 (No. 1) June, 2012
Nigerian Institution of Agricultural Engineers © www.niae.net 56
Some recent studies indicated that increased soil stability and water infiltration can be a result of thecombined effect of internal aggregate strength and wettability (opposite to repellency) (Czarnes et al.,2000; Goebel et al., 2004; Eynard et al., 2006), and soil compaction which increases the contact points orforces among soil aggregates must have been responsible for internal aggregate strength and stability(Chenu et al., 2000; Ferrero et al., 2007) as well as lower wettability (Goebel et al., 2004; Eynard et al,2006). Soil sorptivity is a function of aggregate sizes and hydrophobicity of soil is mostly concentrated atthe outer skin while the inner part of the aggregates is less hydrophobic (Jasinska et al., 2006; Urbanek etal., 2007).
Apart from the obvious limitation of the amount of available water from precipitation and freshwaterreserves (aquifers, rivers etc.), greater drying of soils is making them less able to retain water (Doerr et al.2006). Drying accentuates the movement of organic solutes to soil surfaces and if critical water content isreached, a water repellent barrier can form that limits the rate and capacity of soil sorptivity (Wallis andHorne, 1992; Ritsema and Dekker, 1996). In some arid regions, soil water sorptivity has become so badthat agricultural production is impossible without costly amelioration (Roper, 2005). In other regions ofthe world, the rate of sorptivity occurs to a lesser extent, but its management with wetting agents has beenshown to increase crop yields (Crabtree and Henderson, 1999) and reduce the impact of diseases(McDonald et al., 2006). However, few works have been done on the determination of soil hydraulicproperties using laboratory methods and almost no valuable data is available on soil sorptivity to water inthe humid tropical climate of Nigeria.
This research was aimed at determining the water repellency index and contact angle of soils of threeagro-ecological zones of Ondo state, Nigeria.
2. MATERIALS AND METHODS
2.1 Site Description and Soil Sampling
The experiment was conducted on soils of the three agro-ecological zones of Ondo state, which are OndoNorth (Ikare), Ondo south (Igbokoda) and Ondo Central (Itaogbolu). Ikare is located on latitude7°31'26"N and longitude 5°45'17"E, with an altitude of 420 m. Ikare has an average relative humidity ofabout 71%, mean minimum and maximum temperature of 29°C and 35°C, respectively and wind speedbetween 3 and 5 km. h-1. The mean annual rainfall varies from 1000 mm and 1500 mm. The soil typecommonly found in Ikare is clayey.
Itaogbolu falls within latitude 7° 22' 10N, longitude 5° 14' 55E and altitude of 347 m above mean sealevel. Itaogbolu is located in the humid south western region of Nigeria. Soils of Itaogbolu ispredominantly Alfisol (Aubert and Travernier, 1972) characterized with light texture, fine sandy loam tofine sandy clay loam but rich in organic material at the surface layer and clayey B horizon (OxicPaleustalf). The soil is moderately supplied with organic matter and nutrients. Moisture holding capacityis moderately good. The mean annual rainfall ranges between 1300 mm to 1500 mm but the soil of theenvironment is subjected to seasonal water logging for varying periods but generally become dry duringthe dry seasons (Fasinmirin, 2008).
Igbokoda, located on latitude 6° 21' 00'' and Longitude 4° 48' 00'' with altitude of 39 m falls in the coastalarea of Ondo state. The mean monthly temperature of Igbokoda is 27°C, with a mean monthly range of2°c, while the mean relative humidity is over 75%. In the southern part of Ondo state (Igbokoda), theolder sand ridge complex develop brown and orange sandy soils, while the most recent ones near thecoast have light grey sandy soils. The swamp flats are characterized by swampy organic and floodedorganic soils, while the major parts consist of decomposed and partly decomposed organic matter whereasareas affected by tide bare saline soils. The later are mostly useless for agricultural uses.

Journal of Agricultural Engineering and Technology (JAET), Volume 20 (No. 1) June, 2012
Nigerian Institution of Agricultural Engineers © www.niae.net 57
Soil auger was used to collect soil samples from depths 10, 20, 30, 40, 50, 60 and 70 cm during the wetseason of 2011, from which soils at 10 - 30 cm depth was regarded as horizon A and 40 - 70 cm ashorizon B. The sampling was conducted at six points per location, making a total of eighteen samples inall. Three samples were collected from each horizon, packed in polyethylene bags, placed in wooden boxand transferred to the laboratory. The samples were allowed to dry in the open air until reaching friability.Subsequently, the aggregates were separated manually into fractions to obtaining moulds ofapproximately 50 mm in diameter (Vogelmann et al., 2010).
2.2 Soil Characterization
Soil analysis was conducted in the laboratory to determine physical and chemical properties of collectedsoil samples. The physical characterization consisted of particle size analysis, clay dispersion, particledensity, bulk density and total porosity. The soil organic carbon was determined by the method describedin EMBRAPA (1997). Soil particle sizes were determined by the pipette method. Textural classificationwas determined using the USDA classification system (Soil Survey Staff, 1993). The bulk density wasobtained by the paraffin clod method described by Blake and Hartge (1986). Soil porosity was calculatedusing bulk density (BD) and particle density (PD, 2.65 Mg m-3) according to the equation: porosity (%) =(1- BD/PD) x 100 (Osunbitan et al., 2005). The soil organic carbon (SOC) fraction was determined usingthe modified light fraction and macro-organic matter method (Gregorich and Ellert, 2000). The activeacidity of the soil was inferred by pH determined in distilled water in soil: water ratio of 1:2.5.
2.3 Soil Sorptivity Determination
Soil sorptivity test was conducted using a micro-infiltrometer, which consists of a tube connected to atank with a small sponge making contact with the narrow tip of the tube (Vogelmann et al. 2010).Hydraulic pressure differences within the column of fluid in the reservoir and the infiltrometer, whichcould affect flow were eliminated. The collected soil samples were transfered to the laboratory, molded toball of approximately 5 cm in diameter and air-dried for two days before sorpitivity determination. Theair dried soil moulds were held in contact with the tip of the infiltrometer (sponge) for 2 minutes, and thecumulative mass of water, which infiltrates the soil by capillary was recorded by analytical balance to anaccuracy of 0.0001 g, from the difference in initial and final weight of the reservoir of liquid. Thesorptivity (S) of soil in water and ethanol was estimated by Eq. (1) (Leeds-Harrison et al., 1994;Vogelmann et al., 2010):
br
QfS
4 (1)
where, Q is the measure of the flow of liquid (m3 s-1), b is a parameter dependent on the function ofdiffusion of water in the soil and the value of 0.55 was adopted (White and Sully, 1987), r is the radius ofthe tip of infiltrometer (0.5 mm), f is the total porosity (m3 m-3).
2.4 Water Repellency Index and Contact Angle
The soil hydro repellency index (R) was evaluated following the suggestion of Tillman et al. (1989) andVogelmann et al. (2010) relating soil sorptivity in water (Swater) and ethanol (Sethanol).
Swater
SethanolR 95.1 (2)
The constant (1.95) accounts for the difference in surface tension and the viscosity of ethanol and water.Ignoring the influence of liquid properties, a measure of intrinsic sorptivity was obtained so that Swater

Journal of Agricultural Engineering and Technology (JAET), Volume 20 (No. 1) June, 2012
Nigerian Institution of Agricultural Engineers © www.niae.net 58
can be directly compared with Sethanol. The angle of soil-water contact was obtained from the formula ofGreyze et al. (2006) as shown in equation 3.6.
R
1arccos
(3)where θ is the angle of soil-water contact, R is the index of repellency.
2.5 Statistical Analysis
Sorptivity data were subjected to the least significant difference (LSD) test at 5% probability level.Student t test was used to determine the relationships between soil porosity, organic carbon and sorptivityto water. The existence of inter-relationships between data set was tested by linear correlation and thecorrelation coefficients determined at the 5% level significance.
3. RESULTS AND DISCUSSION
3.1 Soil Physical Properties
The result of particle size composition of the collected soil samples is presented in Table 1. There werewide variations in the particle size composition of the collected soil samples. The clay content of horizonA soils from Ikare was about 300% higher than the silt content in sampling location 1 of Ikare (IKL1) andover 400% higher than the silt content of horizon B. Itaogbolu soil samples are predominantly falls withinthe sandy clay loam classification. The sand content of Itaogbolu soils ranged between 53% and 62% inhorizon A, while clay content of horizon B varied between 28% and 38%. Soil of Igbokoda ischaracterized with high sand composition comparatively with soil samples from other agro-ecologicalzones of Ondo state. This may have been caused from sand deposits after each storm occurences, whichover the years has resulted to the formation of heaps of sand along the coastal areas and farmlands innearby communities. The percentage sand in Igbokoda soil samples is about 80 – 90% higher than thesand content of Ikare soil at both horizon A and B. However, soils of Igbokoda ranged from sandy loamto sandy clay loam.
Table 1. Mean particle size composition of the collected soil samples
Soil horizons Sand (%) Clay (%) Silt (%) USDA Textural Class
IK L1 horizon A 36.00 48.00 16.00 Clay
IK L1 horizon B 35.00 53.00 12.00 Clay
IK L2 horizon A 32.80 42.00 12.00 Clay
IK L2 horizon B 44.80 47.20 8.00 Clay
IK L3 Horizon A 44.80 45.00 24.00 Clay loam
IK L3 Horizon B 25.00 59.00 16.00 Clay
IT L1 horizon A 53.00 31.20 16.00 sandy clay
IT L1 horizon B 54.00 38.00 8.00 sandy clay
IT L2 Horion A 60.80 27.20 12.00 sandy clay loam
IT L2 Horion B 59.00 31.00 10.00 sandy clay loam
IT L3 Hprizon A 62.00 24.00 14.00 sandy clay loam
IT L3 Hprizon B 64.00 28.00 8.00 sandy clay loam
IG L1 Horizon A 68.00 22.00 10.00 sandy clay loam
IG L1 Horizon B 70.70 25.30 6.00 sandy clay loam
IG L2 Horizon. A 65.00 22.00 16.00 sandy loam
IG L2 Horizon. B 69.00 19.00 12.00 sandy loam

Journal of Agricultural Engineering and Technology (JAET), Volume 20 (No. 1) June, 2012
Nigerian Institution of Agricultural Engineers © www.niae.net 59
IG L3 Horizon. A 61.00 27.00 12.00 sandy clay loam
IG L3 Horizon. B 68.00 24.00 8.00 sandy clay loam
3.2 Organic Matter Content
The highest mean organic carbon (OC) in horizons A and B are 1.66 ± 0.403% and 1.05± 0.181%,respectively and the lowest mean OC are 1.12 ± 0.234% and 2.91 ± 0.237% in Horizons A and B,respectively (Table 2). The difference in mean OC in horizons A and B is not significant at P = 0.05. Pairedsamples correlation of soil organic carbon content of horizons A and B gave a fairly high correlationcoefficient, r = 0.674 at P = 0.05. It was generally observed that the organic carbon contents of sampled soilsdecreased down the soil profile i.e. soil organic carbon content in the subsurface horizon (horizon B) waslower than the observed values of OC at the surface soil (horizon A). This observation agrees with thatdescribed in Streck et al. (2008), who reported the presence of high organic carbon in vertisols. It is also factthat the phenomenon of humus formation from plant residues and decaying animal bodies take place on thesuperficial layer of the soil. Hence, highest percentage of soil organic matter and organic carbon occur in thesoil surface.
Table 2. Organic carbon of soil samples collected from three agro-ecological zones of Ondo stateLocations Replicates Horizon A Horizon B1 1 1.23 0.891 2 2.03 1.031 3 1.72 1.25Mean 1.03(±0.403) 1.06(±0.181)2 1 1.25 0.872 2 0.87 0.772 3 0.77 0.72Mean 0.72(±0.234) 0.78(±0.076)3 1 0.66 0.663 2 1.13 1.133 3 0.95 0.95Mean 1.22(±.066) 0.91(±0.237)
3.3 Soil Sorptivity to Water and Ethanol, and Hydro Repellency Index
The result of soil sorptivity to water and ethanol, and hydro repellency presented in Table 3 shows thathydro repellency index of soils decrease with increase in soil depth. This observation may be due to thedecrease of organic matter with increase in soil depth, i.e. the hydrorepellency (R) of soil sample athorizon A (0 - 30 cm) was found to be higher than R values of horizon B (40 - 70 cm). Doerr et al.,(2000) documented a similar situation where decrease in water repellency with increased soil depth wascaused by decrease in organic matter content down the profile. An exception to this was found in soils ofIkare, which had an increase in repellency index (R) down the soil profile, i.e. Ikare soil samples hadhigher value of repellency in the horizon B than in horizon A. This exception may have occurred naturallyand independent of the quantity of organic matter in the sample (Dekker et al., 1998; Mataix –Solera etal. (2003). However, soil sorptivity to ethanol decreased down the soil profile due to the decreasedorganic matter content of soil at higher soil depths except in some cases where the sorptivity of ethanolincreases in horizon B comparatively with Horizon A.
The soil sorptivity to water in the Igbokoda soil samples was found to be highest. This observation maybe due to the higher proportion of sand aggregate in samples collected from Igbokoda. Sandy soils hasbeen found to have a high pore space which easily allows the movement of water through them unlikeclay soil, which have tightly packed particles.

Journal of Agricultural Engineering and Technology (JAET), Volume 20 (No. 1) June, 2012
Nigerian Institution of Agricultural Engineers © www.niae.net 60
Highest mean contact angle (68.77o) was observed in horizon B of Ikare soil sample. Similarly, a highmean contact angle (68.70o) was also recorded in Igbokoda soil sample but in horizon A (Table 3). Thecorresponding repellency index for the Ikare and Igbokoda soils are 2.76 and 2.75, respectively. Thelowest contact angle (54.47o) was observed in the horizon B soil sample from Igbokoda a correspondinglow R value of 1.72. The high R value of Igbokoda samples might have been caused by the low specificsurface (smaller fractions) of sandy soil (De Jong et al. (1999); De Gryze et al. (2006) in sampling pointsand the oil coatings on soil due to oil exploitation activities in the Niger-Delta axis of Ondo state. Thehigh hydro-repellency value of Ikare soil sample was due to the presence of expansive clays. This agreeswith the finding of Lichner et al. (2006), who established that the types of clay mineral (clay-type 2:1) caninfluence hydro-repellency.
Table 3. Mean Soil Sorptivity to Water, Ethanol and Hydro Repellency Index
Soil horizonQ(m3/s)
x10-5
Bulkdensity
(Mg/m3)Porosity(m3/m3)
Sw(mms-1/2)
x 10-5
Se(mms-1/2)
x 10-5 R
Contactangle θ
(oc)OMC(%)
IK L1 horizon A 2.250 0.868 0.672 2.330 2.468 2.082 61.29 2.12IK L1 horizon B 1.042 0.943 0.644 1.478 1.592 2.159 62.40 1.52IK L2 horizon A 3.028 0.823 0.689 2.711 2.913 2.104 61.61 3.50IK L2 horizon B 1.917 0.877 0.669 2.084 1.823 2.763 68.77 1.78IK L3 horizon A 2.833 0.835 0.685 2.604 3.288 2.475 66.16 2.98IK L3 horizon B 1.458 0.888 0.665 1.850 1.914 2.010 60.16 2.15IT L1 horizon A 2.361 0.929 0.649 2.356 2.691 2.207 63.04 2.40IT L1 horizon B 1.438 0.905 0.659 1.821 1.833 1.995 59.91 1.49IT L2 horizon A 3.694 0.828 0.687 3.033 3.275 2.105 61.62 1.78IT L2 horizon B 2.396 0.876 0.669 2.395 2.391 1.950 59.13 1.32IT L3 horizon A 3.417 0.933 0.648 2.833 2.876 1.981 59.67 1.64IT L3 horizon B 1.812 1.295 0.511 1.815 1.936 2.180 62.69 1.24IJ L1 horizon A 2.000 1.063 0.599 2.063 2.182 2.130 61.98 1.97IJ L1 horizon B 2.500 1.286 0.515 2.085 1.877 1.721 54.48 1.14IJ L2 horizon A 2.111 1.119 0.578 2.053 2.706 2.754 68.69 2.20IJ L2 horizon B 1.812 1.295 0.511 1.815 1.936 2.180 62.69 1.96IJ L3 horizon A 4.972 0.892 0.663 3.463 3.999 2.251 63.62 2.17IJ L3 horizon B 5.438 0.910 0.657 3.603 3.583 1.939 58.94 1.64
3.4 Relationship Between the Angle of Contact and the Organic Matter Content
The angle of contact between water and soil increased with increase in soil organic matter. Hydro-repellency showed positive correlation with the organic matter content of the sampled soils (r = 0.53 at p< 0.05.) (Figure 1). This agrees with the findings of Dekker et al. (2001), Mataix-Solera et al. (2007),Rodriguez-Allerez (2007), DeJong et al. (1999) and De Gryze et al. (2006). These researchers foundpositive relationships between water repellency and organic matter content of soils.

Journal of Agricultural Engineering and Technology (JAET), Volume 20 (No. 1) June, 2012
Nigerian Institution of Agricultural Engineers © www.niae.net 61
Figure 1. Relationship between the angle of contact and soil organic matter content
3.5 Relationship Between Water Repellency Index and Organic Matter Content
Hydro-repellency index showed positive correlation with the organic matter content of the sampled soil (r= 0.75 at p < 0.05.) (Figure 2). This shows that the rate of repellency is affected by the organic mattercontent of the sample soils i.e. increase in organic matter content caused an increase in hydro-repellency.This is different from the findings of Vogelmann et al (2009), who reported significantly low relationshipbetween soil water repellency and organic matter content in the humid subtropical climate of Rio Grandedo Sul, Brazil. This behaviour was also observed by Jaramillo (2006), who concluded that it is not thequantity but the composition of soil organic matter which induces the expression of hydro-repellency.
Figure 2. Relationship between water repellency index and organic matter
3.6 Repellency Index and Angle of Contact
Soils of Ondo-state exhibit sub-critical repellency which refers to a soil which is not perfectly wettable,even though it readily imbibes water (Clothier et al. 2000; Hallett et al., 2001, 2006; Eynard et al. 2006).These are the soils that have contact angles greater than zero but less than 90°. Such a soil state isfrequently called a sub-repellent soil (Tillman et al. 1989). Tillman et al. (1989) introduced the concept of‘subcritical’ water repellent soil, where water infiltration is impeded by repellency despite the soil
y = -1.009x3 + 7.372x2 - 12.40x + 65.21R² = 0.539
52
54
56
58
60
62
64
66
68
70
1.00 2.00 3.00 4.00
Con
tact
ang
le (
°c)
Organic matter (%)
y = -0.050x3 + 0.424x2 - 0.737x + 2.322R² = 0.586
1.50
1.70
1.90
2.10
2.30
2.50
2.70
2.90
1.00 1.50 2.00 2.50 3.00 3.50 4.00
Rep
elle
ncy
Inde
x
Organic matter (%)

Journal of Agricultural Engineering and Technology (JAET), Volume 20 (No. 1) June, 2012
Nigerian Institution of Agricultural Engineers © www.niae.net 62
appearing to wet readily. This is referred to as ‘water resistance’ and it influences the sampled soils(Woche et al., 2005).
However the correlation between contact angle and repellency shows a high positive correlation (r = 0.99at p < 0.05.). This shows that the rate of repellency is greatly affected by the angle of contact (θ), even asincrease in the organic matter content lead to increase in the hydro-repellency index (R) of the sampledsoils.
4. CONCLUSION
This study evaluated soil sorptivity to water and hydro-repellency index of soils in three agro-ecologicalzones in Ondo-state, namely, Ondo North (Ikare), Ondo South (Igbokoda) and Ondo Central (Itaogbolu).Sorptivity of sampled soils varied and was dependent on the organic matter content of soils. Increase insoil organic matter content reduced the sorptivity of soil either to water or ethanol. Generally, soil organicmatter decreased down the soil profile in all sampled soils and this also caused decreases in hydro-repellency of the soil. Hence, there exists a direct relationship between soil organic matter content andhydro-repellency.
REFERENCES
Aubert, G. and R. Travernier. 1972. Soil survey. In: Soils of the humid tropics. U.S. Washington:National Academy of Sciences.
Blake, G.R., Hartge, K. H., Bulk Density. 1986. In: Klute, A. (ed). Methods of Soil Analysis: Physicaland Mineralogical Methods. Madison: American Society of Agronomy, Vol. 1, pp 363-375.
Chenu, C., Le Bissonnais, Y., Arrouyas, D., 2000. Organic matter influence on clay wettability and soilaggregate stability. Soil Sci. Soc. Am. J. 64, 1479–1486.
Clothier B.E., Vogeler I., Magesan G.N. 2000. The breakdown of water repellency and solute transportthrough a hydrophobic soil. Journal of Hydrology, 231–232: 255–264.
Crabtree W.L., Henderson C.W.L. 1999. Furrows, press wheels and wetting agents improve cropemergence and yield on water repellent soils. Plant Soil, 214: 1–8.
Czarnes S., Hallett P.D., Bengough A.G., Young I.M. 2000. Root- and microbial-derived mucilages affectsoil structure and water transport. European Journal of Soil Science, 51: 435–443.
De Jong, L.W., Jacobsen, O.H., Moldrup, P., 1999. Soil water repellency: effects of water content,temperature and particle size. Soil Sci. Soc. Am. J. 63 (3), 437–442.
De Gryze, S., Jassogne, L., Bossuyt, H., Six, J., Merckx, R., 2006. Water repellence and soil aggregatedynamics in a loamy grassland soil as affected by texture. Eur. J. Soil Sci. 57, 235–246.
DeBano L.F. 2000. Water repellency in soils: a historical overview. Journal of Hydrology, 231: 4–32.Dekker L.W., Ritsema C.J., Oostindie K., Boersma O.H. (1998): Effect of drying temperature on theseverity of soil water repellency. Soil Science, 163: 780–796.
Dekker L.W., Doerr S.H., Oostindie K., Ziogas A.K., Ritsema C.J. 2001. Water repellency and criticalsoil water content in a dune sand. Soil Science Society of America Journal, 65: 1667–1674.
Doerr S.H., Shakesby R.A., Dekker L.W., Ritsema C.J. 2006. Occurrence prediction and hydrologicaleffects of water repellency amongst major soil and land-use types in a humid temperate climate.European Journal of Soil Science, 57: 741–754.
Doerr S.H., Shakesby R.A., Walsh R.P.D. 2000. Soil water repellency: its causes characteristics andhydro-geomorphological significance. Earth-Science Reviews, 51: 33–65.
EMBRAPA-Empresa Brasileira de Pesquisa Agropecuária. 1997. Manual de Métodos de Análise deSolo. 2. ed. Rio de Janeiro, RJ: EMBRAPA Solos. 212 p.

Journal of Agricultural Engineering and Technology (JAET), Volume 20 (No. 1) June, 2012
Nigerian Institution of Agricultural Engineers © www.niae.net 63
ORGANIC CARBON CONTENT OF SOILS IN THE WATERSHED OFNSUKKA CAMPUS, NIGERIA
I. K. Eziokwu, G. I. Ezenne, and C. C. AnyadikeAgricultural & Bioresources Engineering Department, University of Nigeria, Nsukka, Nigeria
E-mail: [email protected], [email protected]
ABSTRACT
The amount of organic carbon present in the soil is dependent on the amount of organic matter,sedimentation, erosion, decomposition rate and volatilization. With respect to global warming and betternutrient management, it is necessary to monitor the emission of greenhouse gases (GHG) to theatmosphere and the carbon content of the soil. Organic carbon content in the soil can be determined using,either, direct method (laboratory analysis) or indirect method (modeling and simulation). The presentstudy was carried out to determine the turnover of organic carbon in a watershed inside University ofNigeria, Nsukka campus, using RothC-26.3 carbon model. A computer program written in C# wasdeveloped to estimate the carbon content of the soil, the amount of organic matter formed, and CO2
released at the end of each month of the management data.
The study explained the impact land-use change and management practices have on the organic carboncontent of the area. It was observed that the result of the amount of organic carbon estimated using directmethod was close to that using indirect method. For the result of soil organic matter, the predicted andestimated result was alarming due to the large difference in the values. The correlation coefficient (R2)value for the total predicted and estimated amount of soil organic carbon equals 0.5658 while that for thetotal predicted and estimated amount of organic matter equals 0.3918. This means that the model has abetter prediction for organic carbon than organic matter.
KEYWORDS: Ogano carbon, water, soil organic matter.
1. INTRODUCTION
Land use change and land degradation contribute to the factors that increase the amount of CO2 emitted tothe atmosphere. The impact of climate changes has to be studied with respect to other challenges such asloss of biodiversity, changes in land use, growing food demand, and soil degradation. Understanding themanner of distribution of soil organic carbon will help to adopt a suitable means that will help tosequester carbon in the soil to help reduce greenhouse gases (GHG) emission in the atmosphere.
Speculation has it that improved terrestrial management over the next 50 –100 years could sequester up to50pg of carbon (C), the amount released to the atmosphere since the mid- nineteenth century as a result ofpast agricultural conversion of grasslands, wetlands and forests (Lal et al., 1998). Results of long-termexperiments reveals that soil C losses as a result of oxidation and erosion can be reversed throughimproved soil management such as reduced tillage and fertilization (Rasmussen and Oartob, 1994). In thisregard, improved land-management practices to enhance soil organic carbon (SOC) have suggested aviable way to reduce atmospheric C content significantly (Cole et al., 1993).
The objectives of this study are to determine the soil organic carbon content and its distribution in thewatershed of Nsukka using RothC-26.3 carbon model.

Journal of Agricultural Engineering and Technology (JAET), Volume 20 (No. 1) June, 2012
Nigerian Institution of Agricultural Engineers © www.niae.net 64
2. MATERIALS AND METHODS
2.1 Theoretical Background
2.1.1 Terrestrial Carbon Cycle
The input of organic carbon in the soil can be as a result of various activities that take place in theecosystem. Nature has a way of balancing the carbon in the environment but due to several humanactivities nowadays, the balance seems to be altered, leading to environmental threat. Fig.1 below is thecarbon cycle showing some of the human activities that contribute to the amount of CO2 in theatmosphere.
Fig. 1: Carbon Cycle. (Source: FAO, 2004)
Table 1 gives the total stocks and densities of soil organic carbon stocks by major Agro-Ecological zone.Researches revealed that the upper 1cm of soil contains 2.5 times more organic carbon than terrestrialvegetation ( 600 pg. C) and about twice as much carbon than is present in the atmosphere ( 750 pg. C).Contemporary soil organic carbon mass in the first 1m of soil is estimated at 1200- 1600 pg C (Batjes andSombroek, 1997), while it is 2376-2456 pg C for the upper 2m of soil.
2.1.2 Soil Organic Matter (SOM)
Primary productions, especially the rate and quality of carbon transfer below grounds and soil microbialactivity, are recognized as the overall biological processes controlling organic matter dynamics in the soil.Plant residues that fall on the soil as “fresh” litter are gradually altered through physical fragmentation,fauna/micro flora interactions, mineralization and humus function (Batjes, 1999). Figure 2 shows themain soil process influencing SOC constant. According to Eswaran et al. (1995) four pools of soil organicmatter are defined based on carbon dynamics. “An active or labile pool” of ready oxidized compounds,the formation of which is largely dictated by plant residue inputs (and hence management and climate), a“slowly oxidized pool” associated with macro-aggregates the dynamics and pool site of which areaffected by soil physical properties such as mineralogy and aggregation, as well as agronomic practices,“a very slowly oxidized pool” associated with micro-aggregates, where the main controlling factor iswater stability of this aggregates and agronomic practices have little effect, and “a passive orrecalcitrant pool” where clay mineralogy is the main controlling factor, and there are no effect ofagronomic practices.

Journal of Agricultural Engineering and Technology (JAET), Volume 20 (No. 1) June, 2012
Nigerian Institution of Agricultural Engineers © www.niae.net 65
Table 1: Total Stocks and Densities of SOC by major Agro-ecological zones (%C resp.kgcm-2 for upper0.3m)
Agro-ecological zone Spatially weighted SOCpools (pg C to 0.3mdepth)
Mean SOC density(kgm-2 0.5 m depth)
Tropics, warm humidTropics, warm seasonally dryTropics, coolAridSubtropics, with summer rainsSubtropics, with winter rainsTemperate, oceanicTemperate, continentalBorealPolar & alpine
91.8- 95.262.7- 66.729.1- 31.048.7- 54.733.5- 35.718.3- 20.119.6- 21.7
121.2- 126.52002.7- 210.3
57.0- 63.0
5.2- 5.43.6- 3.84.4- 4.72.0- 2.24.5- 4.73.6- 3.95.8- 6.45.6- 5.9
9.8- 10.27.0- 7.8
(Source: Batjes, 1999)
Fig. 2: Main Soil Process Influencing SOC Content. (Lal et al., 1998)
2.1.3 Rothamsted Soil Organic Carbon Model (RothC-26.3)
RothC-26.3 is a model for the turnover of organic carbon in non-waterlogged topsoil that allows for theeffects of soil type, temperature, moisture content and plant cover on the turnover process (Coleman andJenkinson, 2008). The model makes use of monthly time step to calculate total organic carbon intonnes/hectare, microbial biomass carbon (tonnes/ hectare) and the equivalent radiocarbon age of thesoil(years, centuries time scale). The model can effectively work in arable topsoil, grassland and inwoodland areas. Also the model can perform in different soils and under different climate conditions.
2.1.4 Model Structure
Soil organic C is split into four active compartments and a small amount of inert organic matter (IOM).The four active compartments are DPM, RPM, BIO and HUM.Fig. 3 shows the structure of the model.

Journal of Agricultural Engineering and Technology (JAET), Volume 20 (No. 1) June, 2012
Nigerian Institution of Agricultural Engineers © www.niae.net 66
Organic inputs
RPM: Resistant plant material HUM: Humified organic matterDPM: Decomposable plant material IOM: Inert organic matterBIO: Microbial biomass
Fig. 3: Structure of Rothamsted Carbon Model (Coleman and Jenkinson, 2008)
2.1.5 Decomposition of an Active Compartment
Coleman and Jenkinson (2008) said that if an active compartment contains Y tonnes of carbon/ha that itdeclines to Ye –abckt tonnes/ha at the end of the month.Where, a = rate modifying factor for temperature
b = rate modifying factor for moisturec = the soil cover factork = the decomposition rate constant for a compartmentt = 1/12
The amount of material that decomposes in a particular month is given as Y (1 – e –abckt).
2.2 Description of Study Area
The study area is a watershed inside University of Nigeria, Nsukka, South Eastern Nigeria on latitudebetween 60 44ˈ and 60 55 ̍ N; longitudes 70 11̍ and 70 28 ̍ E. The total area of the watershed is 28453.002m2 (61.172 plots of land). The climate is characterized by mean annual rainfall of more than 1600 mmwith average temperature of 280C (Igwe, 2005). The highest spot height is 430 m above sea level and thelowest spot height is 411 above sea level. Figure 4 shows the topographical map of the area with the spotheights. The textural class of the soil profile varies from sandy loam at the upper most layer of the soil tosandy clay loam at depth below 60 cm. The area is characterized by bimodal rainfall pattern with wet anddry seasons lasting from April – October and November – March, respectively. The land use patterns inthe area are grassland (covering most of the area), cultivated land, impervious surface and bare surface.Also, the area has a gently sloping topography.
2.3 Materials and Types of Data used in the Study
The materials used in the study are as follows: (i) global positioning system (GPS) device used to obtainthe perimeter survey of the area, spot heights and sampling positions. It was also used to track thedirection of runoff water. (ii) Soil auger was used to collect soil samples.
Three sets of data were collected for this study. First set of data used in this model is the climatic data.The climatic data collected include average monthly air temperature, atmospheric pressure, relativehumidity and rainfall amount. These weather data (see Table 2) were recorded via telemetry. Another setof data used in the study is the soil data to run the model. The major soil data include %clay content andinitial soil carbon content. The third set of data collected for the study is the management data.
Decay
Decay
DPM
RPM
CO2
BIO
HUM
DecayCO2
BIO
HUMIOM

Journal of Agricultural Engineering and Technology (JAET), Volume 20 (No. 1) June, 2012
Nigerian Institution of Agricultural Engineers © www.niae.net 67
Fig: 4: Topographical Map of the Study Area Showing Spot Height
Table 2: Monthly Weather Record2010 Total rainfall
amount (mm)Avg.air temperature(0C)
Avg. relativehumidity (%)
Atmospheric pressure(mbar)
May 162.0 26.89 76.73 959.28Jun. 206.6 25.39 80.85 960.12Jul. 150.8 24.46 81.98 963.21Aug. 162.1 24.38 83.38 963.22Source: Centre for Basic Space Science, University of Nigeria, Nsukka (2010).
2.4 Determination of RothC-26.3 ParametersThe samples collected in different locations within the watershed were grouped into four compartments:
Decomposition Rate ConstantThe decomposition rate constant (k) in years–1, for each compartment is set at:
Decomposable Plant Material (DPM), k = 10.0 (sample 4 and 7)Resistant Plant Material (RPM), k = 0.3 (sample 1 and 2)Microbial Biomass (BIO), k = 0.66 (sample 3 and 8)Humified Organic Matter (HUM), k = 0.02 (sample 5 and 6)
The soil samples were grouped with respect to nature of the sampling site. Eight samples were collectedat different points in the watershed.

Journal of Agricultural Engineering and Technology (JAET), Volume 20 (No. 1) June, 2012
Nigerian Institution of Agricultural Engineers © www.niae.net 68
Determination of Rate Modifying Factor for Temperature (a)The average monthly air temperature (T0C) collected for each month was used to determine ratemodifying factor for temperature (a). The temperature was substituted in the equation (1) below (Colemanand Jenkinson, 2008):
30.18106exp1
9.47
Ta (1)
Determination of Rate Modifying Factor for Moisture (b)Accumulated top soil moisture deficit (TSMD) is calculated from the first month when 0.75(open panevaporation) exceeds rainfall. The rate modifying factor for moisture (b) is equal to one (b=1) for monthwhen acc.TSMD < 0.444Max.TSMD. Otherwise, b is calculated from the equation (2) (Coleman andJenkinson, 2008):
TSMDMaxTSMDMax
TSMDaccTSMDMaxb
..444.0..
...*2.00.12.0
(2)
For the present study ‘b’ is set as 1 since the study lasted during the wet season and evaporation is lessthan rainfall amount. With respect to this, the modified computer program for this study is partitioned forwet season and dry season to take care of the moisture factor for the two periods.
Use of the Soil Cover Factor for RothC-26.3According to Coleman and Jenkinson (2008), the soil cover factor for location that is bare and which isvegetated is set as:Soil cover, c = 0.6 (sample l and 2)Soil cover, c = 1.0 (sample 3- sample 8), respectively.
Determination of CO2/(BIO+HUM) ratioThe ratio CO2/ (BIO+HUM) was calculated from the clay content of the soil using equation (3) (Colemanand Jenkinson, 2008):
x = 1.67(1.85+1.60 exp (–0.0786 %clay)) (3)where x is the ratio CO2/(BIO+HUM), BIO is Microbial Biomass and HUM is Humified organic matter.Then x/(x+1) is the CO2 and 1/(x+1) is formed as BIO+HUM. The amount of CO2 evolved andBIO+HUM formed was calculated using the program.
Determination of Soil Organic Carbon and Soil Organic Matter Formed at each MonthThe Rothamsted parameters estimated above were used to determine the turnover of organic carbon. Thefirst organic carbon content was determined directly from the laboratory. The results was used to initializeY (tonnes/ha). The initial carbon content was determined in the first month of the study, which was onMay, 2010. The amount of carbon by the end of the next month, given as; Ye-(abckt), was estimated usingthe RothC-26.3 program. Also the amount of organic matter in a particular compartment that decomposesin a particular month is given as; 1-Ye-abckt. This was estimated using the same program. Table 3 showsthe soil organic carbon (SOC) for the month of May which was gotten from laboratory analysis. Theresult was used to initialize the model to predict the turnover of SOC for the Months of June, July, andAugust.

Journal of Agricultural Engineering and Technology (JAET), Volume 20 (No. 1) June, 2012
Nigerian Institution of Agricultural Engineers © www.niae.net 69
Table 3: Land Management and Soil Result (May, 2010)Site Land
ManagementDepth(cm)
Clay(%)
Silt(%)
Fine Sand(%)
InitialSOC (%)
Initial SOM(%)
1 Bare land 25 7.04 9.28 83.68 0.32 0.552 Bare land 25 11.04 17.28 71.68 0.52 0.903 Cassava farm
(cultivated)25 13.04 11.28 75.68 1.52 2.62
4 Maize farm(cultivated)
25 13.04 11.28 75.68 0.96 1.66
5 Grassland 25 13.04 11.28 75.68 0.68 1.176 Grassland 25 15.04 13.28 71.68 0.64 1.107 Yam farm
(cultivated)25 9.04 11.28 79.68 0.72 1.24
8 Vegetable garden(zero tillage)
25 11.04 13.28 75.68 1.16 2.0
2.5 Running the RothC-26.3 Program
By double clicking on the modified model for the present study icon, the introductory interface will show.To proceed, click on the “Next” button to get the interface for Season Selection. Select the season to runby clicking on either wet season or dry season button. To simulate for any month, select the month andfor the dry season, the max TSMD and acc. TSMD must be known (note that acc. TSMD is calculated forthe first month when 0.75*open pan evaporation is greater than rainfall). After inputting the values ofmax TSMD and acc. TSMD for a particular month, select the month again to assess the form. Note thatthe program cannot run if the user did not input all the essential data necessary to run the program. Theonly non essential input is the management practice. To input this, select the site and enter each of thedata required. For soil nature, select whether bare or vegetated; the soil nature takes care of the soil coverfactor (c) in Rothamsted. In a similar way, the compartment each site belongs is selected and the % clay,initial SOC, management practice is entered for each of the sites. Finally, the average monthly airtemperature is entered. To output, select the site or all the sites and click on the output buttons (SOC,SOM, CO2, BIO+HUM buttons). After simulating for a particular month, click the “Back’’ button andselect another month of interest. Figure 5 shows the program flow chart.
3. RESULTS AND DISCUSSION
3.1 Presentation of Results
Table 4 shows the comparison of the laboratory estimated result with the simulated result (Rothamsted)for soil organic carbon. From the results, it shows that RothC-26.3 model is a good predictor of soilorganic carbon turnover. The reverse is the case for soil organic matter (see Table 5). It was observed thatthe value of soil organic matter estimated was not close to that simulated. Table 6 shows the relationshipbetween CO2 Released and BIO+HUM formed.
Table 4: Estimated and Simulated amount of Soil Organic Carbon for the Watershed
SiteJune July August
EstimatedSOC(tc/ha)
SimulatedSOC(tc/ha)
EstimatedSOC(tc/ha)
SimulatedSOC(tc/ha)
EstimatedSOC(tc/ha)
SimulatedSOC(tc/ha)
1 0.32 0.225 0.28 0.220 0.22 0.2152 0.50 0.366 0.47 0.358 0.44 0.3503 1.33 1.071 1.47 1.047 1.24 1.0244 0.91 0.676 0.89 0.661 0.90 0.6475 0.52 0.664 0.62 0.649 0.60 0.645

Journal of Agricultural Engineering and Technology (JAET), Volume 20 (No. 1) June, 2012
Nigerian Institution of Agricultural Engineers © www.niae.net 70
6 0.63 0.625 0.64 0.611 0.59 0.5987 0.70 0.703 0.72 0.688 0.69 0.6738 1.15 1.133 1.08 1.108 1.02 1.084Total 6.06 5.463 6.17 5.342 5.7 5.236
Fig. 5: Program flow chart
End Program
Read:Tm,%Clay,Max.TSMD,Acc.TSMD
Dimensions and Initialization
Set b to 1 (for wet season)
Calculate:a = 47.9/1+exp(106+(Tm+18.3))b = 0.2+(1.0-0.2)* (Max.TSMD-
Acc.TSMD/(Max.TSMD-0.444Max.TSMD))
IsAcc.TSMD <0.444Max.TSMD?
Calculate: Ye-abckt, Y(1-e-abckt), x,x/(x+1), 1/(x+1)
Print Organic Carbon, Organic Matter,CO2/(BIO+HUM) ratio, CO2 evolved and(BIO+HUM) sum.
No
Yes
START

Journal of Agricultural Engineering and Technology (JAET), Volume 20 (No. 1) June, 2012
Nigerian Institution of Agricultural Engineers © www.niae.net 71
Table 5: Estimated and Simulated amount of Soil Organic Matter (SOM) for the Watershed
SiteJune July August
EstimatedSOM(tc/ha)
SimulatedSOM(tc/ha)
EstimatedSOM(tc/ha)
SimulatedSOM(tc/ha)
EstimatedSOM(tc/ha)
SimulatedSOM(tc/ha)
1 0.55 0.007 0.48 0.005 0.38 0.0052 0.86 0.012 0.81 0.008 0.76 0.0083 2.29 0.035 1.78 0.024 2.14 0.0234 1.57 0.022 1.53 0.015 1.55 0.0145 0.90 0.016 1.07 0.015 1.03 0.0146 1.09 0.015 1.10 0.014 1.02 0.0137 1.21 0.017 1.24 0.015 1.19 0.0158 1.98 0.027 1.86 0.025 1.76 0.024Total 10.45 0.151 9.87 0.136 9.834 0.116
Table 6: Effect of % clay on the ratio of CO2 released to BIO+HUM formedSite % Clay CO2 BIO+HUM CO2/(BIO+HUM)1 7.04 0.822 0.178 4.622 11.04 0.808 0.192 4.213 13.04 0.802 0.198 4.054 13.04 0.802 0.198 4.055 13.04 0.802 0.198 4.056 15.04 0.796 0.204 3.907 9.04 0.815 0.185 4.418 11.04 0.808 0.192 4.21
The results of the soil organic carbon, shows a clear indication that management practices observed in thewatershed (Table 3) have an effect on the amount of soil organic carbon distribution and storage.Accelerated erosion in the area also resulted in the sharp decline in organic carbon content (see Figure 6)with the highest in May and lowest in August.
Fig. 6: Total Soil Organic Carbon for the watershed
3.2 Effect of Bare Land
The laboratory and simulated results indicate a decline in the amount of soil organic carbon. The leastamounts of soil organic carbon were observed in bare land sites (site 1 and site 2). Although the work wascarried out for few months, which is not a good duration to explain the full impact of bare land on soil
5.2
5.4
5.6
5.8
6
6.2
6.4
6.6
May June July August
Month
Total
SOC
(tc/ha
)
Journal of Agricultural Engineering and Technology (JAET), Volume 20 (No. 1) June, 2012
Nigerian Institution of Agricultural Engineers © www.niae.net 72
organic carbon, the result still agrees with previous researches on soil organic carbon as reported byBatjes (1999) and Kirshbaum (1995).
3.3 Effect of Tillage
Intensively tilled soil has greater capacity for reduction in carbon storage than less tilled soil. Site 8 wasobserved to store more carbon because of zero tillage practiced in the site. Site 3, site 4 and site 7 wereintensively tilled but were observed to store a reasonable amount of organic carbon.
3.4 Effect of grassland
The study indicates that grassland has the capacity to sequester carbon. The amount of organic carbon inthe grassland regions (site 5 and site 6) is higher than that in the bare land region. This shows that thepotential of carbon storage in grassland in the area of study is encouraging.
The correlation results from the study shows that the simulated soil organic carbon produced a bettercorrelation of 0.5658 with estimated laboratory result, than the correlation between simulated soil organicmatter and estimated soil organic matter which was 0.3774. The higher correlation produced in the soilorganic carbon analysis indicates the extent of accuracy of the model in organic carbon study for the area.Similarly, the correlation for the organic matter study indicates that the model is not so good for organicmatter analysis with respect to the area of study.
4. CONCLUSION
The result of the amount of organic carbon estimated using laboratory method (direct) was observed to beclose to that predicted using the computer program (indirect). A question about the effectiveness ofRothamsted soil organic carbon with respect to the study area arose when the laboratory result of the soilorganic matter was compared with the simulated result. The simulated result of the organic matter contentwas observed to be too small compared to the laboratory result. Also the first laboratory result of carboncontent in the area indicated that the highest amount of carbon deposit is in the zero tilled vegetable areawhile the least deposit is in the bare area of the watershed. These variations indicate the effectmanagement practice has on carbon distribution. The correlation between simulated and estimated resultsproduced in the study was higher for the organic carbon than that for the organic matter. Generally,RothC-26.3 is a good program for predicting the turnover of soil organic carbon for non-waterloggedtopsoil.
REFERENCES
Batjes, N. H. 1999. Management Options for Reducing CO2-Concentrations in the atmosphere byincreasing carbon Sequestration in the soil. Wageningen, the Netherlands, and Sombroek, W.G.International Soil Reference and Information Centre (ISRC).
Batjes, N. H. and Sombroek, W. G. 1997. Possibilities for Carbon Sequestration in Tropical andSubtropical Soils. Global Change Biology, 3, 161-163
Cole, C.V., Paustian, K., Elliott, E.T., Metherell, A.K. Ojima, D.S., and Parton, W.J. 1993. Analysis ofAgro Ecosystems Carbon Pools. CRC Press, Boca Raton, 151-159.
Coleman, K. and D. S. Jenkinson 2008. RothC-26.3: A Model for the Turnover of Carbon in Soil, ModelDescription and Windows User Guide. Rothamsted Research, Herpenden Herts, AL5 2JQ, p.1-18.
Eswaram. H., E. Van den Berge, P. Reich, and J. Kimble 1995. Global soil carbon resources. In; Soils andGlobal Change. Lewis publisher. Boca Raton.
FAO. 2004. Data sets, Indicators, and Methods to assess land degradation in dry lands. World SoilResources Report No. 100. Rome.

Journal of Agricultural Engineering and Technology (JAET), Volume 20 (No. 1) June, 2012
Nigerian Institution of Agricultural Engineers © www.niae.net 73
Igwe, C.A. 2005. Soil Physical Properties under Different Management System and Organic MatterEffects on Soil Moisture along Soil Catena in Southeastern Nigeria. Tropical and SubtropicalAgroecosystems. Pg. 58.
Kirshbaum, M.U.F. 1995. The temperature dependence of soil organic matter decomposition, and theeffects of global warming on soil carbon storage. Soil Biology and Biochemistry, 27, 753-758.
Lal, R., Kimble, J.M, Follet, R.F., and Cole, C.V. 1998b. The potential of U.S. cropland to sequestercarbon and mitigate the greenhouse effect. Ann Arbor Press, Chelsea. 128.
Rassmussen. P.E and Oartob, W.J. 1994. Long- term Effects of Residue Management in wheat- Fallow:Inputs, Yield, and Soil Organic Matter. Soil science society of American Journal, 58, 523.

Journal of Agricultural Engineering and Technology (JAET), Volume 20 (No. 1) June, 2012
Nigerian Institution of Agricultural Engineers © www.niae.net 74
COMPARATIVE EVALUATION OF CO-DIGESTION OF COW, PIG ANDPOULTRY DROPPINGS
E. C. Chukwuma1, C. Nzediegwu2, A. O. Nwoke3, E. C. Umeghalu1, J. N. Chukwuma4
1Department of Agricultural and Bioresources Engineering, Nnamdi Azikiwe University, Awka, Nigeria.2Department of Agricultural Engineering, Federal University of Technology, Owerri, Nigeria.
3Department of Agricultural and Bioresources Engineering, University of Nigeria, Nsukka, Nigeria.4Department of Environmental Management, Nnamdi Azikiwe University, Awka, Nigeria.
Email: [email protected]
ABSTRACT
Management of agricultural animal waste has become a great concern to government and public due toenvironment issues, health risk associated with poor management of waste and the need for alternativeenergy. The biogas production potential of animal wastes and most especially co-digestion of thesewastes offer sustainable, cleaner environment and economic benefit. There is need to investigate the bestblend leading to higher gas production from these animal waste for biogas optimization. The study ofbiogas production was conducted for selected animal wastes: cow dung (CD), poultry droppings (PYD)and pig droppings (PGD) in different mixture ratios of 100: 0, 75: 25, 50: 50, 25:75 and 0:100 todetermine the optimum mixture ratio for poultry droppings and cow dung; pig droppings and cow dung;poultry and pig droppings respectively in 20 litre digesters.The result shows that 25% CD + 75% PYD,50% PGD + 50% CD, 100% PYD + 0% PGD were the optimum mixture ratios for the selected animalwastes. These mixture ratios are the recommended mixture based on substrate composition andexperimental factors used in this study.
KEYWORDS: Biogas, cow dung, poultry droppings, pig droppings, co-digestion.
1. INTRODUCTION
Animal by-products are suitable for anaerobic digestion (AD) giving high gas yields and a nutrient richorganic fertilizer. Anaerobic digestion of animal waste offers a safe and sustainable waste managementsolution (Salminen and Rintala, 2002; Buendía et al., 2009; Braun and Wellinger, 2002; Molinuevo, et al.,2009). Governmental subsidies for facilitating investments in anaerobic digestion of waste are a goodinvestment from a sustainable, environmental, and economic point of view (ElMahgary 2009). Co-digestion is the simultaneous digestion of a homogenous mixture of two or more substrates withcomplementary characteristics so as to enhance biogas production. (Saev et al., 2009; Braun andWellinger, 2002; Neveset et al., 2009; Wei, 2007). Today, the limits and the possibilities of AD are betterknown and co-digestion has therefore become a standard technology (Braun and Wellinger, 2002). Theuse of co-substrates usually improves the biogas yields from anaerobic digester due to positivesynergisms established in the digestion medium and the supply of missing nutrients by the co-substrates,the mixing of several waste types has also positive effects both on the anaerobic digestion itself and onthe treatment economy (Mata-Alvarez et al., 2000; Neveset al., 2009; Campos et al., 1999).
It is very important to establish the best blend in order to maximize methane production, avoid inhibitionprocesses, and make profitable biogas plant (Mata-Alvarez et al., 2000). Numerous researches on co-digestion of animal waste have been limited to poultry and pig droppings (Magbanua, et al., 1999); pigslurry and organic wastes from food industry (Campos et al., 1999); cow dung with rice husk (Iyagba, etal., (2009); pigs droppings with pig by-products (Angelidaki and Hejnfelt, 2009); wasted tomatoes andcattle dung (Saev et al., 2009); water hyacinth with poultry litter and cow dung (Jagadish, et al. 2011);cow manure, food waste and intermittent input of fat (Neves, et al. 2009); cow dung and pig droppings(Kasisira and Muyiiya 2009); paper waste and cow dung (Ofoefule, et al., 2010); horse and cow dung(Yusuf,et al., 2011) to mention but a few. Babatola, (2008) in his work on “comparative study of biogasyield pattern in some animal and household waste” compared the biogas yield of poultry and pig

Journal of Agricultural Engineering and Technology (JAET), Volume 20 (No. 1) June, 2012
Nigerian Institution of Agricultural Engineers © www.niae.net 75
droppings and cow dung. He however, recommended that further research work should be extended intothe investigation of parameters guiding the composite substrates, that is mixing of different wastes toachieve an optimum biogas yield.
The objective of this study is to compare the biogas production potentials of cow dung co-digested withpoultry droppings, cow dung co-digested with pig droppings and poultry droppings co-digested with pigdroppings under suboptimum conditions (without temperature regulation, Ammonia control and pHadjustment).
2. MATERIALS AND METHODS
2.1 Substrates Sources and Characteristics
Poultry droppings used for the research were collected from Buka-Chuks poultry farm in Amawbia fewkilometers from Awka town. Cow dung was collected from Amansi cattle ranch Awka. The pig droppingswere collected from Ausco farms in Awka. The fresh substrates were taken immediately to Spring BoardLaboratories for analysis. The parameters determined include: total solid (TS), volatile solid (VS), pH,chemical Oxygen demand (COD), and total Kjeldahl nitrogen content. The result of the analysis is shownin Table 1:
Table 1: Physico-Chemical Characteristic of the SubstratesComposition Cow Dung Poultry Dropping Pig Dropping
Total Solid (TS) (%)19 40 20
Volatile Solid (VS)(%)12 12.5 38
TKN (mg/g)2.98 9.52 15.3
Carbon Content (%)3.98 5 4.6
pH7.0 7.7 6.2
Total Ammonia (mg/g)2.5 4.5 5.6
The pH measurements were taken with a pH meter (Fisher Scientific Accumet Basic, Model AB 15 pHmeter). All other analysis (Total Solids, Carbon content, Volatile Solids, Total Kjeldahl Nitrogen andTotal Ammonia) were performed using Standard Methods (APHA, 2005).
2.2 Experimental Setup
The experiment was conducted in Biotechnology Research Centre, Nnamdi Azikiwe University Awka.The main experimental apparatus consist of twelve 20 litres mild steel metallic bio-digester designed forthe purpose of the experiment. The bio-digester is divided into three main parts- the inlet chamber, thebody, and the outlet chamber. The body of the digester contains a stirrer for the mixing of the substrate toenhance gas production. An exit pipe is provided at the top of the smaller cylindrical portion of thedigester for biogas collection and measurement. Other materials used for the experiment includegraduated transparent bucket and measuring cylinder for measuring the volume of gas production,hosepipe, thermometer, digital pH meter etc.The schematic diagram of the bio-digester used for theexperiment is shown in Fig 1:

Journal of Agricultural Engineering and Technology (JAET), Volume 20 (No. 1) June, 2012
Nigerian Institution of Agricultural Engineers © www.niae.net 76
Figure 1: Bio-Digester
The 0%CD + 100%PYD, 100%PGD + 0%CD and 0%PYD + 100%PGD are single substrate digestionsand are used as data baseline (Buendia, et al., 2009). A sample of 15 litres of water was added to thewaste, the sample proportions were homogenized before pouring them into the digester, subsequentstirring followed to prevent scum formation at the surface of the slurry and to free trapped gases in theBio-digester. The experimental design used for the experiment is shown in Table 2:
Table 2: Experimental Design of Digestion and Co-digestion of SubstratesMixing Ratio CD + PYD
(kg)PGD + CD
(kg)PYD + PGD
(kg)0: 100 0 : 7 0 : 7 0 : 7
25:75 5.25:1.75 5.25:1.75 5.25:1.75
50:50 3.5: 35 3.5: 35 3.5: 35
75:25 1.75:5.25 1.75:5.25 1.75:5.25
100:0 7 : 0 7 : 0 7 : 0
Volume measurements of biogas produced was done by water displacement. The method used wasadopted from Ezeoha and Idike (2007). The biogas collector and measurement unit used consisted of a 20litre transparent jerry-can and a 12-litre transparent bucket, all connected in series to the digesterheadspace. Pressure in the digester tends to displace a given volume of water in the jerry-can; the waterdisplaced enters the graduated 12-litre transparent bucket, the volume of water displaced is the volume ofgas produced. Biogas production was monitored and measured for thirty days.
3. RESULTS AND DISCUSSION
A comparative evaluation of the biogas yield of all the mixtures is presented graphically in Figure 2.From the figure, pig dropping has the lowest biogas yield of 1.21L/Total Mass of Slurry (TMS) among all
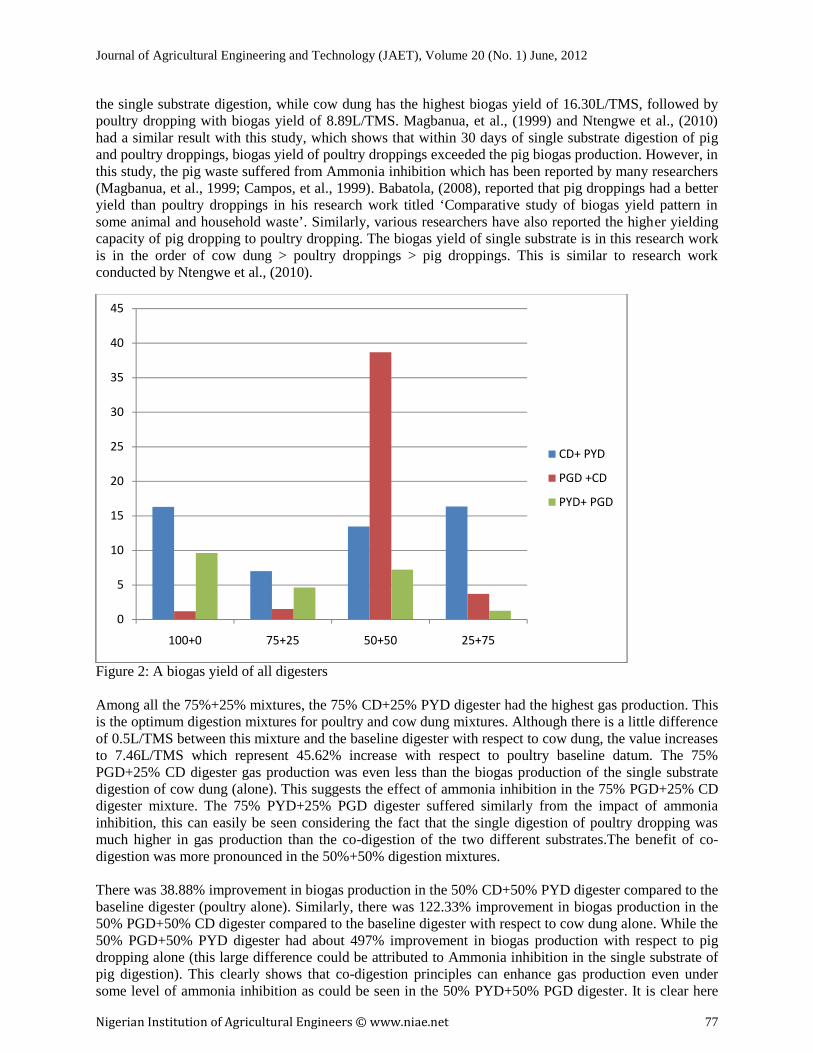
Journal of Agricultural Engineering and Technology (JAET), Volume 20 (No. 1) June, 2012
Nigerian Institution of Agricultural Engineers © www.niae.net 77
the single substrate digestion, while cow dung has the highest biogas yield of 16.30L/TMS, followed bypoultry dropping with biogas yield of 8.89L/TMS. Magbanua, et al., (1999) and Ntengwe et al., (2010)had a similar result with this study, which shows that within 30 days of single substrate digestion of pigand poultry droppings, biogas yield of poultry droppings exceeded the pig biogas production. However, inthis study, the pig waste suffered from Ammonia inhibition which has been reported by many researchers(Magbanua, et al., 1999; Campos, et al., 1999). Babatola, (2008), reported that pig droppings had a betteryield than poultry droppings in his research work titled ‘Comparative study of biogas yield pattern insome animal and household waste’. Similarly, various researchers have also reported the higher yieldingcapacity of pig dropping to poultry dropping. The biogas yield of single substrate is in this research workis in the order of cow dung > poultry droppings > pig droppings. This is similar to research workconducted by Ntengwe et al., (2010).
Figure 2: A biogas yield of all digesters
Among all the 75%+25% mixtures, the 75% CD+25% PYD digester had the highest gas production. Thisis the optimum digestion mixtures for poultry and cow dung mixtures. Although there is a little differenceof 0.5L/TMS between this mixture and the baseline digester with respect to cow dung, the value increasesto 7.46L/TMS which represent 45.62% increase with respect to poultry baseline datum. The 75%PGD+25% CD digester gas production was even less than the biogas production of the single substratedigestion of cow dung (alone). This suggests the effect of ammonia inhibition in the 75% PGD+25% CDdigester mixture. The 75% PYD+25% PGD digester suffered similarly from the impact of ammoniainhibition, this can easily be seen considering the fact that the single digestion of poultry dropping wasmuch higher in gas production than the co-digestion of the two different substrates.The benefit of co-digestion was more pronounced in the 50%+50% digestion mixtures.
There was 38.88% improvement in biogas production in the 50% CD+50% PYD digester compared to thebaseline digester (poultry alone). Similarly, there was 122.33% improvement in biogas production in the50% PGD+50% CD digester compared to the baseline digester with respect to cow dung alone. While the50% PGD+50% PYD digester had about 497% improvement in biogas production with respect to pigdropping alone (this large difference could be attributed to Ammonia inhibition in the single substrate ofpig digestion). This clearly shows that co-digestion principles can enhance gas production even undersome level of ammonia inhibition as could be seen in the 50% PYD+50% PGD digester. It is clear here
0
5
10
15
20
25
30
35
40
45
100+0 75+25 50+50 25+75
CD+ PYD
PGD +CD
PYD+ PGD

Journal of Agricultural Engineering and Technology (JAET), Volume 20 (No. 1) June, 2012
Nigerian Institution of Agricultural Engineers © www.niae.net 78
that the 50% PGD+50% CD digester is the optimum digestion mixture for cow dung and poultrydropping. There was a sharp decrease in gas production for 25%+75% digestion mixtures compared to the50% + 50% mixture ratios. The 25% PYD+75% CD digester had the highest biogas production in the25%+75% digestion mixtures.
4. CONCLUSIONS
The results of the study shows that the maximum biogas production potential for the cow dung andpoultry droppings mixture is the 75% PYD + 25% CD digestion mixture ratio. 50% PGD + 50% CD forthe pig droppings and cow dung mixture, and 100% PYD + 0% PGD for poultry and pig droppingmixture ratio. The overall best performance mixture ratio in this research work is the 50% PGD + 50%CD digester mixture.
REFERENCES
American Public Health Association (APHA), American Water Works Association (AWWA), WaterEnvironment Federation (WEF). 2005. Standard Methods for the examination of water & wastewater.21th Edition, Centennial Edition. Washington, DC.
Angelidaki, H. I., and Hejnfelt, A. 2009. Anaerobic digestion of slaughterhouse by-products.Biomass andbio-energy.33:1046 – 1054.
Babatola, J. O. 2008. Comparative study of biogas yield pattern in some animal and household wastes.www.ajol.info retrieved on December, 2010.
Braun, R., and Wellinger, A. 2002. Potential of co-digestion. Institute of Agro Biotechnology. Dept ofEnvironmental Biotechnology, Lorenz Strasse.
Buendía, I. M., Francisco, J. F., José, V., Lourdes, R. 2009. Feasibility of anaerobic co-digestion as atreatment option of meat industry wastes.Bioresource Technology. 100: 1903–1909
Campos, E., Jordi, P., Xavier, F. 1999. Proceedings of the II International Symposium on AnaerobicDigestion of Solid Waste. Barcelona. Junio Pp. 192-195.
ElMahgary, Y. 2009. Modern Technology from Nordic Countries for AD of Industrial Bio-waste &Wastewater Treatment. Regional and Industrial Pollution and Co2 Emission Abatement Project forArab Countries.
Ezeoha, S. L and Idike, F. I. 2007. Biogas production potential of cattle paunch manure.Journal ofAgricultural Engineering and Technology (JAET).15:25-31.
Jagadish,H. P., Malourdu, A.,Gavimath, C.,Vinay, R. 2011. Comparative study on anaerobic co-digestionof water hyacinth with poultry litter and cow dung. Int. Journal of Chem. Sc. and App.2(2): 148-155.
Kasisira, L. L and Muyiiya, N. D. 2009. Assessment on the effect of mixing pig and cattle dung on biogasproduction. Agric. Eng. Inter.: The CIGR e-J., Article No.6.
Magbanua, B. S., Thomas, T. A., Philip, J. 1999. Proceedings of the 1999 Georgia Resources Conference,Held March 30-31, 1999, at the University of Georgia.
Marchaim, U. 1992. Biogas Processes for Sustainable Development. Publications Division, Food andAgriculture Organization of the United Nations, VialedelleTerme di Caracalla, Rome, Italy.http://www.fao.org/docrep/t0541e/t0541e06.htm.Retrieved on 25/3/2011.
Mata-Alvarez, J., Mac_e, S., Llabr_es, P. 2000. Anaerobic digestion of organic solid wastes.An overviewof research achievements and perspectives.Bioresour.Technol. 74, 3–16.
Molinuevo, B., Ma Cruz G., Ma Cristina, L., Milagros, A.citores. 2009. Anaerobic co-digestion of animalwastes (poultry litter and pig manure) with vegetable processing wastes Agricultural TechnologicalInstitute of Castilla and Leon, Finca Zamaduenas, Valladolid, Castillaand Leon, Spain.
Neves, L., Oliveira, R., Alves, M.M. 2009. Co-digestion of cow manure, food waste and intermittentinput of fat. Bioresource Technology, 100:1957–1962.
Ofoefule, A. U., Eme, E. L., Uzodinma, E. O., Ibeto, C.N., 2010. Comparative study of the effect ofchemical treatments on cassava peels for biogas production. Scientific Research and Essay,5(24):3808-3813.

Journal of Agricultural Engineering and Technology (JAET), Volume 20 (No. 1) June, 2012
Nigerian Institution of Agricultural Engineers © www.niae.net 79
Saev, M., Koumanova, B., Simeonov, I. 2009. Anaerobic co-digestion of wasted tomatoes and cattledung for biogas production.Journal of the University of Chemical Technology and Metallurgy,44(1):55-60.
Salminen, E. and Rintala, J. 2002. Anaerobic digestion of organics solid poultry slaughterhouse waste – areview. Bioresource Technology, 83(1):13–26.
Vindis, P., Mursec, B., Janzekovic, M., Cus, F. 2009.The impact of mesophilic and thermophilicanaerobic digestion on biogas production.Journal of achievements in materials and ManufacturingEngineering, 38 (2): 192-198.
Vivekanandan., S. and Kamaraj, G. 2011. Effect of co-digestion of cow dung with rice chaff, rice strawand rice husk in biogas production using anaerobic digestion. International Research Journal ofBiotechnology, 2(5)114-118.
Wei W. 2007. Anaerobic co-digestion of biomass for methane production. Recent research achievements.www.weirecentresearchachievements. Retrieved on 17th June 2010.
Yusuf, M.O. L., Debora, A., Ogheneruona, D.E. 2011. Ambient temperature kinetic assessment of biogasproduction from co-digestion of horse and cow dung.Res. Agr. Eng, 57(3): 97–104.
Journal of Agricultural Engineering and Technology (JAET), Volume 20 (No. 1) June, 2012
Nigerian Institution of Agricultural Engineers © www.niae.net 80
DEVELOPMENT OF A PEDAL PUMP FOR IRRIGATION
M.T. IqbalDepartment of Agronomy and Agricultural Extension,
Faculty of Agriculture, University of Rajshahi,Rajshahi-6205, Bangladesh
Email: [email protected]
ABSTRACT
Manual pump is popular among small and marginal farmers of Bangladesh. Amid the manual pumps, thefarmers predominantly use treadle pumps. It was found from study that the present structural design, theoperation of the pump is tedious and at the same time very ineffective, which needs necessarymodifications. An improved version of treadle pump called pedal pump was designed and fabricated atAgricultural Engineering Division of Bangladesh Sugarcane Research Institute. Two pistons of anordinary two-cylinder treadle pump were connected with a crankshaft having a flywheel on one end and achain sprocket on the other. The crankshaft was powered through a chain sprocket from the pedal of thebicycle and rotated by the foot of the operator seating on the seat. The discharge of the designed pedalpump was between 60 and 100 liters per minute, average command area is 0.2 hectare for 8 hours per dayoperation, and it could lift water from seven-meter depth. The designed pedal pump could also lift surfacewater.
KEYWORDS: Manual pump, treadle pump, surface water, ground water, crankshaft, irrigation.
1. INTRODUCTION
Bangladesh is basically an agricultural country. About 80 percent of the total population lives in ruralareas and 80 per cent of them are involved with agricultural activities. In Bangladesh out of 3693.92thousand hectare irrigated area 363.15 thousand hectare has been brought under traditional irrigationappliances (BBS. 2000). About 0.035 million hectares is irrigated by manual irrigation pumps. Most ofthe manual pump lifts water from the subsurface ground water. Where the static water level allows theuse of manual pump, there is large potentiality to use the manual pumps (Alam and Salimulla, 1991).Moreover a large number of Bangladeshi farmers have small and fragmented landholdings that also suitmanual pumps.
A few manually operated pumps have been developed by different organizations in the past. One was theTreadle pump, designed and fabricated by RDRS in 1980 and popularized and disseminated among thefarmers by the same organization for small-scale irrigation. Small and marginal farmers using manualpumps allocate the available resources like capital, labour, water and land to irrigate crops based onexperience and intuition. In crop diversification, manual pumps can play a vital role in irrigating non-riceupland crops (Islam et al, 1989). Studies reveal that treadle and rower pumps can be used for small-scaleirrigation with viable economic returns (Islam et al, 1989). Pumps operated by electric motors or enginesare efficient but not within the reach of many small and marginal farmers due to high initial andoperational costs. The deep and shallow tube wells now being used in Bangladesh are expensive andassociated with high price of spare parts and mechanical problems. Also, the high price of electricity anddiesel make farmer to use manual pumps. The irrigation efficiency has also been reported to be below30% of their total capacity (Baqui, 1980).
Opinion about some suggestions for necessary modifications of treadle pump was established. It wasfound that with the existing structural design the operation of the treadle pump is tedious and at the sametime less effective (Taher et al, 1987). Treadle pump is a miracle in the context of irrigation problems ofBangladesh. Hence, the treadle pump, in an area of abundant labor and fragmented land, is a perfectirrigation medium for rich and poor farmers alike (Alastair et al, 1987). Among three tested manually

Journal of Agricultural Engineering and Technology (JAET), Volume 20 (No. 1) June, 2012
Nigerian Institution of Agricultural Engineers © www.niae.net 81
operated pumps, BRRI diaphragm pump was found the best in respect of cost, capacities, ergonomics andcommand area compared to those No.6 Hand pump and Rower pump. They also reported that thecapacities of BRRI diaphragm pump, No.6 Hand pump and Rower pump were 105, 33 and 41 liter/min atthe suction head of 4.6m (Taufiqul et al, 2001). Considering the problems of treadle pump such asoperating time, lower capacity, slipping out of operator’s foot from the bamboo treadles, muscle stiffnessof the operator’s foot, human drudgery, and lack of technical knowhow, it was felt that the technologicalaspects of such pumps are to be evaluated before the farmers are exploited by the propaganda of theinvestors.
In order to improve the working efficiency of treadle pump, the pedal operated pump has been designedand developed. This paper reports the design and operation of the pump.
2. MATERIALS AND METHODS
Before designing the pedal pump, various available manually operated pumps were studied to assess theirsuitability for pedal operation. Treadle pump was selected to convert into pedal pump. In order to improvethe working efficiency of treadle pump, the pedal operated pump has been redesigned and developed.Slight change in Treadle pump has been made and changed completely to bicycle operated system. Twopistons of an ordinary two-cylinder pump were connected with a crankshaft that has a flywheel on oneend and a chain sprocket on the other end. The crankshaft is powered through a chain sprocket from thepedal of the bicycle that is rotated by foot of the operator seating of the seat just like driving a bicycle.Flywheel was used to balance moment of inertia and input manual power. Pedal pump, as a modificationof treadle pump, was first designed and developed at limited scale to remove the difficulties in operating atreadle pump by the operators so that the operator can operate the improved version of the treadle pumpwith greater comfort. So, the redesigned developed pedal pump is a bicycle operated, lightweight, cheaperirrigation device may be useful for most farmers.
3. RESULTS AND DISCUSSION
A pictorial view of the pedal pump is shown in Figure.1. Rotational motion of the flywheel is convertedto suction mode with the help of the piston. By adding extra mass, inertia of motion of the wheel isincreased.
Fig. 1: The pedal pump

Journal of Agricultural Engineering and Technology (JAET), Volume 20 (No. 1) June, 2012
Nigerian Institution of Agricultural Engineers © www.niae.net 82
The pedal pump was fabricated jointly with the Local workshop named as Kona Engineering andworkshop of the Agricultural Engineering Division of Bangladesh Sugarcane Research Institute. Thispedal pump is an improved version of treadle pump, which is pedal operated, lightweight and low cost. Itcan lift water from the well up to 7 (seven) meters down from the surface. It can also lift water fromsurface water storage such as ponds, rivers and canals when the water level is within 7 meters. Thedischarge is in between 60 and 100 liters per minute. The average command area is 0.2 hectare for 8hours per day operation for sugarcane, paddy, wheat and vegetables. Materials and the cost for fabricationof a Pedal Pump are shown in Table 1.
Table 1. Cost and Material Requirement for Fabrication of the Pedal Pump
S/No. Description Quantity Cost (Tk.)1. G.I. Sheet 18 BWG 2.5 kg. 115.002. Plastic Bucket (for pump) 2 Nos. 14.003. Check valve 2 Nos. 20.004. Bicycle gear 1 No. 110.005. Bicycle spindle 2 Nos. 12.006. Bicycle Pedals 2 Nos. 10.007. Bicycle Seat 1 No. 90.0088. Bicycle free wheel 1 No. 65.009. Bicycle Seat Pillar 1 No. 10.0010. B.B. Socket 1 No. 35.0011. Bicycle quarter Pin 2 Nos. 6.0012. Bicycle B.B. Socket Cap 1 No. 7.0013. Bicycle B.B. Spindle 2 Nos. 70.0014. Bicycle Ball (big size) 2 Nos. 6.0015. Bicycle bearing 6203 4 Nos. 320.0016. Bicycle Chain 2 Nos. 100.0017. M.S. Rod for flywheel & crank shaft 19 kg. 330.0018. G.I. Pipe (3.8 cm. dia) 2 ft. 45.0019. M.S. Angle and Flat bar 9 kg. 160.0020. G.I. Pipe (2.54 cm. dia) 1 ft. 55.0021. Welding rod (8/10 size) 35 ft. 80.0022. Nuts and Bolts - 20.0023. Fabrication charge (Labour,
welding, bending, finishing andcolouring).
- 270.00
1 USD = Tk.70 TotalTk.
2000.00
Total cost of Tk.2000 (US$29) was required for fabricating a pedal pump. The cost of manufactured pedalpump can be reduced for large-scale fabrication of the pump. Readily available spare parts of bicyclewere used to fabricate the pump. It was found from observation that the designed pump is much easier,efficient and durable than the Treadle pump. Though the price of a pedal pump is higher than the treadlepump, but the small and marginal farmers due to its superior advantages may accept the former. Thispump can be manufactured locally from low-cost spare parts of bicycle and other materials available atany place of Bangladesh. It can be operated by using family labour (both male and female) and also canbe taken to the house every day after irrigating land to prevent pilferage.
The pedal pump was also used for lifting surface water. A plate (Flat bar 50 cm 50 cm size) is used tothe bottom of the pump for fielding the pump. A T-socket is used at the suction of the pump to connectsuction pipe.

Journal of Agricultural Engineering and Technology (JAET), Volume 20 (No. 1) June, 2012
Nigerian Institution of Agricultural Engineers © www.niae.net 83
Pedal pump has a potentiality to use as a small-scale irrigation device opined by farmers. Operation of thepedal pump, as perceived by the farmers is much easier and comfortable than treadle pump.
4. CONCLUSIONS AND RECOMMENDATIONS
The following conclusions and recommendation are derived from the studies:(i) The pedal pump may be advantageous for the small and marginal farmers in meeting their irrigation
demand if the price is reduced.(ii) Operation of the pedal pump, as perceived by the farmers is much easier and comfortable to use
than treadle pump.(iii) Further research should be undertaken to redesign the pump so that the present per unit price is
reduced substantially.(iv) Large-scale demonstration and supply of pedal pumps through credit should be undertaken by
NGOs and Extension workers (DAE) for rapid adoption of the pedal pump by the farmers.
ACKNOWLEDGEMENT
The author is thankful to Kona Engineering Workshop, Ishurdi and Agricultural Engineering Workshopof Bangladesh Sugarcane Research Institute for manufacturing the pedal pump. Also, the author wishes toexpress his gratitude to the Ministry of Science and Technology, Government of the People’s Republic ofBangladesh for supporting this research.
REFERENCES
Alam, M and M. Salimullah, 1991. Socio-economic Impact of Manual Pump (MIP) based Agriculture inBangladesh, p.1.
Alastair, O., Islam, N. and Barnes, G. 1989. The treadle pump-Manual Irrigation for small farmers inBangladesh. International Development Enterprises.pp.3-7.
BBS, 2000. Bangladesh Bureau of Statistics. Published from Statistics Department of Bangladesh.Baqui, M.A. 1980. Development of diaphragm pump for low lift irrigation, AMA, Vol.No.1.Farm
Machinery Industrial Research Crop 7-2 kanda nishincho,chijaoda ku, Tokyo, Japan.Islam, M.S, M.H. Rashid, M.A. Mazed, M.I. Hossain and T.M.K. Anwar.1989. Evaluation and Extension
of Different Manual Pumps in the Farmers field, Irrigation and Water Management Division, BARI,Joydebpur, Gazipur, Bangladesh, pp.32.
Islam, M.S, M.H. Rashid, M.A. Mazed, M.I. Hossain and P.K. Shaha.1991. Evaluation and Extension ofDifferent Manual Pumps in the Farmers field, Irrigation and Water Management Division, BARI,Joydebpur, Gazipur, Bangladesh,pp.7-9.
Taher, A., Kanti, D.D., Nazrul, S.M. and Uddin, A.K.1987. Treadle Pump: Assessment of EngineeringAspects. Journal of the Institution of Engineers, Bangladesh. Vol.15.No.1. January. p.23-30.
Taufiqul, M.I., Zami, A.M., Rahman, M.M. and Islam, M.A. 2001. Comparative Performances of ThreeManually Operated Pumps, AMA, vol.32.No.1. Farm Machinery Industrial Research Crop 7-2 kandanishincho, chijaoda ku, Tokyo, Japan.p.28-30.

Journal of Agricultural Engineering and Technology (JAET), Volume 20 (No. 1) June, 2012
Nigerian Institution of Agricultural Engineers © www.niae.net 84
DESIGN, CONSTRUCTION AND TESTING OF A DRAINAGE LYSIMETER
M. E. Okechukwu and C. C. MbajiorguDepartment of Agricultural and Bioresources Engineering
Faculty of Engineering, University of Nigeria, Nsukka, [email protected], [email protected]
ABSTRACT
A drainage lysimeter of 2m × 1.6m surface area with a depth of 1.7m was designed, constructed, andtested. The materials for construction were 2mm (thick) metal sheets, soil pebbles/gravel and stones. Thelysimeter was tested, by using it to estimate the crop evapotranspiration of African spinach (AmaranthusCruentus) in Nsukka in Southeastern Nigeria, using the water balance equation. The crop was irrigateddaily using a watering can, and the lysimeter was used to monitor rainfall, drainage, and soil moisture.The daily data generated were used to calculate crop evapotranspiration (ETc Lysimeter) from the waterbalance equation from mid February and to March 2011. Climatic data obtained for the same period wereprocessed to evaluate ETc using the FAO Penman Monteith (ETc PM) method. Also pan evaporationmeasurements made during the period were used to obtain crop evapotranspiration (ETc Pan) by the PanEvaporation method. The crop evapotranspiration from the lysimeter (ETc Lysimeter) was found to be atotal of 185.37mm, while that of Penman Monteith (ETc PM) and pan evaporation (ETc Pan) were188.56mm and 143.12mm respectively. The difference between lysimeter ETc value and the valueobtained by the FAO Penman Monteith method was quite insignificant statistically while that betweenPan Evaporation and Lysimeter methods were found to be statistically different at 5% level ofsignificance. Improper placement of the evaporation pan, and lack of screening to shield birds and rodentsfrom the pan, may compromise ETc values by the Pan Evaporation method.
KEYWORDS: Lysimeter, crop evapotranspiration, African spinach, drainage.
1. INTRODUCTION
The term lysimeter is derived from Greek words "lysis", which means dissolution or movement and"metron" which means to measure (Aboukhaled et al., 1982). Therefore, the word lysimeter means themeasurement of movement of water in the soil; a lysimeter is a container which is set into the soil toseparate a particular soil volume which is observed and analyzed. Researchers have pressed steelcylinders over an exposed soil column (Brown et al 1985; Maeshkat et al., 1999). The majority of thesemethods yield cores that are too small in either area or depth to fully encompass the root zone of severalactively growing crops like maize. Disturbed lysimeters can be used, but they must represent the horizondistribution of the original soil, and must be conditioned for several months prior to the use.
There are two major types of lysimeters; the weighing and the non-weighing or drainage lysimeters.Although, weighing lysimeters have been used extensively for evapotranspiration research in the UnitedStates and other countries, lysimeter designs have varied widely. The design variability is due to area ofstudy, differing objectives and improvement and refinement on the existing ones (Howell et al., 1985).The use of lysimeters is a proven method for measuring movement of water and chemicals through thesoil profile (Nathan et al., 2002). Field measurements of crop water use are usually made to takesimultaneous account of both plant transpiration and soil evaporation (Klocke et al., 1985). Transpirationis a vital function of plant life, and soil evaporation is the amount of water lost directly from the soil to theatmosphere. The proper monitoring, use and management of limited water resources is a sure way toproffer solutions to water wastage, food shortage and poor crop yields. Lysimeters are the most reliableresearch tool for direct evaluation of evapotranspiration (Burman and Pochop, 1994).
Hylckama, (1980) reported that John Dalton in 1796 was the first to construct lysimeter for evaporationand evapotranspiration studies by figuring the difference between water input and output while Kohnke et

Journal of Agricultural Engineering and Technology (JAET), Volume 20 (No. 1) June, 2012
Nigerian Institution of Agricultural Engineers © www.niae.net 85
al., (1940) reported that the first lysimeter study for water use was by De la Hire of France in the late 17th
century. Today, lysimeter designs have been copied or duplicated even for various research interests andno one construction should be regarded as a standard lysimeter. The proper design can be made only byhaving an accurate knowledge of both the purpose of the experiment including geologic and climaticconditions (Kohnke et al, 1940).
In drainage or non-weighing lysimeters, changes in water balance are measured volumetrically daily orweekly. No accurate daily estimates can be obtained. Irrigation water is applied to the lysimeter and alayer of pebbles is placed at the bottom to facilitate easy drainage. Excess water is collected from belowat a suitable distance. A number of crops can be grown in a concentric pattern around a central drainagechamber. A simple lysimeter can be built at low cost from a petrol drum. A tube with a small diameter isplaced through the soil to the layer of pebbles to remove excess water at frequent intervals.
The objective of this study was to design and build a drainage lysimeter and to use it to estimate cropevapotranspiration of African Spinach in Nsukka.
2. MATERIALS AND METHODS
2.1 The Project Site
The lysimeter is located in a research farm behind the Prefab classroom Building of the Agricultural andBioresources Engineering Department, University of Nigeria, Nsukka (UNN). It covers about 3.3 squaremeters area of land. Nsukka is located on longitude 7022'E and latitude 5050'N in the South Eastern part ofNigeria (Ezenne et al., 2010). It is in the humid tropical climatic region and is characterized by twodistinct seasons (wet and dry seasons). The wet season occurs mainly between April and October whilethe dry season is experienced during the remaining months of the year (November to March). The area isknown to be endowed with sandy loam type of soil and the major occupation of the local residents is(peasant) farming which occurs mainly during wet season while few of them engage in vegetable farmingduring dry season especially those living around the rivers. But, due to high demand and cost ofvegetables, farmers even buy water in tanks to irrigate their farms in order to make good use of the periodto make more money.
The site was cleared of its previous vegetation in preparation for the installation of the lysimeter. Theactual surface area of installation is 3.28m2, but the cropped area covers about 5m2 to curb the problemsof boundary effects and to maintain more natural environment within the lysimeter. Such border effectsinclude intruders like human beings, rodents or animals, pests, insects etc. Insecticides and pesticideswere also sprayed in and around the whole area to prevent the crops from being attacked by insects andpests. The area was marked out with pegs to outline the actual area of lysimeter and the entire area ofcultivation. Before installation, excavation was done manually by hired labourers to about 4m2 of surfacearea by 2m deep, to allow some space for convenience to install the lysimeter manually.
The African Spinach were uprooted from the nursery bed and transplanted in and outside the lysimeter, tomaintain homogeneity in and around the lysimeter. The uprooting was easy as the nursery bed washeavily mixed with manure and made the soil pulverized. Irrigation of the nursery was done with a hoseconnected to an overhead tank and gradually runs freely under gravity to the bed without much impact onthe soil when compared to rainfall. The transplant spacing was 30cm by 15cm.
2.2 Design, Construction and Operation of the Lysimeter
Factors considered in designing the lysimeters include; typical vegetable production practices in Nsukka;size and materials for the lysimeter; and measurements of water input and output. Typically AfricanSpinach (Amaranthus Cruentus) production in southeast Nigeria involves growing the crop on raised bedsmulched with dried leaves to retain moisture during dry season, and also to reduce soil erosion and

Journal of Agricultural Engineering and Technology (JAET), Volume 20 (No. 1) June, 2012
Nigerian Institution of Agricultural Engineers © www.niae.net 86
leaching of nutrients in wet season. The depth of lysimeter is 1.7m, chosen to cover the entire root zone ofmost local vegetables. The bottom of the lysimeter was filled with gravel and pebbles, and sandy soil toease drains, before filling the lysimeter with the same local soil in the reverse order (i.e. last out first inand first out last in) in which it was excavated and heaped in segments to differentiate each segment whenrefilling the lysimeter in order to maintain same natural soil structure or arrangement. The lysimeter ( seeFig.1) consists of two sections joined together, the top section and the bottom section. The top section hasthe shape of a cuboids or rectangle with a surface area of 3.28m2 and a depth of 1.7m.The bottom sectionof the lysimeter has a shape of a pyramid with an opening at its apex for drainage when turned upsidedown. It was designed to have enough depth to accommodate the rooting depth of most vegetable cropsand the surface area will contain a good number of crops. (Shukla et al., 2007). Figure 2 shows the firstangle projection of the lysimeter.
Gravel of 40mm thick was placed inside the pit and was compacted with a rammer to provide a stablefoundation before installing the lysimeter. A worn out vehicle tyre was also placed horizontally at theprotruding end of the lysimeter to absorb the impact of weight after installation. The gravel was carefullyplaced to support the protruding end of the lysimeter where the drain pipe passes through. The outsidelysimeter was first filled with soil to give support and level to the ground surface. In order to prevent soilparticles from falling into the lysimeter and causing blockade through the drainage outlet, a mesh size of0.21 mm was placed at the bottom of the lysimeter to act as a filtering mechanism and facilitator ofdrainage, before putting the pebbles on top.
Fig 1. The lysimeter set-up
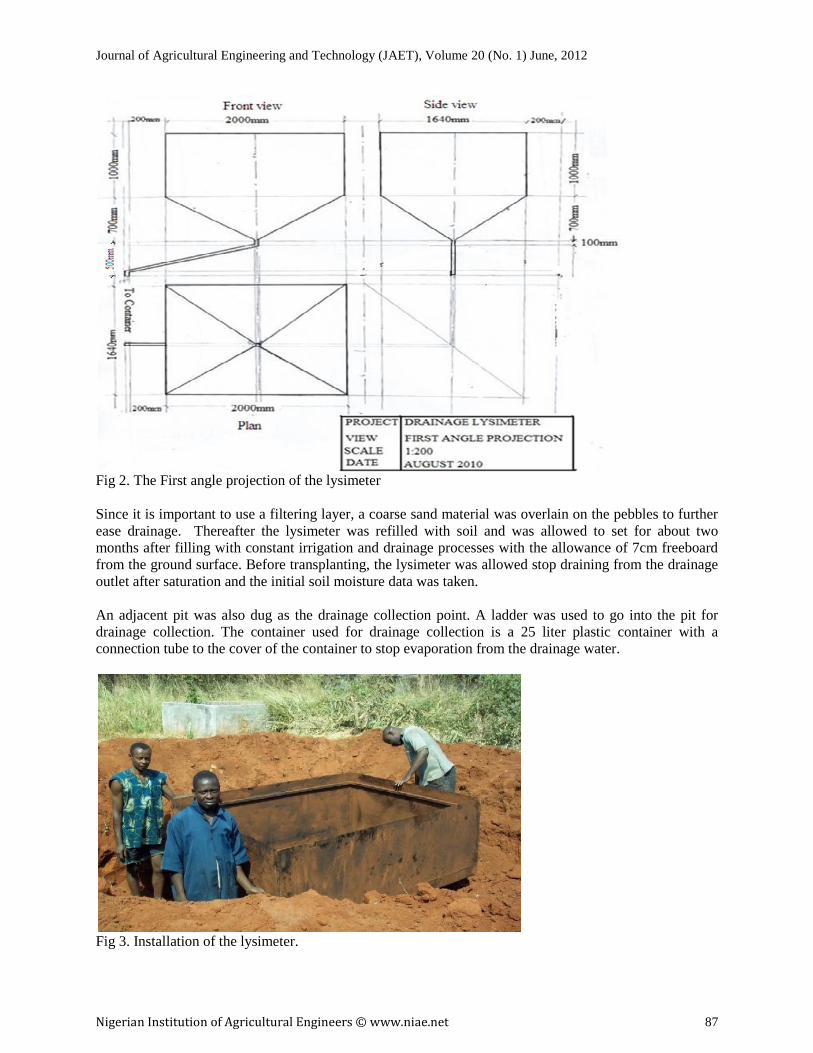
Journal of Agricultural Engineering and Technology (JAET), Volume 20 (No. 1) June, 2012
Nigerian Institution of Agricultural Engineers © www.niae.net 87
Fig 2. The First angle projection of the lysimeter
Since it is important to use a filtering layer, a coarse sand material was overlain on the pebbles to furtherease drainage. Thereafter the lysimeter was refilled with soil and was allowed to set for about twomonths after filling with constant irrigation and drainage processes with the allowance of 7cm freeboardfrom the ground surface. Before transplanting, the lysimeter was allowed stop draining from the drainageoutlet after saturation and the initial soil moisture data was taken.
An adjacent pit was also dug as the drainage collection point. A ladder was used to go into the pit fordrainage collection. The container used for drainage collection is a 25 liter plastic container with aconnection tube to the cover of the container to stop evaporation from the drainage water.
Fig 3. Installation of the lysimeter.

Journal of Agricultural Engineering and Technology (JAET), Volume 20 (No. 1) June, 2012
Nigerian Institution of Agricultural Engineers © www.niae.net 88
The irrigation system used in applying water to the crop is of the manual sprinkler type (watering can). Aknown volume of water was always measured out and gradually applied to the crops at 7am daily. Thiswas done uniformly until the measured irrigation water is exhausted. The irrigation was monitored bymeasuring out the quantity of water in a calibrated container before application. The lysimeter is drainedby gravity and drainage water captured from the adjacent pit through a drain pipe was measured in ameasuring cylinder. The volume is also divided by the surface area of the lysimeter. The changes in thesoil moisture were determined by gravimetric method in the Soil and Water Laboratory of the Departmentof Agricultural and Bioresources Engineering, University of Nigeria Nsukka. The installed equipmentsare rain gauage, class A evaporation pan, other data were collected from a nearby weather station atCenter for Basic Space Science, University of Nigeria Nsukka. The data are relative humidity, solarradiation, air temperature, windspeed and wind direction. The data were taken every 5 minutes andcomputed average daily values were used in the study.
The cropped area was heavily applied with organic manure (poultry droppings) at the rate 25 tonnes perhectare following the recommendation of plant Uguru, (1996). The transplant spacing was 30cm by15cm, although, Uguru, (1996) suggested that closer spacing are preferred when the crops are grown forfresh leaves because it suppresses branching and encourages the development of larger and moresucculent leaves with market value.
Fig 4 Lysimeter planted with African spinach.
Weeding was done almost on daily basis during the course of this study. This is because, weeds do notonly compete with the crops for space and nutrients but also, transpire at a rate which affect, negativelythe result of the evapotranspiration studies. African Spinach is known to have matured when it startsflowering but, because it is vegetable crop with interest on the leaves, it can be harvested even beforeflowering. The reasons are that its greenish colour and freshness matters. The succulent shoot is due forharvest within three to six weeks of sowing depending on the variety and the environmental conditions assuggested by Uguru, (1996).
2.3 Measurements and Statistical Analysis
The crop evapotranspiration (ETc) for African spinach were estimated using three different methods.They are lysimetric method, Pan Evaporation method and the FAO Penman Monteith method. Astatistical package (Gen Stat) with One-way ANOVA without blocking was further used to test the levelof significance (Gen Stat, 2007). The days of planting was considered as the replications while ETclysimeter, ETc Pan and ETc Penman Monteith were the treatments.

Journal of Agricultural Engineering and Technology (JAET), Volume 20 (No. 1) June, 2012
Nigerian Institution of Agricultural Engineers © www.niae.net 89
3. RESULTS AND DISCUSSION
Results of the estimation are presented in Tables 1, 2 and 3. In Table 2, the daily evaporation values weremultiplied with the pan coefficient (0.8) to get the reference evapotranspiration which was furthermultiplied with the crop coefficient to get the crop evapotranspiration. For the spinach, crop coefficientfor the development stage or mid season is 1, while the late season is 0.95.
Table 1. ETc from the water balance of the lysimeter (15 February - 18 March 2011)
Days Irrigation(mm) Drainage(mm) Moisture(mm)ETcLysi(mm/d)
1 38.41 19.39 13.47 5.552 27.43 6.94 17.26 5.233 19.93 5.5 9.18 5.254 32.93 18.72 7.97 5.245 13.72 0 7.77 5.956 27.43 11.16 10.24 6.037 19.2 2.36 10.79 6.058 32.93 14.88 12.1 5.959 27.43 8.71 12.99 5.73
10 19.2 3.55 9.7 5.9511 19.2 2.99 10.25 5.9612 27.43 10.97 10.51 5.9513 32.93 11.95 15.2 5.7814 32.93 7.65 19.32 5.9615 27.43 4.94 19.5 5.9916 27.43 4.57 16.66 6.0617 27.43 7.23 14.22 5.9818 27.43 9.43 12.01 5.9919 19.2 1.91 11.31 5.9620 27.43 7.15 14.29 5.9921 32.93 9.25 17.72 5.9622 32.93 5.09 21.61 6.2323 27.43 1.01 20.43 5.9924 27.43 2.7 18.43 6.325 27.43 4.07 17.31 6.0526 19.2 1.2 12.93 6.0727 19.2 1.34 12.41 6.4528 19.2 3.26 9.54 6.429 27.43 2.75 18.3 6.3830 27.43 6.91 14.11 6.4131 27.43 5.25 15.6 6.58
Sum 815.49 202.83 433.13 185.37Average 50.96813 12.67688 27.07063 11.58563Note: The days represent days after transplanting (DAT), which started on (15/02/2011 to17/03/2011)
while irrigation, drainage and moisture.
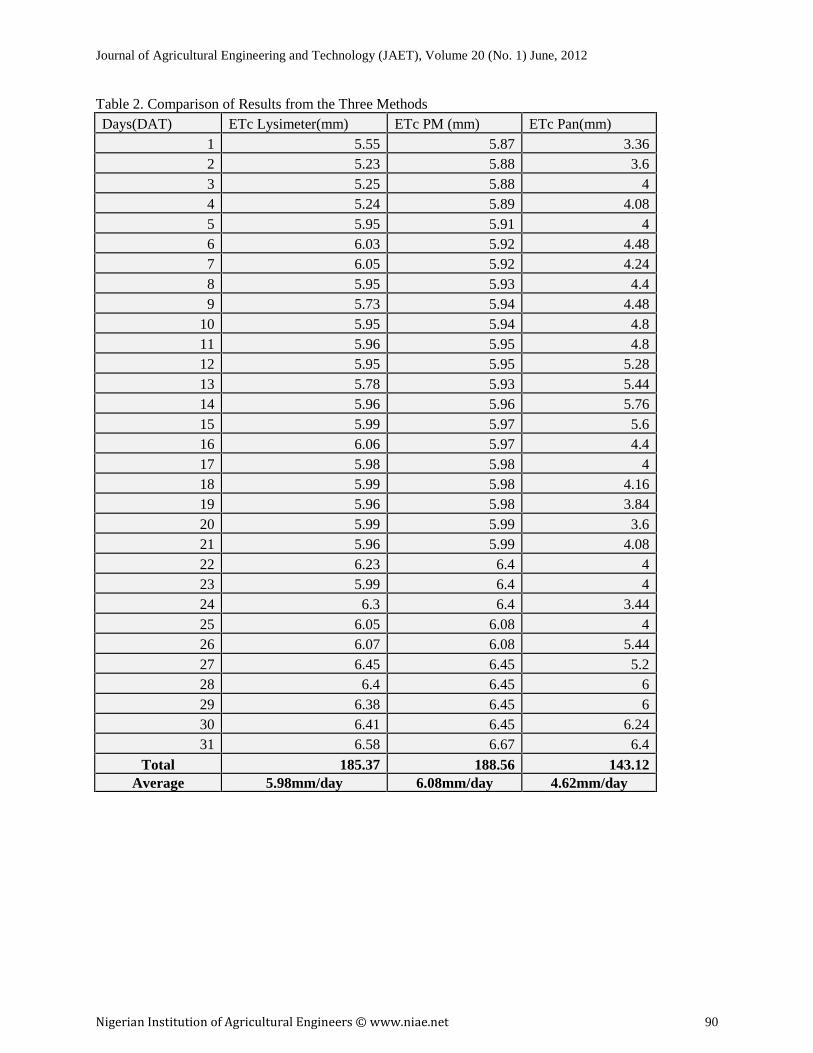
Journal of Agricultural Engineering and Technology (JAET), Volume 20 (No. 1) June, 2012
Nigerian Institution of Agricultural Engineers © www.niae.net 90
Table 2. Comparison of Results from the Three MethodsDays(DAT) ETc Lysimeter(mm) ETc PM (mm) ETc Pan(mm)
1 5.55 5.87 3.362 5.23 5.88 3.63 5.25 5.88 44 5.24 5.89 4.085 5.95 5.91 46 6.03 5.92 4.487 6.05 5.92 4.248 5.95 5.93 4.49 5.73 5.94 4.48
10 5.95 5.94 4.811 5.96 5.95 4.812 5.95 5.95 5.2813 5.78 5.93 5.4414 5.96 5.96 5.7615 5.99 5.97 5.616 6.06 5.97 4.417 5.98 5.98 418 5.99 5.98 4.1619 5.96 5.98 3.8420 5.99 5.99 3.621 5.96 5.99 4.0822 6.23 6.4 423 5.99 6.4 424 6.3 6.4 3.4425 6.05 6.08 426 6.07 6.08 5.4427 6.45 6.45 5.228 6.4 6.45 629 6.38 6.45 630 6.41 6.45 6.2431 6.58 6.67 6.4
Total 185.37 188.56 143.12Average 5.98mm/day 6.08mm/day 4.62mm/day

Journal of Agricultural Engineering and Technology (JAET), Volume 20 (No. 1) June, 2012
Nigerian Institution of Agricultural Engineers © www.niae.net 91
Figure 5. Calculated evapotranspirations of the three different methods for the planting periods
The summary of the result with the analysis of variance (ANOVA) is shown in Table 5.
Table 3 Summary of the ANOVASource of variation d.f. s.s. m.s. v.r. F pr.
Treatment 2 41.5057 20.7529 66.78 <.001
Residual 90 27.9694 0.3108
Total 92 69.4751
Figure 6. Linear regressions of ETc lysimeter and ETc Penman Monteith
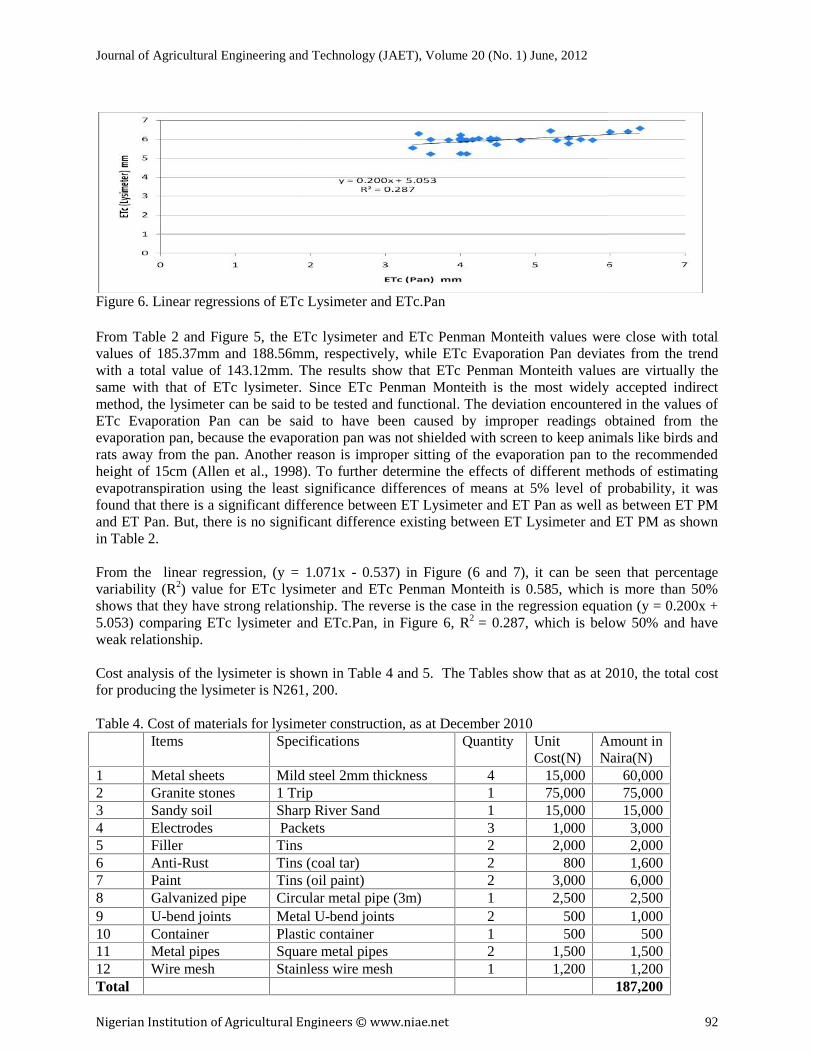
Journal of Agricultural Engineering and Technology (JAET), Volume 20 (No. 1) June, 2012
Nigerian Institution of Agricultural Engineers © www.niae.net 92
Figure 6. Linear regressions of ETc Lysimeter and ETc.Pan
From Table 2 and Figure 5, the ETc lysimeter and ETc Penman Monteith values were close with totalvalues of 185.37mm and 188.56mm, respectively, while ETc Evaporation Pan deviates from the trendwith a total value of 143.12mm. The results show that ETc Penman Monteith values are virtually thesame with that of ETc lysimeter. Since ETc Penman Monteith is the most widely accepted indirectmethod, the lysimeter can be said to be tested and functional. The deviation encountered in the values ofETc Evaporation Pan can be said to have been caused by improper readings obtained from theevaporation pan, because the evaporation pan was not shielded with screen to keep animals like birds andrats away from the pan. Another reason is improper sitting of the evaporation pan to the recommendedheight of 15cm (Allen et al., 1998). To further determine the effects of different methods of estimatingevapotranspiration using the least significance differences of means at 5% level of probability, it wasfound that there is a significant difference between ET Lysimeter and ET Pan as well as between ET PMand ET Pan. But, there is no significant difference existing between ET Lysimeter and ET PM as shownin Table 2.
From the linear regression, (y = 1.071x - 0.537) in Figure (6 and 7), it can be seen that percentagevariability (R2) value for ETc lysimeter and ETc Penman Monteith is 0.585, which is more than 50%shows that they have strong relationship. The reverse is the case in the regression equation (y = 0.200x +5.053) comparing ETc lysimeter and ETc.Pan, in Figure 6, R2 = 0.287, which is below 50% and haveweak relationship.
Cost analysis of the lysimeter is shown in Table 4 and 5. The Tables show that as at 2010, the total costfor producing the lysimeter is N261, 200.
Table 4. Cost of materials for lysimeter construction, as at December 2010Items Specifications Quantity Unit
Cost(N)Amount inNaira(N)
1 Metal sheets Mild steel 2mm thickness 4 15,000 60,0002 Granite stones 1 Trip 1 75,000 75,0003 Sandy soil Sharp River Sand 1 15,000 15,0004 Electrodes Packets 3 1,000 3,0005 Filler Tins 2 2,000 2,0006 Anti-Rust Tins (coal tar) 2 800 1,6007 Paint Tins (oil paint) 2 3,000 6,0008 Galvanized pipe Circular metal pipe (3m) 1 2,500 2,5009 U-bend joints Metal U-bend joints 2 500 1,00010 Container Plastic container 1 500 50011 Metal pipes Square metal pipes 2 1,500 1,50012 Wire mesh Stainless wire mesh 1 1,200 1,200Total 187,200

Journal of Agricultural Engineering and Technology (JAET), Volume 20 (No. 1) June, 2012
Nigerian Institution of Agricultural Engineers © www.niae.net 93
Table 5. Cost of Transportation and Labour as at December 2010S/N Item Specification Amount in Naira (N)1 Transport Transporting the materials from market
to the workshop.2,000
2 Transport Transporting the lysimeter from theworkshop to the site.
2,000
3 Excavation 3m×3m×3 (for the lysimeter) 25,0004 Excavation 2m×2m×4m (for the drainage pit) 25,0005 Installation Installation of the lysimeter 5,0006 Refilling Sand refilling of the lysimeter 15,000Total 74,000
The total cost of construction and installation of the lysimeter is N187,200 + 74,000 = 261,200.
4. CONCLUSIONS
The values of ETc determined from the lysimeter were validated by the FAO Penman Monteith method.The drainage lysimeter can be said to be functional and efficient to use. The study revealed that the cropevapotranspiration or crop water use of African spinach (Amaranthus Cruentus) in Nsukka SoutheastNigeria between the month of February and March is 185.37mm. The significant difference shown by thecomparison with pan evapotranspiration data is believed to have been caused by improperplacement/protection of the evaporation pan. The total cost of producing the lysimeter as at November2010 was Two hundred and sixty-one thousand, two hundred Naira (N261,200.00).
REFERENCES
Aboukhaled A., Alfaro A, and Smith M. 1982. Lysimeters. FAO Irrigation and Drainage paper No. 39Rome p. 68.
Allen, R.G., Pereira, L.S., Raes, D., Smith, M. 1998. Crop evapotranspiration. Guidelines for computingcrop water requirements. FAO Irrigation and Drainage paper 56, Food and Agriculture Organizationof United Nations. Rome, Italy.
Brown K.W., Thomas J.C. and Aurelius M.W. 1985. Collecting and testing barrel sized undisturbed soilmonoliths. Soil Sc. Soc. Am. J. 49: 1067 – 1069.
Burman R.D. and Pochop L.O. 1994. Evaporation, Evapotranspiration and climate data. In developmentsin Atmospheric Science, 22 Amsterdam. The Netherlands: Elsevier Science.
Ezenne, G.I., C.C. Mbajiorgu and M.E. Okechukwu 2010. Managing Floods in Nsukka Urban withClimate Change Proceedings of Nigerian Union of Planetry and Radio Sciences (NURPS).Conference held at Lagos 2010. In press.
Howel, T.A., McComick, R.L., Phene, C.J. 1985. Design and installation of large weighing lysimeters.Trans. ASAE 28: 106 – 112, 117.
Hylckama V 1980. Weather and Evapotranspiration Studies in a Saltceder Thicket Arizona. USGeological Survey Professional Paper 491-E p 30.
Klocke N.L, Henermann D.F, Duke H.R. 1985). Measurement of Evaporation and Transpiration withLysimeters. Transactions of ASAE pp. 183 – 192.
Kohnke, H., Dreibelbis F.R., Davidson J.M. 1940. A survey and discussion of lysimeters and abibliography on their construction and performance. Misc. Publ. No. 372 US Dept. of Agric.,Washington DC. Pp 68.
Meshkat M, Warner R.C. and Walton L.R. 1999. Lysimeter design, construction and instrumentation forassessing evaporation from a large undisturbed soil monolith. Appl. Eng. Agric. 15: 303 – 308.
Nathan E.D, Knighton ER, and Montgomery R.B. 2002. Construction and performance of large soil corelysimeters Journal of American Society of Soil Science. Am. J. 66 pp. 1446 – 1453.

Journal of Agricultural Engineering and Technology (JAET), Volume 20 (No. 1) June, 2012
Nigerian Institution of Agricultural Engineers © www.niae.net 94
Shulka, J., Fouad, J., Saurabh, S., James K. 2007. Water use and crop coefficient for watermeter inSouthwest Florida. Southwest Florida Research and Education Center, Immokalee. Final Report No.WRP-LY-009. Institute of Food and Agricultural Sciences (IFAS) University of Florida FL34142.
Uguru M.I. 1996. Crop Production Tools, Techniques and Practice. Published by Fulladu PublishingCompany B. Umeano Estate Nsukka, Nigeria.

Journal of Agricultural Engineering and Technology (JAET), Volume 20 (No. 1) June, 2012
Nigerian Institution of Agricultural Engineers © www.niae.net 95
GUIDE FOR AUTHORS
Publication Schedule: The Journal of Agricultural Engineering and Technology (JAET) is publishedannually (two issues) by the Nigerian Institution of Agricultural Engineers (NIAE), A division of theNigerian Society of Engineers (NSE).
Published articles can be view at the Institution website: www.niae.net
Manuscript: The manuscript should be typed double spaced on A4 paper (216mm x 279mm) on oneside of the paper only, with left, right and top-bottom margins of 25.4mm. The original and three copiesare required for initial submission. The paper should not exceed 20 pages including Figures and Tables.Manuscripts are also accepted as attached file in MS word.
Organization of the Manuscript: The manuscript should be organized in the following order; Title,Author’s name and address including E-mail address and telephone number; Abstract; Keywords;Introduction; Materials and Methods; Results and Discussion; Conclusion; Notation (if any);Acknowledgements; References. The main headings listed above should be capitalized and left justified.The sub-headings should be in lower case letters and should also be left justified. Sub-sub headingsshould be in italics. All headings, sub-headings and sub-sub-headings should be in bold font. Headingsand sub-headings should be identified with numbers such as 1; 1.1; 1.1.1 etc. For the sub headings, thefirst letter of every word should be capitalized.
Title: The title should be as short as possible, usually not more than 14 words. Use words that can beused for indexing. In the case of multiple authors, the names should be identified with superscriptednumbers and the addresses listed according to the numbers, e.g. A. P. Onwualu1 and G. B. Musa2.
Abstract: An abstract not exceeding 400 words should be provided. This should give a short outline ofthe problem, methods, major findings and recommendations.
Keywords: There should be keywords that can be used for indexing. A maximum of 5 words is allowed.
Introduction: The introduction should provide background information on the problem including recentor current references to work done by previous researchers. It should end with the objectives andcontribution of the work.
Materials and Methods: This section can vary depending on the nature of the paper. For papersinvolving experiments, the methods, experimental design and details of the procedure should be givensuch that another researcher can verify it. Standard procedures however should not be presented. Rather,authors should refer to other sources. This section should also contain description of equipment andstatistical analysis where applicable. For a paper that involves theoretical analysis, this is where thetheory is presented.
Results and Discussion: Results give details of what has been achieved, presented in descriptive, tabularor graphical forms. Discussions on the other hand, describe ways the data, graphs and other illustrationshave served to provide answers to questions and describe problem areas as previously discussed underintroduction.
Conclusion: Conclusion should present the highlights of the solutions obtained. It should be a briefsummary stating what the investigation was about, the major result obtained and whether the result wereconclusive and recommendations for future work, if any.
Notation: A list of symbols and abbreviation should be provided even though each of them should beexplained in the place where it is used.

Journal of Agricultural Engineering and Technology (JAET), Volume 20 (No. 1) June, 2012
Nigerian Institution of Agricultural Engineers © www.niae.net 96
References: Follow the name-date system in the text, example: Ajibola (1992) for a single author;Echiegu and Ghaly (1992) for double authors and Musa et al. (1992) for multiple authors. All referencescited must be listed in alphabetical order. Reference to two or more papers published in the same year bythe same author or authors should be distinguished by appending alphabets to the year e.g. Ige (1990a,1992b). All references cited in the text must be listed under section “References”. For Journal, the orderof listing should be author’s name, year of publication, title of paper, name of journal, volume number,pages of the article: for books, the author’s name comes first followed by the date, title of book, edition,publisher, town or city of publication and page or pages involved. Examples are as follows:
Journal Articles: Ezeike, G. O. I. 1992. How to Reference a Journal. J. Agric Engr and Technology.3(1): 210-205
Conference Papers: Echiegu, E. A. and Onwualu A. P. 1992. Fundamentals of Journal ArticleReferencing. NSAE paper No 92-0089. Nigerian Society of Agricultural Engineers Annual Meeting,University of Abuja, Abuja – Nigeria.
Books: Ajibola O. 1992. NSAE: Book of abstracts. NSAE: Publishers. Oba. Abakaliki, Nigeria.
Book Chapter: Mohamed S. J., Musa H. and Okonkwo, P. I., Ergonomics of referencing. In: E. I. U.Nwuba (Editor), Ergonomics of Farm Tools. Ebonyi Publishing Company, Oshogbo, Osun State, Nigeria.
Tables: Tables should be numbered by Arabic numerals e.g. Table 3 in ascending order as reference ismade to them in the text. The same data cannot be shown in both Table and Figure. Use Table format tocreate tables. The caption should be self explanatory, typed in lower case letters (with the first letter ofeach word capitalized) and placed above the table. Tables must be referred to in the text, and positionedat their appropriate location, not at the end of the paper.
Figures: Illustrations may be in the form of graphs, line drawings, diagrams schematics andphotographs. They are numbered in Arabic numerals e.g. Figure 5.m. The title should be placed belowthe figure. Figures should be adequately labeled. All Figures and photographs should be computergenerated or scanned and placed at their appropriate locations, not at the end of the paper.
Units: All units in the text, tables and figures must conform to the International System of units (SI)
Reviewing: All papers will be peer reviewed by three reviewers to be appointed by the Editors. Theeditors collate the reviewers’ reports and add their own. The Editor-In-Chief’s decision on any paper isfinal.
Off Prints: A copy of the journal is supplied free of charge to the author(s). Additional reprints can beobtained at current charges.
Page Charges: The journal charges a processing fee of N1000 and page charges are currently N1000 perjournal page. When a paper is found publishable, the author is advised on the page charges butprocessing fee (non refundable) must be paid on initial paper submission. These charges are subject tochange without notice.
Submission of Manuscript: Submission of an article for publication implies that it has not beenpreviously published and is not being considered for publication elsewhere. Four copies of themanuscript and N1000 processing fee should be sent to:

Journal of Agricultural Engineering and Technology (JAET), Volume 20 (No. 1) June, 2012
Nigerian Institution of Agricultural Engineers © www.niae.net 97
The Editor-In-ChiefJournal of Agricultural Engineering and Technology (JAET)C/o The Editorial OfficeNational Centre for Agricultural Mechanization (NCAM)P.M.B. 1525, Ilorin, Kwara StateNigeria.
Papers can also be submitted electronically to any member of the Editorial Board and to the TechnicalAssistant to the Editor In Chief at [email protected].