Journal. LOGO PROJECT RISK and BUDGETING MM - OM Session 7 Henry Yuliando 2011.
35
Journal
-
Upload
allison-park -
Category
Documents
-
view
214 -
download
0
Transcript of Journal. LOGO PROJECT RISK and BUDGETING MM - OM Session 7 Henry Yuliando 2011.

Journal

Journal

LOGO
PROJECT RISK and BUDGETING
MM - OMSession 7
Henry Yuliando2011

Making Time-Cost Tradeoffs
In performing a time-cost analysis two types of costs associated with in normal time and crash time (ex: shortening the project with an overtime) of each activity are estimated. These costs are the normal-time cost and crash-time cost.
For an instance, the crash cost per day is $200 as computed as follows
$200/day
days 2 - days
crash time - timenormal
cost normal -cost crash daypercostCash
5
4001000$

Procedures for crashing project activities while maintaining additional cost involves four steps
1. Determine the normal time critical path and identify the critical activities.
2. Compute the crash cost per time period for all activities in the network.
3. Select the activity on the critical path that has the minimum crash cost per unit of time. Crash this activity to the maximum extent possible, or to the point at which the desired deadline has been achieved.
4. Revise the network by adjusting for the time and cost assigned to the crashed activity.

Example :
Original Project Network – Crashing ExampleCritical path 1367 (B F I) shown in boldface, 32 days length
Picture 11.
Desired completion time from 32 days to 29 day

…
Table 4. Normal and crash data
Activity Time (days) Cost ($) Crash Cost
per DayNormal Crash Normal Crash
ABCDEFGHI
789
118
10121314
667857
101110
600750900
1100850
1000130014001500
750900
1100140012001300150015002000
15075
100100
116.6610010050
125
Total $9400

…
Based on the critical path, the activity that can be shortened in the cheapest manner is activity B, at an incremental cost $75 per day. (see table 4).
Crashing activity to B to the maximum extent possible (i.e. normal time – crash time = 8 – 6 = 2 days) would reduce the completion time for activities B F I to 32 – 2 = 30 days, at a total project cost of $9400 + $150 = $9550.

…
Project Network – Activity B crashed 2 daysThe new critical path 1257 (A D H) shown in boldface, 31 days length
Picture 12.

…
Project Network – Activity B crashed 2 days; activity H crashed 2 daysThe new critical path 1367 (A D H) shown in boldface, 30 days length
Picture 13.

…
Picture 14.
Project Network – Activity B crashed 2 days; activity H crashed 2 days; activity F crashed 1 day. The new critical path 1257 and 1367 shown in boldface, 29 days length (desired completion time)

…
Table 5. Summary of time-cost tradeoffs
Step Action Critical PathTotal Project Completion
Time
Total Cost ($)
01
2
3
No crashing in networkActivity B crashed by 2 daysActivity H crashed by 2 daysActivity F crashed by 1 day
1367 1257
1367
12571367
32
31
30
29
9400
9550
9650
9750

PERT/COST
The first step in PERT/COST procedure is to subdivide the project into components that can be used to plan and schedule the cost associated the project (budgeting process).
Major steps :1. For each activity in the project, determine the aggregate cost
associated with the activities. This will be the budget for that activity.
2. Given the expected activity time for each activity, convert the budgeted cost for each activity into a cost per unit time period. (assumed at uniform rate over time)
3. Using the expected activity times, perform the critical path calculations to determine the critical path for the project.
4. Using the earliest and latest start times from the critical path calculations, determine the amount of money that should be spent during each time period in order to complete the project by a desired date.
…
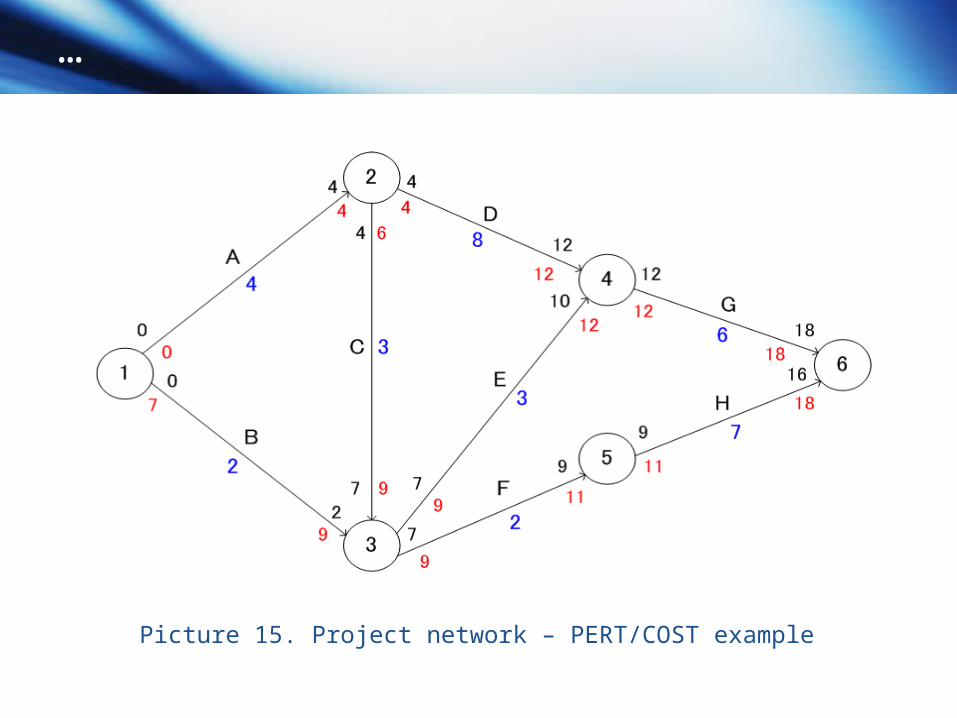
Picture 15. Project network – PERT/COST example

…
Table 6. Expected activity times and cost estimates
Activity Expected activity time (months)
Estimated cost(Budget $)
Budgeted cost per month
ABCDEFGH
42383267
20,00020,00012,00024,00021,00018,00036,00014,000
$ 5,00010,0004,0003,0007,0009,0006,0002,000
Total budgeted cost = 165,000

…
Table 7. Activity schedule and slack time
Activity
Earliest Start Time (ES)
Latest Start Time(LS)
Earliest FinishTime (EF)
Latest FinishTime(LF)
Slack(S)
On Critical Path?
ABCDEFGH
004477
129
076499
1211
427
1212111816
499
1212111818
07202202
YesNoNoYesNoNoYesNo

…Table 8. Budgeted Costs ($000), using earliest start time
ActivityMonth
Totals 1 2 3 4 5 6 7 8 9 10 11 12 13 14 15 16 17 18
A 5 5 5 5 20
B 10 10 20
C 4 4 4 12
D 3 3 3 3 3 3 3 3 24
E 7 7 7 21
F 9 9 18
G 6 6 6 6 6 6 36
H 2 2 2 2 2 2 2 14Total Cost/ Month
15 15 5 5 7 7 7 19 19 12 5 5 8 8 8 8 6 6 165
Total Cost to Date
15 30 35 40 47 54 61 80 99111
116
121
129
137
145
153
159
165

…
Table 9. Budgeted Costs ($000), using latest start time
ActivitiyMonth
Totals 1 2 3 4 5 6 7 8 9 10 11 12 13 14 15 16 17 18
A 5 5 5 5 20
B 10 10 20
C 4 4 4 12
D 3 3 3 3 3 3 3 3 24
E 7 7 7 21
F 9 9 18
G 6 6 6 6 6 6 36
H 2 2 2 2 2 2 2 14
Total Cost/ Month
5 5 5 5 3 3 7 17 17 19 19 12 8 8 8 8 8 8 165
Total Cost to Date
5 10 15 20 23 26 33 50 67 86105
117
125
133
141
149
157
165

…

Monitoring and Controlling Project Costs
Value of work completed = (percent of completion ) x (total budgeted cost)
Activity cost difference = total actual cost – value of work completed
Ex :
Table 10. Activity cost and completion : end of month 9
ActivityTotal
Budgeted Cost ($)
Percent of Completion
Value of Work
Completed ($)
Total Actual Cost ($)
Activity Cost Difference ($)
ABCDEFGH
Total
20,00020,00012,00024,00021,00018,00036,00014,000
165,000
1001001005025000
20,00020,00012,00012,0005250
000
18,00022,00015,00013,0005000
000
-2000200030001000-250
000
3750

Analyzing Project Completion-Time Variability The critical path of soccer tournament project case is :
ABCDHIJ Expected (or mean) project completion time:
Te = tA + tB + tC + tD + tH + tI + tJ
= 3.17 + 5.17 + 13.67 + 8.00 + 3.17 + 2.00 + 1.00
= 36.18 days Variance of project completion time:
2= A2 + B
2 + C 2+ D
2 + H2 + I
2 + J2
= 5.08 days Standard deviation = 2 = 2.25 days Probability (meeting target project completion time of T = 40 days)
P(T 40)
955.0
70.1
25.2
82.3
25.2
18.3640
timecompletionproject ofdeviation standard
timecompletionproject expected - timecompletionproject target
Zyprobabilit
Zyprobabilit
ZyprobabilitTT
Zyprobabilit
Zyprobabilit
e

Threat Vs Risk of Projects
• A threat is something that is done by a competitor or adversary to interfere with your success. For example, when fare war of airline companies.
• Risks are things that can happen without having any deliberate intention to cause harm behind them. Examples: accidents; earthquakes, weather, and so on; losing key members of the team; fires; escalating labor rates or inflation; changes in the exchange rate for international projects; political instability, and so on.
• While threats and risks are technically different, for the purposes of managing projects they can be lumped together in the same analysis.

Quantifying Risks and Threats
Use a subjective method: ex.: failure mode effects analysis (FMEA) – engineers.

....
FMEA contd’

.....
FMEA contd’

The Risk Probability Number (RPN)
RPN

Developing Contingency Plans
1. Risk avoidance: “foolproofing” in TPS – tank mounting to ensure correct welding
2. Mitigation (reduction): 1st & 2nd sourcing, overtime, extinguisher
3. Transfer/loss prevention: insurance4. Cost contingency (management
reserve): a fund that is part of a project budget to cover the cost of unidentified work.

Ways Of Mitigating or Avoding Risks
Portfolio RisksCommodity
Prices• Share risks with partners• Spread risks over time• Participate in many
ventures• Group complementary
risks into portfolios• Seek lower-risk ventures• Specialize and
concentrate in a single, well-known area
• Increase the company’s• Capitalization
• Hedge or fix in the futures markets
• Use long- or short-term sales (price and volume) contracts
• Tailor contracts for risk sharing

...
Interest Rate and Exchange Rate
Environmental Hazards
• Use swaps, floors, ceilings, collars, and other hedging instruments
• Restructure the balance sheet
• Denominate or index certaintransactions in a foreign currency
• Buy insurance• Increase safety
margins• Develop and test an
incident response program

...
Operational RisksAnalysis Risks
(ReducingEvaluation Error)
• Hire contractors under turnkey contracts
• Tailor risk-sharing contract clauses
• Use safety margins; overbuild and overspecify designs
• Have backup and redundant equipment
• Increase training• Operate with redirect and
bail-out options• Conduct tests, pilot
programs, and trials
• Use better techniques (i.e., decision analysis)
• Seek additional information• Monitor key and indicator
variables• Validate models• Include evaluation practices
along with project post-reviews
• Develop redundant models with alternative approaches and people

Developing the Project Budget
Estimating CostsDevelop a cost estimate for the resources
(human and material)required for each schedule activity. Include weighting alternative options and examining risks and trade-offs: make vs buy, buy vs lease, and sharing resources across either projects or departments.

...
Estimate Cost : Tools and Techniques Expert judgment Analogous estimating Parametric estimating Bottom-up estimating Three-point estimate Reserve analysis Cost of quality Project management estimating software Vendor bid analysis
...
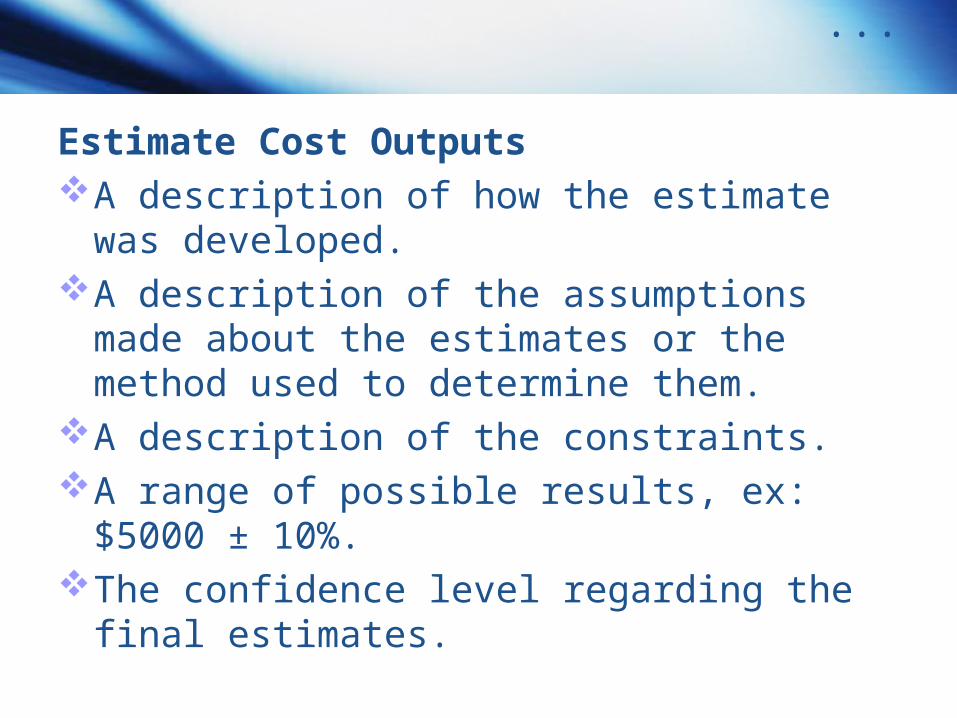
Estimate Cost OutputsA description of how the estimate was
developed.A description of the assumptions made
about the estimates or the method used to determine them.
A description of the constraints.A range of possible results, ex: $5000 ±
10%.The confidence level regarding the final
estimates.

Establishing the Cost Budget Baseline
Budget InputsActivity cost estimatesBasis of estimatesScope baselineProject scheduleResource calendarsContractsOrganizational process assets

...
Determine Budget Tools and Techniques
Cost aggregationReserve analysisExpert judgmentHistorical relationshipsFunding limit reconciliation