JOSÉ FELIPE DA SILVA FARIAS AUGUSTO JOSÉ PEREIRA FILHO · JOSÉ FELIPE DA SILVA FARIAS AUGUSTO...
19
JOSÉ FELIPE DA SILVA FARIAS JOSÉ FELIPE DA SILVA FARIAS AUGUSTO JOSÉ PEREIRA FILHO AUGUSTO JOSÉ PEREIRA FILHO August 2012
Transcript of JOSÉ FELIPE DA SILVA FARIAS AUGUSTO JOSÉ PEREIRA FILHO · JOSÉ FELIPE DA SILVA FARIAS AUGUSTO...

JOSÉ FELIPE DA SILVA FARIASJOSÉ FELIPE DA SILVA FARIAS
AUGUSTO JOSÉ PEREIRA FILHOAUGUSTO JOSÉ PEREIRA FILHO
August 2012

The forecast of rain the very short term is very important
especially in very populated areas, helping to reduce fatalities
caused by tornadoes, storms and floods, and prevent major
damage to different sectors of society as the private,
INTRODUCTIONINTRODUCTION
damage to different sectors of society as the private,
industrial, transportation and agriculture.
Evaluate of the rainfall nowcasting within the surveillance
area of São Paulo weather radar for different types of
precipitating systems, mainly the are associated to floods
and landslides in Metropolitan Area of São Paulo, was
OBJECTIVEOBJECTIVE
and landslides in Metropolitan Area of São Paulo, was
carried out with an 2D wind advective scheme and rainfall
rates estimated by radar. The third-order upstream
numerical scheme was used with a uniform wind vector.

� Urbanization� Soild cover� Heat Island � Deeper convection over MASP
Source:www.oesteinforma.com.br
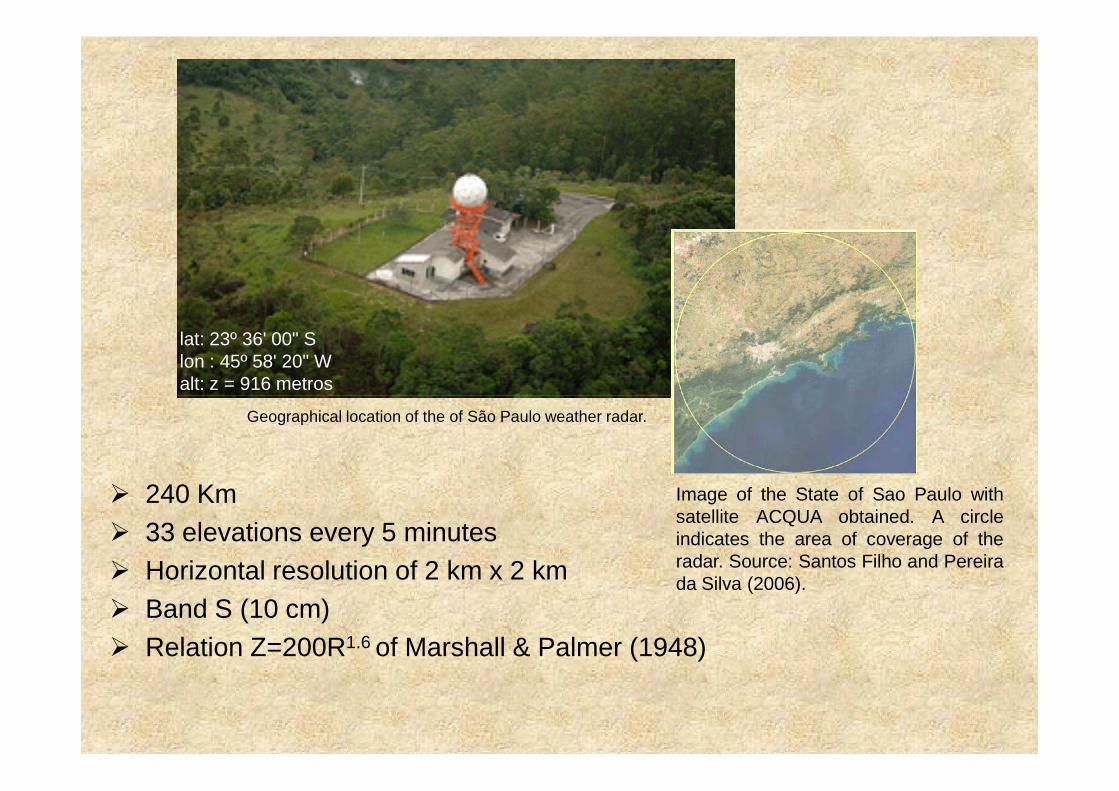
lat: 23º 36' 00" S lon : 45º 58' 20" Walt: z = 916 metros
Geographical location of the of São Paulo weather radar.
Image of the State of Sao Paulo withsatellite ACQUA obtained. A circleindicates the area of coverage of theradar. Source: Santos Filho and Pereirada Silva (2006).
� 240 Km� 33 elevations every 5 minutes� Horizontal resolution of 2 km x 2 km� Band S (10 cm)� Relation Z=200R1.6 of Marshall & Palmer (1948)

RAINFALL SHORT-TERM FORECAST
The rainfall short-term forecast was made from the displacement
vector of the precipitating system, obtained by the method
SHARP (Short - Term Automated Radar Prediction) developed
by the group of meteorology at McGill University and also used
by the Sao Paulo Weather Radar.
Linear extrapolation of radar echoes for up to 3 hours of
constant displacement vector prediction with keeping the same
structure of precipitation.

FebruaryFebruary, , OctoberOctober andandSquallSquall lineslines
NovemberNovember to to DecemberDecemberDisperse Disperse BandsBands
MayMay to to OctoberOctoberColdCold FrontsFronts
OcurrenceOcurrenceWeatherWeather SystemsSystems
.PRECIPITATING SYSTEMS
DecemberDecember e e MarchMarchSeaSea BreezeBreeze
DecemberDecember andand AprilAprilOrdinaryOrdinary ConvectionConvection
FebruaryFebruary, , OctoberOctober andandNovemberNovember
SquallSquall lineslines

Rainfall rate treshoud 20 mm/h
15
20
25N
um
ero
de
sist
emas
Convectivos
Estratiformes
0
5
10
Jan Fev Mar Abr Mai Jun Jul Ago Set Out Nov Dez
Meses
Nu
mer
o d
e si
stem
as
Number of convective e e stratiform events between 2004 - 2005.

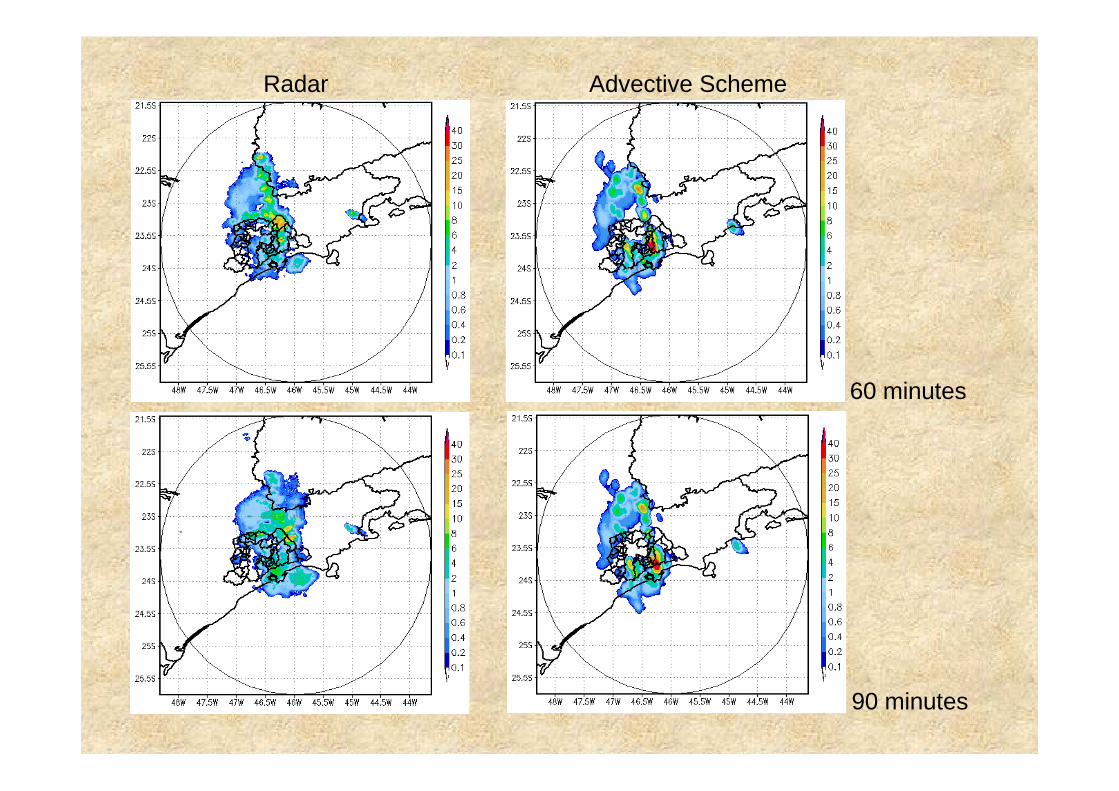
Radar Advective Scheme
Comparison between radar and advective scheme
Field of precipitation accumulated by of São Paulo weather radar (left) and predicted by advectivescheme (right) for 30 minutes, for an event Dispersed Bands of April 21, 2005 at 07:47 (UTC).Latitudes, longitudes and geographic contours including the Sao Paulo Weather Radar andMetropolitan Region of São Paulo MRSP and municipalities are indicated. The color scales indicatethe rate of precipitation (mm).
30 minutes

60 minutes
Radar Advective Scheme
60 minutes
90 minutes

120 minutes
Radar Advective Scheme
120 minutes
180 minutes

Radar Advective Scheme
Field of precipitation accumulated by of São Paulo weather radar (left) and predicted by advectivescheme (right) for Squall lines of September 19, 2004 at 20:47 (UTC) for 30 minutes.
30 minutes
Radar Advective Scheme
60 minutes60 minutes
90 minutes

Radar Advective Scheme
120 minutes120 minutes
180 minutes

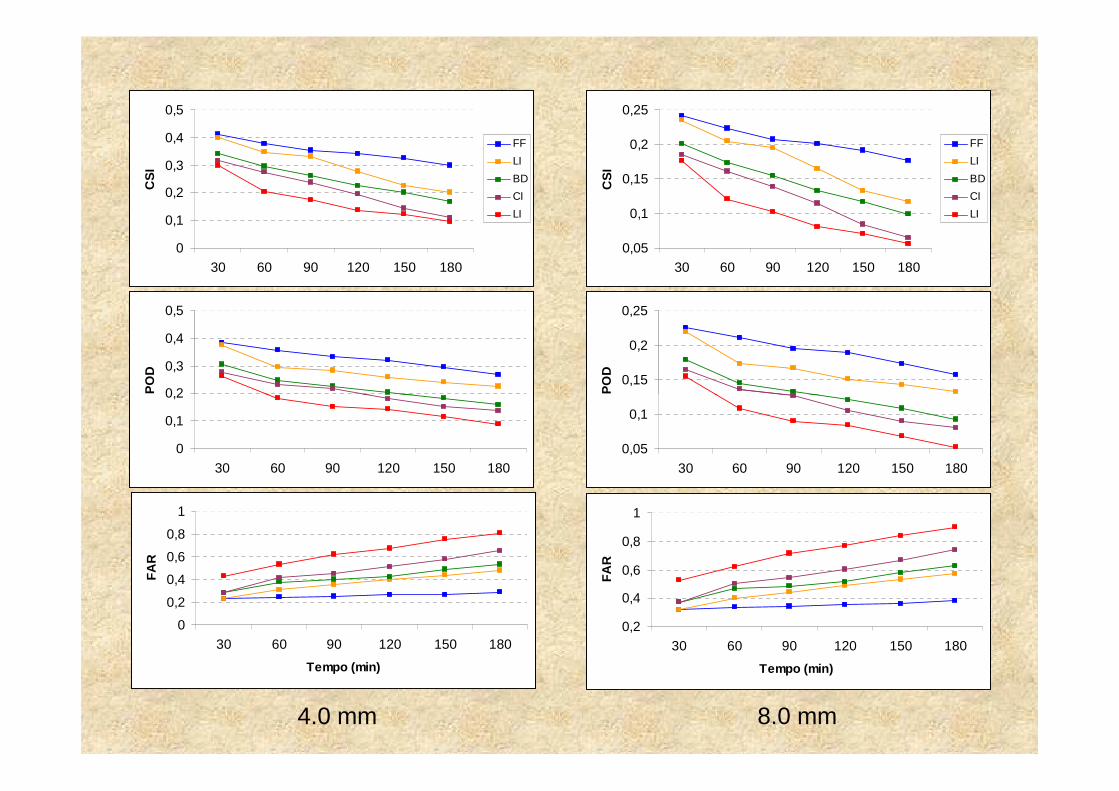
RAINFALL FORECAST SKILL
0
0,2
0,4
0,6
0,8
1
30 60 90 120 150 180
CS
IFF
LI
BD
CI
BM
0,6
0,8
1
PO
D
0
0,2
0,4
0,6
0,8
1
30 60 90 120 150 180
CS
I
FF
LI
BD
CI
BM
0,6
0,8
1
PO
D
0
0,2
0,4
30 60 90 120 150 180
PO
D
0
0,1
0,2
0,3
0,4
0,5
30 60 90 120 150 180
Tempo (min)
FA
R
0
0,2
0,4
30 60 90 120 150 180
PO
D
0
0,1
0,2
0,3
0,4
0,5
30 60 90 120 150 180
Tempo (min)
FAR
0.2 mm 2.0 mm
0
0,1
0,2
0,3
0,4
0,5
30 60 90 120 150 180
CS
IFF
LI
BD
CI
LI
0,2
0,3
0,4
0,5
PO
D
0,05
0,1
0,15
0,2
0,25
30 60 90 120 150 180
CS
I
FF
LI
BD
CI
LI
0,15
0,2
0,25
PO
D
4.0 mm 8.0 mm
0
0,1
0,2
30 60 90 120 150 180
0
0,2
0,4
0,6
0,8
1
30 60 90 120 150 180
Tempo (min)
FA
R
0,05
0,1
30 60 90 120 150 180
0,2
0,4
0,6
0,8
1
30 60 90 120 150 180
Tempo (min)
FA
R

0,02
0,04
0,060,08
0,10,12
0,140,16
30 60 90 120 150 180
CS
I
FF
LI
BD
CI
BM
0,06
0,08
0,1
0,12
0,14
PO
D
16.0 mm
0,02
0,04
0,06
30 60 90 120 150 180
0
0,2
0,4
0,6
0,8
1
30 60 90 120 150 180
Tempo (min)
FAR
CONCLUSIONSCONCLUSIONS
• The advective scheme showed better performance of the
lowest to the highest accumulations of precipitation. As for
systems with more organized structure of precipitation (LI) or
stratiform (FF);stratiform (FF);
• Systems with morphological structure more homogeneous and
more organized precipitation can be advectados for a period
exceeding 90 minutes. And convective systems 60 and 90 minutes
(in the case of convection organized).

THANK YOU!