Joris Van de Vondel, Bart Raes, and Alejandro V. Silhanek ......Joris Van de Vondel, Bart Raes, and...
32
Joris Van de Vondel, Bart Raes, and Alejandro V. Silhanek 2 Probing vortex dynamics on a single vortex level by scanning ac-susceptibility microscopy Abstract: The low-frequency response of type II superconductors to electromagnetic excitations is the result of two contributions: the Meissner currents and the dynam- ics of quantum units of magnetic flux, known as vortices. These vortices are three- dimensional elastic entities, interacting repulsively, and typically immersed in an en- vironment of randomly distributed pinning centers. Despite the continuous progress made during the last decades, our current understanding of the complex dynamic behavior of vortex ensembles relies on observables involving a statistical average over a large number of vortices. Global measurements, such as the widespread ac- susceptibility technique, rely on introducing certain assumptions concerning the average vortex motion thus losing the details of individuals. Recently, scanning sus- ceptibility microscopy (SSM) has emerged as a promising technique to unveil the magnetic field dynamics at local scales. This chapter is aimed at presenting a peda- gogical and rather intuitive introduction to the SSM technique for uninitiated readers, including concrete illustrations of current applications and possible extensions. 2.1 General introduction to ac susceptibility The hallmark of type II superconductors submitted to sufficiently strong magnetic fields is the presence of quantized magnetic flux lines encircled by a rotating conden- sate of paired electrons. The motion of these fluxons produces heat which destroys the perfect conductivity of the system. Consequently, in a world where energy dis- sipation has become a top priority problem, properly mastering the motion of flux- ons will certainly boost the technologically desirable properties of superconductors. Hence, understanding, improving and optimizing the mechanisms to prevent the mo- tion of fluxons has been regarded, throughout the years, as a timely and relevant re- search problem for fundamental science and applications. A proven successful way to achieve this goal consists of introducing a rich diversity of pinning centers and to develop new methods to evaluate their efficiency. The ac-susceptibility technique, uses a small alternating magnetic field to shake the flux line lattice back and forth while recording the superconductor’s in-phase and Joris Van de Vondel, Bart Raes, INPAC – Institute for Nanoscale Physics and Chemistry, Department of Physics and Astronomy (KU Leuven), Celestijnenlaan 200D, B-3001 Leuven, Belgium, e-mail: [email protected] Alejandro V. Silhanek, Experimental Physics of Nanostructured Materials, Q-MAT, CESAM, Depart- ment of Physics (Université de Liège), Allée du Six-Août, 19, B-4000 Liège (Sart-Tilman), Belgium, e-mail: [email protected] DOI 10.1515/9783110456806-003, © 2017 Joris Van de Vondel, published by De Gruyter. This work is licensed under the Creative Commons Attribution-NonCommercial-NoDerivs 4.0 License. Brought to you by | Université de Liège Authenticated Download Date | 10/27/19 9:46 AM
Transcript of Joris Van de Vondel, Bart Raes, and Alejandro V. Silhanek ......Joris Van de Vondel, Bart Raes, and...

Joris Van de Vondel Bart Raes and Alejandro V Silhanek2 Probing vortex dynamics on a single vortex levelby scanning ac-susceptibility microscopy
Abstract The low-frequency response of type II superconductors to electromagneticexcitations is the result of two contributions the Meissner currents and the dynam-ics of quantum units of magnetic flux known as vortices These vortices are three-dimensional elastic entities interacting repulsively and typically immersed in an en-vironment of randomly distributed pinning centers Despite the continuous progressmade during the last decades our current understanding of the complex dynamicbehavior of vortex ensembles relies on observables involving a statistical averageover a large number of vortices Global measurements such as the widespread ac-susceptibility technique rely on introducing certain assumptions concerning theaverage vortex motion thus losing the details of individuals Recently scanning sus-ceptibility microscopy (SSM) has emerged as a promising technique to unveil themagnetic field dynamics at local scales This chapter is aimed at presenting a peda-gogical and rather intuitive introduction to the SSM technique for uninitiated readersincluding concrete illustrations of current applications and possible extensions
21 General introduction to ac susceptibility
The hallmark of type II superconductors submitted to sufficiently strong magneticfields is the presence of quantized magnetic flux lines encircled by a rotating conden-sate of paired electrons The motion of these fluxons produces heat which destroysthe perfect conductivity of the system Consequently in a world where energy dis-sipation has become a top priority problem properly mastering the motion of flux-ons will certainly boost the technologically desirable properties of superconductorsHence understanding improving and optimizing the mechanisms to prevent the mo-tion of fluxons has been regarded throughout the years as a timely and relevant re-search problem for fundamental science and applications A proven successful wayto achieve this goal consists of introducing a rich diversity of pinning centers and todevelop new methods to evaluate their efficiency
The ac-susceptibility technique uses a small alternating magnetic field to shakethe flux line lattice back and forth while recording the superconductorrsquos in-phase and
Joris Van de Vondel Bart Raes INPAC ndash Institute for Nanoscale Physics and Chemistry Departmentof Physics and Astronomy (KU Leuven) Celestijnenlaan 200D B-3001 Leuven Belgium e-mailjorisvandevondelkuleuvenbeAlejandro V Silhanek Experimental Physics of Nanostructured Materials Q-MAT CESAM Depart-ment of Physics (Universiteacute de Liegravege) Alleacutee du Six-Aoucirct 19 B-4000 Liegravege (Sart-Tilman) Belgiume-mail asilhanekulgacbeDOI 1015159783110456806-003 copy 2017 Joris Van de Vondel published by De Gruyter This work islicensed under the Creative Commons Attribution-NonCommercial-NoDerivs 40 License
Brought to you by | Universiteacute de LiegravegeAuthenticated
Download Date | 102719 946 AM
62 | 2 Probing vortex dynamics on a single vortex level by SSM
out-of-phasemagnetic response It remains among themost popular inexpensive andpowerful experimental methods used to determine the efficiency of pinning sites [1]The disadvantage of such an experimental method can be attributed to the fact thatthe recorded signal represents an average over millions of flux lines each of which istrapped in different pinning potentials and subjected to different environments Asa consequence this global technique is not suited to provide information about thelocal pinning potential that each flux line might experience It can merely provideensemble-averaged information indirectly deduced from the measured integrated acmagnetic response by invoking the numerous theoretical studies on vortex dynamicsavailable today
The above-stated limitations of the conventional ac-susceptibility techniquenamely its inability to resolve the ac response of a single vortex and the indirect rela-tion between the vortex dynamics and the integrated response has provided a drive todevelop alternative methods aiming to directly probe the ac properties of a supercon-ductor with single vortex resolution In this chapter we discuss a recently introducedscanning probe technique scanning ac-susceptibility microscopy (SSM) which re-veals with unprecedented resolution the motion and dissipation of individual unitsof flux quanta driven by an applied ac magnetic field or current [2] The local dissi-pation can be inferred from the phase lag between the vortex motion and the drivingforce induced by an oscillatory magnetic field whereas the amplitude of the oscilla-tory vortex motion provides us with information about the shape of the local potentialthat each fluxon experiences This method has permitted us to reveal the contributionof pinning-driven (thermally activated) dissipative vortex motion [3] to demonstratethe nondissipative nature of the Meissner as well as the dissipative vortex state atmicroscopic scale [3] and finally to obtain a detailed cartography of the distributionand intensity of the pinning landscape [2 4] This technique not only shed new lighton unraveling the basic mechanisms of vortex dissipation with unmatched resolu-tion but it permitted one to validate the theoretical models introduced to explainthe measured integrated ac vortex responses in ac-susceptibility experiments [5] Weshow that the technique can be readily implemented in a scanning Hall probe mi-croscopy set-up suited for low magnetic field experiments [2ndash5] and also extended toa scanning tunneling microscopy [6] or a scanning SQUID microscopy apparatus [7]thus achieving the utmost resolution
211 AC response of a damped harmonic oscillator
In general whenever a dissipative system is subjected to a periodic excitation eg acrystal exposed to electromagnetic radiation or a driven damped harmonic oscillatorthe periodic force will perform work to drive the system through subsequent dissipa-tive cycles The dissipative or frictional component of the system related to a non-conservative force will induce a phase shift between the response and the external
Brought to you by | Universiteacute de LiegravegeAuthenticated
Download Date | 102719 946 AM
21 General introduction to ac susceptibility | 63
drive giving rise to hysteresis For example the imaginary part of the relative per-mittivity is closely related to the absorption coefficient of a material [8] or similarlya phase lag appears in the motion of a damped harmonic oscillator [9] This closeconnection between dissipation of energy and the out-of-phase component of the sys-temrsquos response is used in spectroscopicmeasurements to gain information concerningthe nature and efficiency of the dissipation processes Likewise we will use this spec-troscopic approach to investigate the response of a superconductor to an applied acmagnetic field
We start with the description of the linear response of a classical system a drivendamped harmonic oscillator in order to illustrate the above-mentioned connectionbetween dissipation and the appearance of a phase lag between the drive and theresponse This simple classical system has its merit not only because of its pedagog-ical aspect but also since it can be used to describe the linear response of a varietyof physical systems in nature For instance we can consider the absorption of lightas the interaction of the electromagnetic field with an oscillating dipole Finally theresponse of vortices and screening currents in a type II superconductor to an ac mag-netic field excitation can be mapped onto this simple classical system This motivatesus to briefly review some of the basic properties of this system Using Newtonrsquos equa-tion for a forced damped harmonic oscillator (Figure 21) the following general forcebalance equation of motion can be obtained
x(t) + 2ζω0 x(t) + ω20x(t) = F(t)m (21)
Here x(t) is the displacement of the oscillator from equilibrium and ω0 = radickm isthe natural frequency of the oscillator with spring constant k mass m and ζ is thedamping ratio The latter determines the behavior of the system and is given by
ζ = c2radicmk (22)
Fig 21 Schematic presentation describing the linear response of a driven damped harmonic os-cillator The (small) periodic driving force F(t) provides the excitation mechanism of a system con-sisting of a mass-spring system and a damping pot with c the viscous damping coefficient The re-sponse (the displacement) x(t) is also a periodic function in time In general a phase lag θ existsbetween the drive and the response
Brought to you by | Universiteacute de LiegravegeAuthenticated
Download Date | 102719 946 AM
64 | 2 Probing vortex dynamics on a single vortex level by SSM
with c the viscous damping coefficient For a monochromatic oscillating drivingsource
F(t) = F0 cos(ωt) (23)
the general solution of the differential Equation (21) consists of the sum of the ho-mogeneous solution and a particular solution However the homogeneous solution istransient whereas the particular one describes the steady state solution The steadystate solution depends only on the driving amplitude F0 the driving frequency ω andthe dynamical properties of the system In the case of a linear system the responsex(t) is completely described by the complex transfer function χ(ω) = χ1015840(ω) + iχ10158401015840(ω)and the excitation For the driven damped harmonic oscillator the explicit form of thistransfer function is
χ(ω) = 11 minus ω2
ω20+ 2iζ ω
ω0
(24)
and the exact steady state solution is given by
x(t) = F0k |χ(ω)| cos(ωt + θ(ω)) with (25)
|χ(ω)| = 1
radic(1 minus ω2
ω20)2 + 4ζ 2 ω2
ω20
and tan θ(ω) = arg(χ(ω)) = minus2ζωω0(ω20 minus ω2) (26)
This solution to the equation of motion shows that the driven oscillator has anoscillation period dictated by the driving frequency ω The phase and amplitude rela-tive to the drive are determined by the detuning from the natural resonance frequencyas shown in Figure 22a It is clear that the amplitude of x(t) reaches a maximum fordriving frequencies in the vicinity of the natural frequency ω0 of the oscillator Fur-thermore the phase shift θ between x(t) and the drive is always negative meaningthat x(t) lags behind the drive and passes through minusπ2 at precisely ω0
Fig 22 Lineshapes of a driven damped harmonic oscillator for the case ζ = 01 (a) The frequencydependence of the normalized modulus of the transfer function and the phase lag (b) The frequencydependence of the normalized in-phase and out-of-phase components of the transfer function
Brought to you by | Universiteacute de LiegravegeAuthenticated
Download Date | 102719 946 AM
21 General introduction to ac susceptibility | 65
For later purposes we rewrite the solution in yet another way as having an in-phase component and an out-of-phase component
x(t) = F0k
(χ1015840(ω) cos(ωt) minus χ10158401015840(ω) sin(ωt)) (27)
χ1015840 = (ω20 minus ω2)
ω20 [(1 minus ω2
ω20)2 + 4ζ 2 ω2
ω20] and χ10158401015840 = minus2ζωω0
ω20 [(1 minus ω2
ω20)2 + 4ζ 2 ω2
ω20] (28)
where the in-phase and out-of-phase component are proportional to χ1015840(ω) and χ10158401015840(ω)In order to understand the physical meaning of these components let us consider theQ-factor of the system which is defined as 2π times the mean energy stored in thesystem divided by the work done per cycle [9]
Q = 2π Energy storedEnergy dissipated
= [minus (ω20 + ω2)
2(ω20 minus ω2)] χ1015840
χ10158401015840(29)
Apart from the frequency-dependent prefactor between square brackets it is clear thatthe rate of energy dissipation is proportional to the out-of-phase component χ10158401015840(ω)whereas the stored energy in the system is proportional to the in-phase componentχ1015840(ω) This becomes more evident when calculating the rate at which the externaldrive performs work ie the power that is eventually dissipated as heat in the vis-cous fluid
dWdt = F(t) x(t) (210)
Since in steady state both the drive F(t) and the velocity x(t) are periodic functions oftime with the same period it is convenient to define the average power dissipated inone period
Wq = Tint0
dtF(t) x(t) = minusπF20χ10158401015840(ω) (211)
thus making a clear connection between the rate of energy dissipation and the out-of-phase component χ10158401015840(ω) The in-phase response is related to the mean stored energyin the system which is given by the sum of the average kinetic and potential energyin the system
⟨E⟩ = 12m ⟨(dxdt)2⟩ + 1
2mω2 ⟨x2⟩ = [ (ω20 + ω2)
2(ω20 minus ω2)] F20
2 χ1015840(ω) (212)
confirming the relation between the in-phase response and the stored energy More-over both response functions χ1015840(ω) and χ10158401015840(ω) are mathematically connected via theKramersndashKronig relations However in order to obtain one component from the otherit is necessary to know the whole frequency dependence of the latter In the followingwe will see that the above results describing the linear response of a driven dampedharmonic oscillator can bemapped to a superconducting system driven by a weak acmagnetic field
Brought to you by | Universiteacute de LiegravegeAuthenticated
Download Date | 102719 946 AM
66 | 2 Probing vortex dynamics on a single vortex level by SSM
212 AC response of a superconductor
In order to obtain the ac response of a type II superconductor we need to follow a sim-ilar approach as that for the damped harmonic oscillator with the objective to deducethe transfer function corresponding to the superconducting system
2121 Basic ingredients determining the ac response of a superconductorWe can already anticipate that the transfer function will involve two distinct but in-tertwined mechanisms namely the screening currents and the vortex lattice In thepresent case the excitation is given by an external ac magnetic field whereas the re-sponse function characterizes the diffusion of this field into the superconducting ma-terial In normal metals in first approximation this magnetic diffusivity is inverselyproportional to the electrical conductivity of thematerial Similar to Drudersquos approachto determine the conductivity of a normal metal we can derive an expression for theconductivity of a superconductor from microscopic arguments This is achieved bydescribing the response of the entities reacting to the electromagnetic field excitation(the Cooper pairs and the vortices)
Screening current Let us start by describing the contribution of the screen-ing currents to the conductivity In a first approximation one can use the simplifiedmodel introduced by the London brothers Inspired by the two fluid model of super-fluid 4He they assumed that free electrons in a superconductor can be divided intotwo groups superconducting electrons (ie participating in Cooper pairs) flowingwithout losses and with density ns and normal electrons (ie quasiparticles) withdensity nn which are able to scatter and then to contribute with finite resistivity Therelative amount of these two types of carriers depends on the temperature With thetotal density of free electrons conserved n = ns + nn ns = 0 and nn = n for T gt Tcwhile at T = 0 ns = n and nn = 0 The normal electrons have a finite scatteringtime τn whereas the superconducting electrons would move without dissipationcorresponding to τs = infin Following Drudersquos approach it can be shown that the realand imaginary components of the ac conductivity for both groups of carriers are givenby
reale(σ(ω)) = πnse2
2mδ(ω) + nne2τn
m(213)
imagem(σ(ω)) = nse2
mω (214)
with δ(ω) the Dirac delta function Here we assumed that the frequencies are lowenough so thatωτn ≪ 1which is a good approximation as this derivation is only validfor frequencies below the superconducting energy gap It is clear that the normal elec-tron fluid always provides a finite dissipation for all nonzero frequencies Howeverthis contribution becomes only appreciable for frequencies approaching the super-conducting gap sim 100GHz for Pb above which the ac response of a superconductor
Brought to you by | Universiteacute de LiegravegeAuthenticated
Download Date | 102719 946 AM
21 General introduction to ac susceptibility | 67
equals the one of a normal metal For the low-frequency range neglecting the vortexcontribution the screening current contribution can be considered purely inductiveand as such dissipationless This implies that the current is always out-of-phasewiththe applied or induced electric fieldsup1 Moreover in this case the magnetic field canpenetrate the superconductor only over a characteristic distance corresponding to thefrequency-independent London penetration depth λL (Figure 23)
λL = radic 2mμ0nse2
(215)
Vortex response As anticipated also the vortices contribute to the conductivityof the superconductor and as such it will have an impact on the screening efficiencyof a time-varyingmagnetic field This effect can be derived by describing the responseof a vortex in a type II superconductor to an induced or applied current However be-forewedig into the equation ofmotion for a vortex let us pose the questionwhy vortexmotion contributes to the conductivity of a type II superconductor A pioneering ex-periment by Giaever [10] provided solid evidence that a voltage drop arises along atype II superconductor as a direct consequence of the motion of Abrikosov vortices Ifa vortex moves with velocity v with a direction of motion perpendicular to a currentdrive it induces an electric field of magnitude
E = B times v (216)
parallel to the current drive As such in the presence of moving vortices an electricfield appears at the core of the vortices and acts over the quasiparticles leading to aresistive contribution In the simplest approximation one can consider a vortex as arigid entity and describe the dynamics using a particle-like equation of motion [11]
FI = FVV + FL + Fdrag + FP + FM + FTh (217)
Let us discuss the different terms appearing in this phenomenological force-balanceequation
The inertial term is equal to FI = mlowast ri where mlowast is the mass of a vortex per unitlength which is only effective in nature as a vortex cannot exist outside a supercon-ductor The displacement field of the i-th vortex is denoted by ri There are severalmechanismsproposed to contribute to the effective vortexmass per unit length [12 13]In general it is accepted that the vortex mass amounts to several thousands of elec-tron masses and represents only a small contribution which can be neglected for thefrequencies used in SSM
1 Here the current corresponds to velocity and its in-phase component (proportional to the real partof ac conductivity) is related to dissipation while its out-of-phase component (proportional to theimaginary part of ac conductivity) is related to the stored energy
Brought to you by | Universiteacute de LiegravegeAuthenticated
Download Date | 102719 946 AM
68 | 2 Probing vortex dynamics on a single vortex level by SSM
The vortexndashvortex interaction denoted by FVV describes the interaction withneighboring vortices through the potential energy U The strength of the repulsiveforce between two vortices is given by
fij(rij) = minuspartUij(rij)partrij
= ϕ20
2πμ0λ3K1 ( rijλ ) (218)
With K1 the modified bessel function of the second kind and rij = ri minus rj From theexpression for the supercurrent density one can write the force exerted by the i-thvortex on the j-th vortex as
fij = Ji(rj) times ϕ0j (219)
where ϕ0j is a vector of absolute value equal to the flux quantum and with a directionparallel to the flux density of the vortex j This expression resembles the structureof a lsquoLorentzrsquo force density and corresponds to a repulsive (attractive) interaction inthe case where both vortices have the same (opposite) polarity The interaction en-ergy of the i-th vortex with the rest of the vortices is additive and can be calculated asFiVV = minussumN
j =i fij Note that for a thin film the interaction is of long range whereas inbulk superconductors the vortexndashvortex interaction is short range
We can generalize the above result for the force on the i-th vortex due to screeningor transport currents as
fi = J(ri) times ϕ0j (220)
where J is the total supercurrent density at the location of the core of the vortex underconsideration Note that both forces FL and FVV are not a lsquoLorentz forcersquo in the usualsense ie qv times B and therefore the name is somewhat confusingsup2
The viscous damping force can be written as Fdrag = minusη ri where η describesthe viscosity experienced by the vortex when moving through the superconductingmedium The ultimate mechanism for the damping coefficient η is still a contro-versial issue The most popular explanation is the model proposed by Bardeen andStephen [15] where η is related to ordinary resistive processes in the core of a vortexdue to the electric field needed to maintain a cycloidal motion of electrons duringvortex motion [15] Other mechanisms have been suggested even before the BardeenndashStephen theory for instance Tinkham has shown that dissipation comparable to thatobserved in experiments could be explained if the order parameter could adjust to thetime-varying field configurations induced by a moving vortex only in a finite relax-ation time [16] Another approach has been proposed by Clem and is associated withthe local temperature gradients in the vicinity of the normal-like regions produceddue to a difference in entropy between the leading edge and the trailing edge when
2 Indeed if youwould just translate qv and B into J and ϕ0 respectively one will find that Jtimesϕ0 is theforce acting on the current and therefore the driving force on the vortex should be ϕ0 times J which hasthe opposite direction A more detailed discussion can be found in Reference [14] where the drivingforce is derived from kinetic energy considerations
Brought to you by | Universiteacute de LiegravegeAuthenticated
Download Date | 102719 946 AM
21 General introduction to ac susceptibility | 69
a vortex is moving [17] As stated by Tinkham [18] it is not entirely clear to what ex-tent all these various mechanisms are additive contributions or they simply representalternative views of the same physics As pointed out by Suhl [12] the ratio ηmlowastwhich in the case of free flux flow describes the initial time necessary to reach steadystate motion is of the order of picoseconds Therefore the dynamics of vortices at lowenough frequencies can be safely described by neglecting the vortex mass
The pinning force FP takes into account the fact that the motion of vortices can bereduced or eliminated by providing pinning centers that trap the vortex by exerting apinning force per unit length on the vortices The pinning centers can be grouped intotwo types On the one hand we find intrinsic pinning caused by impurities naturallyoccurring crystal defects such as lattice imperfections grain- and twin boundariestypically distributed randomly and whose strength is controlled by the growing con-ditions of the superconducting material On the other hand we have artificially man-ufactured pinning centers resulting from the technological possibility to introducedeliberately pinning centers with required shape size and distribution by means oflithographical techniques These artificial pinning centers such as holes blind holesor magnetic dots with magnetic moment in- and out-of-plane have received a lot ofattention lately both theoretically and experimentally [19]
The Magnus force is a hydrodynamic action experienced by a vortex moving in afluid FM = αϕ0 times ri where α is the Magnus force coefficient This force results in acomponent of the vortex velocity parallel to the drive current whichwill lead to a Hallvoltage Inmost cases and for small vortex velocities this force canbe ignored asmostexperimental data indicate that the Hall angle is very small
Thermal fluctuations relevant at high temperatures or low frequencies allowsvortices to diffuse out of their pinning potential well and wander some distancearound To model this effect one supplements the equation of motion with a randomforce which is assumed to be Gaussian white noise with zero mean in analogy to anearlier work by Fulde [20]
2122 Impact of vortex motion on the penetration depthIn a next step let us look to a concrete example inwhichwe can calculate the responseof the vortex lattice to an oscillatory excitation and explore its impact on the penetra-tion depth of the superconductor Analytical solutions for the equation ofmotion (217)exist for certain limiting cases [21ndash23] For example let us assume that the vortices areall driven by an identical weak periodic force due to an induced or applied ac currentFac(t) = F0 cos(ωt) while neglecting thermal excitations inertial and Magnus effectsIn this case the one-dimensional equation of motion reduces to
0 = FVV + FL + Fdrag + FP (221)
Sincewe consider onlyweak excitations the local potential that each vortex expe-riences due to a combination of randomdisorder neighboring vortices or boundaries
Brought to you by | Universiteacute de LiegravegeAuthenticated
Download Date | 102719 946 AM
70 | 2 Probing vortex dynamics on a single vortex level by SSM
can be approximated by a harmonic potential with spring constant ⟨αL⟩ As suchFP + FVV = minus ⟨αL⟩ x (222)
⟨αL⟩ which is known as the Labusch constant representing a statistical average overall restoring forces the vortex ensemble experiences In the case of artificial pinningarrays after a field-cooling exactly at the first matching field where there is one vortexper pinning site all restoring forces are supposed to be similar and ⟨αL⟩ can be takenas a constant However in these artificial pinning arrays for a zero-field-cooling condi-tion or for a small detuning from the matching field a coexistence of different types ofvortices each experiencing a different ⟨αL⟩ will take place For example pinned vor-tices by an antidot lattice will experience a completely different restoring force thaninterstitial vortices caged by the pinned ones [24] In the linear response regime thesteady state solution of this simplified equation of motion is given by
x(t) = |χ(ω)| cos(ωt + ϕ(ω)) (223)
with χ(ω) = ϕ0Jminusiηω + ⟨αL⟩ and ϕ(ω) = minus tanminus1 ( ωη⟨αL⟩) (224)
For low frequencies ω ≪ ωL equiv ⟨αL⟩η the restoring force dominates the mo-tion over the viscous drag force which can then be neglected Here we introduced thepinning frequency ωL which is typically of the order of 10MHz [25] In this case onlythe elastic interaction with the pinning centers has to be considered and the motionconsists of a reversible harmonic motion perfectly in phase with the driving force
χ(ω) = ϕ0J⟨αL⟩ (225)
This is the so-called Campbell regime [26] Using the relation E = x(t) times B where weuse B = nϕ tomake the step from a single particlemodel to the whole samplersquo averageresponse this leads to an imaginary contribution to the ac resistivity due to ac vortexdynamics
ρC = nϕ0ω⟨αL⟩ (226)
Together with the screening current contribution Equation (213) we obtain apurely imaginary conductivity
σC(ω) = (ωμ0λ2L + ωμ0λ2C)minus1 i with λC = radic ϕ0B⟨αL⟩ μ0 (227)
where we have defined the Campbell penetration depth λC as a real and frequencyindependent parameter As such in this low-frequency regime the ac vortex dynam-ics alters effectively the inductive properties of the superconductor as compared to theideal case where only the screening currents contribute In general the ac vortex dy-namics can also change the resistive properties of the superconductor as we will see
Brought to you by | Universiteacute de LiegravegeAuthenticated
Download Date | 102719 946 AM
21 General introduction to ac susceptibility | 71
later The total ac penetration depth is given by
λ2ac = λ2L + λ2C (228)
where λac is the skin depth or effective ac-penetration depth which is larger than theLondon penetration depth The response is still purely inductive which resembles theideal Meissner response For weak pinning and considering the applied ac and dcmagnetic fields perpendicular to the sample surface the Campbell penetration depthcan be written as λC = (c11⟨αL⟩)12 where c11 is the compressional modulus of thevortex lattice By this it is clear that the ac field penetration is carried by reversiblevortex oscillations near the equilibrium positions For very strong pinning ie when⟨αL⟩ rarr infin the vortices are immobile under external field changes and the supercon-ductor behaves as if it were in the Meissner state in this case the ac penetration depthreduces to the London one (see Figure 23)
In the opposite limit of high frequencies ω ≫ ωL the viscous drag force domi-nates the response and we can neglect the restoring force all together The motion isjust like in a normal metal ie a motion damped by a viscous force
χ(ω) = ϕ0Jη
iω (229)
Thismotion is completely out-of-phase with respect to the driving force The resultingac resistivity contribution due to the ac vortex dynamics is identical to the so-calledflux flow (FF) resistivity frequency independent but dependent on the field
ρac(ω) = Bϕ0η = ρFF = σminus1FF (230)
Fig 23 Schematic representation of the low-frequency ac penetration depth λac compared to thewell-known London penetration of a dc magnetic field λL If the vortex contribution is neglected theac penetration length λac sim λL In the Campbell regime incorporating an in-phase motion of vorticesdue to the elastic interaction between vortices and pinning centers two different limits of the acpenetration length can be found (i) For rigidly pinned vortices λac sim λL whereas for weak pinningλac = radicλ2
L + λ2C Here λC = (c11⟨αL⟩)12 where c11 is the compressional modulus of the vortex
lattice and ⟨αL⟩ is the Labusch constant representing a statistical average over all restoring forcesthe vortex ensemble experiences
Brought to you by | Universiteacute de LiegravegeAuthenticated
Download Date | 102719 946 AM
72 | 2 Probing vortex dynamics on a single vortex level by SSM
It is clear that in this regime the ac vortex dynamics alters the conductivity of the su-perconductor by a pure resistive contribution For the ac magnetic field penetrationthe superconductor will behave identically to a normal metal with a field-dependentand frequency-dependent skin depth
Amore complete description of the vortexrsquo linear response has been discussed byCoffey and Clem who derived an expression for the ac resistivity by solving the equa-tion of motion (217) taking into account in addition to the previous dynamic modesalso vortexmotion due to thermal fluctuations [21]Within the linear response approx-imation the motion due to thermal fluctuations can be described by the followingequation of motion
x sim exp(minusUkBT) (231)
meaning the vortices move with a linear average vortex velocity proportional to aBoltzmann factor where U describes an effective activation energy related to thestrength of the intrinsic pinning landscape Because of the activated nature of thistype of flux motion one speaks of thermally assisted flux flow (TAFF) The resultingac resistivity contribution due to TAFF is similar to the case of FF purely resistive
ρ(ω) = ρTAFF sim exp(minusUkBT) = σminus1TAFF (232)
Rigourously for the whole superconductor containing vortices and screening cur-rents one has to add all the different contributions A general solution to the equationof motion taking into account all the above-described contributions is given by Equa-tion (223) [21 22] with
χ(ω) = minus [ minus ⟨αL(r)⟩1 minus iωτ1 + iωη]minus1 and ϕ(ω) = arg χ(ω) (233)
here τ1 = ( η⟨αL(r)⟩) I20 [ U2kBT
]where I0(x) is the modified Bessel function which closely resembles an exponentialfor large argument x and I0(0) = 1 The time scale τ1 is a characteristic relaxationtime below which thermally activated hopping of vortices becomes important Forconventional superconductors the associated characteristic frequency is of the orderof 1τ1 lt 10Hz and is proportional to the ratio of the effective activation energy char-acterizing the intrinsic pinning U and the thermal energy kBT For high-Tc supercon-ductors the effect of TAFF can be very pronounced This resulting motion describingthe linear response of a vortex to an ac drive is a combination of in-phase (reversiblemotion) andout-of-phase (dissipativemotion) components andwill beprobeddirectlywith scanning susceptibility microscopy At low temperatures thermal fluctuationscanbe neglected meaning thatU ≫ kBT andhence τ1 diverges Under this conditionthe equation of motion reduces to the previous discussed cases in both limits of highand low frequencies Moreover for high temperatures and low frequencies f lt 1τ1
Brought to you by | Universiteacute de LiegravegeAuthenticated
Download Date | 102719 946 AM
21 General introduction to ac susceptibility | 73
the TAFF regime is recovered This description of the vortex response taking into ac-count all the above mechanisms results in general in a complex ac resistivity
As a last remark we would like to note that the simplified model used here to de-scribe the ac dynamics considering a vortex as a particle-like object has of course itslimitations as it ignores the internal structure of the vortices and their elastic natureIt is expected to fail for high vortex velocities where more realistic approaches such astime-dependent GinzburgndashLandau theory become necessary Moreover in the abovewe considered only the linear response which is valid for small disturbances fromequilibrium Once the applied ac-field amplitude becomes sufficiently high it is ableto introduce vortex displacements much larger than the pinning site size and the sys-tem will be in a regime of strong nonlinear response In this regime Ohmrsquos law will nolonger be valid and in general the conductivitywill become a function of the inducedor applied current
2123 Macroscopic response of a superconductorWe are now in a position to discuss the integrated magnetic response of a supercon-ductor upon the application of an external alternating magnetic field
hac(t) = hac cos(ωt) (234)
known as global ac-susceptibility measurements [1]When a type II superconductor is excited by an alternating external magnetic
field hac(t) it is then expected that the average sample responsesup3 the magnetic in-duction averaged over the sample volume ⟨B⟩(t) is also periodic with the same pe-riod as the appliedmagnetic field T = 2πω (see Figure 24) Here the average denotedby ⟨ ⟩ is taken over the whole sample volume The distorted periodic wave form canbe expressed as a Fourier series expansion
⟨B⟩(ω t) = μ0hacinfinsumn=1
[⟨μ1015840n⟩ cos(nωt) + ⟨μ10158401015840n ⟩ sin(nωt)] (235)
Here ⟨μ1015840n⟩ and ⟨μ10158401015840n ⟩ are the real and imaginary part of the n-th Fourier componentand μ0 is the permeability of vacuum In a first approximation assuming an ac drivesufficiently small we obtain the linear response
⟨B⟩ asymp μ0hac[⟨μ10158401⟩ cos(ωt) + ⟨μ101584010158401 ⟩ sin(ωt)] (236)
In this regime the response is fully determined by the Fourier components ⟨μ10158401⟩ and3 In principle the response of the sample alone is the magnetization ⟨M⟩(t) related to the magneticinduction ⟨B⟩(t) and the applied field ⟨ha⟩(t) as ⟨M⟩(t) = ⟨B⟩(t)
μ0 minus⟨ha⟩(t) As such themagnetizationdoesnot include the contributionof thedrive ⟨ha⟩(t) As in our experimentsweprobedirectly the localinduction rather than the magnetization we will describe the response in these terms
Brought to you by | Universiteacute de LiegravegeAuthenticated
Download Date | 102719 946 AM
74 | 2 Probing vortex dynamics on a single vortex level by SSM
Fig 24 Schematic presentation of a superconductor excited by a small monochromatic oscillatorymagnetic field hac(t) The periodic drive hac(t) provides the excitation mechanism of a type II su-perconductor The sample response ⟨B⟩(t) will also vary periodically in time however a phase lagθ may exist between the drive and the response
⟨μ101584010158401 ⟩which can be considered as the real and imaginary part of the so-called complexrelative permeability⁴ ⟨μ1⟩ = ⟨μ10158401⟩ + i⟨μ101584010158401 ⟩ The real part describes the in-phase re-sponse of the magnetic induction to the external magnetic ac field and is related tothe macroscopic shielding abilities or the inductive properties On order to see thiswe calculate the time average of the magnetic energy supplied by an alternating fieldper unit volume into the sample [1]
Wa = 1T
Tint0
hac(t)⟨B⟩(ω t)dt = ⟨μ10158401⟩B2a2μ0
(237)
where Ba = μ0hac When no sample is present the magnetic field energy stored isequal toW0 = B2
a2μ0 The difference
δW = Wa minus W0 = (⟨μ10158401⟩ minus 1) B2a2μ0(238)
reflects the ac response of the sample As such ⟨μ10158401⟩ describes whether the materialincreases or decreases the amount of stored energy per unit volume A diamagneticbehavior of the investigated sample 0 lt ⟨μ10158401⟩ lt 1 leads to a reduction of themagneticenergy stored per unit volume as compared to a situation when no sample is presentthis is reflected in a negative value of δW Thus in the case of a ideal superconductorin theMeissner state we expect ⟨μ10158401⟩ = 0 A paramagnetic response ⟨μ10158401⟩ gt 1 leads toan increase of the magnetic field energy as compared to the situation when no sampleis present
4 As ⟨M⟩(t) = ⟨B⟩(t)μ0 minus ⟨hac⟩(t) the first term in a Fourier series expansion of ⟨M⟩(t) will have Fourier
component ⟨χ10158401⟩ = ⟨μ10158401⟩ minus 1 and ⟨χ101584010158401 ⟩ = ⟨μ101584010158401 ⟩ which can be considered as the real and imaginary partof the complex ac susceptibility ⟨χ⟩ = ⟨χ10158401⟩+ i⟨χ101584010158401 ⟩ respectively In terms of themagnetization ⟨M⟩(t)the response of the sample alone is considered
Brought to you by | Universiteacute de LiegravegeAuthenticated
Download Date | 102719 946 AM
21 General introduction to ac susceptibility | 75
The imaginary part describes the out-of-phase response of the magnetic induc-tion arising as in the case of a driven damped harmonic oscillator necessarily fromdissipative ac losses within the superconductor To see this connection we calculatethe energy converted into heat during one cycle of the applied ac magnetic field [1]
Wq = 1μ0
Tint0
(hac(t)d⟨B⟩(ω t)dt ) dt
= Tint0
(hac(t)d⟨M⟩(ω t)) = π 1μ20
B2a⟨μ101584010158401 ⟩ (239)
and a direct relation exists between the dissipated energy and the complex part ofthe permeability ⟨μ101584010158401 ⟩ Notice that the second equality in Equation (239) is just thearea of a magnetization hysteresis loop AsWq is always positive ⟨μ101584010158401 ⟩ gt 0 In generalterms one can say that ⟨μ101584010158401 ⟩measures magnetic irreversibility or the resistive reactionto ac fields whereas ⟨μ10158401⟩ is related to the inductive properties of the sample Notethat all of the above considerations are in one-to-one correspondence with the caseof a harmonic oscillator where the displacement plays the role of the magnetizationand the driving force plays the role of the applied ac magnetic field
In standard ac-susceptibility measurements one excites the sample with an acmagnetic field hac and detects the macroscopic response ⟨B⟩(t) inductively by apick-up coil Using a phase-locked technique one can obtain directly ⟨μ10158401⟩ and ⟨μ101584010158401 ⟩or higher Fourier components [1] The dependencies of these two response functionsupon changing the thermodynamic variables or the ac excitation parameters providevery valuable information concerning the pinning efficiency and reveal the finger-prints of the particular ac dynamic phases the vortex lattice exhibits [27ndash29] Sincethe recorded signal represents an average over all present flux lines and screeningcurrents in the sample the link with the microscopic ac response is indirect Pioneer-ing theoretical works [22 23 26] contributed substantially to link this global responseto the microscopic vortex dynamics andor the ac field penetration
2124 Microscopic response of a superconductorThe above-described variation of the average response ⟨B⟩(t) of a type II supercon-ductor is produced at the microscopic level by the vortices the induced screening cur-rents andor the external field itself In Figure 25 the reaction at the end of a 500 μmlong superconducting Pb ribbon to a magnetic field variation is probed by makingsnapshots of the z-component of the local induction Bz(x y) as measured at ev-ery pixel (x y) by scanning Hall probe microscopy The Pb ribbon is 9 μm wide and50nm thick and the magnetic history consists of a field cooling procedure in a field ofhdc = 013mT at T = 7K (see Figure 25b) The prepared state contains two vorticeswhose positions are indicated by red dots In addition a clear enhancement of the lo-cal field is observed at the border of the Pb ribbon due to demagnetizing effects Two
Brought to you by | Universiteacute de LiegravegeAuthenticated
Download Date | 102719 946 AM
76 | 2 Probing vortex dynamics on a single vortex level by SSM
Fig 25 The reaction at the end of a 9 μm wide superconducting Pb ribbon to a magnetic field vari-ation is shown by making snapshots of the z-component of the local induction Bz(x y) as mea-sured by SHPM The borders of the Pb ribbon are indicated by the dashed white line The Pb ribbonis prepared by a field cooling procedure in a field of hdc = 013 mT to T = 7 K (b) Two snapshotsof Bz(x y) are shown at hdc = 023 mT (c) and hdc = 003 mT (a) obtained upon increasing anddecreasing the field with 01 mT after preparing the ribbon as described In (d) the average crosssection is shown for the different field configurations as obtained by averaging the cross sectionsin the rectangular area indicated by the black dashed line in (b)
snapshots of Bz(x y) are shown at hdc = 023mT (Figure 25c) and hdc = 003mT (Fig-ure 25a) obtained upon increasing and decreasing the magnetic field by 01mT Thefollowing observations can be made when the Pb ribbon undergoes a field variationof 01mTndash When we increase or decrease the field by 01mT additional screening currents
will be induced in the superconducting Pb ribbon as indicated by the long blackarrows in Figure 25a and c The magnetic field they generate will contribute tothe local induction Bz(x y) at the edge of the ribbon This explains the observedfield enhancement and reduction at the edge of the Pb ribbon respectively Thisfield enhancement is also observed in the prepared state (see Figure 25b) and isdetermined by a geometrical demagnetizing factor identical for every magneticfield amplitude as long as the penetration depth remains constant
Brought to you by | Universiteacute de LiegravegeAuthenticated
Download Date | 102719 946 AM
22 Scanning susceptibility measurements | 77
ndash The induced screening currentswill producea Lorentz forceon thevorticeswhichwill displace them from their initial equilibrium position in the prepared stateThe initial vortex position at hdc = 013mT is indicated by the red dots in everysnapshot The short black arrows in Figure 25a and c show a displacement of thevortices as compared to the positions of the vortices in the prepared state Both ob-servations are clearly visible in the derived average cross sections for every fieldamplitude (shown in Figure 25d) In this particular sample the dynamics of a vor-tex is a combination of (i) the local driving force due to the screening currents and(ii) the presence of random disorder in the material Nevertheless it is impossibleto obtain the exact shape of the potential below the resolution of SHPM In orderto do so we have to use scanning probe microscopy tools with higher resolution(eg scanning tunneling microscopy [6] or SQUID on a tip [7])
The point wewant to make clear with the above lsquosnapshot moviersquo is that the variationof the magnetic induction Bz(x y t) at the microscopic scale or at every pixel of ourscan area appears to be a reproducible back and forth motion with the same periodas the applied magnetic field whether one looks at the variation of the field due tovortices deep in the sample volume or due to the screening currents at the edge This isnot surprising as the average response ⟨B⟩(t) is just a superposition of the individualmicroscopic contributions Once again Bz(x y t) can be expressed as a Fourier seriesexpansion and if we consider only the linear response we obtain
Bz(x y t) asymp μ0hac [μ10158401(x y) cos(ωt) + μ101584010158401 (x y) sin(ωt)] (240)
Similar as in the macroscopic case the observation and the study of these responsefunctions or Fourier components and their dependencies upon variations of tempera-ture driving parameters etc will provide us with information concerning the vortexdynamics As discussed before it is possible to track the integrated response over thewhole sample volume bymacroscopic ac-susceptibility experiments In that case theconnection between themeasured response ⟨μ10158401⟩ and ⟨μ101584010158401 ⟩ and themicroscopicmod-els is indirect In contrast to that a measurement of μ10158401(x y) and μ101584010158401 (x y) completelycharacterizing the linear variation of the local induction will provide us with directinformation about the microscopic response without the need to invoke theoreticalmodels to explain the measured responses
22 Scanning susceptibility measurements
221 Scanning ac-susceptibility microscopy
Scanning ac-susceptibilitymicroscopy (SSM) schematically presented in Figure 26 isa phase-sensitive variant of the scanning Hall probemicroscopy technique It enablesus to measure directly with single vortex resolution the two Fourier components
Brought to you by | Universiteacute de LiegravegeAuthenticated
Download Date | 102719 946 AM
78 | 2 Probing vortex dynamics on a single vortex level by SSM
μ10158401(x y) and μ101584010158401 (x y) and in principle all higher harmonics In SSM the sample is ex-citedwith anexternal acmagnetic field hac(t) = hac cos(ωt) appliedperpendicular tothe sample surface by a copper coil The Hall voltage VH(x y t) measured locally bya Hall microprobe is picked up by a lock-in amplifier The excitation signal for the ex-ternal applied ac field feeds a phase-locked loop that extracts the in-phase V1015840
1(x y)and out-of-phase components V10158401015840
1 (x y) of VH(x y t) In the first approximation theseare respectively proportional to the in-phase B1015840
z(x y) and out-of-phase B10158401015840z (x y) ac
components of the local magnetic induction Bz(x y t) coarse grained by the size ofthe cross which are directly related to the real and imaginary part of the local relativepermeability μ1(x y) = μ10158401(x y) minus iμ101584010158401 (x y) through the definition [30]
μ10158401(x y) = B1015840z(x y)μ0hac
μ101584010158401 (x y) = B10158401015840z (x y)μ0hac
(241)
As a result SSM provides a tool to spatially map these two Fourier components Themapping of Bz(x y t) was obtained using a modified low-temperature SHPM fromNanomagnetics Instruments As the SHPM technique used to map Bz(x y t) has sin-gle vortex resolution SSM likewise allows one to probe the ac response of a supercon-ductor at this scale In all the experiments the collinear dc and ac external magneticfields are always applied perpendicular to the sample surface Just as in the globalac-susceptibility technique one can again relate by making a similar analysis the
Fig 26 (a) Schematic overview of the scanning susceptibility microscopy setup A superconduct-ing sample is placed in a dc magnetic field H generated by a superconducting coil surrounding acollinear copper coil generating an ac field hac(t) The time-averaged magnetic field profile due tothe present vortices and the screening currents is schematically shown by the black lines The mag-nifying glass provides a closer look at the induced ac vortex motion When the drive is small the acmagnetic field induces a periodic force on the vortices shaking them back and forth A Hall sensorpicks up locally the associated time-dependent Hall voltage VHall (b) A lock-in amplifier providedwith both hac(t) as a reference and VHall allows one to extract both the in-phase B1015840
z(x y) and theout-of-phase B10158401015840
z (x y) components of the local magnetic response
Brought to you by | Universiteacute de LiegravegeAuthenticated
Download Date | 102719 946 AM
22 Scanning susceptibility measurements | 79
in-phase component μ10158401(x y) to the local inductive response while the out-of-phasecomponent μ101584010158401 (x y) is related to microscopic ac losses
222 SSM on a superconducting strip response of individual vortices
In the following section we will as a proof of concept use SSM to analyze the ac re-sponse of the Pb ribbon discussed before The interpretation of the measured localresponse functions μ10158401(x y) and μ101584010158401 (x y) and the analysis of their dependencies uponvarying thermodynamic variables (temperature dcmagnetic field) or the drive ampli-tude will be discussed As the signal picked up by the Hall probe contains differentcontributions arising from the screening currents the vortex signals and the externalfield itself the measured local linear ac response is also determined by all contribut-ing factors This particular sample design allows us to map the spatial dependenceof the linear response to hac(t) covering the whole width of the sample in a singlescanning area including the Meissner response at the sample border and the vortexmotion deeper into the ribbon volume
2221 Temperature dependence of the macroscopic ac responseBefore we discuss in detail the response in the whole scan area let us first discussthe temperature variation of μ10158401(x y) and μ101584010158401 (x y) picked up by the Hall cross locatedsim 1 μm above the center of a zero-field cooled (ZFC) 7 μm wide Pb ribbon see Fig-ure 27 An ac amplitude of 01mT and a frequency of f = 77123Hz are used for thismeasurement This dependence is identical to the temperature dependence observedin macroscopic ac-susceptibility experiments It is clear that the Pb ribbon exhibits asuperconducting transition at Tc = 720K For temperatures below Tc a diamagneticresponse is observed 0 lt μ10158401(x y) lt 1 meaning the ribbon screens out the appliedfield Above Tc μ10158401(x y) asymp 1 meaning the ac magnetic field penetrates completelyas expected for this low frequency for a normal metal μ101584010158401 (x y) is initially zero goesthrough a maximum and reduces to a zero value near Tc
Figure 28a shows an SHPM image of a vortex distribution prepared by a field cool(FC) in H = 013mT and at T = 67K After preparing the state a SHPM image is ob-tained while an external field with hac = 01mT and f = 77123Hz is continuouslyapplied The scan speed is chosenproperly 1 μms to ensure that the integration timeat every pixel (125ms) is much larger than the period of the applied ac field (13ms)As one image has 128 by 128 pixels the time for a single scan takes 73 minutes Theresulting vortex distribution obtained by performing a FC experiment corresponds toa frozen vortex structure nucleated close to Tc [31] The FC process forces vortices tonucleate at the strongest pinning sites and results in a nonsymmetrical vortex distri-bution The external ac field shows up as an additional monochromatic noise in theSHPM images getting more pronounced for temperatures close to Tc However for all
Brought to you by | Universiteacute de LiegravegeAuthenticated
Download Date | 102719 946 AM
80 | 2 Probing vortex dynamics on a single vortex level by SSM
Fig 27 In-phase (χrsquo) and out-of-phase (χrdquo) ac signal picked up by the Hall cross located at the cen-ter of a 7 μm stripe using an ac amplitude of 01 mT and a frequency of f = 775 Hz
investigated temperatures the average vortex positions do not change indicating thatfor hac = 01mT the resulting average vortex response is limited to displacementsbelow the experimental spatial resolution
2222 Probing the ac response with single vortex resolutionFigure 28b shows a representative set of simultaneously acquired SSM images ofμ10158401(x y) (left column) and μ101584010158401 (x y) (right column) respectively describing the induc-tive and dissipative response when the temperature is decreased progressively fromT = 67K to T = 7K
Local inductive responseA first straightforward observation is that at the edgesof the scan area meaning relatively far away from the Pb ribbon the local inductionis equal to the applied acmagnetic field hac(t) as μ101584010158401 (x y) = 0 and μ10158401(x y) = 1 A clearparamagnetic response μ10158401(x y) gt 1 is visible at the edge of the Pb ribbon wherethe response is dominated by the induced screening currents This enhancement ofthe external ac field is caused by a strong demagnetizing effect resulting from the thinfilm sample geometry [32] Upon entering the volume of the ribbon we observe anincreasing diamagnetic response as hac(t) gets shielded by the screening currents Atthe center of the Pb ribbon a maximum diamagnetic response due to the screeningcurrent of μ10158401(x y) = 027 at T = 67K is reached indicating an incomplete fieldexpulsion
Brought to you by | Universiteacute de LiegravegeAuthenticated
Download Date | 102719 946 AM
22 Scanning susceptibility measurements | 81
Fig 28 (a) Scanning Hall probe microscopy image of the local induction Bz(x y) acquired dur-ing shaking with an external applied ac field of amplitude hac = 01 mT and with frequencyf = 77123 Hz at a temperature of T = 67 K The initial vortex distribution is obtained by performinga field cool in an external applied dc magnetic field H = 013 mT The white dashed line indicatesthe border of the Pb ribbon(b) Simultaneously acquired maps of the real part of the relative per-meability μ1015840
1(left column) and the imaginary part of the relative permeability μ101584010158401 (right column) for
different temperatures(top to bottom) T = 67 K 69 K and 70 K
Within the ribbon volume the induced screening currents j(t) will periodicallyshake the vortices with a force fL(t) = j(t) timesϕ0 The ac dynamics of the vortices willcrucially depend on the thermodynamic parameters of the superconducting systemand the properties of the drive As shown in Figure 28b the fingerprint of their mo-tion in the SSM images consists of two distinct unidirectional spots of opposite polar-ity surrounding the equilibrium vortex position The inductive response can be easilyinterpreted An area exhibiting a signal exceeding the ac response of the screeningcurrents μ10158401(x y) gt μ10158401(x y)s corresponds to a vortex carrying an intrinsic positive
Brought to you by | Universiteacute de LiegravegeAuthenticated
Download Date | 102719 946 AM
82 | 2 Probing vortex dynamics on a single vortex level by SSM
local induction moving in-phase with hac(t) within this area A region exhibiting asignal lower than the ac response of the screening currents μ10158401(x y) lt μ10158401(x y)s insome cases resulting even in a local negative permeability μ10158401(x y) lt 0 indicates thatbz(x y t) increases (decreases) upon decreasing (increasing) instantaneous hac(t)corresponding to a vortex moving in anti-phase with hac(t) within this area A simi-lar unique local negative μ10158401(x y) response but on a substantially larger spatial scalehas been observed in the ac dynamics of flux droplets in the presence of a geometricalbarrier [30]
From general considerations neglecting the demagnetizing field an overall in-tegrated response between zero and one is expected for ⟨μ10158401⟩ Note however that themeaningof the complexpermeability as amacroscopic thermodynamic variable is lostin this local limit Upon integrating the local signal over the whole scan area the ex-pectednon-negative response for ⟨μ10158401⟩and ⟨μ101584010158401 ⟩ is recovered This connectionbetween⟨μ1⟩ as the integrand of the lsquolocalrsquo permeability μ1(x y) which is directly related tothe microscopic vortex dynamics is used in theoretical models to explain the finger-prints of different dynamical vortex lattice regimes in measurements of the global ac-susceptibility and can be studied now directly by SSM Furthermore the particulardepth and shape of the local pinning potential that each vortex experiences has a pro-found effect on the ac dynamics ie at T = 69K only one of the two vortices presentin our scan area is shaking
Local dissipative response An important observation in Figure 28b is that theshielding currents do not show any contributing signal in μ101584010158401 (x y) for all tempera-tures indicating that they are within our experimental resolution perfectly in-phasewith the ac excitation and therefore they are nondissipative In sharp contrast to thescreening currentsrsquo response the vortices do leave a fingerprint in μ101584010158401 (x y) for suf-ficiently high temperatures As such the oscillating magnetic stray field producedby an harmonic motion of the vortices exhibits an out-of-phase component The out-of-phase response disappears for T lt 68K here the ac response of the vortices isweak and within the experimental resolution perfectly in-phase An illustration ofall forces working on a single vortex inside the Pb ribbon is shown in Figure 29 Inthis case the parabolic caging potential is the result of the interplay between the vor-tex and the screening currents while the additional roughness is induced by sampleinhomogeneity The presence of thesemodulations at length scalesmuch smaller thanthe distance traveled in this experiment (asymp 500nm) has been observed in later exper-iments using different high-resolution scanning probe techniques [6 7] The solutionof the resulting equation of motion is given by Equation (233) and directly shows thatthe out-of-phase component in the linear response can be induced by two differentdissipative mechanisms viscous damping or thermal fluctuations
This viscous damping process has a typical short characteristic time of the orderof τp = ηαL le 01 μs [25] For the applied low driving frequency f = 77123Hz therestoring force dominates over the viscous drag force as ω ≪ 1τp and this term canbe neglected The term iωτ1 in Equation (233) is related to thermally activated vortex
Brought to you by | Universiteacute de LiegravegeAuthenticated
Download Date | 102719 946 AM
22 Scanning susceptibility measurements | 83
Fig 29 Schematic representation of the forces working on a single vortex in the Pb ribbon at timet1 as described by Equation (217) In this picture αL determines the potential well of a single vor-tex no longer a statistical average and is the result of the interplay between the vortex and thescreening current Urough is an additional finer structure in the effective potential induced by sam-ple inhomogeneity In case thermal excitations (FTh ) are comparable to Urough thermal relaxationfollowing the classical idea of Anderson and Kim [35] becomes important
hopping across an effective activation barrier following the classic ideas of Andersonand Kim [35] and results from thermal excitations This activated hopping process istypically associated with longer characteristic time scales [36] Under certain condi-tions it is expected to contribute substantially in our low-frequency SSM experiment
It is interesting to make here a small parenthesis to discuss the linear response ofthis vortex system If we neglect the viscous damping force at low driving frequencywe can rewrite Equation (233) in the following way
x(t) = F0|χ(ω)| cos(ωt + θ(ω)) with χ(ω) = ( 1αL
minus iωτ1αL
) (242)
Here x(t) is the vortex position and the complex number χ(ω) describes the responseof the vortex system As in Section 211 we can parameterize the solution by the am-plitude and the phase of χ(ω) as
|χ(ω)| = 1αL
radic1 + 1(ωτ1)2 and tan θ(ω) = 1ωτ1
(243)
In both expressions for the amplitude and the phase lag the term ωτ1 appears explic-itly For a fixed characteristic time τ1 the deviation from pure reversible motion ariseswhen ωτ1 approaches 1 It implies that the driving frequency approaches the charac-teristic time for thermally activated motion and the vortex motion will be dominatedby this process As a result a phase lag appears between drive and vortex displace-ment When the driving frequency is much larger ωτ1 ≫ 1 but still small enoughto neglect viscous damping ωτp ≪ 1 the motion reduces to Campbellrsquos reversible
Brought to you by | Universiteacute de LiegravegeAuthenticated
Download Date | 102719 946 AM
84 | 2 Probing vortex dynamics on a single vortex level by SSM
vortex motion In this frequency regime thermally activated motion will contributenegligibly to the motion properties of a vortex The situation where ωτ1 lt 1 can notbe described within a linear response as in this case the response is strongly non-linear [22] and the above equations do not apply In the reversible Campbell regimea one-to-one correspondence exists between a vortex and a driven damped harmonicoscillator as discussed in Section 211 within the limits ω ≪ ω0 and ω ≪ (kη)
Before we continue with the interpretation of the measured temperature depen-dence of the vortex response we show explicitly that the measured phase with SSMcorresponds to the phase-lag in Equation (243) We denote by Bv
z(xi yi t) the mag-netic induction carried by a single vortex shaking back and forth around its equilib-rium position ri0 We assume that the vortex is driven by a small ac excitation in away that ri = (xi yi) oscillates about ri0 In this situation we can expand Bv
z(xi yi t)in a Taylor series around ri0 Without loss of generality we can choose the x-axis par-allel to the applied drive We further assume that the vortex displacement is parallelto the force which is valid for a linear response in isotropic media In this case vortexmotion is restricted to the x-direction and the expansion can be performed in powersof δxi = xi minus xi0
Bvz(x minus xi(t)) = infinsum
p=0
1p
partpBvz
partxpi|xi0δxpi (244)
= Bvminusdcz (x) minus partBvminusdc
zpartx
δxi + 12part2Bvminusdc
zpartx2
δx2i + O (δx3i ) (245)
With Bvminusdcz (x) the magnetic field distribution of the vortex without being excited No-
tice that the change of sign of the odd terms of the expansion due to changing xi byx in the derivatives If we assume that the vortex displacement can be expressed asδxi = |χ(ω)| cos(ωt + θ(ω)) as in Equation (242) we obtain for the in-phase and out-of-phase response
B1015840zv = 1
T int dt cos(ωt)Bz(x y t) = minus|χ(ω)|partBvminusdczpartx cos(θ(ω)) (246)
B10158401015840zv = 1
T int dt sin(ωt)Bz(x y t) = |χ(ω)|partBvminusdczpartx
sin(θ(ω)) (247)
Note that in the case of a diluted vortex distribution Bvminusdcz expands over distances
of the order of the penetration depth This scale exceeds in the linear regime typicalvortex displacements andhence one can safely keep the leading order terms These re-
sults lead to the conclusion that themeasuredmodulus SSM signalradic(B1015840zv)2 + (B10158401015840
zv)2
is directly related to the amplitude of vortex motion with a proportionality constantgiven by the gradient of Bvminusdc
z in the direction of the driving force Furthermore themeasured phase angle corresponds directly to the phase lag between the vortex mo-
Brought to you by | Universiteacute de LiegravegeAuthenticated
Download Date | 102719 946 AM
22 Scanning susceptibility measurements | 85
tion and the Lorentz drive
|χ(ω)| = (partBvminusdczpartx )minus1 radic(B1015840
zv)2 + (B10158401015840
zv)2 (248)
tan(θ(ω)) = minusB10158401015840zv
B1015840zv (249)
With these parameters the dependence on the probe position cancel out and shouldbe homogeneous apart from the places where partBvminusdc
z partx = 0Let us use the above considerations to interpret the temperature dependence of
the out-of-phase component of the vortex response At low temperatures when U(j) ≫kBT and thermally activated flux motion can be neglected τ1 diverges exponentiallyand the ac response x(t) = αLfL(t) is a pure reversible harmonicmotion as describedby Campbell and Evetts [26] This behavior explains the absence of a response in theSSM images of μ10158401015840r (x y) for T lt 68K while a response is still visible in μ1015840r(x y) As thetemperature rises the thermal activation energy decreases and 1ωτ1 becomes ap-preciable meaning thermally activated vortex jumps betweenmetastable states comeinto play and contribute substantially to the vortexmotion This explains the observedout-of-phase component for T gt 68K Figure 210 shows a zoom-in of the ac responseof a single vortex for T = 69K and the corresponding spatial dependence of thecalculated phase where we use a cutoff for | μ1015840r(x y) |lt 015 to limit the divergenceof the arctangent function and we subtracted the contribution of the screening cur-rents in μ1015840r(x y) As shown in Figure 210c the obtained phase shift is θ = minus05 radFrom Equation (243) the phase shift between the response and the drive is given byθ = minus arctan(1τ1ω) As τp le 01 μs we obtain a lower limit for the effective activationbarrier height of U(j) ge 850 times 10minus3 eV sim 143kBT similar to typical average effectivebarrier heights found in the literature by macroscopic measurements [37]
Fig 210 (a) Scanning susceptibility microscopy image of the real part of the relative permeabilityμ1015840
r for a single vortex upon shaking with an external ac magnetic field of amplitude hac = 01 mTand frequency f = 77123 Hz at a temperature of T = 69 K The initial vortex distribution is obtainedby performing a field cool in an external applied dc magnetic field H = 013 mT (b) Simultaneouslyacquired map of the imaginary part of the relative permeability μ10158401015840
r (c) Calculated spatial depen-dence of the negative phase angle
Brought to you by | Universiteacute de LiegravegeAuthenticated
Download Date | 102719 946 AM
86 | 2 Probing vortex dynamics on a single vortex level by SSM
The temperature dependence of the phase shift shows a maximum at T = 685KOptimal energy dissipation is expected when the driving frequency matches the char-acteristic frequency of our vortex system ie when the resonant absorption condi-tion ωτ1 = 1 is fulfilled As the driving frequency is fixed we approach or detunefrom the resonant absorption condition by changing τ1 with temperature The non-monotonic temperature dependence of the phase shift reflects the nontrivial temper-ature dependencies of the different factors contributing in τ1
223 Examples of application of the SSM technique
In the previous sections we have shown concrete examples illustrating the power ofthe SSM technique for tracking the motion of individual vortices and to understandthe dissipative mechanism involved during their displacement Now we will presentin a rather conciseway further applications of the technique to a variety of interestingsuperconducting materials
2231 Imaging the dynamics of vortices and antivortices inducedby magnetic microdisks
The microscopic static and dynamic behavior of vortexndashantivortex pairs sponta-neously induced by CoPt micromagnets with out-of-planemagnetic moment in closeproximity to a superconducting Pb film has been investigated via SSM by Kramer andco-workers in Reference [38] Images of the obtained results are shown in Figure 211Panel (a) corresponds to the static image obtained at zero field and with the disksfully magnetized (red spots) The presence of seven antivortices three at the centerand four at the rims of the scanning area can be distinguished as dark blue spotsThis vortex configuration is then excited with a small ac field (hac = 002mT) and theoscillation of each individual vortex is recorded by the SSM as shown in panel (b) Itcan be seen that two of the central antivortices strongly oscillate whereas no motionis detected for any vortex sitting on top of the magnetic disks In panel (c) the twopanels (a) and (b) have been superimposed to better identify those vortices able tomove It is worth emphasizing that the SSM technique is able to detect only periodicmotion between two points and therefore the lack of signal associated with the restof the antivortices can be either because they remain pinned or due to a nonperiodictrajectory during the ac excitation By increasing the amplitude of the ac excitation(hac = 006mT) eventually it is possible to shake the much more strongly pinned vor-tices on top of the disks This is shown in panels (d) to (f) corresponding to a lowermagnetic moment with only one antivortex present at the left side of the scanningarea In this case SSM has permitted us for the first time to unveil the difference inmobility between both vortex species
Brought to you by | Universiteacute de LiegravegeAuthenticated
Download Date | 102719 946 AM
22 Scanning susceptibility measurements | 87
Fig 211 Probing the mobility of vortexndashantivortex pairs Panels (a) and (d) show scanning Hall mi-croscopy images at H = 0 mT and T = 69 K for two different magnetic moments of the disks Thedashed circles highlight the position of the induced antivortices Panels (b) and (e) show SSM im-ages for an excitation field hac = 002 mT and hac = 006 mT respectively and a frequency of 77 HzPanels (c) and (f) show a superposition of panels (a) and (b) and (d) and (e) respectively in order toidentify the vortices susceptible to the excitation
2232 Closer look at the low-frequency ac flux penetration in superconductorswith periodic pinning array
Two vortex species are not limited to superconductorferromagnet systems as in theexample above This dichotomy of vortex families is also found in superconductorswith periodic arrays of holes (antidots) where vortices pinned by the holes experienceamuch stronger cagingpotential than interstitial vortices sitting inbetweenholes [39]In a recent work Souza Silva and co-workers used the SSM technique to investigatethe response of a nanostructured Pb superconductor having a square lattice of anti-dots [5] Figure 212 shows the ac response obtained on these nanostructures at a dcmagnetic field of 15H1 with H1 being the magnetic field value at which the densityof vortices and holes coincides As a guide to the eye the antidot position is markedby a white dot whereas the white line represents the sample edge Pinned and inter-stitial vortices (marked by dashed circles) can be observed in the dc flux distribution(as shown in Figure 212a) The in-phase component shown in Figure 212b and c re-veals the enhancedmobility of these interstitial vortices with single vortex resolutionMoreover the authors showed that pinning by material defects in this sample as well
Brought to you by | Universiteacute de LiegravegeAuthenticated
Download Date | 102719 946 AM
88 | 2 Probing vortex dynamics on a single vortex level by SSM
Fig 212 SSM images showing the ac response (mapped in a region near the sample edge) to anexcitation with amplitude hac = 0016 mT at T = 67 K Panel (a) shows the dc (time-average) fluxdistributions The in-phase and out-of-phase components of the total ac response are mapped inpanel (b) The in-phase vortex response defined as the difference between the in-phase and theMeissner responses is shown in panel (c) In all images the white dots and the white line showschematically the position of the square antidots and the sample edge respectively The dashedcircles highlight the position of selected interstitial vortices
as thermal activation processes dominate the low-frequency linear response even attemperatures very close to Tc where quenched disorder is typically neglected
2233 Imaging the dynamical ordering in NbSe2Raes and co-workers used SSM to investigate the vortex dynamic in NbSe2 one of themost extensively studied type II superconductors [4] In that work the authors ex-plored the local ac dynamics of a disordered vortex state and provided direct evidenceof dynamical healingof topological defects as theac excitationamplitude is increasedFigure 213a reveals a highly disordered vortex lattice via a SHPM image of the local in-duction at 68K and a dcmagnetic field of 10Oe Panels (b) and (c) are acquiredmapsof the in-phase response b1015840v(x y) with increasing amplitude of the ac drive Interest-ingly these SSM images revealed two very different behaviors of the individual vortexresponse uncorrelateddynamics (Figure 213b)where vortices shakeatdifferentdirec-tions with different amplitudes and correlated dynamics (Figure 213c) where uponthe healing of defects the directions of motion of all vortices align and they respondalmost in unison The authors confronted the observedmicroscopic dynamicswith theextensively used phenomenological microscopicmodels of vortex motion proposed toexplain the macroscopic response and show that the approximations made in thesemean-field models which furnishes information about the microscopic parametersaveraged over the whole vortex ensemble represent a simplified picture of the muchricher ac dynamics
Brought to you by | Universiteacute de LiegravegeAuthenticated
Download Date | 102719 946 AM
23 Conclusion and outlook | 89
Fig 213 Panel (a) shows a SHPM image of the local induction bz(x y) acquired at T = 68 K and adc magnetic field H = 10 Oe while shaking with an amplitude hac = 03 Oe Acquired maps of thein-phase b1015840
v(x y) response with increasing amplitude hac = of 06 (b) and 2 (c) Oe which indicatesthe ac-driven ordering of the vortex lattice and its dynamics To unify the color map scale b1015840
v(x y) isnormalized by 1 times10minus3hac (in Gaussian units)
23 Conclusion and outlook
Most of the emphasis of this chapter has been devoted to present a rather simple andintuitivepicturedescribing the local ac-susceptibility responseof type II superconduc-tors at spatial scales of a few times the magnetic penetration depth We have shownthat the SSM is an emerging powerful technique allowing us to build up a cartogra-phy of individual vortex motion which in turn can be used to deduce the local pinninglandscape or the inhomogeneous current distribution The out-of-phase componentof themagnetic response teaches us about the dissipativemechanism involved duringvortex motion and remains zero in the case of a reversible response as that producedby Meissner currents
Although we have presented the technique as an extension of a scanning Hall mi-croscopy set up it has been recently shown that it can be used to resolve the magneticfield at smaller scales by using a SQUID on a tip device [7] Furthermore the SSM canbe adapted into a scanning tunneling microscope in order to analyze the oscillationof individual vortices at scales of the coherence length [6] Examples of applicationbeyond type II superconductors are the motion of normal domains in a type I super-conductor by Ge and co-workers [40] and the shaking of bubble domains in a ferro-magnetic garnet by De Feo and Marchevsky [41]
Among the interesting aspects that could be further explored in the future to ren-der the technique still more powerful we identify the possibility to shake vortices withan applied current or shake magnetic domain with an oscillatory spin-polarized cur-rent rather than with an external ac magnetic field In addition the generation ofhigher harmonics or the excitation with asymmetric wave forms may appear as ap-pealing research lines to undertake It is also possible to envisage combining excita-tion and sensing on the same probe head or separate them in two heads to measurethe propagation of local excitations or as away to investigate the conductivity ofmate-
Brought to you by | Universiteacute de LiegravegeAuthenticated
Download Date | 102719 946 AM
90 | 2 Probing vortex dynamics on a single vortex level by SSM
rials in a contactlessway In any casewe are convinced that SSMas a dynamic sensingtool has a bright future ahead a fact that will be judged by the scientific communityand the parallel progress of alternative techniques
Acknowledgment The authors are grateful to Clecio C Souza Silva and RomanKramer for their valuable comments and discussions We are also grateful to JeroenE Scheerder for his valuable input regarding the figures
This work was supported by the Fonds de la Recherche Scientifique ndash FNRS theMethusalem Funding of the Flemish Government the Fund for Scientific Research ndashFlanders (FWO-Vlaanderen) and NanoSCndashCOST Action MP1201 The work of AVS ispartially supported by lsquoMandat drsquoImpulsion Scientifiquersquo MIS F452713 from FRS-FNRS
Bibliography
[1] Goumlmoumlry F Characterization of high-temperature superconductors by ac susceptibility measure-ments Superconductor Science and Technology 10(8)523 1997
[2] Kramer RBG Ataklti GW Moshchalkov VV Silhanek AV Direct visualization of the Campbellregime in superconducting stripes Phys Rev B 81144508 2010
[3] Raes B Van de Vondel J Silhanek AV de Souza Silva CC Gutierrez J Kramer RBGMoshchalkov VV Local mapping of dissipative vortex motion Phys Rev B 86064522 2012
[4] Raes B de Souza Silva CC Silhanek AV Cabral LRE Moshchalkov VV Van de Vondel J Closerlook at the low-frequency dynamics of vortex matter using scanning susceptibility microscopyPhys Rev B 90134508 2014
[5] de Souza Silva CC Raes B Brisbois J Cabral LRE Silhanek AV Van de Vondel JMoshchalkov VV Probing the low-frequency vortex dynamics in a nanostructured supercon-ducting strip Phys Rev B 9402456 (2016)
[6] Timmermans M Samuely T Raes B Van de Vondel J Moshchalkov VV Dynamic Visualization ofNanoscale Vortex Orbits ACS Nano 8(3)2782 2014
[7] Embon L Anahory Y Suhov A Halbertal D Cuppens J Yakovenko A Uri A Myasoedov Y Rap-paport ML Huber ME Gurevich A Zeldov E Probing dynamics and pinning of single vortices insuperconductors at nanometer scales Sci Rep 57598 2015
[8] Fox A Optical Properties of Solids Oxford Master Series in Physics Condensed MatterPhysics Oxford University Press 2001
[9] Feynman R Leighton R Sands M Gottlieb M The Feynman lectures on physics The FeynmanLectures on Physics PearsonAddison-Wesley 1963
[10] Giaever I Magnetic coupling between two adjacent type-II superconductors Phys Rev Lett15825 1965
[11] Blatter G Feigelrsquoman MV Geshkenbein VB Larkin AI Vinokur VM Vortices in high-temperaturesuperconductors Rev Mod Phys 661125 1994
[12] Suhl H Inertial mass of a moving fluxoid Phys Rev Lett 14226 1965[13] Kopnin NB Vinokur VM Dynamic vortex mass in clean Fermi superfluids and superconductors
Phys Rev Lett 813952 1998[14] Chen D-X Moreno JJ Hernando A Sanchez A Li B-Z Nature of the driving force on an Abrikosov
vortex Phys Rev B 575059 1998
Brought to you by | Universiteacute de LiegravegeAuthenticated
Download Date | 102719 946 AM
Bibliography | 91
[15] Stephen MJ Bardeen J Viscosity of type-II superconductors Phys Rev Lett 14112 1965[16] Tinkham M Viscous flow of flux in type-II superconductors Phys Rev Lett 13804 1964[17] Clem JR Local temperature-gradient contribution to flux-flow viscosity in superconductors
Phys Rev Lett 20735 1968[18] Tinkham M Introduction to superconductivity International series in pure and applied physics
McGraw Hill 1996[19] Moshchalkov V Fritzsche J Nanostructured superconductors World Scientific Publishing Com-
pany Incorporated 2011[20] Fulde P Pietronero L Schneider WR Straumlssler S Problem of brownian motion in a periodic
potential Phys Rev Lett 351776 1975[21] Coffey MW Clem JR Unified theory of effects of vortex pinning and flux creep upon the rf sur-
face impedance of type-II superconductors Phys Rev Lett 67386 1991[22] van der Beek CJ Geshkenbein VB Vinokur VM Linear and nonlinear ac response in the super-
conducting mixed state Phys Rev B 483393 1993[23] Brandt EH Penetration of magnetic ac fields into type-II superconductors Phys Rev Lett
672219 1991[24] de Souza Silva CC Aguiar JA Moshchalkov VV Linear ac dynamics of vortices in a periodic
pinning array Phys Rev B 68134512 2003[25] Gittleman JI Rosenblum B Radio-frequency resistance in the mixed state for subcritical cur-
rents Phys Rev Lett 16734 1966[26] Campbell AM The response of pinned flux vortices to low-frequency fields J Phys C Solid
State Phys 2(8)1492 1969[27] Marchevsky SM Higgins MJ Two coexisting vortex phases in the peak effect regime in a super-
conductor Nat Phys 409591 2001[28] Koshelev AE Vinokur VM Dynamic melting of the vortex lattice Phys Rev Lett 733580 1994[29] Pasquini G Civale L Lanza H Nieva G Dynamic regimes in the ac response of YBa2Cu3O7 with
columnar defects Intra- and inter-valley vortex motion Phys Rev B 599627 1999[30] Morozov N Zeldov E Majer D Khaykovich B Negative local permeability in Bi2Sr2CaCu2O8
crystals Phys Rev Lett 76138 1996[31] Marchevsky M Kes P Aarts J Determination of the quenching temperature for the vortex lattice
in field-cooling decoration experiments Physica C Superconductivity 2822083 1997[32] Brandt EH Indenbom M Type-II superconductor strip with current in a perpendicular magnetic
field Phys Rev B vol 4812893 1993[33] Kim YB Hempstead CF Strnad AR Flux-flow resistance in type-II superconductors Phys Rev
139A1163 1965[34] Bardeen J Stephen MJ Theory of the motion of vortices in superconductors Phys Rev
140A1197 1965[35] Anderson PW Kim YB Hard superconductivity Theory of the motion of Abrikosov flux lines
Rev Mod Phys 3639 1964[36] Haumlnggi P Talkner P Borkovec M Reaction-rate theory fifty years after Kramers Rev Mod
Phys 62251 1990[37] Lange M Van Bael MJ Silhanek AV Moshchalkov VV Vortex-antivortex dynamics and field-
polarity-dependent flux creep in hybrid superconductorferromagnet nanostructures PhysRev B 72052507 2005
[38] Kramer RBG Silhanek AV Gillijns W Moshchalkov VV Imaging the Statics and Dynamics ofSuperconducting Vortices and Antivortices Induced by Magnetic Microdisks Phys Rev X1021004 2011
Brought to you by | Universiteacute de LiegravegeAuthenticated
Download Date | 102719 946 AM
92 | 2 Probing vortex dynamics on a single vortex level by SSM
[39] Baert M Metlushko VV Jonckheere R Moshchalkov VV Bruynseraede Y Composite flux-linelattices stabilized in superconducting films by a regular array of artificial defects Phys RevLett 743269 1995
[40] Ge J Gutierrez J Raes B Cuppens J Moshchalkov VV Flux pattern transitions in the intermedi-ate state of a type-I superconductor driven by an ac field New J Phys 15033013 2013
[41] DeFeo MP Marchevsky M Localized ac response and stochastic amplification in a labyrinthinemagnetic domain structure in a yttrium iron garnet film Phys Rev B 73184409 2006
Brought to you by | Universiteacute de LiegravegeAuthenticated
Download Date | 102719 946 AM
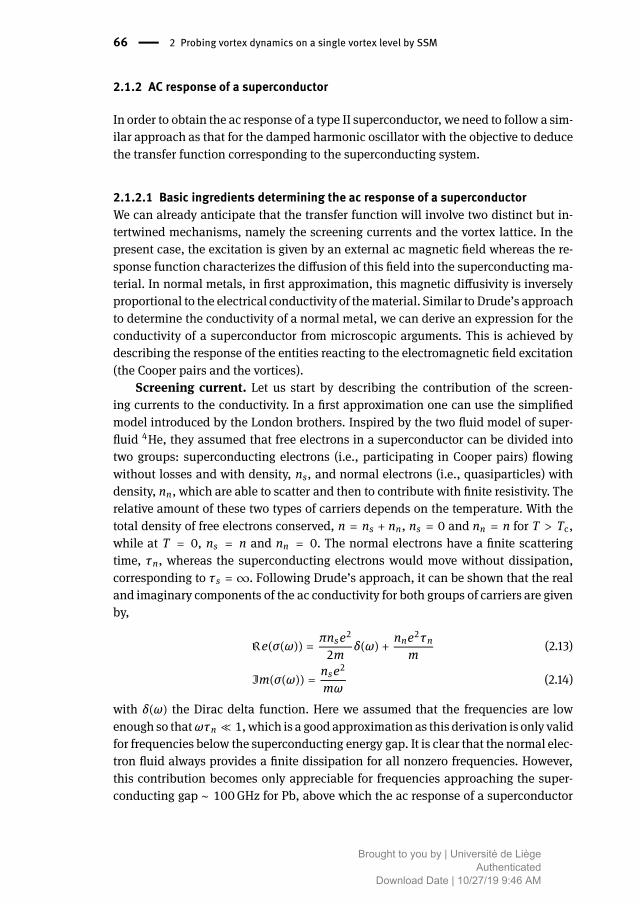
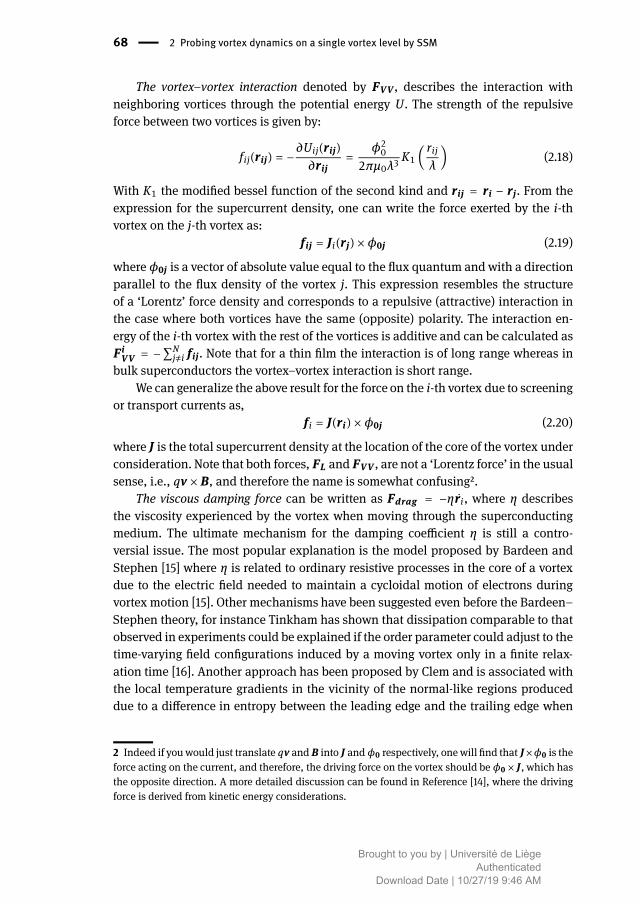
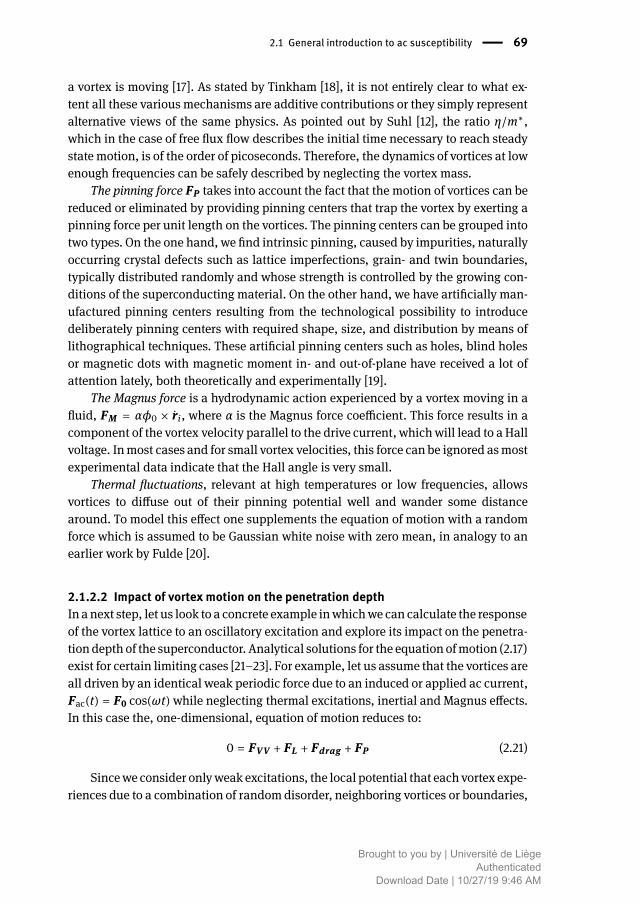
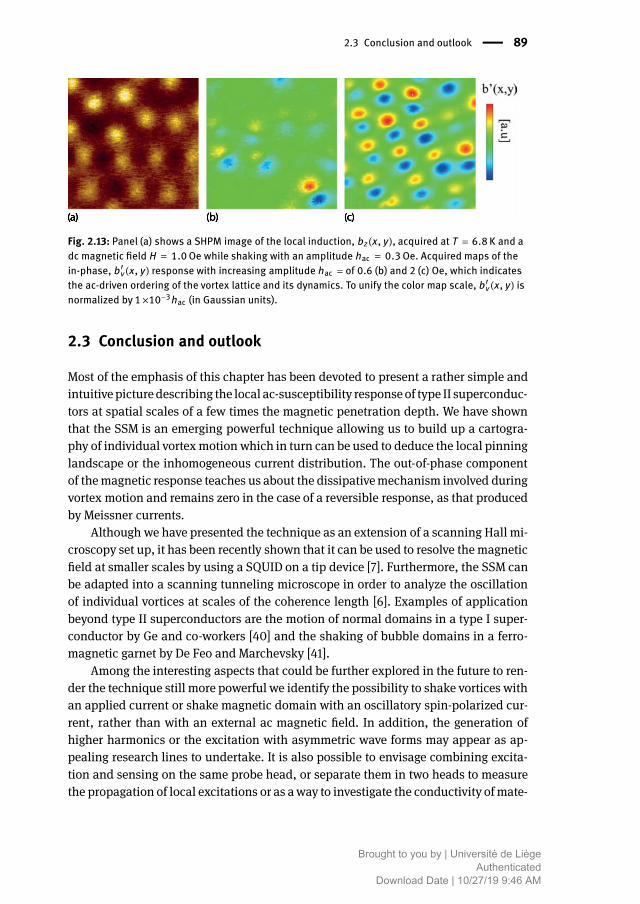