Jordan’s economic growth. JSF’s members are activ Remittances_1.pdf · The Economics of...
27
imm
Transcript of Jordan’s economic growth. JSF’s members are activ Remittances_1.pdf · The Economics of...

imm

2 The Economics of Jordanian Remittances: Some Issues We Should be Happy About & Enhance| MARCH 2018
The Jordan Strategy Forum (JSF) is a not-for-profit organization, which represents a group of Jordanian
private sector companies that are active in corporate and social responsibility (CSR) and in promoting
Jordan’s economic growth. JSF’s members are active private sector institutions, who demonstrate a
genuine will to be part of a dialogue on economic and social issues that concern Jordanian citizens. The
Jordan Strategy Forum promotes a strong Jordanian private sector that is profitable, employs
Jordanians, pays taxes and supports comprehensive economic growth in Jordan.
The JSF also offers a rare opportunity and space for the private sector to have evidence-based debate
with the public sector and decision-makers with the aim to increase awareness, strengthening the
future of the Jordanian economy and applying best practices.
For more information about the Jordan Strategy Forum, please visit our website at www.jsf.org or
contact us via email at [email protected]. Please visit our Facebook page at
Facebook.com/JordanStrategyForumJSF or our Twitter account @JSFJordan for continuous updates
aboutJordan Strategy Forum.
#JSFJo
@JSFJordan
/JordanStrategyForumJSF
Jordan Strategy Forum
Amman, Jordan T: +962 6 566 6476 F: +962 6 566 6376
3 The Economics of Jordanian Remittances: Some Issues We Should be Happy About & Enhance| MARCH 2018
1. Executive Summary ............................................................................................................................4
2. Introduction .......................................................................................................................................6
3. The Inflow of Jordanian Remittances: Some Observations ............................................................ 10
4. The Economics of Remittances ....................................................................................................... 14
5. Summary & Policy Implications ...................................................................................................... 17
References .............................................................................................................................................. 18
Appendix A .............................................................................................................................................. 19

4 The Economics of Jordanian Remittances: Some Issues We Should be Happy About & Enhance| MARCH 2018
No one should underestimate the socio-economic importance of Jordanians who work abroad and their remitted funds. Since 1965, the inflows of remittances have increased from JD 9.1 million to more than JD 2.6 Billion in 2016. Remittances can bring in a myriad of benefits to Jordanian society and economy.
They can promote real economic growth and development and reduce poverty. Remittances can also result in better housing, schooling, and health services. Even financial development (foreign exchange reserves, bank deposits and bank credit to the private sector) can benefit from this foreign cash inflow.
Jordanians who work abroad are an important asset for other reasons too. For so long, the economy has been suffering from consistently high unemployment rates. Even more disappointing, is the fact that unemployment is highest amongst the educated (with B.A or higher) and the young. Jordanians who work abroad, not only benefit the national economy through their remitted funds, but also reduce pressure on the local labor market. Without labor emigration, the unemployment challenge would become even more challenging. This policy paper, issued by the JSF, examines the impact of Jordanian remittances on: (1) Real economic growth and inflation. (2) Imports and trade deficit. (3) Bank deposits, bank credit to the private sector, and bank foreign exchange deposits (financial development). Based on our statistical analysis, the results are mostly encouraging. 1. Remittances have a positive impact on real
per capita GDP. If real remittances increase by 5%, real per capita income increases by 4.93%.
2. Remittances have a positive impact on real
GDP. If real remittances increase by 5%, real GDP increases by 7.67%.
3. The inflows of remittances have no impact
on the inflation rate in Jordan. 4. Remittances have a positive impact on bank
deposits. If real remittances increase by 5%, real bank deposits increase by 8.57%.
5. Remittances have a positive impact on bank
credit to the private sector. If real remittances increase by 5%, real bank credit to the private sector increases by 8.03%.
6. Remittances have a positive impact on bank
real deposits in foreign exchange. When real remittances increase by 5%, real bank deposits in foreign exchange increase by 4.82%.
7. Remittances have a negative impact of
imports. When real remittances increase by 5%, real imports increase by 8.61%.
9.1 53.3402.9
871.7
1716.4
2497.1 2628.6
0.0
500.0
1000.0
1500.0
2000.0
2500.0
3000.0
1965 1975 1985 1995 2005 2010 2016
The Inflows of Jordanian Remittances (JD million)

5 The Economics of Jordanian Remittances: Some Issues We Should be Happy About & Enhance| MARCH 2018
8. Remittances have a negative impact of trade deficit. When real remittances increase by 5%, trade deficit increase by 9.05%.
The Policy Implications are Clear, JSF recommends the following: 1. Considering the results and the economic
and social importance of the work of Jordanians abroad and its consequences on the macroeconomic and financial development factors. It is important that Jordan's policy in dealing with Jordanian expatriates’ affairs remains a priority for policy makers and decision-makers. There is also an urgent need to understand how to deal with Jordanian expatriates and to study their needs by all concerned parties from decision makers, private sector institutions and think tanks.
2. We need to understand the dynamics of the regional labor market in terms of the jobs created, their need for foreign labor, and the competition Jordanians face in these markets.
3. Jordan should seek to reduce the cost of transferring remittances from abroad to Jordan, especially in the countries where Jordanians are located. This does not only increase remittances, but also increase the inflow of official instead of unofficial remittances. This is at least one way to have a better estimate of the true size of remittance inflows.
4. The impact of remittances on imports and the trade deficit are obviously not encouraging. However, this problem trade deficit is not caused by just remittances. This is a structural problem that needs reducing or solving.

6 The Economics of Jordanian Remittances: Some Issues We Should be Happy About & Enhance| MARCH 2018
For so long, the issue of remittances by migrant workers has been attracting a lot of attention by academic researchers, think tanks, policy-makers, as well as by international organizations. This interest is due to several reasons. First, official flows of global workers’ remittances have increased from $1.9 billion in 1970 to more than $597 billion in 2017 (World Bank).
Second, remittances can bring a myriad of welfare benefits including better nutrition, housing, schooling, and health services. Third, in addition to their impact on developing countries’ foreign exchange reserves, remittances can promote real economic growth in the recipient as well as in the sending countries. Remittances can also reduce poverty.
Relative to the global size of remittances, it is also useful to note that this source of cash inflow has been more stable than other capital inflows (Figure 2). Moreover, it is not only
greater than overseas development assistance (ODA) and private debt and portfolio equity, but also fast catching-up with foreign direct investment (FDI).
Figure 2: Remittance Flows to Developing Countries (1990-2019)
Source: World Bank (2017)
Given the sheer size of global remittances, their stability, and resultant socio-economic benefits, it is not surprising that the International Day of Family Remittances (IDFR) was unanimously proclaimed by all 176
member states of the International Fund for Agricultural Development’s (IFAD) governing council in February 2015. Also, the Day was noted by the UN General Assembly’s Resolution on International Migration and Development.
1.9 37.0 67.9121.6
254.2
417.7
554.0 537.0597.7
0.0
200.0
400.0
600.0
800.0
1970 1980 1990 2000 2005 2010 2015 2016 2017
Figure 1: Personal Remittances in the World ($ Billions)

7 The Economics of Jordanian Remittances: Some Issues We Should be Happy About & Enhance| MARCH 2018
The issue of remittances has attracted so much scholarly attention. While impossible to review this effort, the JSF, in this policy paper, argues that much of the research attention has been devoted to answering eight main questions / issues. These are outlined below. First, how large are remittances? This question is important because some remittances are channeled through the informal sector and hence are not officially registered. Second, what determines the cost of remittance transfers? This is important for one simple reason and that is “cutting prices by at least 5 percentage points can save up to $16 billion a year” (World Bank). Third, what determinants remittances? Again, this question is important because once the main factors that affect the size of the remitted funds are known, policy-makers can adopt policies that promote this flow of capital. Fourth, what is the macro-level role of remittances? This question has raised a myriad of research issues including the impact of remittances on real economic growth, imports, trade deficit, and inflation. Fifth, what are the micro-level roles of remittances? Again, this question has raised a number of research issues including the impact of remittances on financial development (bank deposits, bank credit, and foreign exchange deposits. Sixth, what is the impact of remittances on various socio-economic issues including poverty and schooling quality of children? Seventh, the net cost of human capital flight for the sending country is referred to as a "brain drain". This effort attempts to examine whether
or not remittance-receiving economies are deprived of much-needed skilled employees. Finally, the research literature includes surveys
of expatriates. The objective of this effort is to
determine the social–demographic
characteristics of expatriates (i.e. age, marital
status, total number of members per
household, education level, occupation, income
level, and others), reasons to expatriate, uses of
the remitted funds, and others.
As one might expect, the results of the research effort that examines anyone of the above-mentioned issues are not consistent. For example, while more remittances result in more imports in some countries, such a relationship does not exist in others. It is really an “empirical issue”. Having said, it is useful to read the following quotations. “It is not about the money being sent home, it is about the impact on people’s lives. The small amounts of $200 or $300 that each migrant sends home make up about 60% of the family’s household income, and this makes an enormous difference in their lives and the communities in which they live” (G. Houngbo, President of the International Fund for Agricultural Development). “Analyses of 71 developing countries show significant poverty reduction effects of remittances: a 10% increase in per capita remittances leads to a 3.5% decline in the share of poor people in the population” (Migration Policy Institute). “Remittances have a positive effect on growth. Indeed, the large share of remittances is usually spent on daily consumer goods while the rest is saved and / or invested. Whatever the spending pattern is, remittances
The fifth Global Forum on Remittances and Development (GFRD), convened by IFAD, the World
Bank and the European Commission, took place from 16 to 19 June 2015 in Milan, Italy. The event
brought together more than 420 policymakers, private-sector stakeholders, civil-society leaders
and delegates from 70 countries, to pave the way for leveraging the development impact of
remittances” (IFAD).

8 The Economics of Jordanian Remittances: Some Issues We Should be Happy About & Enhance| MARCH 2018
contribute positively to economic growth” (Tabit and Moussir / IMF, 2017). “Since remittances increase purchasing power in general within the receiving economy, they also promote domestic demand and preferences here may actually be in favor of imported goods and services. This fact often results in the deterioration of the external trade balance” (Hien, 2017). “Remittances could have a positive effect on growth by providing financial resources for investment and education and through migrant networks that can foster trade and investment” (IMF, 2017). “On the one hand, emigration is likely to have a negative effect on growth in the home country as the departure of people of working age reduces the labor force. This loss could be significant in case of brain drain, as the loss of high-skilled workers could entail negative externalities for the broader economy,
including less scope for innovation” (IMF, 2017). “A one percentage point increase in the share of remittances to GDP suggests around a 0.5-0.6 percentage point increase in the ratio of deposits to GDP, while it leads to at most a 0.3 percentage point rise in the share of credit to GDP” (World Bank). Relative to the above-mentioned observations, it would be important to examine the economics of remittances in the Jordanian scene. Again, this is due to several reasons. (1) The inflows of remittances have increased from JD9.1 million in 1965 to more than JD2.6 billion in 2016. (2) Notwithstanding the fact that there is no officially reported number of Jordanian migrants, “in 2014, an estimated 786,000 Jordanian migrants were residing abroad, that is 10.5% of the country’s total national population. As expected, most of these migrants reside in the Gulf States, especially Saudi Arabia (Table 1).
Estimates of Jordanian Migrants by Region & Selected Countries (2013-2015)
Country / Region Number of Migrants Proportion
Saudi Arabia 250,000 31.8%
UAE 200,000 25.4%
Kuwait 55,081 7.0%
Qatar 40,000 5.1%
Oman 7,403 0.9%
Bahrain 7,000 0.9%
Other Arab Countries 100,516 12.8%
North America 75,018 9.5%
Europe 31,541 4.0%
Other Countries 20,000 2.5%
Total Emigrants 786,000 100.0%
Source: Adapted from Bel-Air (2016)
9.1 53.3402.9
871.7
1716.4
2497.1 2628.6
0.0
1000.0
2000.0
3000.0
4000.0
5000.0
1965 1975 1985 1995 2005 2010 2016
Figure 3: Inflow of Jordanian Workers' Remittances (JD million)

9 The Economics of Jordanian Remittances: Some Issues We Should be Happy About & Enhance| MARCH 2018
This policy paper, issued by the JSF, examines the economics of Jordanian remittances in terms of some important issues. These are: 1. The impact of remittance inflows on real
economic growth and inflation. 2. The impact of remittance inflows on
imports and trade deficit. 3. The impact of remittance inflows on bank
deposits, bank credit, and bank foreign exchange deposits (financial development).
Relative to our objectives in this policy paper, it is worth noting that the JSF published back in
2017 a paper that contained three sections. The first section identifies the effects of the return of expatriates on certain economic indicators. The second section discusses the main benefit that result from the migration of human capital. The final section provides some recommendations in case Jordanians return back home. These include the introduction of an “active outreach program as soon as possible. This should be facilitated through government institutions in conjunction with the various chambers of commerce and industry. The recent attempts of a compilation of an expatriate database by the Ministry of Foreign Affairs and Expatriates enables the completion of this activity” (JSF, 2017).

10 The Economics of Jordanian Remittances: Some Issues We Should be Happy About & Enhance| MARCH 2018
It is probably accurate to state that the 1967 and 1973 Arab-Israeli Wars have had a significant and lasting impact on Jordan. While the 1967 War resulted in a large influx of Palestinian refugees, the 1973 War and its’ resultant oil embargo caused the price of this commodity to increase from $3 per barrel to $12 by 1974. The impact of these observations on the socio-economic of Jordan should not be underestimated. First, the fact that Jordan is a small country with limited natural resources, many of the Palestinians had no choice but to look for employment opportunities abroad; mainly in the Arab Gulf countries.
Second, as a result of the rise in oil prices, the Gulf Cooperation Council (GCC) countries initiated ambitious development plans which required manpower from abroad, including Jordan. Together, the above-mentioned observations explain the increase in the inflow of workers’ remittances. Remittances have become a major source of foreign exchange inflow (Figure 4). These inflows increased from JD 9.1 million in 1965 to more than JD 2.6 billion by the end of 2016.
To re-inforce the importance of Jordanian remittances, one needs to realize that they are not only larger than foreign direct investments (FDI) and foreign grants, and account for a large proportion of national exports, but also the most stable (Figure 5).
9.1 53.3402.9
871.7
1716.4
2497.1 2628.6
0.0
1000.0
2000.0
3000.0
4000.0
1965 1975 1985 1995 2005 2010 2016
Figure 4: The Inflow of Jordanian Remittances (JD Millions)
1198.9 1102.6
401.7 836
4216.948 4396.513
2497.1 2628.6
0
1000
2000
3000
4000
5000
6000
2010 2011 2012 2013 2014 2015 2016
Figure 5: Relative Importance of Remittances (JD Million)
FDI Grants Exports Remittances

11 The Economics of Jordanian Remittances: Some Issues We Should be Happy About & Enhance| MARCH 2018
Notwithstanding the fact that during the period 1970-2016, the inflows of remittances have increased in most years, they have reflected great variations relative to GDP (Figure 6). For example, in 1984, remittances to GDP ratio was at its highest (24.9%). Since 2001, the flow of
remittances to GDP ratio has been on a downward trend. This indicates that nominal GDP has been increasing at a faster rate than remittances. Having said that, one can argue that remittance inflows still represent a large proportion of the national economy.
In addition to the above observations, it is useful to put Jordanian remittances in terms of their international perspective. First, in terms of amounts, during the period 2010-2017, India was the top remittance recipient country in the world (World Bank). With a mean annual value of $17.1 billion, Egypt is the only Arab country which is among the top ten.
5.5
2628.6
2.4%
24.9%
9.6%
0.0%
5.0%
10.0%
15.0%
20.0%
25.0%
30.0%
0.0
500.0
1000.0
1500.0
2000.0
2500.0
3000.0
3500.0
1970
1972
1974
1976
1978
19
80
1982
1984
1986
1988
1990
1992
1994
1996
1998
20
00
2002
2004
2006
2008
2010
2012
2014
2016
Re
mit
tan
ce
s t
o G
DP
Ra
tio
JD
Millio
n
Figure 6: Remittance Inflows to GDP Ratio
Inflows Inflows to GDP
65.3
60.2
26.7
25.3
23.5
20.8
17.1
16.0
15.8
13.5
0.0 10.0 20.0 30.0 40.0 50.0 60.0 70.0
India
China
Philippines
Mexico
France
Nigeria
Egypt
Germany
Pakistan
Bangladesh
Figure 7: Top Ten Remittance Recipient Countries 2010-2017 Annual Mean ($ Billion)

12 The Economics of Jordanian Remittances: Some Issues We Should be Happy About & Enhance| MARCH 2018
Second, while Jordan received much lower remittances than Morocco, Lebanon, and Egypt, no one should underestimate the $4.6 billion annually remitted Jordanian funds (Figure 8). Indeed, if we look at remittances in terms of “per capita”, Lebanon and Jordan
become the top two countries in the world (Figure 9). During the period 2010-2017, while Lebanon received a mean annual value of $1393 per person in remittances, Jordan’s figure ($553) is higher than Egypt ($190), India ($51), and China ($44).
Third, it is interesting to note that Saudi Arabia is the largest source of Jordanian remittances. From Saudi Arabia, Jordanian expatriates remit
38.8% of all remittances (Figure 10). This is followed by the UAE (19.6%), and the United States (10.0%).
1.6 1.6 2.0 2.1 2.94.6
7.07.3
17.1
0.0
5.0
10.0
15.0
20.0
Palestine Syria Algeria Tunisia Yemen Jordan Morocco Lebanon Egypt
Figure 8: Remittance Inflows 2010-2017 Annual Mean ($ Billion)
44
51
52
82
86
87
112
121
190
192
197
206
207
271
356
388
553
1393
0 200 400 600 800 1000 1200 1400 1600
China
India
Algeria
Syria
Bangladesh
Pakistan
Yemen
Nigeria
Egypt
Tunisia
Germany
Morocco
Mexico
Philippines
France
Palestine
Jordan
Lebanon
Figure 9: Remittance Inflows Per Capita 2010-2017 ($)

13 The Economics of Jordanian Remittances: Some Issues We Should be Happy About & Enhance| MARCH 2018
Finally, it is useful to note that the World Bank (Remittance Prices World Wide) monitors the cost per $200 remitted funds. The latest available figures (1st Quarter 2017) indicate that Jordan has relatively low cost (Figure 11). This cost, however, varies from one sending country
to another. The cost of sending, on average, $200 from Qatar to Jordan (Figure 12) is equal to 4.53% and this is much lower than its equivalent from the USA (7.59%). Naturally, decreasing this cost implies an increase in remittances.
1.0%
1.1%
1.2%
1.6%
1.7%
2.1%
5.1%
5.3%
5.7%
6.9%
10.0%
19.6%38.8%
-5.0% 0.0% 5.0% 10.0% 15.0% 20.0% 25.0% 30.0% 35.0% 40.0% 45.0%
Indonesia
Canada
Oman
Bahrain
Germany
Libya
Kuwait
Palestine
Qatar
Others
United States
UAE
Saudi Arabia
Figure 10: Source of the 2016 Remittance Inflows
4.91%5.71% 5.95% 6.14%
7.47% 7.62% 7.84% 8.46%
12.15%
0.00%
2.00%
4.00%
6.00%
8.00%
10.00%
12.00%
14.00%
Sri Lanka Jordan Egypt India Tunisia Turkey Indonesia Malaysia Lebanon
Figure 11: Cost Per $200 Remitted Funds
7.59%6.84%
5.91% 4.80%4.64% 4.53%
0.00%
2.00%
4.00%
6.00%
8.00%
USA Kuwait Saudi Arabia UAE Oman Qatar
Figure 12: Cost of Sending Remattances to Jordan

14 The Economics of Jordanian Remittances: Some Issues We Should be Happy About & Enhance| MARCH 2018
As stated in the introduction, the primary aim of this policy paper is to examine the impact of remittances on real per capital income, inflation, imports and trade deficit, and on financial development (bank deposits, bank credit, and bank foreign exchange deposits. We use annual data (1993-2016) of real per capita income (GDPPC), real imports (IMPORT) and real trade deficit (TRADE), consumer price index (INFLATION), real credit to private sector (CREDIT), real bank deposits (DEPOSIT), and real foreign exchange deposits (FOREIGN).
A simple look at the behavior of remittances and per capita income reflects some underlying positive relationship (Figure 11A). This behavior is also reflected between remittances and imports, trade deficit, bank deposits, bank credit, and foreign exchange deposits. The only exception here is the behavior of remittances and inflation where the points are more scattered (Figure 11B).
2000
7000
12000
17000
500 1000 1500 2000 2500 3000
Real
Imp
ort
s
Real Remittances
Figure 11C: Remittances & Imports (JD Million)
-1.00
4.00
9.00
14.00
500 1000 1500 2000 2500 3000
Infl
ati
on
Real Remittances
Figure 11B: Remittances (JD Million) & Inflation Rate (%)
1000
1500
2000
2500
3000
3500
4000
4500
500 1000 1500 2000 2500 3000
Real
Per
Cap
ita G
DP
Real Remittances
Figure 11A: Remittances & Per Capita Income (JD Million)

15 The Economics of Jordanian Remittances: Some Issues We Should be Happy About & Enhance| MARCH 2018
Based on these Figures, however, we cannot state that when remittances increase real per capita income would increase. Similarly, we cannot argue that bank deposits increase when remittances increase. In statistics, spurious
(wrong) relationship is a relationship in which two variables are not causally related to each other, and yet it may wrongly be inferred that they are due to coincidence or the presence of another (third) variable (not seen). For
1700
2700
3700
4700
5700
6700
7700
500 1000 1500 2000 2500 3000
Real
Fo
reig
n E
xch
an
ge
Dep
osit
s
Real Remittances
Figure 11G: Remittances & Foreign Exchange Deposits (JD Million)
2500
7500
12500
17500
22500
27500
500 1000 1500 2000 2500 3000
Real
Ban
k C
red
it
Real Remittanes
Figure 11F: Remittances & Bank Credit (JD Million)
4500
9500
14500
19500
24500
29500
34500
500 1000 1500 2000 2500 3000
Real
Ban
k D
ep
osit
s
Real Remittances
Figure 11E: Remittances & Bank Deposits (JD Million)
1200
3200
5200
7200
9200
11200
500 1000 1500 2000 2500 3000
Real
Tra
de D
efi
cit
Real Remittances
Figure 11D: Remittances & Trade Deficit (JD Million)

16 The Economics of Jordanian Remittances: Some Issues We Should be Happy About & Enhance| MARCH 2018
example, “a spurious relationship can be seen by examining a city's ice cream sales. These sales are highest when the rate of drownings in city swimming pools is highest. To allege that ice cream sales cause drowning, or vice versa, would be to imply a spurious relationship between the two. In reality, a heat wave may have caused both. The heat wave is an example of a hidden or unseen variable, also known as a confounding variable” (Wikipedia). To examine the relationship between remittances and real per capital income, inflation, imports, trade deficit, bank deposits, bank credit, and foreign exchange deposits, we need to use more sophisticated methodologies than just reporting Figure 11A-11G. This is why, and for the technical reader, our methodology and detailed statistical results are reported in Appendix A. Here, we simply outline the main results and provide comments. 1. The long-run real per capita income
elasticity is equal to 0.986. This means that when real remittances increase by, for example, 5%, real per capita income increases by 4.93% [5*0.986 = 4.93].
2. The long-run real GDP elasticity is equal to
1.534. This means that when real remittances increase by, for example, 5%, real GDP increases by 7.67% [5*1.534 = 7.67%].
3. The long-run real import elasticity is equal
to 1.722. This means that when real remittances increase by, for example, 5%, real imports increase by 8.61% [5* 1.722 = 8.61%]. This result implies that a decent proportion of the remitted funds are spent on durable and luxury imported items, and this accelerates imports and ultimately widening the trade deficit.
4. The long-run real credit to the private
sector elasticity is equal to 1.606. This means that when real remittances increase by, for example, 5%, real bank credit to the
private sector increases by 8.03% [5* 1.606= 8.03%].
5. There is no long-run relationship between
real remittances and inflation. This result is not really surprising given the fact that the Jordanian Dinar is pegged to the US dollar, and a large proportion of Jordanian imports are from the European Union countries. The inflation rate in Jordan is affected by not only the euro price of these imports, but also the change in the euro against the dollar. Also, one must not forget the relatively huge oil imports and their prices on the international market.
6. The long-run bank real deposits elasticity is
equal to 1.714. This means that when real remittances increase by, for example, 5%, real bank deposits increase by 8.57% [5* 1.714= 8.57%].
7. The long-run bank real deposits in foreign
exchange elasticity is equal to 0.964. This means that when real remittances increase by, for example, 5%, real bank deposits in foreign exchange increase by 4.82% [5* 0.964= 4.82%].
8. Real remittance inflows reflect increasing
power in explaining the annual variability (changes) of real per capita income over time and real GDP over time.
9. Real remittance inflows reflect increasing
power in explaining the annual variability (changes) of imports, bank deposits, and foreign exchange deposits over time. However, the largest increasing power of remittance inflows lies in explaining the annual changes of bank credit to the private sector.
10. Real remittance inflow reflect very weak
power in explaining the annual variability (changes) of inflation over time.

17 The Economics of Jordanian Remittances: Some Issues We Should be Happy About & Enhance| MARCH 2018
This policy paper, issued by the JSF, examined the economics of Jordanian remittances in terms of some issues. Based on our analyses, the results are encouraging. Remittances do promote real economic growth (per capita income and GDP), bank deposits, bank credit to the private sector, and bank foreign exchange deposits. In addition, remittances have no impact on inflation. The only discouraging observation is the positive impact of remittances on both imports and trade deficit. IN A NUTSHELL, Jordanians who work in the Gulf countries and in other regions are too important for the national economy. For so long, the Jordanian economy has been suffering from consistently high unemployment rates. Official statistics (Department of Statistics) report that male and female unemployment rates stand at 15.4% and 30.0% respectively (3rd quarter 2017). Naturally, these figures reflect that the economy has not been growing sufficiently enough to reduce unemployment. This is why Jordanians who work abroad, not only benefit the Jordanian economy through their remitted funds and their impact on real economic growth, but also by reducing pressure on the labor market. Without labor emigration, the unemployment challenge would become more than a challenge. The Policy Implications are Clear….. First, the issue of Jordanian emigration and their resultant remittances must always remain a priority for all stakeholders. Second, to increase the inflow of remittances, and to enhance their impact on, among others, economic growth, we desperately need to understand Jordanians who work abroad and their remitting behavior. We need to have regular surveys of Jordanians in diaspora that inform policy-makers about the total number
of Jordanians who work abroad, their socio-economic characteristics (gender, age, education level and specialization, marital status, type of work, income level, amount and uses of the remitted funds, years spent in diaspora, reasons for emigration, challenges they face in the host country, job opportunities and competition in the host country, intention to come back to Jordan and after how long, and many others). Third, We also need to understand the dynamics of the regional labor markets in terms of the jobs they create, their needs for foreign labor, and the competition that Jordanians face in these markets. With such sufficient, accurate, timely and regular information, all stakeholders, including those who think or plan to emigrate themselves, can be instrumental in maximizing the inflow of remittances into the Jordanian economy. Fourth, if the cost of sending remittances is reduced from 5.71% to say, 3.0%, the 2.71% reduction implies that official remittances in 2016 would have increased by around JD70 million (2628*0.0271). This increase might not be large. However, reducing the cost of sending remittances might well increase the inflow of official instead of unofficial remittances. This is at least one way to have a better estimate of the true size of remittance inflows. Finally, the impact of remittances on imports and the trade deficit are obviously not encouraging. However, this problem (trade deficit) is not caused by just remittances. This is a structural problem that needs reducing or solving. A subject matter that warrants a separate paper.

18 The Economics of Jordanian Remittances: Some Issues We Should be Happy About & Enhance| MARCH 2018
Bel-Air, F. (2016), “Migration Profile: Jordan”, Robert Shuman Center for Advanced Studies, Migration Policy Center. Tabit, S. and C. Moussir (2017), “IMPACT OF MIGRANTS’ REMITTANCES ON ECONOMIC GROWTH: CASE OF MOROCCO”, International Journal of Innovation and Applied Studies. Hien, N. (2017), “The Impact of Remittance on Trade Balance: The Case of Malaysia”, Journal of Economics and Public Finance. JSF (2017), “Jordanian Expatriates: A Challenging Opportunity”.

19 The Economics of Jordanian Remittances: Some Issues We Should be Happy About & Enhance| MARCH 2018
The Data and Methodology:
Annual data (1993-2016) of real per capita income (GDPPC), real imports (IMPORT), real trade deficit
(DEFICIT), consumer price index (INFLATION), real credit to the private sector (CREDIT), real bank
deposits (DEPOSIT), and real foreign exchange deposits (FOREIGN) are used in the analysis.
The basic models specifying the role of remittances are expressed as follows:
GDPPCt = α0 + β1REMt + εt
IMPORTt = α0 + β1REMt + εt
DEFICITt = α0 + β1REMt + εt
INFLATIONt = α0 + β1REMt + εt
CREDITt = α0 + β1REMt + εt
DEPOSITt = α0 + β1REMt + εt
FOREIGNt = α0 + β1REMt + εt
where, REM is real remittance inflows, t is the time period (1993-2016) and ε is the error term. Finally,
all of the variables are in their natural logarithm form.
The focus of this analysis is on the parameter β. If there is an impact of remittances on each variable, the term β will have a positive sign (β > 0) in all expressions. In such an exercise, the usual techniques are applied and these include, stationarity test, co-integration, Vector Error Correction Model (VECM), Granger Causality, and variance decomposition analysis.
20 The Economics of Jordanian Remittances: Some Issues We Should be Happy About & Enhance| MARCH 2018
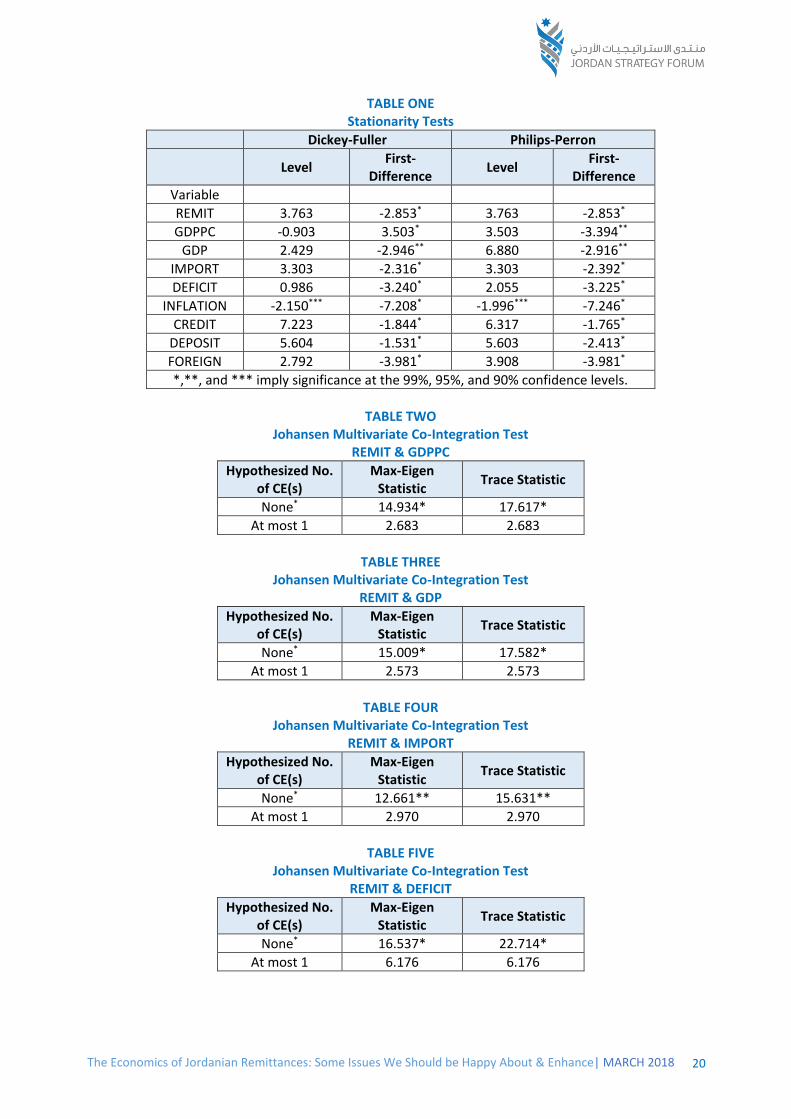
TABLE ONE Stationarity Tests
Dickey-Fuller Philips-Perron
Level First-
Difference Level
First-Difference
Variable
REMIT 3.763 -2.853* 3.763 -2.853*
GDPPC -0.903 3.503* 3.503 -3.394**
GDP 2.429 -2.946** 6.880 -2.916**
IMPORT 3.303 -2.316* 3.303 -2.392*
DEFICIT 0.986 -3.240* 2.055 -3.225*
INFLATION -2.150*** -7.208* -1.996*** -7.246*
CREDIT 7.223 -1.844* 6.317 -1.765*
DEPOSIT 5.604 -1.531* 5.603 -2.413*
FOREIGN 2.792 -3.981* 3.908 -3.981*
*,**, and *** imply significance at the 99%, 95%, and 90% confidence levels.
TABLE TWO
Johansen Multivariate Co-Integration Test REMIT & GDPPC
Hypothesized No. of CE(s)
Max-Eigen Statistic
Trace Statistic
None* 14.934* 17.617*
At most 1 2.683 2.683
TABLE THREE
Johansen Multivariate Co-Integration Test REMIT & GDP
Hypothesized No. of CE(s)
Max-Eigen Statistic
Trace Statistic
None* 15.009* 17.582*
At most 1 2.573 2.573
TABLE FOUR
Johansen Multivariate Co-Integration Test REMIT & IMPORT
Hypothesized No. of CE(s)
Max-Eigen Statistic
Trace Statistic
None* 12.661** 15.631**
At most 1 2.970 2.970
TABLE FIVE
Johansen Multivariate Co-Integration Test REMIT & DEFICIT
Hypothesized No. of CE(s)
Max-Eigen Statistic
Trace Statistic
None* 16.537* 22.714*
At most 1 6.176 6.176

21 The Economics of Jordanian Remittances: Some Issues We Should be Happy About & Enhance| MARCH 2018
TABLE SIX Johansen Multivariate Co-Integration Test
REMIT & INFLATION
Hypothesized No. of CE(s)
Max-Eigen Statistic
Trace Statistic
None* 7.384 11.405
At most 1 4.021 4.021
TABLE SEVEN
Johansen Multivariate Co-Integration Test REMIT & CREDIT
Hypothesized No. of CE(s)
Max-Eigen Statistic
Trace Statistic
None* 13.641* 13.806*
At most 1 0.165 0.165
TABLE EIGHT
Johansen Multivariate Co-Integration Test REMIT & DEPOSIT
Hypothesized No. of CE(s)
Max-Eigen Statistic
Trace Statistic
None* 14.160** 15.627**
At most 1 1.466 1.466
TABLE NINE
Johansen Multivariate Co-Integration Test REMIT & FOREIGN
Hypothesized No. of CE(s)
Max-Eigen Statistic
Trace Statistic
None* 14.533* 20.107*
At most 1 5.574* 5.574*
TABLE TEN
Estimates of VEC Model (REM & GDPPC)
Variable Coefficient Std. Error t-statistic
λet-1 -0.249 0.100 -2.467*
∆GDPPC(-1) -0.712 0.224 -3.181*
∆GDPPC(-2) 0.337 0.301 1.119
∆REMIT(-1) 0.192 0.175 1.094
∆REMIT(-2) 0.443 0.184 2.408
Adjusted R-Squared 0.614
F-Statistic 6.037

22 The Economics of Jordanian Remittances: Some Issues We Should be Happy About & Enhance| MARCH 2018
TABLE ELEVEN VARIANCE DECOMPOSITION OF GDPPC
Period GDPPC REMIT
1 100.000 0.000
2 93.366 6.633
3 94.689 5.311
4 83.952 16.047
5 81.935 18.064
6 80.022 19.977
7 79.265 20.734
8 79.671 20.328
9 80.447 19.552
10 80.792 19.207
TABLE TWELVE
Pair-wise Granger Causality Tests
Null Hypothesis F-Statistic Probability
REMIT does not Granger cause GDPPC 1.272 0.307
GDPPC does not Granger cause REMIT 6.983 0.006
TABLE THIRTEEN
Estimates of VEC Model (REM & GDP)
Variable Coefficient Std. Error t-statistic
λet-1 -0.100 0.068 -1.439*
∆GDP(-1) -0.297 0.215 -1.378*
∆GDP(-2) -0.187 0.185 -1.011
∆REMIT(-1) 0.018 0.204 0.091
∆REMIT(-2) 0.304 0.151 2.005*
Adjusted R-Squared 0.448
F-Statistic 3.575
TABLE FOURTEEN
VARIANCE DECOMPOSITION OF GDP
Period GDP REMIT
1 100.000 0.000
2 93.838 6.161
3 89.606 10.393
4 85.872 14.127
5 85.957 14.043
6 87.076 12.924
7 87.910 12.089
8 88.686 11.313
9 89.301 10.698
10 89.648 10.351
23 The Economics of Jordanian Remittances: Some Issues We Should be Happy About & Enhance| MARCH 2018
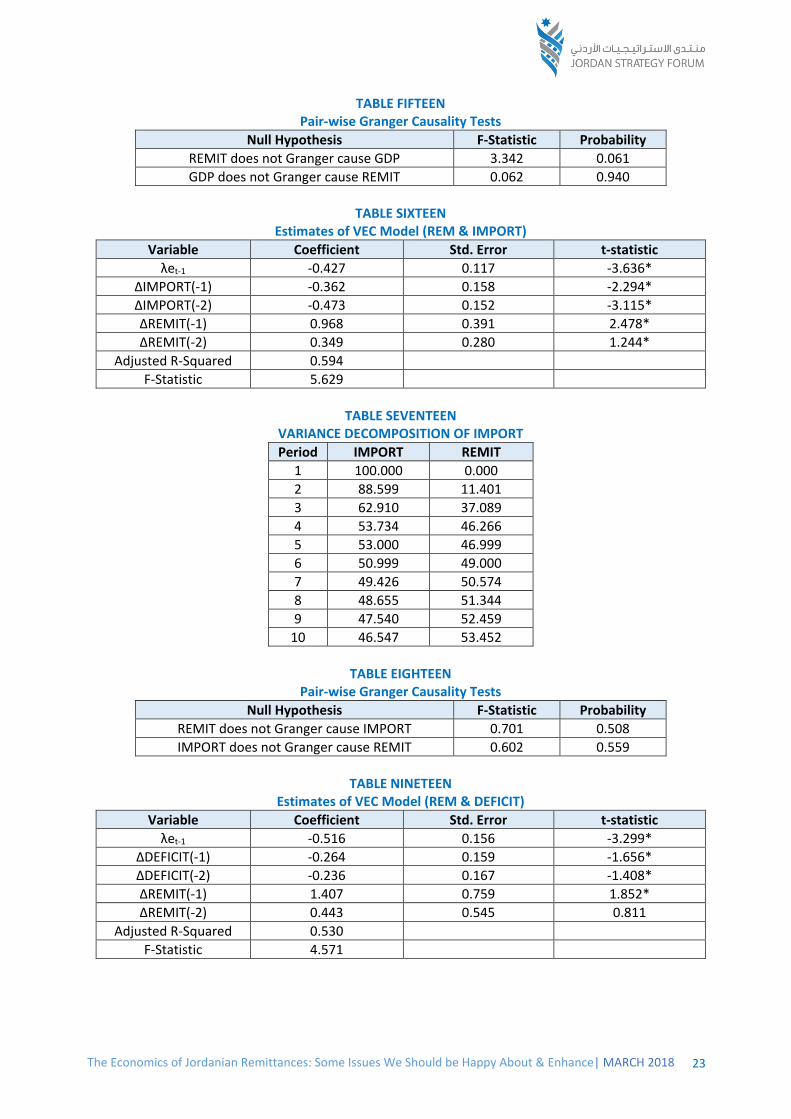
TABLE FIFTEEN Pair-wise Granger Causality Tests
Null Hypothesis F-Statistic Probability
REMIT does not Granger cause GDP 3.342 0.061
GDP does not Granger cause REMIT 0.062 0.940
TABLE SIXTEEN
Estimates of VEC Model (REM & IMPORT)
Variable Coefficient Std. Error t-statistic
λet-1 -0.427 0.117 -3.636*
∆IMPORT(-1) -0.362 0.158 -2.294*
∆IMPORT(-2) -0.473 0.152 -3.115*
∆REMIT(-1) 0.968 0.391 2.478*
∆REMIT(-2) 0.349 0.280 1.244*
Adjusted R-Squared 0.594
F-Statistic 5.629
TABLE SEVENTEEN
VARIANCE DECOMPOSITION OF IMPORT
Period IMPORT REMIT
1 100.000 0.000
2 88.599 11.401
3 62.910 37.089
4 53.734 46.266
5 53.000 46.999
6 50.999 49.000
7 49.426 50.574
8 48.655 51.344
9 47.540 52.459
10 46.547 53.452
TABLE EIGHTEEN
Pair-wise Granger Causality Tests
Null Hypothesis F-Statistic Probability
REMIT does not Granger cause IMPORT 0.701 0.508
IMPORT does not Granger cause REMIT 0.602 0.559
TABLE NINETEEN
Estimates of VEC Model (REM & DEFICIT)
Variable Coefficient Std. Error t-statistic
λet-1 -0.516 0.156 -3.299*
∆DEFICIT(-1) -0.264 0.159 -1.656*
∆DEFICIT(-2) -0.236 0.167 -1.408*
∆REMIT(-1) 1.407 0.759 1.852*
∆REMIT(-2) 0.443 0.545 0.811
Adjusted R-Squared 0.530
F-Statistic 4.571
24 The Economics of Jordanian Remittances: Some Issues We Should be Happy About & Enhance| MARCH 2018
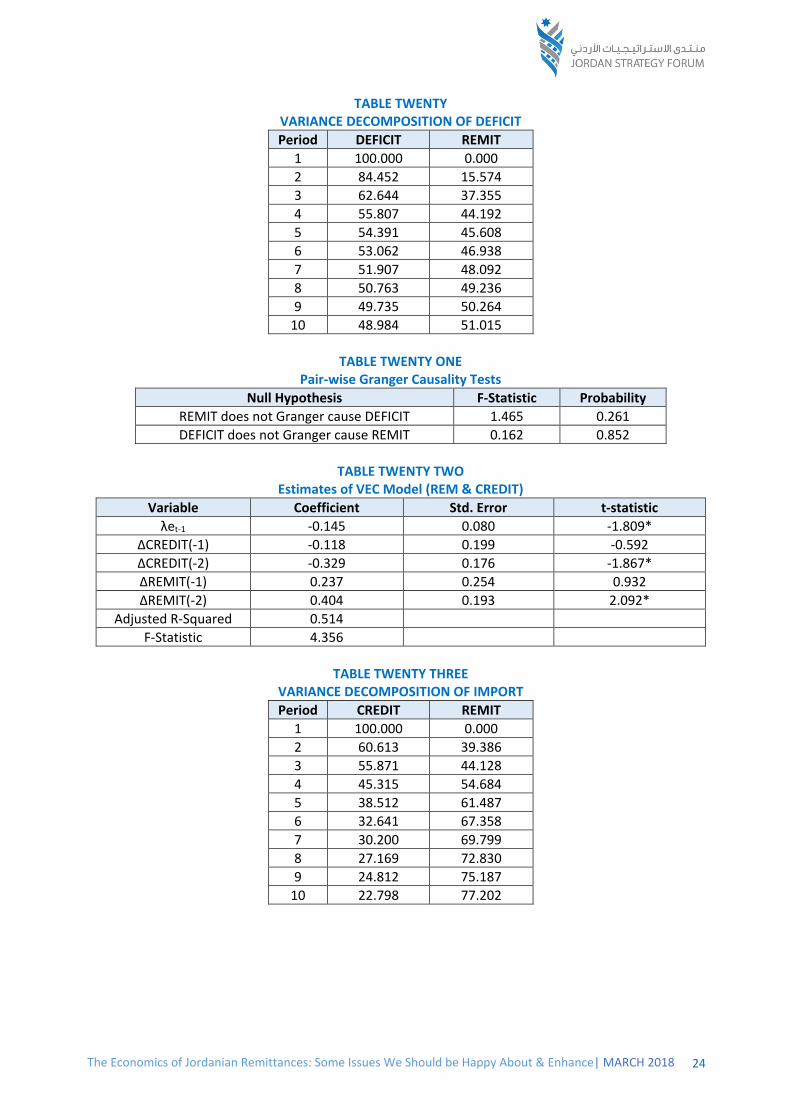
TABLE TWENTY VARIANCE DECOMPOSITION OF DEFICIT
Period DEFICIT REMIT
1 100.000 0.000
2 84.452 15.574
3 62.644 37.355
4 55.807 44.192
5 54.391 45.608
6 53.062 46.938
7 51.907 48.092
8 50.763 49.236
9 49.735 50.264
10 48.984 51.015
TABLE TWENTY ONE
Pair-wise Granger Causality Tests
Null Hypothesis F-Statistic Probability
REMIT does not Granger cause DEFICIT 1.465 0.261
DEFICIT does not Granger cause REMIT 0.162 0.852
TABLE TWENTY TWO
Estimates of VEC Model (REM & CREDIT)
Variable Coefficient Std. Error t-statistic
λet-1 -0.145 0.080 -1.809*
∆CREDIT(-1) -0.118 0.199 -0.592
∆CREDIT(-2) -0.329 0.176 -1.867*
∆REMIT(-1) 0.237 0.254 0.932
∆REMIT(-2) 0.404 0.193 2.092*
Adjusted R-Squared 0.514
F-Statistic 4.356
TABLE TWENTY THREE
VARIANCE DECOMPOSITION OF IMPORT
Period CREDIT REMIT
1 100.000 0.000
2 60.613 39.386
3 55.871 44.128
4 45.315 54.684
5 38.512 61.487
6 32.641 67.358
7 30.200 69.799
8 27.169 72.830
9 24.812 75.187
10 22.798 77.202

25 The Economics of Jordanian Remittances: Some Issues We Should be Happy About & Enhance| MARCH 2018
TABLE TWENTY FOUR Pair-wise Granger Causality Tests
Null Hypothesis F-Statistic Probability
REMIT does not Granger cause CREDIT 3.770 0.045
CREDIT does not Granger cause REMIT 2.020 0.165
TABLE TWENTY FIVE
Pair-wise Granger Causality Tests
Null Hypothesis F-Statistic Probability
REMIT does not Granger cause INFLATION 2.453 0.118
INFLATION does not Granger cause REMIT 1.667 0.219
TABLE TWENTY SIX
Estimates of VEC Model (REM & DEPOSIT)
Variable Coefficient Std. Error t-statistic
λet-1 -0.225 0.109 -2.057*
∆DEPOSIT(-1) 0.369 0.326 1.133
∆DEPOSIT(-2) 0.318 0.230 1.383
∆REMIT(-1) 0.219 0.248 0.883
∆REMIT(-2) 0.305 0.220 1.389
Adjusted R-Squared 0.577
F-Statistic 5.324
TABLE TWENTY SEVEN
VARIANCE DECOMPOSITION OF DEPOSIT
Period DEPOSIT REMIT
1 100.000 0.000
2 82.246 17.754
3 81.465 18.534
4 74.729 25.271
5 73.331 26.668
6 70.484 29.515
7 70.304 29.695
8 66.965 33.034
9 65.341 34.658
10 62.933 37.066
TABLE TWENTY EIGHT
Pair-wise Granger Causality Tests
Null Hypothesis F-Statistic Probability
REMIT does not Granger cause DEPOSIT 1.235 0.317
DEPOSIT does not Granger cause REMIT 0.720 0.501

26 The Economics of Jordanian Remittances: Some Issues We Should be Happy About & Enhance| MARCH 2018
TABLE NINE Estimates of VEC Model (REM & FOREIGN)
Variable Coefficient Std. Error t-statistic
λet-1 -0.516 0.195 -2.639*
∆FOREIGN(-1) -0.749 0.159 -4.704*
∆FOREIGN(-2) -0.440 0.161 -2.728*
∆REMIT(-1) 0.209 0.523 0.399
∆REMIT(-2) -0.235 0.354 -0.663
Adjusted R-Squared 0.675
F-Statistic 7.593
TABLE THIRTY
VARIANCE DECOMPOSITION OF FOREIGN
Period FOREIGN REMIT
1 100.000 0.000
2 72.038 27.961
3 68.953 31.047
4 73.448 26.551
5 63.689 36.310
6 65.254 34.745
7 64.988 35.011
8 61.613 38.386
9 62.711 37.288
10 61.580 38.419
TABLE THIRTY ONE
Pair-wise Granger Causality Tests
Null Hypothesis F-Statistic Probability
REMIT does not Granger cause FOREIGN 2.757 0.094
FOREIGN does not Granger cause REMIT 0.990 0.393