
Jordan Water Sector Facts and Figures 2013 - mwi.gov.jo. in Fig.E FINAL E.pdf · Jordan Water...
18
Jordan Water Sector Facts and Figures 2013
Transcript of Jordan Water Sector Facts and Figures 2013 - mwi.gov.jo. in Fig.E FINAL E.pdf · Jordan Water...

Jordan Water SectorFacts and Figures
2013

Jordan Water SectorFacts and Figures
2013Imprint
Publication supported by: Deutsche Gesellschaft für Internationale Zusammenarbeit (GIZ) GmbH
Contact InfoMinistry of Water and IrrigationP.O. Box 2412 - 5012 Amman 11118 JordanT: +962 6 5652265 / +962 6 5652267F: +962 6 5652287I : www.mwi.gov.jo
PrintJanuary 2015 - First Edition
Material Collected and Reviewed by:Geo. Thair Al-Momani - MWIEng. Mohammad R. Al Momani - MWIEng. Ali Subah - MWIMr. Nayef Hammad - GIZ

Jordan Water Sector Facts and Figures 2013
Opening Statement
H.E. Dr. Hazim El-NaserMinister of Water and Irrigation
Jordan suffers from water scarcity, which poses a threat that would affect all sectors that depend on the availability of water for the sustainability of their activities for their development and prosperity. Water is an essential element for the uses of households, industry and agriculture, the growing water deficit from one year to another and increasing challenges in light of the increasing population and because of Syrian asylum to Jordan poses a serious threat which will leave its impact on all sectors.
The availability of information is one of the most important determinants of dealing with the threat and the development of strategies, policies and plans. The information availability contributes to making the right decisions and helps and all concerned sectors to understand and accept the decisions that will have an impact on the sectors development and growth. Consequently, the Ministry of Water and Irrigation decided to issue this bulletin and provide information to stakeholders in the water sector such as individuals public sector and private sectors in addition to the community of funding agencies and donors of the water sector. We hope that the published information will be of help to every stakeholder and any party that has an interest in the water sector, provided that we continue to make it available in the future and on an annual basis by all means available.
1

Jordan Water Sector Facts and Figures 2013
Opening Statement
H.E Eng. Basem TelfahSecretary General - Ministry of Water and Irrigation
The Ministry of Water and Irrigation has the mandate to develop strategies, policies and plans for the water sector, and is operating through the Water Authority of Jordan and the Jordan Valley Authority. The ministry, therefore has the role of collecting the information about the water sector through these institutions and use the in the optimal manor in the management of water resources and directing them to demand centers, according to the priorities to ensure provision of water to users from various sectors, domestic, industrial and agricultural.
Within the desire of the water sector and implementing principle of transparency in putting up the facts and figures in the reach of the water sector stakeholders and those wanting to inquire about the water situation in Jordan, the ministry and for the first time is publishing this information bulletin that aggregates and describes the water sector in this publication. The information here with is the result and outcome of the efforts of the Ministry of Water and irrigation staff who are working hard to serve the nation and its citizens. The ministry intends to publish this information and update it annually. This publication is the first attempt to facilitate access to information for all, and will be the first seed to follow up on these efforts and published on an annual basis on all means of communication. Hence, we welcome any positive criticism to improve this bulletin in the future.
2 3

Jordan Water Sector Facts and Figures 2013
Annual Volume of Precipitation (Million M3)
Water Resources 2013
Surface Water Budget 2013 (Million M3)
2013(MCM) percentage from Rainfall
long term Percentage from long term
Rainfall 8120 8194 99
Evaporation 7689 94.7 7582 101
Runoff 187 2.3 194 96
Recharge 244 3.0 418 58
•MCM: Million Cubic Meter
Water Resources Annual Volume of Precipitation (Million M3)(1990/1991-2012/2013) Water Years
Year Rainfall volume(MCM) Year Rainfall volume(MCM)
1990/1991 8379 2002/2003 97081991/1992 10429 2003/2004 69511992/1993 589 2004/2005 93041993/1994 8440 2005/2006 62581994/1995 8524 2006/2007 76831995/1996 6046 2007/2008 51941996/1997 8746 2008/2009 63791997/1998 9110 2009/2010 87281998/1999 2973 2010/2011 64771999/2000 3651 2011/2012 59432000/2001 7375 2012/2013 81202001/2002 7545 long term* 8194
Surface Water Budget 2013 (Million M3)
Surface water Comparison between water year 2012/2013 and long termaverage
4 5
Jordan Water Sector Facts and Figures 2013
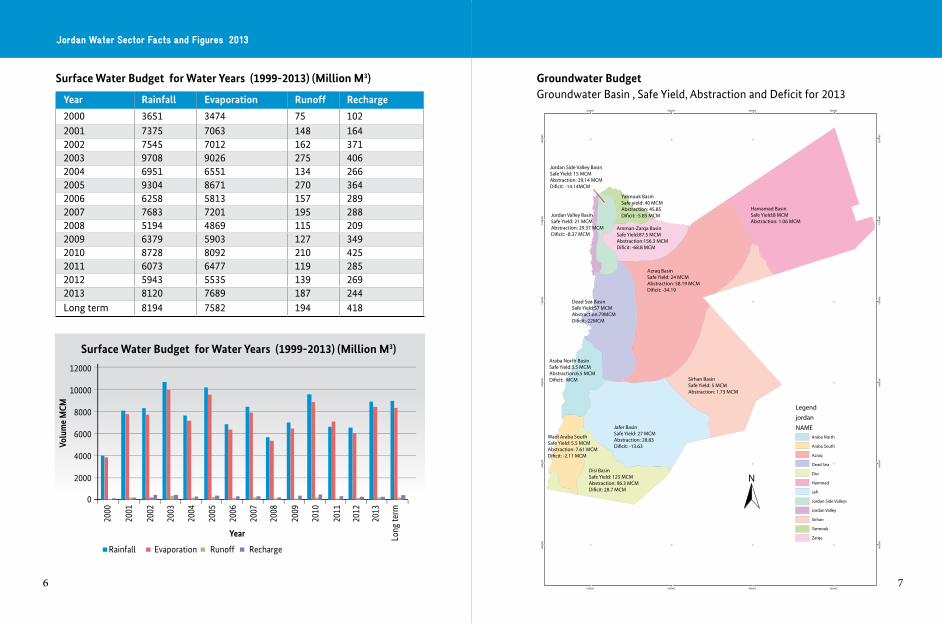
Surface Water Budget for Water Years (1999-2013) (Million M3)
Year Rainfall Evaporation Runoff Recharge
2000 3651 3474 75 1022001 7375 7063 148 1642002 7545 7012 162 3712003 9708 9026 275 4062004 6951 6551 134 2662005 9304 8671 270 3642006 6258 5813 157 2892007 7683 7201 195 2882008 5194 4869 115 2092009 6379 5903 127 3492010 8728 8092 210 4252011 6073 6477 119 2852012 5943 5535 139 2692013 8120 7689 187 244Long term 8194 7582 194 418
Surface Water Budget for Water Years (1999-2013) (Million M3)
Groundwater BudgetGroundwater Basin , Safe Yield, Abstraction and Deficit for 2013
6 7

Jordan Water Sector Facts and Figures 2013
Example:
Amman/Zarqa Basin Annual Total Groundwater Abstraction and the Safe Yield (Million M3)
Amman-Zarqa Basin 2005 2006 2007 2008 2009 2010 2011 2012 2013
Irrigation 61 58 63 59 65 64 65 67 64Drinking Water 81 75 80 83 79 87 88 89 85Industrial 7 6 7 7 7 8 8 7 7Total 149 139 150 149 151 159 161 163 156Safe Yield 88 88 88 88 88 88 88 88 88Deficit -61 -52 -62 -61 -63 -71 -73 -75 -69
Amman/Zarqa Basin Annual Total Groundwater Abstraction and the Safe Yield (Million M3)
Distribution of the Operating Wells According to Water Use
Year Industrial Wells Agriculture Wells Drinking Wells Livestock Total2000 145 1830 424 41 24402001 147 1855 480 36 25182002 148 1878 501 30 25572003 159 1946 515 27 26472004 171 1981 531 39 27222005 173 2058 509 39 27792006 166 2125 511 37 28392007 174 2169 543 31 29172008 180 2223 581 37 30212009 188 2238 573 31 30302010 201 2284 591 22 30982011 192 2311 599 19 31212012 181 2254 588 20 30432013 206 2210 602 16 3034
Distribution of the Operating Wells According to Water Use
8 9

Jordan Water Sector Facts and Figures 2013
Projected Demand and Deficit 2013-2030 (MCM)
Number of Pumping Stations and Storage Reservoirs DistributionAccording to Governorates (2013)
Governorate Pumping Station Reservoir no. Reservoir Capacity M3Irbid 73 52 127855Zarqa 44 22 60100Ajloun 12 22 15695Jerash 12 14 9750Tafielah 18 7 13900Ma'an 32 18 27280Mafraq 58 44 15545Balqa 73 33 57153Madaba 10 5 19500Karak 16 17 29650Amman 51 83 700000Aqaba 4 24 46410
Water Uses in 2013 (Million M3)
Uses Surface Water Groundwater Total Volume (MCM)Domestic 123 257 381Irrigation 225 250 475Industry 7 32 39Others 7 0 7Total 362 540 902
Water Uses 2013 (MCM)
10 11

Jordan Water Sector Facts and Figures 2013
Water Uses (2000-2013) (Million M3)
Year MUNICIPAL INDUSTRIAL IRRIGATION TOTAL USES2000 239 37 541 8172001 246 33 487 7662002 249 37 517 8032003 262 36 506 8042004 281 38 541 8602005 291 38 603 9322006 291 38 588 9172007 294 49 589 9322008 315 39 574 9282009 326 37 500 8632010 352 40 501 8932011 347 37 515 8992012 354 33 462 8492013 381 39 481 902
Water Uses (2000-2013) (Million M3)
Water supply per Capita (2000-2013)
Year water supply (l/c/d)
2000 1292001 1282002 1262003 1302004 1342005 1292006 1392007 1442008 1452009 1462010 1472011 1452012 1452013 154
Water supply per Capita (2000-2013)
12 13
Jordan Water Sector Facts and Figures 2013
Drinking Water Supply and Non Revenue Water (2000-2013) (Million M3)
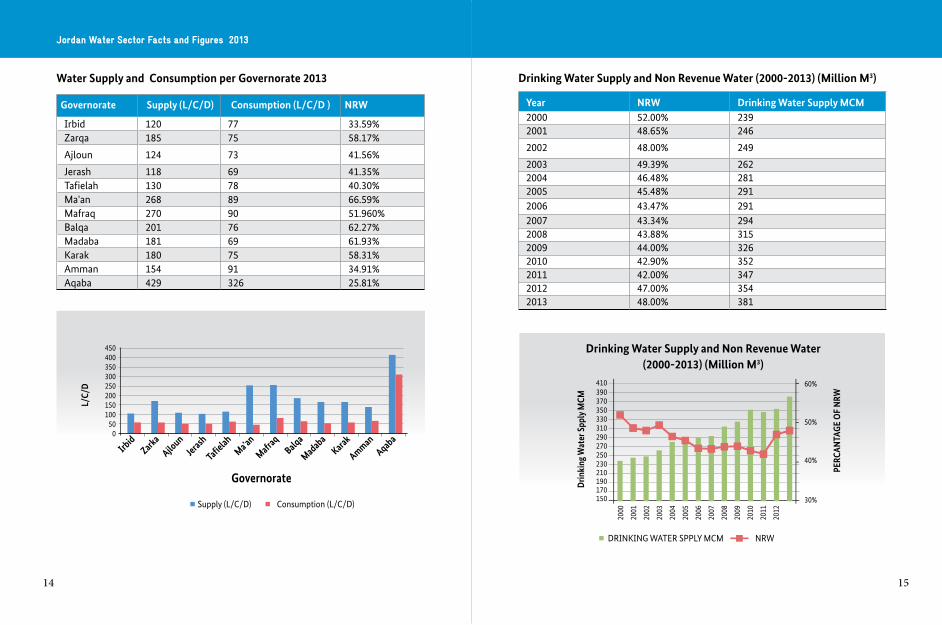
Water Supply and Consumption per Governorate 2013
Governorate Supply (L/C/D) Consumption (L/C/D ) NRW
Irbid 120 77 33.59%Zarqa 185 75 58.17%
Ajloun 124 73 41.56%
Jerash 118 69 41.35%Tafielah 130 78 40.30%Ma'an 268 89 66.59%Mafraq 270 90 51.960%Balqa 201 76 62.27%Madaba 181 69 61.93%Karak 180 75 58.31%Amman 154 91 34.91%Aqaba 429 326 25.81%
Drinking Water Supply and Non Revenue Water (2000-2013) (Million M3)
Year NRW Drinking Water Supply MCM2000 52.00% 2392001 48.65% 246
2002 48.00% 249
2003 49.39% 2622004 46.48% 2812005 45.48% 2912006 43.47% 2912007 43.34% 2942008 43.88% 3152009 44.00% 3262010 42.90% 3522011 42.00% 3472012 47.00% 3542013 48.00% 381
14 15

Jordan Water Sector Facts and Figures 2013
Water Subscribers and Wastewater Subscribers (2000-2013)
Water Subscribers and Wastewater Subscribers (2000-2013)
Year Number of Water Subscribers Number of Wastewater Subscribers2000 695906 3893472001 722775 4151722002 752983 4327422003 776257 4637002004 826217 4893162005 837626 5275782006 842805 5435962007 925708 5659482008 959118 5965032009 1001217 6138262010 1048207 6465192011 1095191 6779612012 1142457 7166712013 1190831 742763
Drinking Water Supply MCM With NRW Percentage
Non-Revenue Water for Different Governorate
Number of Illegal wells closedYear Number of wells
before 2007 235
2007 26
2008 45
2009 46
2010 57
2011 29
2012 19
2013 141
16 17

Jordan Water Sector Facts and Figures 2013
Ratio of operating costs coverage and ratio of total cost coverage (2000-2013)
Year Ratio of operating costs coverage Ratio of total cost coverage
2000 114% 67%2001 122% 68%2002 125% 66%2003 131% 64%2004 132% 69%2005 133% 75%2006 133% 72%2007 128% 62%2008 110% 69%2009 115% 72%2010 112% 70%2011 118% 69%2012 101% 60%2013 102% 56%
Wastewater Treatment Plants 2013
WWTP NAME TECHNOLOGY Service Governorate
Design Capacity
Aqaba - Natural Waste Stab Ponds Aqaba 9000Aqaba - Mechanical Extended Areration Aqaba 12000Baqa Trickling Filter (TF) Amman, Balqa 14900Fuheis Activated Sludge Amman, Balqa 2400Irbid - Central TF & Activ Sludge Irbid 11023Jerash-East Oxidation Ditch Jerash 9000Karak Trickling Filter (TF) Karak 5500Kufranja Trickling Filter (TF) Ajloun 9000Madaba Activated Sludge Madaba 7600Mafraq Waste Stab Ponds Mafraq 6050Ma'an Extended Areration Ma'an 5772Abu Nuseir Active Sludge R,B,C Amman 4000Ramtha Activated Sludge Irbid 7400Sult Extended Areration Balqa 7700Tafila Trickling Filter (TF) Tafila 7500Wai Al Arab Extended Areration Irbid 21000Wadi Hassan Oxidation Ditch Irbid 1600Wadi Mousa Extended Areration Ma'an 3400Wadisseer Aeration Lagoon Amman 4000Alekeder-Tankers Waste Stab Ponds Mafraq 4000Lajjon-Tankers Waste Stab Ponds Karak 1200Tal AlMantah-Tank-ers TF & Activ Sludge Balqa 400
Al Jiza Activated Sludge Amman 4500Samra Activated Sludge Amman, Zarqa 364000Al Merad Activated Sludge Jerash 9000Shobak - Tankers Waste Stab Ponds Ma'an 350Mansorah - Tankers Waste Stab Ponds Ma'an 50South Amman Amman 52000Mu'tah and Adnaniyyah Karak 7060
Shallaleh Irbid 13700Shouna Shamaliyyah Irbid 1200
Ratio of Operating Cost Coverage:
18 19

Jordan Water Sector Facts and Figures 2013
Volume of Municipal Treated Wastewater (2000-2013) (Million M3)
Year Treated Wastewater( MCM)
2000 772001 792002 812003 842004 952005 992006 862007 982008 1022009 1102010 1102011 1102012 1132013 121
Volume of Municipal Treated Wastewater (2000-2013) (Million M3)
Jordan Valley Dams in Jordan (Storage Capacity)
Dam Capacity (MCM)Wehdeh 110
Wadi Arab 16.8
Zeqlab 3.9
King Talal 75
Karameh 55
Wadi Shueib 1.43
Kafrain 8.5
Wala 7.1
Mujeb 29.8
Tanour 16.8
Alwhady 1.7
Shaitham 0.3
Jordan Valley Dams/ Excavation in Jordan (Storage Capacity)
Dam/ Excavation Number Storage Capacity (MCM)
Dam under implementation 1 6.00
Dams Tendered 2 0.14
Excavation tendered 9 0.70
Excavation under implementation 15 1.45
implemented Desert Dams 24 83.06
implemented Desert Dams in coopera-tion with Ministry of Agriculture 29 2.82
implemented Excavation 65 0.30
implemented Excavation in cooperation with Ministry of Environment 139 16.73
Implemented Dams in cooperation with Pepsi Company 1 0.23
Total 285 111.43
Water Efficiency in the Irrigation Distribution Netwroks
Efficiency Percentage %
Distribution efficiency 2012 93
Distribution efficiency 2013 87
Selling efficiency 2012 91
Selling efficiency 2013 89
20 21

Jordan Water Sector Facts and Figures 2013
Water Quality
Number of tests and samples conducted for drinking water
Year Samples Tests
2003 10243 594072004 9549 535272005 8520 494542006 7855 448012007 7967 455282008 7512 428992009 9103 599232010 9150 601222011 8456 541222012 7732 509152013 6709 42218
Samples of Drinking Water conforming to Jordan Quality Standards
year Percentage of the conforming
2007 98.62008 992009 99.32010 99.42011 99.32012 99.62013 99.7
Number of tests and samples conducted for wastewater
Year Samples Tests
2003 7396 205622004 3262 14483
2005 2392 9580
2006 2628 103482007 2952 131012008 3494 173592009 3404 213122010 3988 193922011 3444 191242012 3586 187382013 2339 10749
Samples of Drinking Water conforming to Jordan Quality Standards
Wastewater- Number of Samples and Tests
Samples Tests
22 23

Jordan Water Sector Facts and Figures 2013
Water Resources Monitoring Stations
Monitoring Station Normal Telemetric Total
Rainfall Station 221 37 258
Evaporation Station 21 18 39
Runoff Station 47 3 50
Groundwater level 153 71 224
Spring Discharge 600 0 600
Water Resources Monitoring Stations
Electricity consumption in water production and supply
Year Electricity consumption(Giga Watt/hour) Drinking Water Supply MCM
1990 545 178.61991 548 187.61992 688 208.21993 730 218.51994 768 219.91995 916 246.11996 921 242.31997 936 240.01998 945 241.01999 972 237.42000 990 239.02001 982 246.02002 1044 249.02003 1104 262.02004 1261 281.02005 1298 291.02006 1396 291.02007 1592 294.02008 1713 315.02009 1761 326.02010 1867 352.02011 1939 347.02012 1955 354.02013 2076 381.0
24 25

Jordan Water Sector Facts and Figures 2013
Electricity consumption in water production and supply
Electricity consumption (Giga Watt/hour)
Energy consumption Million JD Refugees
Energy Consumption Cost (Water Sector) JD
Year Energy consumption Million JD Year Energy consumption
Million JD1986 3.249 2000 15.6501987 7.226 2001 16.1151988 8.319 2002 19.6491989 9.898 2003 35.2201990 10.909 2004 39.2521991 10.984 2005 40.6691992 14.514 2006 42.5701993 17.496 2007 42.1431994 19.799 2008 50.6431995 22.841 2009 51.2091996 25.332 2010 53.0131997 26.803 2011 62.2931998 27.201 2012 79.4341999 22.673 2013 108.558
26 27

Jordan Water Sector Facts and Figures 2013
Cost of Hosting Syrian Refugees
Financial Costs (JD)Cost per refugee
Yearly Cost for refugees in Host Communities 2014
Yearly Cost for estimated refugees 2015
Capital cost (Water and Wastewater) 174.55 96,438,875 100,889,900
O & M (Water and Wastewater) 59.13 32,669,325 34,177,140
TOTAL 233.68 129,108,200 135,067,040
Economic costs 2014Cost Per refugee
Yearly Cost for refu-gees in H.C. 2014
Yearly Cost for estimated refugees 2015
Over-pumping 59.13 32,669,325 34,177,140
Crisis management 29.21 16,138,525 16,883,380
Opportunity 175.2 96,798,000 101,265,600
TOTAL 263.54 145,605,850 152,326,120
Cost of Syrian Refugees Living in Host Communities
Yearly Cost for refugees in H.C. 2014
Yearly Cost for estimated refugees 2015
Per refugee
Financial cost (JD) 129,108,200 135,067,040 233.68
Economic cost (JD) 145,605,850 152,326,120 263.54
TOTAL 274,714,050 287,393,160 497.22
• Estimated Numbers of Syrian Refugees 650000 a for 2014 (15% in camps, %85 in Host Communities; and 680.000 for 2015 according to MoPIC
Facts
• Jordan is composed of 15 Surface water Basins and 12 Ground water Basins
• The number of working wells in Jordan exceeds 3000 wells.
• Quantity of renewable water resources available for different purposes is around 750 MCM.
• The safe yield quantity available from renewable groundwater is 275 MCM.
• The safe yield abstraction quantity from non-renewable groundwater for (50) years is about 143 MCM.
• Quantity of over pumping from renewable groundwater is about 160 MCM.
• The drawdown from static water level between 1-2 m yearly.
• The quantity of water supplies for different purposes is about 900 MCM.
• The quantity of Water demand about 1200 MCM for all sectors.
• Per capita water supply for all uses is less than 15% in comparison to the international standards.
• Capacity of main Dams is about 330 MCM.
• Capacity of small dams and excavation about 100 MCM.
• Amount of treated Wastewater around 120 MCM.
• About 40% from water resources is trans-boundary water.
• The conformity of drinking water supply to the Jordanian standard about 98.5%.
• The water sector consumes about 14% from electricity produced in Jordan.
• The ratio of the Non Revenue Water stands at 43%.
• Each Syrian refugee cost the water sector around 500 JD/year.
28 29

30


![[MOH Jordan] Jordan Public Health Surveillance](https://static.fdocuments.in/doc/165x107/586a119d1a28ab677d8bb3dc/moh-jordan-jordan-public-health-surveillance.jpg)


