Jordan O’Byrne - Concordia UniversityByrne_MSc_S2017.pdf · Jordan O’Byrne Cross-frequency...
84
Cross-frequency coupling and sleep-dependent declarative memory consolidation: sleep states as opponent processes Jordan O’Byrne A Thesis in The Department of Exercise Science Presented in Partial Fulfillment of Requirements for the Degree of Master of Science (Neuroscience) at Concordia University Montreal, Quebec, Canada December 2016 © Jordan O’Byrne, 2016
Transcript of Jordan O’Byrne - Concordia UniversityByrne_MSc_S2017.pdf · Jordan O’Byrne Cross-frequency...

Cross-frequency coupling and sleep-dependent declarative memory consolidation: sleep states
as opponent processes
Jordan O’Byrne
A Thesis
in
The Department
of
Exercise Science
Presented in Partial Fulfillment of Requirements
for the Degree of Master of Science (Neuroscience) at
Concordia University
Montreal, Quebec, Canada
December 2016
© Jordan O’Byrne, 2016


iii
ABSTRACT
Cross-frequency coupling and sleep-dependent declarative memory consolidation: sleep states
as opponent processes
Jordan O’Byrne
Cross-frequency coupling (CFC) binds neuronal oscillations in sleep and wake, but the
mnemonic function of these interactions remains unclear. We recorded scalp
electroencephalography from 10 human participants while they slept following a declarative
word pair learning task or a non-learning control task. In non rapid-eye-movement sleep
(NREMS), delta-sigma phase-amplitude coupling (PAC) was marginally increased in central
regions after learning, and its learning-related change in frontal regions was strongly predictive
of recall performance the next morning. We observed opposite effects for CFC in rapid-eye-
movement sleep (REMS). Delta- and theta-gamma PAC were still significantly increased after
learning at fronto-central locations, but the frontal increase was negatively correlated with
subsequent recall performance. Importantly, characteristics of the coupled oscillations
(delta/slow waves and sigma/spindles in NREMS, and delta, theta and gamma in REMS)
showed no learning-related effect. Only their synchronization was mnemonically significant. We
propose that NREMS and REMS are opponent processes in their effect on declarative memory
consolidation. Whereas NREMS integrates new memories to the knowledge network and
stabilizes learned associations through temporally ordered thalamo-cortico-hippocampal
reactivations, REMS brings out weak links and encodes them through hippocampo-cortical
delta- and theta-gamma PAC, thus weakening the accuracy of waking memories. This interplay
is analogous to the trade-off between exploration and exploitation in decision-making research
and artificial intelligence.
Keywords: cross-frequency coupling, phase-amplitude coupling, sleep, memory consolidation

iv
Acknowledgements
This work was completed with scholarship support from the Canadian Institutes of Health
Research (CIHR), from the Fonds de Recherche du Québec – Santé (FRQ-S) and financial
support from Dr. Dang-Vu. The research project was funded by the Natural Sciences and
Engineering Research Council (NSERC). I would like to gratefully acknowledge the contributions
of these individuals in data collection: Soufiane Boucetta, Ali Salimi, Benjamin Hatch, Dylan
Smith, Corina Moraru, Elisabeth Houle, Shira Azoulay, Cynthia Malu, Alex Nguyen, Victoria
Zhang, Oupamdeep Malhi, Lindsay Reed, Audrée Arcelin, Vivane Guignard, Sylviane Guignard,
Arshi Kaffash, Nabeel Ali, Victoria You, Antony Rossi, Julia Alessi, Vanessa Del Vecchio,
Jocelyn Jia, Elise Arsenault, Melissa Berman Rosa, Vanessa Discepola, Kirsten Packwood,
Melissa Veenstra, Lena Dakin, Stephanie McKenzie, Marilia Bedendi, Neressa Noel, Molly
Brisebois and Kerstin Wenzel. Thanks to Giovanni Piantoni and Adriano Tort for sharing their
code. Thanks to Zarish Abbas for helpful discussions. Special thanks to Oren Weiner, Claire
André, Eden Debellemanière and Julia Giraud for their help in recruitment, data collection,
scoring, and for their support. Thanks to my committee, Dr Courtemanche, Dr Williams and Dr
Baillet, and to my supervisor, Dr Dang-Vu, for their input and support.

v
Contribution of Authors
JOB devised the study design in consultation with Dr. Dang-Vu. JOB completed the
majority of the recruitment, data collection and half of the sleep staging, with help from the Dang-
Vu laboratory. JOB completed all analyses, reporting and writing.

vi
Table of Contents
Introduction......................................................................................................................... 1
Methods.............................................................................................................................. 3
Participants............................................................................................................. 3
Polysomnography................................................................................................... 4
Tasks...................................................................................................................... 5
Data analysis.......................................................................................................... 6
Discrete slow wave detection.................................................................................. 7
Discrete spindle detection....................................................................................... 7
Discrete detection-based cross-frequency coupling............................................... 8
Phase-amplitude coupling....................................................................................... 8
Phase analysis........................................................................................................ 10
Comodulogram........................................................................................................ 10
Statistics.................................................................................................................. 11
Results................................................................................................................................ 13
Participant sample……………………………………………………………………….. 13
Learning task.......................................................................................................... 13
Power spectra......................................................................................................... 14
Discrete oscillatory events...................................................................................... 14
Phase-amplitude coupling with a priori bands......................................................... 16
Phase analysis........................................................................................................ 17
Comodulogram........................................................................................................ 18
Discussion........................................................................................................................... 19
NREMS CFC and learning....................................................................................... 20
REMS CFC and learning......................................................................................... 22
Differences in CFC by stage.................................................................................... 23
Significance of sleep CFC for learning.................................................................... 23
Limitations............................................................................................................... 28
Next steps............................................................................................................... 30
Concluding remarks................................................................................................ 30
References......................................................................................................................... 32
Tables................................................................................................................................ 43
Figures............................................................................................................................... 58

1
Introduction
In the mammalian brain, electrical activity is segregated in space and time. The mechanisms of
spatial segregation are well described, mainly in the form of synaptic connections and modular
brain organization. Only recently has temporal segregation in the brain received comparable
attention, in the study of neuronal oscillations (Varela et al., 2001; Buzsáki, 2006). The brain
resounds with these electric field fluctuations, at frequencies spanning five orders of magnitude
(Buzsáki and Draguhn, 2004). Far from independent, they are embedded in one another
(Soltesz and Deschênes, 1993; Jensen and Colgin, 2007; Canolty and Knight, 2010; Engel et
al., 2013), like nested for-loops in a computer program. Whether this rhythmic multiplexing is
functional, or merely incidental, is the subject of intense research.
Sleep, perhaps better than any behaviour, displays the complex hierarchy of neuronal
oscillations (Steriade et al., 1993; Steriade, 2006). In non-rapid-eye-movement (NREMS), the
depolarizing up-state of slow waves (0.25-4 Hz; SW) from the neocortex encloses
thalamocortical sleep spindles (10-16 Hz) (Contreras and Steriade, 1995), which themselves
nest hippocampal sharp-wave ripples (SPW-R) within their troughs (Siapas and Wilson, 1998;
Sirota et al., 2003). SPW-Rs in turn group the pairwise synchronous firing of single neurons in
the hippocampal CA1 region (Wilson and McNaughton, 1994), joining the overarching multi-
second to the elementary millisecond scale. Likewise, neocortical gamma (> 30 Hz) power in
NREMS is biased by the phase of concurrent spindle (Peyrache et al., 2011; Ayoub et al., 2012;
Takeuchi et al., 2016), slow (Hasenstaub et al., 2005; Isomura et al., 2006) and infraslow (> 10
s) (Leopold et al., 2003) oscillations. Early work describing SW-spindle cross-frequency coupling
(CFC) in animal NREMS has now been replicated in human scalp (Mölle et al., 2002; Piantoni et
al., 2013; Klinzing et al., 2016), subdural (Clemens et al., 2007) and intracranial (Staresina et al,
2015) electroencephalography (EEG). In rapid-eye-movement sleep (REMS), animal studies
have shown that the phase of the hippocampal theta (4-8 Hz) rhythm, a reliable high-power
rhythm also observed in waking locomotion, modulates the amplitude of neocortical gamma
(Montgomery et al., 2008; Scheffer-Teixeira et al., 2011; Scheffzük et al., 2011). This type of
CFC is known as phase-amplitude coupling (PAC). Similar coupling was observed in human
REMS (Clemens et al., 2009; Amiri et al., 2016), albeit at a delta (1-4 Hz) rather than a theta
phase frequency. Still, these coupling dynamics may be homologous (Bódizs et al., 2001;
Jacobs, 2014), considering that the ratio of oscillatory frequency to brain size seems
evolutionarily preserved (Buzsáki and Mizuseki, 2013).

2
The precise and well-preserved complexity of temporal organization in the brain,
particularly during sleep, suggests a functional importance. Much recent work has made the
case for an active role of sleep-dependent oscillations in memory consolidation (reviewed in
Rasch and Born, 2013). In a landmark series of experiments, transcranial induction of ersatz
SWs in the human prefrontal cortex during early sleep resulted in an improvement in next-day
word pair recall, as well as an increase in endogenous SWs and spindles (Marshall et al., 2006),
while 5-Hz rhythm induction reduced SWs, spindles and subsequent word pair recall (Marshall et
al., 2011). In a later study by the same group, word pair recall enhancement was achieved
instead by boosting SW amplitude with in-phase auditory stimulation (Ngo et al., 2013). As for
spindles, a number of correlative behavioural studies in humans (Gais et al., 2002; Schabus et
al., 2004; Cox et al., 2012) are complemented by a human pharmacological experiment
(Mednick et al., 2013) in support of their role in declarative memory consolidation. The role of
hippocampal SPW-Rs in memory consolidation (Buzsáki, 1989) has received support from
correlative behavioural studies (Axmacher et al., 2008; Eschenko et al., 2008) and a loss-of-
function experiment in rats (Girardeau et al., 2009). The contribution of REMS-specific rhythms
to memory consolidation is debated (Siegel, 2001; Vertes, 2004; Walker and Stickgold, 2004). A
recent optogenetic experiment in rats supports an active involvement of hippocampal theta,
showing that its selective abolishment during REMS led to a decrement in contextual memory
post-sleep (Boyce et al., 2016).
Sleep-dependent oscillations, then, appear to be more than an epiphenomenon (Nunez,
1981). But what of their interactions? It remains unclear whether temporal organization remains
functional at higher, rhythm-multiplexing scales. There is a wealth of research linking waking
CFC, especially theta-gamma PAC, to learning and memory in rats (Shirvalkar et al., 2009; Tort
et al., 2009) and humans (Jensen, 2006; Osipova et al., 2006; Sauseng et al., 2009; Axmacher
et al., 2010; Kaplan et al., 2014; Lega et al., 2014; Sweeney-Reed et al., 2014), but despite the
recent proliferation of mnemonic models involving CFC in sleep (Diekelmann and Born, 2010;
Lewis and Durrant, 2011; Rasch and Born, 2013; Staresina et al., 2015), little experimental
attention has been devoted to the specific association between sleep CFC and memory
consolidation. A study in humans demonstrated that spindle density during SW-rich deep sleep
better predicted overnight declarative memory retention than during SW-sparse light sleep,
indicating that these oscillations may functionally interact (Cox et al., 2012); however, precise
CFC was not examined. To date, three studies have specifically linked sleep CFC with memory
consolidation, all of them in NREMS. Two studies by Mölle and colleagues (2009; 2011) found
that learning enhanced the clustering of spindles during SW up-states, while Niknazar et al.

3
(2015) observed that coordination of spindle peaks during the SW up-state transition predicted
better declarative memory performance after an early morning nap. To our knowledge, REMS
CFC has not been examined in relation to memory consolidation. A comprehensive investigation
is warranted, examining the interactive effects from declarative learning to NREMS and REMS
CFC, to next-day recall.
In this study, we recorded the scalp EEG of 10 human participants as they slept following
either a declarative word pair learning task or a non-learning control task. We first asked whether
the type of task altered CFC measures during sleep, and next, whether these measures
predicted recall performance the next morning. We found differential effects of the learning task
on CFC among stages and frequency bands, detected at the frontal and central midline. In
REMS, beta/gamma modulation by the theta rhythm was markedly enhanced after the learning
task, as was delta-gamma PAC, albeit to a lesser extent. Conversely, NREMS theta-gamma
PAC was reduced with learning. Delta-sigma PAC in early NREMS was at once marginally
increased by learning and strongly predictive of better recall in the morning test, whereas in
REMS, theta-gamma and delta-gamma PAC increases were associated with poor morning
recall. Together, these findings indicate that declarative learning triggers multiplexing processes
in the sleeping brain which seem conducive to recall in NREMS, and detrimental to it in REMS.
Methods
Participants slept three nights in the laboratory: one first night of polysomnographic (PSG) sleep
screening and environmental adaptation, and two PSG/EEG experimental nights. Each night
was scheduled one week apart. Experimental nights involved a learning task or a non-learning
control task, and their order was counterbalanced between participants. Both tasks consisted of
a pre-sleep and a post-sleep component, scheduled such as to provide a 30-minute buffer with
participants’ usual bedtime and wake time (Fig. 1).
Participants
Ten young, healthy volunteers (5 females, 5 males, mean age ± SD: 23.7 ± 3.2 years) took part
in the study. Volunteers were recruited through an advertisement in the “students and part-time
work” section of an online classified service. Respondents to the advertisement were first taken
through a short telephone screening, followed by online questionnaires and an in-person semi-
structured interview. The telephone and in-person screening ruled out the following exclusion
criteria: acute and chronic medical conditions, including sleep (e.g. insomnia, sleep apnea) and

4
psychiatric disorders (e.g. depression); current use of psychotropic medication (other than
contraceptives) or recreational drugs; excessive alcohol or tobacco use; recent (<2 months)
travel further than one time zone; current or recent (<1 year) night shift work; and pregnancy. In
addition, respondents had to meet these inclusion criteria: age between 18 and 30, inclusively;
native French literacy; and right-handedness. French literacy was required for the French-
language paired associates task. Right-handedness was required to homogenize the
lateralization of brain activity. The online screening questionnaires included the Centre for
Epidemiological Studies – Depression screening (CES-D) for depression screening (cutoff at
CES-D > 15) and the morningness-eveningness questionnaire (MEQ) to rule out excessively
early (MEQ > 70) or late (MEQ < 30) sleep schedules. Admitted participants completed a
battery of additional sleep and psychological questionnaires to confirm their eligibility. Sleep
disturbances were measured using the Pittsburgh sleep quality index (PSQI) the Epworth
sleepiness scale (ESS) and the insomnia severity index (ISI). Psychological questionnaires
consisted of Beck’s depression inventory (BDI) and the Beck Anxiety Inventory (BAI). The
Edinburgh Handedness Inventory (EHI) was also administered to confirm right-handedness (see
Table 1). P The participants were fitted with actigraphy watches (Respironics Actiwatch 2) for the
entire 2-week period of the study, to monitor their sleep and ensure they were not sleep
deprived on experimental nights. Participants who did not maintain regular sleep schedules
during the study period were excluded. Prior to participation in the study, volunteers signed an
informed consent form, which was approved by the Concordia University Human Research
Ethics Committee and the Comité d’éthique de la recherche de l’IUGM.
Polysomnography
Eligible participants underwent a first overnight evaluation of their sleep at the IUGM sleep
laboratory. The full PSG array consisted of 12-channel EEG placed according to the 10-20
system and referenced to Pz, as well as electrooculography (EOG), submental
electromyography (EMG), electrocardiography (ECG), leg EMG, nasal-oral thermocouple
airflow, nasal pressure airflow, thoracic and abdominal pressure belts, transcutaneous finger
pulse oximetry and a pharyngeal microphone. PSG was recorded with the Somnoscreen plus
PSG system and digitally stored using the Domino analysis software (Somnomedics,
Randersacker, Germany). The first PSG night provided a final screening for sleep disorders
(insomnia, sleep apnea, narcolepsy, hypersomnia, restless legs syndrome). A trained sleep
technician scored the recordings for sleep and breathing anomalies (sleep apnea syndrome
defined by an apnea-hypopnea index > 5/h), and eligible participants were definitively admitted

5
to the study. Admitted participants then underwent two more PSG nights, the learning night and
control night, scheduled 7 days apart. For these recordings, breathing measures were
substituted for a full EEG montage, with 18 EEG channels (Fz, F3, F4, F7, F8, Cz, C3, C4, T3,
T4, P3, P4, T5, T6, O1, O2, M1, M2, Pz reference, Fpz ground), electrooculography,
electrocardiography and chin electromyography. Participants were asked to keep regular sleep-
wake schedules prior to the study (verified by actigraphy) and to refrain from consuming
caffeinated beverages after noon on recording days, and were required to have had a meal
before arriving at the laboratory. They went to bed at their habitual bedtime (no later than 12:30
AM) and slept until they awoke spontaneously (no later than 9 AM). In the morning, participants
were offered a light, caffeine-free breakfast 10 minutes after awakening.
Tasks
Two hours prior to their bedtime each night, participants performed one of two cognitive tasks, in
an order counterbalanced between participants (Fig. 1). The learning task was a variant of the
paired associates task (Plihal and Born, 1997), performed on a laptop computer in a private
room (Fig. 1). All instructions were provided onscreen, in French. Participants were asked to
memorize 120 word-pair associations, presented twice onscreen in a scrambled order. The first
presentation of each word pair was 5 s long, with a 5-s rest and 3-s readiness cross, and the
second presentation was 3 s long, with a 3-s rest and 3-s readiness cross, for a total learning
time of 45 min. In order to homogenize memorization strategies, participants were instructed to
use the rest period to form a mental image incorporating both words. For instance, if the words
were tasse (cup) and sable (sand), one could imagine a cup filled with sand. It was also
specified in the instructions that participants would be tested on recall of the second word
(target) upon presentation of the first (cue). Words were randomly selected from an open online
French word frequency table (New et al., 2001). Only singular-form nouns five to nine letters
long with frequency greater than five per million were chosen. Nouns were further selected for
concreteness and low emotional salience. Nouns were paired randomly, and resultant pairs that
were semantically related were further scrambled, so that all word pairs were semantically
unrelated. After both presentation phases, participants performed cued recall. In this phase, a
research assistant was present in the room and participants were presented with the cues
onscreen, in a scrambled order. They were asked to verbally recall the associated target.
Unlimited time was allowed for recall of each word, and participants proceeded to the next cue
by pressing a button. The research assistant scored the answers but provided no feedback to
the participant. Each of the pre-sleep phases was punctuated by 2-min breaks. In the morning,

6
~30 min after awakening, participants repeated the test phase with the cues in a scrambled
order. The non-learning task was based on Gais et al. (2002) and was designed to resemble the
learning task in its duration, structure, visual appearance and difficulty, but without the
declarative learning component (Fig. 1). Participants were presented with pairs of nonsense
strings of letters (e.g. BSAVAEC), and were asked to count and verbally state the number of
letters containing curved lines (e.g. B, C and S, but not A, E and V). The presentation, rest and
readiness cross durations were identical to the learning task, with one long phase and two short
phases (the second short phase replacing the test phase). In the morning, participants
completed a fourth phase ~30 min after awakening. Nonsense words were randomly generated
by scrambling the letters in the concatenated list of learning task words, and sectioning it into
240 five- to nine-letter strings. New lists were generated for each of the four phases, to avoid
implicit learning. To better mimic the learning task, a research assistant was present in the room
for the third and fourth phases, recording answers without feedback. EEG was recorded
throughout the tasks, and each pre/post component was bounded by 5-minute quiet
wakefulness measurements and an onscreen self-rating on the Karolinska sleepiness scale
(KSS).
Data analysis
All analyses were carried out in Python open source programming language and in SPSS
Statistics (IBM Corp.). Recordings were sampled at 512 Hz and band-pass filtered between 0.2
and 128 Hz, with a notch filter at 60 Hz. All channels were re-referenced to linked mastoids.
Sleep stages were visually scored per 30-s epoch as N1, N2, N3 or REMS, according to
standard criteria (Iber, 2007). Re-referenced traces were visually scanned for artefacts, and
affected 30-s epochs were excluded from further analyses. Sleep cycles were visually delimited
from the resulting hypnogram, each cycle containing successive N2, N3 and REMS stages.
Because frontocentral midline regions show maximal delta and sigma power in NREMS,
maximal delta and theta power in REMS (Tinguely et al., 2006), and high synchronization of
NREMS oscillations (Mölle et al., 2002; Staresina et al., 2015), we focused our analysis on
electrodes Fz and Cz. Power spectra were obtained using Welch’s method, with a 2-s Hanning
window. Raw power spectra were normalized by dividing by the spectrum integral. For filtering,
we used a 3rd order Butterworth filter applied once forward and once backward to correct the
filter’s phase shift effect, resulting in a zero-phase shift 6th order Butterworth filter. For sigma
band analyses and spindle detection, adapted bands were delimited per participant, per channel
and per experimental night by visual discernment of the largest peak between 10 and 16 Hz in

7
the power spectrum of all concatenated N2 epochs. The adapted sigma band for each channel
and participant was taken as the 4 Hz-wide band centred at the peak averaged between both
nights. Because oscillatory bands are trait-like (Finelli et al., 2001), the same adapted bands
were used for both nights, whereas all other measures described here were carried out
independently for each night, then compared. Delta, theta and gamma bands were less
discernible by eye, so a priori bands were used for these oscillations: delta in NREMS (0.25-4
Hz), delta in REMS (1.5-3.5 Hz), theta (3.5-8 Hz) and gamma (50-100 Hz). Delta in NREMS and
REMS are thought to be of different physiological origins, so different bands were adopted
based on the literature (Bódizs et al., 2001; Massimini et al., 2004). The upper 0.5 Hz in REMS
delta and the lower 0.5 Hz in theta were added for fuller spectral coverage.
Discrete slow wave detection
Discrete SW and spindle events were detected using automated algorithms. For automatic SW
detection, the re-referenced signal for stages N2 and N3 was first band-pass filtered between
0.1 Hz and 4 Hz, and SWs were detected according to the following criteria: (1) a negative zero-
crossing followed by a positive zero-crossing 0.3-1.0 s later, (2) a negative zero-crossing within
1.0 s of the positive zero-crossing detected in criterion 1, (3) a minimum voltage lesser or equal
to -80 μV and (4) a peak-to-peak amplitude greater or equal to 140 μV. These criteria were
based on Mölle et al. (2002; criteria 1 and 3) and Massimini et al. (2004; criteria 1, 3 and 4). The
algorithm was visually validated. The negative zero-crossings delimited the SW beginning and
end. SW power was taken as the root-mean-square (RMS) value over the entire SW.
Discrete spindle detection
Automatic spindle detection was based on Mölle et al. (2011). To detect spindles, the re-
referenced signal for stages N2 and N3 was band-pass filtered within the adapted band specific
to each participant and channel. Artefacts in the filtered signal were removed by replacing
amplitude values beyond 10 SD with the filtered signal mean. The RMS was then calculated at
each data point of the filtered signal using a 0.2-s sliding window, and the resulting RMS signal
was smoothed with a moving average of 0.2 s. Spindles were detected on the smoothed RMS
signal where RMS values exceeded 1.5 SD uninterrupted for 0.5-3 s. Longer and shorter rises in
power were rejected. The threshold crossing points delimited the spindle beginning and end.
Spindle power was taken as the average of the smoothed RMS over the duration of the spindle.
SW and spindle density were defined as the number of events per 30-s epoch of N2 and N3.

8
Duration, RMS and peak-to-peak amplitude were calculated for each individual oscillatory event
where applicable, and then averaged per participant.
Discrete detection-based cross-frequency coupling
To quantify the synchronization between SWs and spindles, we constructed two event
correlation histograms. For both, we divided all SWs into four quadrants: (1) from negative zero-
crossing to negative peak, (2) from negative peak to positive zero-crossing, (3) from positive
zero-crossing to positive peak and (4) from positive peak to negative zero-crossing. Next, for the
first event correlation histogram, the number of spindles beginning in each SW quadrant was
counted and expressed as a percentage of the total number of detected spindles for the whole
night. For the second histogram, the spindle voltage minimum was used instead of the spindle
beginning as a temporal marker of spindle occurrence. In a third analysis, average adapted
sigma power was calculated over the entire SW (irrespective of quadrants). These analyses
were carried out for all NREMS and for NREMS period 1 only (i.e. NREMS in sleep cycle 1). The
advantage of this event-based synchrony analysis over the spectral-based PAC analyses
described below is twofold: (i) it allows temporally precise segmentation of the SW, based on
detected peaks, troughs and zero-crossings, rather than fitting the EEG trace to a modulated
sine wave, and (ii) signal-to-noise ratio is improved by ignoring any delta or sigma power not
meeting the criteria for SW or spindle detection (e.g. maximum and minimum duration, minimum
power).
Phase-amplitude coupling
As a numerical index of PAC, we employed the modulation index (MI) described by Tort et al.
(2010), implemented in Python based on Matlab (Mathworks Inc.) scripts shared with us by
Adriana Tort. To obtain the MI for nesting frequency fp and nested frequency fA:
(1) The re-referenced signal s(t) was band-pass filtered at both frequency ranges, yielding
sfp(t) and sfA(t).
(2) The standard Hilbert transform was then applied to sfp(t) and sfA(t), yielding analytic
signals sfpa(t) and sfAa(t), respectively.
(3) The instantaneous phase of sfpa(t) was extracted, providing the phase time series ϕfp(t),
and the absolute value of sfAa(t) provided the time series of the amplitude envelope
sfAm(t). These were combined into the composite signal ϕfp(t),sfAm(t), which indicates the
absolute amplitude of fA at every phase of the fp oscillation.

9
(4) We then binned ϕfp(t) into 18 phase bins, each spanning π/10, or 20°, and computed the
mean amplitude of sfAm(t) per phase bin. The choice of 18 bins balances precision with
computational savings.
(5) The mean amplitudes per bin were normalized by dividing them by the sum over all
phase bins.
(6) The MI was obtained by applying the following formula, derived from the Kullback-Leibler
divergence:
where P(j) is the normalized distribution of mean amplitudes per bin, and N is the number
of phase bins.
(7) Finally, the MI was natural log-transformed for linear statistical analysis.
The MI formula offers a normalized metric of the dissimilarity between the distribution of interest
and a uniform, or flat, distribution, and expresses it as a fraction of the maximum possible
dissimilarity log(N). Note that a flat distribution of mean amplitudes per phase bin would
evidence a complete absence of PAC, and would yield an MI of 0. SW to adapted sigma MI was
calculated for stage N2 only, stage N3 only, and stages N2 and N3 combined, and for NREMS
period 1 only and all NREMS combined. In REMS, two nesting frequencies were examined:
delta (1.5-3.5 Hz) and theta (3.5-8 Hz). MI was calculated between these bands and gamma
(50-100 Hz) as the nested band, for REMS period 1 only and all REMS combined. MI was
calculated first per 30-s epoch, then averaged. In parallel with these analyses, average power in
each of the concerned bands was calculated: delta (0.25-4 Hz) and adapted sigma power was
taken for N2 only, N3 only, and N2 and N3 combined, and for NREMS period 1 only and all
NREMS concatenated; and delta (1.5-3.5 Hz), theta and gamma power were taken for all REMS
concatenated. We selected NREMS period 1 because of the greater delta activity in this period,
and because it is more proximate to the learning event. Furthermore, prior studies relating sleep
oscillations to learning did so mainly in the first NREMS period (Gais et al., 2002; Moroni et al.,
2008). We chose to use all REMS periods together because even though the first REMS period
is more proximate to the learning task, it is too short for a meaningful analysis.
Aru et al. (2015) recommend that PAC detection be underpinned by a rise in power in the
nesting rhythm. To this end, we also performed a power-triggered analysis, with NREMS delta-
sigma MI measured strictly over concatenated SW-concurrent signal. This ensured that
significant power was always present in the phase-giving delta band. For PAC during REMS, we
used a detection algorithm for delta and theta (the phase-giving signals) that was identical to the

10
spindle detection algorithm described above, with the exception that no maximum duration was
imposed, and delta or theta were used for filtering instead of adapted sigma. Signal concurrent
with detected delta or theta oscillatory trains was then concatenated, and delta- or theta-gamma
MI analysis was performed over the concatenated trace. As was done for detected SWs and
spindles, we calculated mean duration, density and average RMS for detected oscillatory trains
in REMS. For the power-triggered analysis, we focused on NREMS period 1 for delta-sigma
coupling, and all REMS periods concatenated for delta-gamma and theta-gamma coupling.
Phase analysis
The MI expresses the coupling strength between two frequencies, but not their phase
relationship. For example, a clustering of gamma power at the theta peak and an equal
clustering of gamma power at the theta trough will result in equal MIs. Yet, phase dynamics
appear to be functionally important in the brain (O’Keefe and Recce, 1993) and may be related
to learning. Using the mean amplitudes per phase bin obtained in step 4 of the power-triggered
MI analyses, we examined the effects of learning on phase dynamics by comparing the phase-
amplitude plots directly between experimental nights, in Fz and Cz. Instead of normalizing with
respect to the sum over all phase bins as in step 5 of MI analysis, we normalized with respect to
the average RMS of the 5-minute quiet wakefulness recording made just prior to the pre-sleep
task. This normalization corrects for EEG characteristics of the participant and the recording, as
well as for effects of the task on subsequent EEG characteristics. We define the coupling phase
as the fp phase bin gathering the maximal fA mean amplitude.
Comodulogram
To further explore PAC dynamics during sleep, we employed a log-based comodulogram. The
PAC comodulogram is a heat map of MI values at different combinations of phase (x-axis) and
amplitude (y-axis) frequencies, i.e. it expresses the comodulation of two frequency ranges.
Three considerations informed its design: (i) PAC can only be effectively detected if the
bandwidth of the nested frequency ΔfA is at least double the centre value of the nesting
frequency fp (i.e. ΔfA ≥ 2fp; Aru et al., 2015); (ii) there are inter-individual differences in the band
limits of physiological EEG oscillations (Finelli et al., 2001); and (iii) the bandwidths of
physiological oscillations are linearly distributed on a natural logarithmic scale (Buzsáki and
Draguhn, 2004; Buzsáki and Mizuseki, 2014). In light of these considerations, the
comodulogram was constructed as follows:
(1) The adapted sigma centre frequencies were averaged over all participants, yielding .

11
(2) A progression of centre frequencies were generated, each separated by a distance of 0.6
and with a bandwidth of 0.6 on the natural logarithmic scale, spanning from ~0.5 Hz to ~
30 Hz, such that it coincided with . This progression provided the average nesting
(phase-giving) frequency bands, with logarithmically increasing bandwidths presumably
more faithful to brain oscillatory dynamics (iii). The choice of a step of 0.6 balances
precision with computational savings.
(3) The progression in (2) was extrapolated for ~10 Hz to ~ 128 Hz to provide average
nested (amplitude-giving) centre frequencies.
(4) Using the same method as in (2), a progression of nesting centre frequencies were
generated for every participant according to their individual , thus adjusting to individual
differences in oscillatory band-limits (ii).
(5) As in (2-3), the progression in (4) was extrapolated to create the adapted nested
frequencies.
(6) MIs were computed using each individual’s adapted nesting and nested frequencies, but
instead of using fixed bandwidths for the nested frequencies, a dynamic bandwidth was
imposed, such that the nested frequency bandwidth was always double the upper limit of
the nesting frequency band. This ensured that the PAC bandwidth rule (Aru et al., 2015)
was not violated (i).
(7) MIs were log-transformed and then normalized with respect to the mean of all log-
transformed MIs for that recording.
(8) Normalized log-transformed MIs were then averaged among participants and
represented on a heat map with the average nesting and nested frequencies from (2-3)
on respective x and y axes.
As the comodulogram is computationally demanding, it was applied to the Cz signal only. All
epochs of the relevant stage and cycle were concatenated for analysis, as an epochwise
analysis would have been computationally onerous. Four comodulograms were generated per
participant in step (7): learning night NREMS period 1, learning night REMS, control night
NREMS period 1 and control night REMS.
Statistics
Statistical analyses relied on three general linear models. Model 1 was an analysis of covariance
(ANCOVA) with a repeated measures factor “Task” for the type of cognitive task, learning or
non-learning, performed before (and after) sleep. The dependent variable (DV) was the sleep
parameter of interest (i.e. absolute and relative MI and oscillatory parameters). This model

12
examined the effect of an intensive learning opportunity on subsequent sleep characteristics.
Model 1 also took into account age as a covariate, recorded within two decimal places. Our
limited sample size constrained us to using only one covariate, and age is at once known to
affect sleep characteristics and, through its correlation with education (in our sample, r = 0.67, p
= 0.033), to enhance learning ability. As such, we supposed age would account for maximal
error in our variables of interest among participant characteristics. Model 2 was a multiple
regression with age and the sleep parameter of interest as independent variables (IV). The DV
was the overnight change in performance on the learning task, termed “Gains”, defined as the
number of word pairs recalled post-sleep minus the number recalled pre-sleep, divided by the
total number of word pairs presented. This model tested the influence of sleep parameters on
overnight memory maintenance. Multiple regression was again employed in Model 3, taking age
and the pre-sleep memory performance score as IVs and the sleep characteristic of interest as
the DV. This last model aimed to test the effect of the amount of successful pre-sleep encoding
on subsequent sleep characteristics. For Models 2 and 3, the absolute MI and power analyses
were complemented by analyses of relative MI and power, wherein the relative value was taken
as the learning night value divided by the control night value. In this way, relative MI and relative
power provided indices of the relative change in these parameters following an intensive
learning opportunity. All three models were applied to oscillatory parameters (duration, RMS,
amplitude, density); spindle counts per SW quadrant; sigma power per quadrant; average sigma
power over SWs; absolute and relative power-triggered log-normalized MIs per band, stage and
cycle; and absolute and relative power values per band, stage and cycle. For the phase
analysis, Model 1 was used to determine whether “Task” predicts mean amplitudes per phase
bin, with age as covariate, with the added fixed factor “Phase bin”.
Using results of the log-based comodulogram, we undertook a systematic comodulation
analysis. Differences between experimental nights were examined using paired samples t-tests,
comparing every learning night MI value with its control night counterpart, for both NREMS
period 1 and REMS separately. For both stages, in order to visualize the topography of statistical
difference probability between learning and control nights, we generated a comodulogram of
mean MI differences and a corresponding comodulogram of p-values. To detect sleep stage
differences in coupling, we averaged corresponding MIs from learning and control nights, and
used t-tests to compare each average between REMS and NREMS period 1. Again, a mean
difference comodulogram and a p-value comodulogram were generated to visualize coupling
difference topography.

13
Because this was an exploratory study, and because we targeted our analysis to certain
oscillatory bands we believed to be meaningful based on prior studies, we set α to 0.05 for all
CFC analyses. In the stage difference comodulogram, we expected larger differences, so α was
set to 0.01 instead.
Results
Participant sample
We recorded 18-channel scalp EEG from 10 participants as they slept following either a learning
task or a non-learning control task. Out of 257 responders to the online advertisement, 156 were
successfully screened by telephone. Among those deemed eligible, 45 were interviewed in
person and 36 were screened by overnight PSG. Four participants dropped out for personal
reasons, and a fifth because of an allergic reaction to the PSG equipment. A further three were
taken out of the study for not keeping appointments or for breach of protocol. Lastly, two
participants’ data were excluded from analysis because of poor sleep on experimental nights,
due to illness. The final sample of 27 participants were recorded in three cohorts. The first pilot
cohort of 13 participants were tested under a different design from the rest, and their results are
not presented here. The second cohort of 10 participants (5 female) are the final sample
presented in this paper, and are from now on referred to as the participant sample. The third
cohort of four participants, recorded later on, will soon be combined with the second for further
analysis. Characteristics of the participant sample, including age, number of years of education
and questionnaire scores, are presented in Table 1. Participants’ sleep quality and duration were
normal on both experimental nights (Table 2), with the exception of one participant who
experienced pain from the onset of an acute medical condition. In this case, the night was cut
short after two sleep cycles. This duration was sufficient for the participant’s data to be retained.
All participants slept for at least two cycles each night. Epochwise artefact rejection resulted in
the exclusion of an average of 11.6 % (SD = 6.3 %) of 30-s epochs per recording, including
epochs of waking mobility.
Learning task
In the learning task, participants recalled an average of 59.8 (49.8 %) (SD = 34.1; 28.4 %) out of
120 words on the pre-sleep test, and 59.5 (49.6 %) (SD = 35.0; 29.1 %) on the post-sleep test
(Table 3). The overnight change in performance, or gains, ranged from forgetting 6 words to
remembering an additional 3 words, with a mode at remembering one additional word. Five

14
participants improved their score overnight and three decreased in score, such that there was no
statistically significant change in score (p > 0.05).
Power spectra
Power spectral densities were computed across all electrodes for delta (0.5-4 Hz) and sigma
(10-16 Hz) in NREMS, and delta (1.5-3.5 Hz) and theta (4-8 Hz) in REMS (Fig. 2). Cz and Fz
showed the greatest concentration of power in these bands, and so were chosen for all further
analyses. Spectral distributions at Cz for each participant, stage and task condition are shown in
Figures 3 and 4. Strong NREMS sigma peaks are visible in all participants (Fig. 3), while REMS
theta peaks are visible in 5 out of 10 participants (Fig. 4). Adapted sigma bands were detected
from stage N2 power spectral peaks (Fig. 5). Peaks for each channel and participant agreed
closely between experimental nights (r = .87, p = .00093) (Fig. 6). We then compared spectral
power between experimental nights (Model 1). We split NREMS into N2 and N3, and checked
for differences in delta (0.25-4 Hz) and adapted sigma. In REMS, we checked for differences in
delta (1.5-3.5 Hz), theta (3.5-8 Hz) and gamma (50-100 Hz). In all cases, we applied the
analysis either to all epochs of the stage, or only to epochs in cycle 1. Because we had no a
priori assumptions about power differences, we used the more stringent Bonferroni method to
correct for multiple comparisons (α = 0.0125; 4 related tests per frequency band). No statistically
significant differences were detected between learning and control nights (p > 0.0125; NREMS:
Table 4; REMS: Table 5), although a low p-value (p = 0.049) was obtained for normalized delta
power in REMS, with the control night value exceeding the learning value by a considerable
effect size (d = 0.54). We then probed for effects of learning night spectral power on overnight
gains in the learning task (Model 2). In this model, we also looked at effects of relative power
(ratio of learning night to control night power); we corrected α accordingly (α = 0.0125). There
were no statistically significant correlations (p > 0.0125; NREMS: Table 6; REMS: Table 7).
Lastly, Model 3 was applied to all absolute and relative power values to assess the effect of
successful pre-sleep encoding. Again, no statistically significant correlation was found (p >
0.0125).
Discrete oscillatory events
Discrete spindles and SWs were successfully detected in stages N2 and N3 on channels Fz and
Cz using our custom detection algorithms, detailed in Methods. Delta and theta trains were
detected in stage REMS on Fz and Cz using an algorithm similar to the spindle detector. Event
densities per 30-s epoch are shown in Table 8. SW density showed the greatest variability; other

15
event densities were moderately variable within and between participants. None of the densities
were correlated with age (p > 0.05). Average oscillatory parameters per participant (density,
duration, RMS and amplitude) are shown in Tables 4 (NREMS) and 5 (REMS). No significant
differences were found between experimental nights, using Model 1 with a corrected alpha of α
= 0.0125 (4 related tests per frequency band), although low p-values for SW RMS (p = 0.049)
and amplitude (p = 0.050) indicate a possible increase in SW power in the learning night, with a
minimal effect size (Cohen’s d = 0.19 and d = 0.04, respectively; Tables 4 and 5).
Judging by the same corrected alpha of α = 0.0125, Model 2 did not reveal any
significant correlation between absolute or relative oscillatory parameters and gains (Tables 6
and 7, respectively). Still, the recurrence of marginally significant (p < 0.05) event density
correlations in REMS indicate a possible negative relationship. Greater delta train density on Fz
and Cz and theta train density on Cz were associated with overnight decreases in performance,
on the order of –2 to –6 percentage points (pp) per additional unit of relative density. Similarly,
overnight gains showed a marginally significant negative correlation with NREMS SW RMS at Fz
(F = 5.89, pRMS = 0.024) and Cz (F = 3.26, pRMS = 0.089), with large effect sizes of –32 pp (SD =
11 pp) and –20 pp (SD = 10 pp) per unit of relative power increase, respectively. Another
marginally significant correlation was detected between gains and delta train RMS (F = 4.99,
pRMS = 0.036), with a positive effect size of 4.1 pp (SD = 1.6 pp) per relative power unit. With the
exception of this last correlation, all correlations detected between gains and oscillatory
parameters, namely delta and theta densities, and delta and SW power, were negative.
However, given the high p-values and small effect sizes (except for SW RMS), they are to be
considered only tentatively. A closer look at the SW RMS data (Fig. 7) indicates the correlation
was driven by an outlier.
The relationship between successful pre-sleep encoding and oscillatory parameters was
investigated using Model 3. Pre-sleep score, expressed as a ratio, was positively correlated with
the average theta train absolute duration on Fz during REMS (F = 8.17, R2 = 0.70, b = 0.22, pΘdur
= 0.015). According to these results, every 10 pp increase in baseline score was associated with
a 0.022 s (SD = 0.06 s) increase in theta train duration, amounting to only a fraction of a theta
cycle. As such, this finding is probably trivial.
The trough-triggered grand average of all detected spindles (Fig. 8) clearly displays the
coupling of spindles to the ascending phase (up-state transition) of the SW. The synchrony
between detected SWs and spindles was quantitatively assessed first by counting the number of
spindles beginning in each quadrant of the SW. No significant difference in quadrant spindle
counts was detected between experimental conditions, nor were the counts predictive of
16
performance gains. The spindles were then counted instead using their amplitude minimum as a
temporal marker, and again no significant result was found. Next, the average adapted sigma
envelope over each SW was averaged per participant, normalized with respect to the
participant’s pre-sleep, pre-task, 5-min quiet wakefulness recording, and averaged for each
experimental night across participants. The result is plotted in Figure 9. The average power over
the SW trough was compared between learning and control nights using Model 1; no significant
difference was detected. We then used Model 2 to probe for a relationship between relative
adapted sigma power over the SW trough and performance gains. A significant negative
correlation was detected (F = 5.48, ppower = 0.029), meaning that greater sigma power over the
SW trough (up-state) in the learning night was associated with worse overnight memory
stabilisation.
Phase-amplitude coupling with a priori bands
PAC on Fz and Cz was quantified using the MI, applied to delta (0.25-4 Hz) with adapted sigma
in NREMS, delta (1.5-3.5 Hz) with gamma (50-100 Hz) in REMS, as well as theta (3.5-8 Hz) with
gamma in REMS. Average values were obtained by calculating the MI for each 30-s epoch
within a stage and cycle, then averaging. For all NREMS analyses, epochs from stages N2 and
N3 were combined. For each band pair, we obtained average MIs for all cycles together, and for
the first cycle only.
Raw MIs were lognormally distributed (Fig. 10). Accordingly, all MIs were log-
transformed for Gaussian-based analysis. No significant differences between learning and
control nights were identified for either band pair using the Model 1 ANCOVA with α = 0.05
(Table 9 and Fig. 11). Delta-sigma MI on Cz during NREMS period 1 was slightly greater in the
learning night than in the control night, with a trend to significance (F = 4.94, p = 0.057) and an
appreciable effect size (d = 0.29). This result was not reflected in Fz. Next, the Model 2
regression was applied to relative MIs (learning night MI divided by control night MI), to
determine the predictive strength of MI on performance gains (Table 10). Two statistically
significant correlations were identified on Fz. First, delta-sigma relative MI in NREMS period 1
was highly predictive of gains (F = 11.42, pMI = 0.004), with a large effect size of 51 pp (SD = 12
pp) gains per unit increase in relative MI (Fig. 12). No such effect was detected for all NREMS
periods combined. Second, theta-gamma MI in REMS was predictive of gains (F = 8.91, pMI =
0.009), but with the inverse relationship; a unit increase in relative MI corresponded with a 47 pp
(SD = 13 pp) decrease in gains (Fig. 13). A third correlation was found on Cz, whereby delta-
gamma MI in REMS was negatively related to gains (F = 4.68, pMI = 0.041), with a 35 pp (SD =

17
14 pp) decrease in gains per unit increase in relative MI. As for the remaining two REMS PAC
measures, delta-gamma MI on Fz and theta-gamma MI on Cz, although their p-values were
above threshold, they were relatively low (p < 0.20), and their effect sizes were similar in
direction and magnitude to their statistically significant counterparts. From these data, it would
seem that declarative memory consolidation in sleep is at once concurrent with an increase in
early NREMS frontal PAC and a decrease in REMS frontal and central PAC. Lastly, Model 3
regression was applied to log-transformed relative MIs to probe the relationship between
successful pre-sleep encoding and subsequent sleep PAC. No statistically significant effect was
detected for either of the three band pairs (Table 11).
We sought to corroborate these findings with power-triggered MI, a more stringent
measure of PAC. In Model 1 (Table 12 and Fig. 14), we found a statistically significant increase
in control night delta-sigma MI compared to the learning night in NREMS period 1 on Fz (F =
6.51, p = 0.034). However, the effect size is negligible (Cohen’s d = 0.091). Relative power-
triggered MIs were then inserted into Model 2 to corroborate the delta-sigma, delta-gamma and
theta-gamma correlations with gains. The correlations could not be reproduced, nor was any
other correlation detected (Table 13). Model 3 regression on relative power-triggered MIs was
equally ineffective.
Phase analysis
Coupling phase differences between experimental nights were investigated by comparing
binned mean amplitudes from the a priori PAC analysis. We examined mean adapted sigma
amplitudes binned by delta phase, in NREMS period 1 only. Mean amplitudes were log-
transformed and normalized, and sorted into 18 phase bins (Fig. 15). The averages for each
experimental night across participants are presented in Figure 16. From these phase-amplitude
plots, delta-sigma coupling phase seems smeared to the right in the learning night compared to
the control night, with the greatest learning-related increase situated in the latter half of the delta
wave rising slope (90-180°). A two-way ANCOVA was conducted to find statistically significant
differences in mean amplitude between experimental nights (Task) and phase bins (Phase),
controlling for age. To simplify the analysis, mean amplitudes were averaged into two phase
bins: the delta rising phase (trough to peak, or down- to up-state) and falling phase (peak to
trough, or up- to down-state). While there was no effect of Task (F = 1.07, p = 0.33) or Phase (F
= 4.11, p = 0.077) for Fz, there was a statistically significant interaction between Task and Phase
(F = 13.91, p = 0.006), whereby the difference between rising phase and falling phase mean
amplitudes was more pronounced on learning nights than on control nights (Fig. 17). This

18
interaction was mirrored in Cz (F = 7.75, p = .024), while Task (F = 1.07, p = 0.33) and Phase (F
= 3.24, p = 0.11) showed no effect. Relative log-transformed mean amplitudes (learning divided
by control) were then correlated with performance gains using regression Model 2 (Table 14).
Relative mean amplitudes over the SW rising phase on Cz were predictive of an overnight
performance decrease (F = 5.35, pMA = 0.031), with unit increases in relative mean amplitude
concomitant with a 21 pp (SD = 78) decrease in gains. Other relative mean amplitudes did not
show a statistically significant prediction, although it is worth noting that their effect sizes agree
with the statistically significant result in both direction and magnitude.
Comodulogram
In the comodulogram analysis, we systematically scanned phase and amplitude frequency
bands for PAC differences between experimental nights, on Cz only. Four comodulograms were
produced per participant: NREMS period 1 and all REMS periods in learning and control night
conditions. A sample participant’s comodulograms for NREMS and REMS are shown in Figure
17. Final MI values in each comodulogram were obtained from raw MIs by first log-transforming
them, then normalizing them with respect to the comodulogram average. We averaged each MI
across participants to obtain mean comodulograms for each of the four conditions. Comparisons
of MIs between learning and control nights for NREMS and REMS are shown in Figures 19 and
16, respectively. Reported frequencies for the comodulogram are extrapolated from the average
adapted sigma centre frequency; actual frequencies varied among participants, according to
their visually selected adapted sigma centre frequency.
Significant differences of particular interest were detected in the REMS comodulogram
(Table 15, Fig. 20). A cluster of statistical significance is visible in Figure 20 in the theta to
beta/gamma range, whereby learning night MI was greater than control night MI. The cluster
ranged from 4.3 Hz to 5.8 Hz in the phase band, with 22.1 Hz to 37.6 Hz in the amplitude band.
The greatest difference was at fp = 4.3-5.0 Hz with fA = 27.6-37.6 Hz (p = 0.0011). Three other
points in the cluster were at fp = 4.3-5.0 Hz with fA = 22.1-33.1 Hz (p = 0.048), fp = 5.0-5.8 Hz
with fA = 22.1-33.1 Hz (p = 0.0196) and fp = 5.0-5.8 Hz with fA = 27.6-37.6 Hz (p = 0.087). A fifth
significant MI difference was detected in the theta-gamma range, but slightly removed from the
cluster, at fp = 6.8-7.8 Hz with fA = 30.0-45.7 Hz (p = 0.014). Thus, theta-beta/gamma coupling
was increased centrally in REMS after a learning task. A second cluster of significance is visible
in the delta-gamma range; however, the direction of the effect is inconsistent (see Table 15).
In NREMS (Table 14, Fig. 19), we found that control night MI was significantly greater
than learning night MI at fp = 6.8-7.8 Hz with fA = 72.4-88.0 Hz (p = 0.012). A nearby point

19
corroborates this finding, at fp = 6.8-7.8 Hz with fA = 51.6-67.2 Hz (p = 0.024). Contrary to REMS,
theta-gamma seems to be decreased centrally in NREMS after a learning task. Another isolated
significant difference was located in the delta-gamma range at fp = 1.8-2.0 Hz with fA = 56.4-62.4
Hz (p = 0.029), whereby learning night MI was greater than control night. This finding is difficult
to corroborate because of the comodulogram’s sparseness in low-to-high frequency coverage.
Because of the choice of a dynamic bandwidth in this comodulogram, MIs with low phase
frequencies are paired with narrow amplitude bandwidths (as these double the phase frequency
maximum). As a result, some high amplitude frequencies are omitted from analysis at low phase
frequencies, such that we do not obtain a full picture of low-to-high frequency PAC.
To characterize coupling dynamics across sleep stages, we also compared the NREMS
and REMS averages. We did this by averaging MIs between experimental nights for each stage.
Difference values (REMS minus NREMS) are shown in Figure 21. Four clusters are visible. First,
low delta (~1 Hz) to sigma (12-16.5 Hz) coupling is greater in NREMS (p < 0.01), as would be
expected. But surprisingly, high delta (2.75-4 Hz) to alpha/sigma/beta (9-18 Hz) coupling is
greater in REMS (p < 0.01). Sigma (12.3-14.3 Hz) to beta/gamma (14-43 Hz; p < 0.05) also
appears increased in NREMS. Delta comodulation of alpha (8-12 Hz) is greater in NREMS as
well (p < 0.01). Lastly, low delta (~1.5 Hz) to beta (27-30 Hz) and gamma (36-39 Hz) were
greater in REMS ( p < 0.05). Again, the low- to high-frequency sparseness of the comodulogram
makes this last cluster difficult to interpret.
Discussion
By recording scalp EEG while human participants slept following an intensive declarative
learning opportunity, this study provides experimental evidence of an effect of learning on sleep
CFC, and contributes correlative evidence of a relationship between sleep CFC and memory
consolidation. The findings are consistent with counterbalancing effects of NREMS and REMS
CFC on declarative memory consolidation. In early NREMS, frontal increases in delta-sigma
PAC with respect to the non-learning control night were predictive of better overnight word pair
retention. Conversely, in REMS, frontal theta-gamma and central delta-gamma PAC increases
predicted worse overnight retention. Coupling intensification not only preceded retention, but
also succeeded encoding. After learning tasks, compared to after control tasks, we observed
coupling strength increases in the vicinity of these same rhythm pairs. In NREMS period 1, delta-
sigma PAC was increased at Cz, albeit with marginal statistical significance, and in REMS,

20
narrowband delta-to-gamma PAC and wideband theta-to-beta/gamma PAC were both markedly
increased at Cz.
Importantly, oscillatory interactions predicted retention independently of the individual
characteristics of their constituent rhythms, which themselves showed weak or absent
associations. Here, the link between sleep and memory is an emergent property of its system of
rhythms. Cox et al. (2012) came to a similar conclusion from their data showing that spindles
better predicted memory performance when occurring in conjunction with SWs in stage N3.
In comparing the raw comodulograms in Figure 18 with the respective difference
comodulograms of Figures 19 and 20, it is interesting to note that the distribution of learning-
related changes in PAC bears little resemblance to the absolute PAC strength distribution. This
may indicate that learning-dependent PAC is weak compared to other PAC processes in the
brain.
NREMS CFC and learning
Previous behavioural studies have identified SWs and spindles as individual mechanisms of
sleep-dependent memory consolidation. We submit that if changes in these oscillations
contribute to memory consolidation, it is perhaps by the intermediary of their synchronization. It
would follow that SW-spindle CFC may be a more specific biomarker of successful memory
consolidation. Our secondary results bear this out, showing effects of learning on parameters of
individual oscillations that were weak in comparison to their effects on PAC, and no effect of
these parameters on retention. This contrasts with studies reporting effects of word pair learning
on spindle density (Gais et al., 2002) or correlations between spindle density and overnight word
pair retention (Gais et al., 2002; Schabus et al., 2004; Cox et al., 2012). But a closer comparison
with these studies reveals important differences. Two of these studies (Gais et al., 2002;
Schabus et al., 2004) counted spindles in stage N2 only and the other (Cox et al., 2012) in stage
N3 only. The present study instead aggregated spindles from stages N2 and N3. In addition, we
normalized learning night spindle counts with respect to the control night using a ratio (learning
divided by control), whereas previous studies used absolute (Gais et al., 2002; Schabus et al.,
2004; Cox et al., 2012) or difference (Schabus et al., 2004) measures. Lastly, one of these
studies (Schabus et al. 2004) detected effects of spindle activity on retention by dichotomizing
their participant sample into spindle enhancers and non-enhancers and applying an analysis of
variance, whereas we applied a regression to the continuous spindle count ratios. It may be that
the measures employed in these other studies were more sensitive to spindle effects.
Nonetheless, we believe that our method of applying multiple regression to the continuous

21
distribution of normalized (learning divided by control) spindle densities, in all NREMS stages
containing spindles, constitutes an at once controlled and comprehensive assessment of spindle
effects. Normalization with respect to control values is particularly important. Because most brain
dynamics are log-normal and hence the result of many multiplicative effects (Buzsáki and
Mizuseki, 2014), we should expect that behaviour-related changes are also multiplicative.
Normalization returns multiplicative changes to an additive standard, unbiased by baseline
differences.
As to SW parameters, our findings are consistent with a stereo EEG study by Moroni et
al. (2008) that reported no effect of word pair learning on cortical SW power during sleep
(although SW RMS at Fz was marginally significantly increased after learning in our data, in
agreement with findings from Mölle et al., 2009). Moroni et al. (2008) did show effects for motor
learning. Similarly, a study led by Tononi found SW power increases following motor learning,
which were topographically bound to regions recruited by the task, and which were correlated
with next-day performance (Huber et al., 2004). The synaptic homeostasis hypothesis suggests
that SWs contribute to the renormalization of synaptic strengths following net potentiation from
daytime learning (Tononi and Cirelli, 2006; Tononi et al., 2014). Taking this view, it may be that
motor learning opportunities are sufficiently uncommon in the typical research participant’s day,
and motor synapses so seldom modified, that any potentiation resulting from a motor learning
task can stand out as SWs in the sleeping brain. In contrast, the synaptic effects of a declarative
learning task may be drowned out by the ubiquitous declarative learning episodes of a typical
day (e.g. talking to a friend, reading, watching television). In our task, we attempted to
compensate for this extraneous learning by presenting a large amount of information. But insofar
as it affects SW power, the amount of information may still have been insufficient to stand out
against the background of the day. Regarding effects of SW parameters on memory
consolidation, we again found no correlation. Previous work has established a causal
relationship between SWs and the improvement of overnight recall (Marshall et al., 2004;
Marshall et al., 2006). These studies show that artificially inducing or disrupting SWs alters
memory consolidation, but they do not speak to the predictive power of baseline SW parameters
in a natural setting. Our work shows that in an ecologically valid setting, endogenous variability
in SW parameters is not predictive of memory performance.
Phase-amplitude coupling may provide a more sensitive marker of endogenous NREMS
memory processes. As stated, in the first cycle of NREMS, adapted sigma power was more
strongly tuned to delta phase following a learning task. Furthermore, delta-sigma relative PAC
(RPAC; i.e. learning night PAC divided by control night PAC) in this same period strongly

22
predicted overnight change in recall performance (Fig. 12). This last finding is consistent across
participants: those who increased their recall score overnight showed increased PAC in the
learning night, and those whose score decreased also decreased in PAC. Similar to this,
Niknazar et al. (2015) found that the timing of spindles during the SW up-state transition
predicted better recall after a morning nap. We may surmise from these findings that the degree
of synchronization of SWs and spindles (i) is variable, (ii) is modified by learning in prior waking
and (iii) is correlated with successful recall of this information. As such, we offer delta-sigma
RPAC in early NREMS as a potential biomarker of sleep-dependent memory consolidation.
An examination of the delta-sigma phase-amplitude distribution revealed a concentration
of sigma power at the delta trough, reaching its peak during the rising phase (Fig. 16). Taking
the delta trough as reflecting the SW up-state, these phase dynamics are suggestive of spindle
triggering by SW onset (Contreras and Steriade, 1996; Steriade, 2006), with the spindle peak
reached as the down-state transition begins. Past studies have observed similar phase coupling
(Mölle et al., 2002; Mölle et al., 2011; Staresina et al., 2015). Comparing phase-amplitude plots
between learning and control nights, we found that sigma power is smeared towards the right in
the learning night, representing an extension of spindle power into the down-state transition.
However, this trend was only visible in half of the participants. Mölle et al. (2011) reports a
similar observation, whereby learning enhanced the power of slow spindles (9-12 Hz) which
occurred mostly at SW down-state transitions. Slow spindles were considered distinct from fast
ones (12-15 Hz) in their analysis, whereas in the present study, sleep spindles were taken as a
unitary phenomenon (Zerouali et al., 2014). In addition, in our discrete SW analysis, we found
that greater sigma power during the SW up-state predicted worse retention post-sleep. In
contrast with our results, Niknazar et al. (2015) reported that spindles occurring during up-state,
not down-state, transitions were most predictive of successful declarative recall. It should be
noted that both this study and Mölle et al.’s (2011) used a priori bands for spindle detection,
while the present study used adapted bands.
REMS CFC and learning
As in NREMS, we observed no learning-induced changes in REMS oscillatory parameters, nor
were these parameters significantly predictive of memory performance, although a marginally
significant increase in normalized delta power was observed after learning in REMS. There is
scant evidence linking theta or delta oscillatory parameters in REMS to declarative memory
consolidation (Fogel et al., 2007). This study did not replicate findings from Fogel et al. (2007),
showing a statistically significant theta power rise at Cz after word pair learning, compared to a

23
non-learning night. This may be due differences in spectral data analysis: Fogel et al. log-
transformed the spectral data and made comparisons using absolute values, while we did not
log-transform the data, and expressed it as a ratio of total spectral power for comparison. The
optogenetic study by Boyce et al. (2015) demonstrated that hippocampal theta is necessary for
contextual memory consolidation in the rat, but like the studies by Marshall and colleagues
(2004; 2006) for SWs in NREMS, they say little about the impact of naturalistic variations in theta
on successful memory encoding and retrieval.
To our knowledge, this study is the first to report associations between REMS CFC and
cognition in humans or animals. Specifically, we found that theta (4-8 Hz) to beta/gamma (22-46
Hz) PAC was increased at Cz after a learning task compared to a non-learning task, while
modulation of gamma (50-100 Hz) was unchanged. Furthermore, theta (3.5-8 Hz) to gamma
RPAC at Fz, as well as delta (1.5-3.5 Hz) to gamma RPAC at Cz, both predicted decreased
overnight retention. Previous intracranial EEG studies in humans have identified significant PAC
in the delta-gamma (Clemens et al., 2009; Amiri et al., 2016) and theta-gamma (Amiri et al.,
2016) ranges during REMS. Rodent studies also show strong theta-gamma PAC in REMS,
comparable to, or even stronger than, that seen in waking locomotion (Montgomery et al., 2008;
Scheffzük et al., 2011; Brankačk et al., 2012). None of these studies investigated learning
effects.
Differences in CFC by stage
Perhaps unsurprisingly, there were some significant differences in CFC between NREMS and
REMS (Fig. 21). As expected, delta-sigma coupling was much stronger in NREMS, but only for
the lower end of delta (~1 Hz). High delta (2.75-4 Hz) to sigma PAC was instead decreased in
NREMS. The coupling of spindles specifically to the slow oscillation (SO) frequency (~1 Hz;
Steriade et al., 1993) is a common finding (Mölle et al., 2011; Staresina et al., 2015). From our
data, it seems plausible that the SO acts as an attractor that pulls spindles away from high delta
comodulation. Alternatively, high-delta to alpha/beta (9-18 Hz) may simply be enhanced in
REMS. In future CFC work, it will be advantageous to consider low delta and high delta
separately. Unexpectedly, low delta (0.75-2.25 Hz) to alpha (8-12 Hz) showed a strong increase
in NREMS.
Significance of sleep CFC for learning
This work comprises a direct test of a widely held hypothesis in sleep and memory research, that
newly learned memories are stabilized and integrated into existing knowledge networks through

24
the temporal orchestration of NREMS oscillations (Diekelmann and Born, 2010; Lewis and
Durrant, 2011; Rasch and Born, 2013; Tononi and Cirelli, 2014). Our results support this notion.
We have shown that the phase of the cortical SW biases the occurrence of thalamocortical
spindles, and that the extent of this bias is at once increased by learning and predictive of
successful retention. Importantly, these effects are independent of characteristics of their
underlying oscillations, meaning that high-order oscillatory synchronization is critical for sleep-
dependent memory consolidation. The coordination of electrical oscillations may provide
windows of synchrony through which information is routed in the brain (Fries, 2005; Canolty and
Knight, 2010).
With respect to memory, temporal segregation of neuronal activity may encode time and
place in the brain. Sleep oscillations, especially hippocampal SPW-Rs, are thought to enact
retrospective replays (Wilson and McNaughton, 1994; Rasch and Born, 2013), anticipatory “pre-
plays” or simply “plays” of memories, embedded, interpreted and mis en scène within the brain’s
larger knowledge network (Gupta et al., 2010; Tononi and Cirelli, 2014). These “memory plays”
are organized at progressively longer scales by spindles and SWs (Staresina et al., 2015) and
are thought to at once stabilize memories and integrate them with prior knowledge (Lewis and
Durrant, 2011; Stickgold and Walker, 2013). Were memories of different places and times to be
played haphazardly, or all at once, their neuronal activations would become intermingled and
their features conflated. Unless memory plays are spatially segregated in the brain, which is
highly unlikely given that memories combine aspects that recruit the entire brain (senses,
emotions, language, semantic associations), they must be separated in time. Neuronal
oscillations seem ideally suited to this task, by parsing neuronal activity into discrete packets that
can code for when and where (Buzsáki, 2010).
In light of this discussion, we may paint the following speculative picture, in broad
strokes. In NREMS, spontaneous, avalanche-like SW discharges in the neocortex trigger
thalamocortical loop firing. The resulting pattern of potentiation queries the hippocampus into
divulging the sparse cortical trace of an associated episodic memory. The activation of this trace,
in consultation with ongoing cortical and thalamocortical activation from the SW, informs the next
burst of thalamocortical loop firing, bookended by GABAergic inhibition from the thalamic
reticular nuclei (Steriade et al., 1993). With each cycle of this waxing thalamocortical spindle, the
cortico-hippocampal memory is played and replayed, each time generating new activation
patterns in the wider knowledge network that are then fed back into the loop. Finally, the SW
dissipates and the spindle wanes. Presumably, this results in the integration of the memory into
the wider knowledge network, according to its correlation with existing cortical patterns, which

25
are sampled by the ongoing SW (Tononi and Cirelli, 2014). And perhaps by token of this
integration alone, the memory is consolidated. Then, a new SW swells, a new thalamo-cortico-
hippocampal loop emerges, and a new episodic memory is integrated. Critically, each SW is
insulated in time, to ensure that temporally discontiguous memories do not become integrated
and confused. Just as importantly, the spindle loop must occur during the SW so that the
processing of the SPW-R-bound memory can be integrated into the SW-activated network. A
spindle-SPW-R complex occurring out of synch with SWs, or too early or too late in a SW, may
have less ongoing network activity with which to integrate its memory trace, leaving the trace
difficult to access in waking life. In this way, SW-spindle CFC would be indispensable for sleep-
dependent memory consolidation, in agreement with our data.
The picture for REMS CFC is less clear. Studies in awake humans have connected
theta-gamma PAC to memory processes (Canolty et al., 2006; Sauseng et al., 2009; Axmacher
et al., 2010; Kaplan et al., 2014; Sweeney-Reed et al., 2014), particularly in the formation of
later-remembered versus later-forgotten declarative memories (Osipova et al., 2006; Staudigl
and Hanslmayr, 2013; Lega et al., 2014). Rodent studies corroborate these findings (Shirvalkar
et al., 2009; Tort et al., 2009). Theta-gamma PAC is thus emerging as an intraspecific marker of
declarative memory formation (Canolty and Knight, 2010). In addition, hippocampal delta-
gamma PAC has been related to exploration in humans (Jacobs, 2007). It is counter-intuitive,
then, that theta-gamma or delta-gamma PAC should predict worse memory performance, as we
report here. We suggest that the answer may lie in the vigilance state. Ongoing brain activity
during wake is correlated with features of the environment, through perception and action, but it
is not so in sleep (Tononi et al., 1996; Tononi and Cirelli, 2014). According to the synaptic
homeostasis hypothesis, spontaneous activity throughout the sleeping cortex provides neurons
with a comprehensive sampling of the brain’s knowledge of the environment, one which it has
acquired through its entire developmental and evolutionary history (Tononi and Cirelli, 2014). In
this state, the integrative action of synaptic renormalization can heed both daytime learning and
prior knowledge. If renormalization were to occur in wake, i.e. in correlation with the
environment, the limited and biased knowledge of the present moment would exert undue
influence on the brain’s future state (Tononi and Cirelli, 2014). The opposite is true for episodic
memory formation. Episodic memories store novel information in space and time dimensions,
and should be formed in connection with the environment. If episodic memory formation
processes were to be engaged during sleep, neuronal correlations inferred from the environment
during wake (signal) would become mixed with random input from spontaneous activity (noise),
resulting in spurious learning (Nere et al., 2013; Tononi and Cirelli, 2014). And so, if we take

26
theta- and delta-gamma PAC as markers of episodic memory formation, we should expect that
their occurrence in sleep predict worse recall, and this is precisely what we have found in REMS.
Indeed, theta and gamma rhinal-hippocampal coherence in sleep are correlated with
dream recall (Fell et al., 2006), indicating that theta and gamma in sleep are contributing to the
formation of new episodic memories about sleep-specific activity (dreams), rather than to the
consolidation of existing memories from waking life. The haphazard connections made during
dream mentation, when they are consolidated, may weaken existing connections derived from
waking experience. In terms of the present study, if a participant learned the word pair
association “cup – sand”, for example, and later dreamt of having a cup of tea and madeleines
with a well-dressed cuttlefish, and if this dream was consolidated, then in the morning, the word
“cup” may elicit memories of tea, madeleines and cuttlefish which now compete with the target
word “sand”.
Although we did not examine the relationship between NREMS theta-gamma or delta-
gamma PAC and memory performance, we did detect a decrease in these couplings, as
mentioned. In light of the preceding discussion, this decrease seems adaptive: PAC-mediated
memory formation in NREMS would be deleterious. In REMS however, we observed the
opposite: learning increased coupling. Why would such a mechanism be promoted in REMS if it
erodes existing memories? And why is it ubiquitous in animal REMS? The purpose of REMS is
itself unclear (Jouvet, 1998; Siegel, 2005; Poe et al., 2010; Rasch and Born, 2013; Tononi and
Cirelli, 2014). An intriguing possibility was posed by Stickgold et al. (2001). Given that in REMS,
hippocampal outflow is inhibited (Buzsáki, 1996) and limbic activity enhanced (Maquet et al.,
1996), they conceive of REMS as a program for exploring weak, novel cortical associations and
evaluating them in light of emotional input from the limbic system. This theory is compatible with
another from Jouvet, in which ponto-geniculo-occipital waves from the brainstem stimulate a
gene-mediated reprogramming of the dreaming brain, one which integrates cortical and genetic
influences, and which is encoded by the hippocampal theta rhythm, allowing genetic control of
psychological variability post-neurogenesis (Jouvet, 1998). Also compatible is the theory put
forward by Llewellyn and Hobson (2015), proposing that REMS creates spatial and associative
maps of emotionally salient landmarks through an exploratory “pre-play”. In all of these theories,
REMS brings out weak links that, while less correlated with the environment, hold the possibility
of high adaptive returns, be they mapmaking, creative problem solving or genetic control of
psychological variation. Inevitably, the reinforcement of weaker links entails the relative
depreciation of stronger ones. Existing connections drawn from experience may be weakened
as a result. Hence, REMS and its neural mechanisms, such as theta-gamma PAC, may be

27
detrimental to declarative memory consolidation, in favour of cortical exploration. In contrast,
NREMS and its distilling oscillatory mechanisms may eliminate weak links in favour of the strong
ones. In this way, REMS and NREMS would be analogous to the see-sawing opposition
between exploration and exploitation, respectively (see Cohen et al., 2007; Hills et al., 2015).
The exploration-exploitation trade-off (or the the stability-flexibility trade-off) is a problem
encountered in domains as varied as decision-making (Cohen et al., 2007), visual search (Wolfe
et al., 1989), fungal growth (Watkinson et al., 2005), and machine learning (Kaelbling et al.,
1996). Briefly, it asks how much of a limited resource (usually time) should be devoted to
exploiting known strategies, and how much should be devoted to exploring new, uncertain
strategies that may be more or less beneficial. The answer is nontrivial and usually involves a bit
of both (Cohen et al., 2007). In sleep, the limited resource at play may be memory, which we
may operationalize as the excitability of neural circuits. NREMS may devote memory (i.e.
excitability) to exploiting known information by stabilizing and abstracting daytime learning, while
REMS may sacrifice the stability of this information by diverting memory to stochastically
explored patterns of unknown (and potentially higher) value.
In discussing the human REMS theta rhythm, we have not addressed its source. In
animal studies, invasive techniques allow the reliable recording of a strong tonic hippocampal
theta rhythm in REMS (Montgomery et al., 2008; Scheffzük et al., 2011). In humans, ethical
considerations limit the invasive recording of subcortical structures to cases of intractable
epilepsy, so studies are few. Those that have recorded in the vicinity of the human hippocampus
during REMS have either found a weak phasic (~ 1s) theta (Cantero et al., 2003) or a strong,
tonic delta (Bódizs et al., 2001; Clemens et al., 2009). The latter finding, in conjunction with the
finding that the wavelength and the volumetric extent of an oscillation in the brain are correlated
(von Stein and Sarnthein, 2000), suggests that the hippocampal theta of ancestral mammals has
slowed in the course of human evolution, in step with increasing brain size (Bódizs et al., 2001;
Buzsáki et al., 2013; Jacobs, 2014). In addition, it is unclear whether an oscillation in the human
hippocampus can be detected at the scalp, and to complicate matters, there is evidence of
human neocortical theta sources (Kahana et al., 2001; Mitchell et al., 2008). Notably, frontal
midline theta recorded from the human scalp is associated with mnemonic and attentional
function, similar to hippocampal theta in rats. Notwithstanding these caveats, since the
hippocampus has widespread monosynaptic connections to the neocortex, and since scalp EEG
mostly detects the post-synaptic potentials of pyramidal neurons in the neocortex, and assuming
that low-frequency oscillations represent rhythmic volleys of postsynaptic excitation and
inhibition, it is possible that weak hippocampal oscillations can be indirectly measured on the
28
human scalp from their postsynaptic effects on pyramidal neurons. If this is the case, the low-
frequency phase-giving oscillations underlying the theta-gamma and delta-gamma PAC
detected in the present study could be the human homologue of hippocampal theta in non-
human animals. If not, these rhythms are then possibly of neocortical origin, although precise
localization of scalp EEG sources is complicated by the inverse problem (Koles, 1998; Mitchell
et al., 2008). The fact that we could not detect REMS PAC using power-triggered MI analysis
argues in favour of a low-power phase-giving rhythm at work. Furthermore, a learning-related
hippocampal theta-gamma PAC has been demonstrated in waking studies of humans using
intracranial EEG (Axmacher et al., 2010) and magnetoencephalography (Poch et al., 2010). We
may then envision delta/theta-gamma PAC as a mechanism for projecting neuronal activity into
space and time, with hippocampal theta/delta organizing neocortical gamma by its phase,
moulding it into a form that is available for recall as spatiotemporal, or episodic, memory—a
system which has been co-opted in humans for building a cognitive, associational space
(Buzsáki and Moser, 2014).
Nowhere did we detect a relationship between pre-sleep successful recall and
subsequent sleep CFC or oscillatory parameters (Model 3). Considered in juxtaposition with
effects of the learning task on CFC, this finding indicates that it is not successful recall-enabling
encoding, but exposure to a learning opportunity, which modulates sleep CFC. It may be that
participants encoded a similar number of declarative memories during the task, but that other
factors, such as competing cortical activation, affected their ability to recall pre-sleep. Later,
sleep CFC undertook the integration and consolidation of these memories, modulating their
“recallability” on the post-sleep test.
A complicating aspect of our results is that learning effects on PAC were detected at Cz,
whereas our strongest predictions of recall came from PAC at Fz. It should be noted that we
applied the comodulogram analysis only to Cz; therefore, it may be that an Fz comodulogram
would reveal a learning-related increase corresponding to the predictive PAC. Another
inconsistency is that we detected a learning-related delta-sigma PAC increase at Cz with a priori
bands, but not with the comodulogram. The explanation may lie in the lower limit of the
comodulogram set at 0.83 Hz (adapted frequency), whereas the lower limit of the a priori delta
band was 0.25 Hz; thus, the strongest PAC increase may have been at phase band 0.25-0.83
Hz. Also, the analysis epochs were much longer in the comodulogram (several minutes) than in
the a priori analysis (30 s), so that the analyses are detecting different scales of PAC. It may be
that the phase of delta-sigma PAC is less consistent in longer durations. However, the coupling
phase analysis seems to show a consistency (Fig. 16). Lastly, the comodulogram used delta

29
adapted bands, extrapolated from individual sigma peaks. It may be that this individual
adjustment is not suitable for delta waves.
Limitations
Some methodological limitations of this study warrant mention. Firstly, the limited size of
our participant sample (n=10) may have resulted in underpowered analyses. Next, as
mentioned just previously, our more stringent power-triggered MI analysis was ineffective. This
either means that there was in fact no effect to be found, or the power-triggered MI analysis is
inadequate for detecting the effect. Aru et al. (2015) state that PAC is meaningless without a
concomitant power rise in the phase-giving frequency. In our data, we detected spectral peaks in
both NREMS delta and REMS theta at the minutes scale, but were unable to show seconds-
scale rises in power concomitant with learning-related PAC changes. This may be explained by
the choice of analysis epochs for power-triggered analysis. Whereas in the a priori analysis we
applied the MI to 30-s epochs and then averaged, in the power-triggered analysis, we instead
concatenated all relevant signal before applying the MI, resulting in a signal several minutes
long. This was necessary, because the snippets of power-triggered signal were too short for
reliable PAC detection (Tort et al., 2010). However, the concatenation of non-consecutive
sections of signal introduced artificial non-stationarities, which may have biased the MI (Aru et
al., 2015). Moreover, the MI underestimates PAC if there are fluctuations in coupling phase
throughout the signal, and this risk escalates with prolonged signal duration. This last caveat is
less an issue than it is a qualification of our PAC data: what we have measured is the consistent
biasing, to a certain coupling phase or phases, of amplitude variations in one signal by the
phase of another, on the scale of minutes and not seconds. The same concatenation method
was used in the comodulogram analysis, but for all signal for the relevant stage, creating even
longer signals (tens of minutes). Differences in MI analysis epochs may thus explain
discrepancies between the a priori, power-triggered and comodulogram analyses, which are
measuring small (30 s), medium (>1 min) and large-scale (>10 min) PAC, respectively.
Next, the comodulogram analysis presented some issues. First, as mentioned previously,
the dynamic bandwidth employed for the amplitude frequency axis afforded progressively
sparser coverage as the amplitude- to phase-frequency ratio increased. Since PAC has often
been detected in low-to-high frequency ranges (Clemens et al., 2009; Amiri et al., 2016), this
feature of the comodulogram was perhaps ill-suited. On the other hand, the dynamic bandwidth
had the advantage of controlling for changes in phase-frequency-to-amplitude-bandwidth ratio
that could bias PAC magnitude (Aru et al., 2015). Still, an improved comodulogram could impose

30
a lower limit on the dynamic amplitude band, to ensure that all amplitude frequencies are
captured for each phase frequency band. The sparseness in the present comodulogram may
explain why the effect of learning on delta-sigma PAC detected using a priori bands was not
replicated in the comodulogram.
Previous studies employing the MI for PAC detection often used surrogate data
comparisons to determine the statistical significance of PAC (Tort et al., 2010). Since we were
interested in PAC differences and correlations, we did not deem this procedure necessary.
Because of this, we cannot ascertain that the PAC values we report are greater than what may
have arisen from the signal by chance. Also, we cannot determine whether a detected PAC
difference is due to increased synchronization in one condition or desynchronization in the other.
Likewise, for PAC correlations, we cannot determine whether variation is due to magnitude
changes or quantum changes in the presence of statistically significant PAC.
Lastly, we evaluated oscillatory parameters by averaging over all sleep cycles, whereas
our findings for NREMS PAC were in the first cycle only. A more faithful comparison of the
influences of PAC and oscillatory parameters would take all measurements from the same
period.
Next steps
We are now working to complement these analyses. Four more participants have been recorded
and will be added to the sample for all analyses. In addition to implementing improvements in
the method that were proposed in the previous section, we will extend our comodulogram
analysis to Fz, to determine whether PAC correlations with learning at this derivation are
accompanied by learning-related increases. Further, we will correlate learning-related changes
in PAC from the comodulograms ad hoc with memory performance. It will be interesting to test
the prediction that theta-gamma PAC in NREMS is negatively correlated with declarative
memory performance. In addition, we will extend our analyses to other scalp derivations. Finally,
we will perform additional analyses matching those of Gais et al. (2002), Schabus et al. (2004),
Fogel et al. (2007), Mölle et al. (2009), Cox et al. (2012) and Niknazar et al. (2015), in order to
better replicate their studies.
Concluding remarks
We have provided strong support for the prediction that the temporal organization of SWs
and spindles reflects effective sleep-dependent consolidation of declarative memories (Staresina
et al., 2015). Furthermore, we have demonstrated a novel, detrimental effect of REMS theta-

31
gamma PAC on declarative memory consolidation, one which may illuminate the elusive role of
this paradoxical sleep stage. While NREMS may integrate new memories from waking activity
into prior knowledge networks and make them available for recall, REMS may instead
recombine these memories in creative and adaptive ways, at the cost of recall efficiency. To put
it in familiar terms, if life is a research project, waking is data collection, NREMS is analysis, and
REMS is speculation (with the occasional emotional bias). The two states of mammalian sleep
may operate as opponent processes, nightly striving for the optimum between cortical
exploration and exploitation (see Cohen et al., 2007; Hills et al., 2015).
The adaptive benefit of REMS may have dwindled in humans as a result of the rapid
expansion of the neocortex and its creative prowess, so that this vigilance state may now be a
mere vestige; indeed, it is not missed when abolished by antidepressants or other drugs (Vogel
et al., 1990). Incidentally, in light of the preceding discussion, it may be worthwhile to examine
whether the benefit of REMS deprivation for ameliorating depression is due to an abolishment of
theta-gamma PAC-mediated memory formation during REMS. It may be that in some forms of
major depression, negative emotionality of cortical (Wagner et al., 2001; Nishida et al., 2009) or
genetic origin (Jouvet, 1998) invades the brain in REMS and through theta-mediated encoding,
primes the waking brain for depression, in a vicious cycle. Cannabis has been shown to disrupt
hippocampal theta and theta-gamma PAC in the hippocampus (Robbe et al., 2006; Robbe and
Buzsáki, 2009), and could assist in an informative test of this hypothesis.
To reiterate, electrical activity is segregated in space and time in the mammalian brain.
From the foregoing discussion, we may posit that temporal segregation in fact encodes both
space and time. Awake, and perhaps during REMS, perceptions and emotions are at once
parsed into moments and situated along spatiotemporal dimensions by a slow hippocampal
rhythm. Asleep, NREMS spontaneous activity relives these moments one at a time through the
lens of knowledge, enveloping them in a hierarchy of waves to preserve the partition of where
and when.

32
References
Amiri M, Frauscher B, Gotman J (2016) Phase-amplitude coupling is elevated in deep sleep and
in the onset zone of focal epileptic seizures. Front Hum Neurosci 10:1-12.
Aru J, Aru J, Priesemann V, Wibral M, Lana L, Pipa G, Singer W, Vicente R (2015) Untangling
cross-frequency coupling in neuroscience. Curr Opin Neurobiol 31:51-61.
Axmacher N, Elger CE, Fell J (2008) Ripples in the medial temporal lobe are relevant
for human memory consolidation. Brain 131:1806-1817.
Axmacher N, Henseler MM, Jensen O, Weinreich I, Elger CE, Fell J (2010) Cross-frequency
coupling supports multi-item working memory in the human hippocampus. PNAS 107:3228-
3233.
Ayoub A, Mölle M, Preissl H, Born J (2012) Grouping of MEG gamma oscillations by EEG sleep
spindles. Neuroimage 59:1491-1500.
Bódizs R, Kántor S, Szabó G, Szûcs A, Erôss L, Halász P (2001) Rhythmic hippocampal slow
oscillation characterizes REM sleep in humans. Hippocampus 11:747-753.
Boyce R, Glasgow SD, Williams S, Adamantidis A (2016) Causal evidence for the role of REM
sleep theta rhythm in contextual memory consolidation. Science 352:812-816.
Brankačk J, Scheffzük C, Kukushka VI, Vyssotski AI, Tort ABL, Draguhn A (2012) Distinct
features of fast oscillations in phasic and tonic rapid eye movement sleep. J Sleep Res 21:630-
633.
Buzsáki G (1989) Two-stage model of memory trace formation: A role for “noisy” brain states.
Neuroscience 31:551-570.
Buzsáki G (1996) The hippocampo-neocortical dialogue. Cereb Cortex 6:81-92.
Buzsáki G (2006) Rhythms of the Brain. New York: Oxford UP.

33
Buzsáki G (2010) Neural syntax: cell assemblies, synapsembles and readers. Neuron 68:362-
385.
Buzsáki G, Draguhn A (2004) Neuronal oscillations in cortical networks. Science 304:1926-1929.
Buzsáki G, Logothetis N, Singer W (2013) Scaling brain size, keeping time: Evolutionary
preservation of brain rhythms. Neuron 80:751-764.
Buzsáki G, Mizuseki K (2014) The log-dynamic brain: how skewed distributions affect network
operations. Nat Rev Neurosci 15:264-278.
Buzsáki G, Moser E (2014) Memory, navigation and theta-rhythm in the hippocampal-entorhinal
system. Nat Neurosci 16:130-138.
Canolty RT, Edwards E, Dalal SS, Soltani M, Nagarajan SS, Kirsch HE, Berger MS, Barbaro
NM, Knight RT (2006) High gamma power is phase-locked to theta oscillations in human
neocortex. Science 313: 1626-1628.
Canolty RT, Knight RT (2010) The functional role of cross-frequency coupling. Trends Cogn Sci
14:506-515.
Cantero JL, Atienza M, Stickgold R, Kahana MJ, Madsen JR, Kocsis B (2003) Sleep-dependent
θ oscillations in the human hippocampus and neocortex. J Neurosci 23:10897-10903.
Clemens Z, Mölle M, Erôss L, Barsi P, Halász P, Born J (2007) Temporal coupling of
parahippocampal ripples, sleep spindles and slow oscillations in humans. Brain 130:2868-2878.
Clemens Z, Weiss B, Szûcs A, Erôss L, Rásonyi G, Halász P (2009) Phase coupling between
rhythmic slow activity and gamma characteristizes mesiotemporal rapid-eye-movement sleep in
humans. Neuroscience 163:388-396.
Cohen J, McClure SM, Yu AJ (2007) Should I stay or should I go? How the human brain
manages the trade-off between exploitation and exploration. Philos Trans R Soc Lond B: Biol
Sci 362:933-942.

34
Contreras D, Steriade M (1995) Cellular basis of EEG slow rhythms: A study of dynamic
corticothalamic relationships. J Neurosci 15:604-622.
Contreras D, Steriade M (1996) Spindle oscillations in cats: the role of corticothalamic feedback
in a thalamically generated rhythm. J Physiol 490:159-179.i
Cox R, Hofman WF, Talamini LM (2012) Involvement of spindles in memory consolidation is
slow wave sleep-specific. Learn Memory 19:264–267.
Diekelmann S, Born J (2010) The memory function of sleep. Nature 11:114-126.
Engel AK, Gerloff C, Hilgetag CC, Nolte G (2013) Intrinsic of coupling modes: Multiscale
interactions in ongoing brain activity. Neuron 80:867-886.
Eschenko O, Ramadan W, Mölle M, Born J, Sara SJ (2008) Sustained increase in hippocampal
sharp-wave ripple activity during slow-wave sleep after learning. Learn Memory 15:222-228.
Fell J, Fernández G, Lutz MT, Kockelman E, Burr W, Schaller C, Elger CE, Helmstaedter C
(2006) Rhinal-hippocampal connectivity determines memory formation during sleep. Brain
129:108-114.
Finelli LA, Achermann P, Borbély AA (2001) Individual ‘fingerprints’ in human sleep EEG
topography. Nature 25:S57-S62.
Fogel SM, Smith CT, Cote KA (2007) Dissociable learningdependent changes in REM and
nonREM sleep in declarative and procedural memory systems. Behav Brain Res 180:48–61.
Fries P (2005) A mechanism for cognitive dynamics: neuronal communication through neuronal
coherence. Trends Cogn Sci 9:474-480.
Gais S, Mölle M, Helms K, Born J (2002) Learning-dependent increases in sleep spindle density.
J Neurosci 22:6830-6834.

35
Girardeau G, Benchenane K, Wiener SI, Buzsáki G, Zugaro MB (2009) Selective suppression of
hippocampal ripples impairs spatial memory. Nat Neurosci 12:1222-1223.
Gupta AS, van der Meer MAA, Touretzky DS, Redish AD (2010) Hippocampal replay is not a
simple function of experience. Neuron 65:695-705.
Hasenstaub A, Shu Y, Haider B, Kraushaar U, Duque A, McCormick DA (2005) Inhibitory
postsynaptic potentials carry synchronized frequency information in active cortical networks.
Neuron 47:423-435.
Hills TT, Todd PM, Lazer D, Redish AD, Couzin ID, the Cognitive Search Research Group
(2015) Exploration versus exploitation in space, mind and society. Trends Cogn Sci 19:46-54.
Huber R, Ghilardi F, Massimini M, Tononi G (2004). Local sleep and learning. Nature 430:78-81.
Iber C, Ancoli-Israel S, Chesson AL, Quan SF (2007) The AASM manual for the scoring of sleep
and associated events. Westchester, IL: American Academy of Sleep Medicine.
Isomura Y, Sirota A, Özen S, Montgomery S, Mizuseki K, Henze DA, Buzsáki G (2006)
Integration and segregation of activity in entorhinal-hippocampal subregions by neocortical slow
oscillations. Neuron 52:871-882.
Jacobs J (2014) Hippocampal theta oscillations are slower in humans than in rodents:
implications for models of spatial navigation and memory. Philos T R Soc B 369: 1-9.
Jacobs J, Kahana MJ, Ekstrom AD, Fried I (2007) Brain oscillations control timing of single
neuron activity in humans. J Neurosci 27:3839-3844.
Jensen O (2006) Maintenance of multiple working memory items by temporal segmentation.
Neuroscience 139:237-249.
Jensen O, Colgin LL (2007) Cross-frequency coupling between neuronal oscillations. Trends
Cogn Sci 11:267-269.

36
Jouvet M (1998) Paradoxical sleep as a programming system. J Sleep Res 7:1-5.
Kaelbling LP, Littman ML, Moore AW (1996) Reinforcement learning: a survey. J Artif Intell Res
4:237-285.
Kahana MJ, Seelig D, Madsen JR (2001) Theta returns. Curr Op Neurobiol 11:739-744.
Kaplan R, Bush D, Bonnefond M, Bandettini PA, Barnes GR, Doeller CF, Burgess N (2014)
Medial prefrontal theta phase coupling during spatial memory retrieval. Hippocampus 24:656-
665.
Klinzing JG, Mölle M, Weber F, Supp G, Hipp JF, Engel AK, Born J (2016) Spindle acivity
phase-locked to sleep slow oscillations. Neuroimage 134:607-616.
Koles ZJ (1998) Trends in EEG source localization. EEG Clin Neurophysiol 196:127-137.
Lega B, Burke J, Jacobs J, Kahana MJ (2014) Slow-theta-to-gamma phase-amplitude coupling
in hippocampus supports the formation of new episodic memories. Cereb Cortex: bhu232.
Leopold DA, Murayama Y, Logothetis NK (2003) Very slow activity fluctuations in monkey visual
cortex: Implications for functional brain imaging. Cereb Cortex 13:422-433.
Lewis PA, Durrant SJ (2011) Overlapping memory replay during sleep builds cognitive schema.
Trends in Cogn Sci 15:343-351.
Llewellyn S, Hobson JA (2015) Not only… but also: REM sleep creates and NREM stage 2
instantiates landmark junctions in cortical memory networks. Neurobiol Learn Mem 122:69-87.
Maquet P, Péters JM, Aerts J, Delfiore G, Degueldre C, Luxen A, Franck G (1996) Functional
neuroanatomy of human rapid-eye-movement sleep and dreaming. Nature 383:163-166.
Marshall L, Helgadóttir H, Mölle M, Born J (2006) Boosting slow oscillations during sleep
potentiates memory. Nature 444:610-613.

37
Marshall L, Kirov R, Brade J, Mölle M, Born J (2011) Transcranial electrical currents to probe
EEG brain rhythms and memory consolidation during sleep in humans. Plos One 6:1-10.
Mednick SC, McDevitt EA, Walsh JK, Wamsley E, Paulus M, Kanady JC, Drummond SPA
(2013) The critical role of sleep spindles in hippocampal-dependent memory: a pharmacology
study. J Neurosci 33:4494-4504.
Mitchell DJ, McNaughton N, Flanagan D, Kirk IJ (2008) Frontal-midline theta from the
perspective of hippocampal “theta”. Prog Neurobiol 86:156-185.
Mölle M, Bergmann TO, Marshall L, Born J (2011) Fast and slow spindles during the sleep slow
oscillation: Disparate coalescence and engagement in memory processing. Sleep 34:1411-
1421D.
Mölle M, Eschenko O, Gais S, Sara SJ, Born J (2009) The influence of learning on sleep slow
oscillations and associated spindles and ripples in humans and rats. Eur J Neurosci 29:1071-
1081.
Mölle M, Marshall L, Gais S, Born J (2002) Grouping of spindle activity during slow oscillations in
human non-rapid eye movement sleep. J Neurosci 22:10941-10947.
Montgomery SM, Sirota A, Buzsáki G (2008) Theta and gamma coordination of hippocampal
networks during waking and REM sleep. J Neurosci 28:6731-6741.
Moroni F, Nobili L, Curcio G, De Carli F, Tempesta D, Marzano C, De Gennaro L, Mai R,
Francione S, Lo Russo G, Ferrara G (2008) Procedural learning and sleep hippocampal low
frequencies in humans. Neuroimage 42:911-918.
Nere A, Hashmi A, Cirelli C, Tononi G (2013) Sleep-dependent synaptic down-selection (I):
modeling the benefits of sleep on memory consolidation and integration. Front Neurol 4:1-17.
New B, Pallier C, Ferrand L, Matos R (2001) Une base de données lexicales du français
contemporain sur internet: LEXIQUE. Ann Psychol 101:447-462.

38
Ngo HVV, Martinetz T, Born J, Mölle M (2013) Auditory closed-loop stimulation of the sleep slow
oscillation enhances memory. Neuron 78:545-553.
Niknazar M, Krishnan GP, Bazhenov M, Mednick SC (2015) Coupling of thalamocortical sleep
oscillations are important for memory consolidation in humans. Plos One 10:e1044720.
Nishida M, Pearsall J, Buckner RL, Walker MP (2009) REM sleep, prefrontal theta, and the
consolidation of human emotional memory. Cereb Cortex 19:1158–1166.
Nunez, PL (1981) Electric fields of the brain. New York: Oxford UP.
O’Keefe J, Recce ML (1993) Phase relationship between hippocampal place units and the EEG
theta rhythm. Hippocampus 3:317-330.
Osipova D, Takashima A, Oostenveld R, Fernández G, Maris E, Jensen O (2008) Theta and
gamma oscillations predict encoding and retrieval of declarative memory. J Neurosci 26:7523-
7531.
Peyrache A, Battaglia FP, Destexhe A (2011) Inhibition recruitment in prefrontal cortex during
sleep spindles and gating of hippocampal inputs. PNAS 108:17207-17212.
Piantoni G, Astill RG, Raymann RJEM, Vis JC, Coppens JE, Van Someren EJW (2013)
Modulation of gamma and spindle-range power by slow oscillations in scalp sleep EEG of
children. Int J Psychophysiol 89:252-258.
Plihal W, Born J (1997) Effects of early and late nocturnal sleep on declarative and procedural
memory. J Cogn Neurosci 9:534-547.
Poch C, Fuentemilla L, Barnes GR, Düzel E (2010) Hippocampal theta-phase modulation of
replay correlates with configural-relational short-term memory performance. J Neurosci 31:7038-
7042.
Poe GR, Walsh CM, Bjorness TE (2010) Cognitive neuroscience of sleep. Prog Brain Res
185:1-19.

39
Rasch B, Born J (2013) About sleep’s role in memory. Physiol Rev 93:681-766.
Robbe D, Buzsáki G (2009) Alteration of theta timescale dynamics of hippocampal place cells by
a cannabinoid is associated with memory impairment. J Neurosci 29:12597-12605.
Robbe D, Montgomery SM, Thome A, Rueda-Orozco PE, McNaughton BL, Buzsáki G (2006)
Cannabinoids reveal the importance of spike timing coordination in hippocampal function. Nat
Neurosci 9:1526-1533.
Sauseng P, Klimesch W, Heise KF, Gruber WR, Holz E, Karim AA, Glennon M, Gerloff C,
Birbaumer N, Hummel FC (2009) Brain oscillatory substrates of visual short-term memory
capacity. Curr Biol 19:1846-1852.
Schabus M, Gruber G, Parapatics S, Sauter C, Klösch G, Anderer P, Klimesch W, Saletu B,
Zeitlhofer J (2004) Sleep spindles and their significance for declarative memory consolidation.
Sleep 27:1479-1485.
Scheffer-Teixeira R, Belchior H, Caixeta FV, Souza BC, Ribeiro S, Tort ABL (2011) Theta phase
modulates multiple layer-specific oscillations in the CA1 region. Cereb Cortex 22:2404-2414.
Scheffzük C, Kukushka VI, Vyssotski AL, Draguhn A, Tort ABL, Brankačk J (2011) Selective
coupling between theta phase and neocortical fast gamma oscillations during REM-sleep in
mice. Plos One 6:1-9.
Shirvalkar PR, Rapp PR, Shapiro ML (2009) Bidirectional changes to hippocampal theta–
gamma comodulation predict memory for recent spatial episodes. PNAS 107:7054-7059.
Siegel JM (2001) The REM sleep-memory consolidation hypothesis. Science 294:1058-1063.
Siegel JM (2005) Clues to the function of mammalian sleep. Nature 437:1264-1271.
Sirota A, Csicsvari J, Buhl D, Buzsáki G (2003) Communication between neocortex and
hippocampus during sleep in rodents. PNAS 100:2065-2069.

40
Soltesz I, Deschênes M (1993) Low- and high-frequency membrane potential oscillations during
theta activity in CA1 and CA3 pyramidal neurons of the rat hippocampus under ketamine-
xylazine anesthesia. J Neurophysiol 70:97-116.
Staresina BP, Bergmann TO, Bonnefond M, van der Meij R, Jensen O, Deuker L, Elger CE,
Axmacher N, Fell J (2015) Hierarchical nesting of slow oscillations, spindles and ripples in the
human hippocampus during sleep. Nat Neurosci 18:1679–1686.
Staudigl T, Hanslmayr S (2013) Theta oscillations at encoding mediate the context-dependent
nature of human episodic memory. Curr Biol 23:1101-1106.
Steriade, M (2006) Grouping of brain rhythms in corticothalamic systems. Neuroscience
137:1087-1106.
Steriade M, McCormick DA, Sejnowski TJ (1993) Thalamocortical oscillations in the sleeping
and aroused brain. Science 262:679-685.
Stickgold R, Hobson JA, Fosse R, Fosse M (2001) Sleep, learning, and dreams: off-line memory
reprocessing. Science 294:1052-1057.
Stickgold R, Walker MP (2013) Sleep-dependent memory triage: evolving generalization through
selective processing. Nature Neurosci 16:139-145.
Sweeney-Reed CM, Zaehle T, Voges J, Schmitt FC, Buentjen L, Kopitzki K, Esslinger C,
Hinrichs H, Heinze HJ, Knight RT, Richardson-Klavehn A (2014) Corticothalamic phase
synchrony and cross-frequency coupling predict human memory formation. Elife 3:e05352.
Takeuchi S, Murai R, Shimazu H, Isomura Y, Mima T, Tsujimoto T (2016) Spatiotemporal
organization and cross-frequency coupling of sleep spindles in primate cerebral cortex. Sleep
39:1719-1735.
Tinguely G, Finelli LA, Landolt HP, Borbély AA, Achermann P (2006) Functional EEG
topography in sleep and waking: state-dependent and state-independent features. Neuroimage
32:283-292.

41
Tort ABL, Komorowski R, Eichenbaum H, Kopell N (2010) Measuring phase-amplitude coupling
between neuronal oscillations of different frequencies. J Neurophysiol 104:1195-1210.
Tort ABL, Komorowski R, Manns JR, Kopell N, Eichenbaum H (2009) Theta-gamma coupling
increases during the learning of item-context associations. PNAS 106:20942-20947.
Tononi G, Cirelli C (2006) Sleep function and synaptic homeostasis. Sleep Med Rev 10:49-62.
Tononi G, Cirelli C (2014) Sleep and the price of plasticity: from synaptic and cellular
homeostasis to memory consolidation and integration. Neuron 81:12-34.
Tononi G, Sporns O, Edelman G (1996) A complexity measure for selective matching of signals
by the brain. PNAS 93:3422-3427.
Varela F, Lachaux JP, Rodriguez E, Martinerie J (2001) The brain web: phase synchronization
and large-scale integration. Nat Rev Neurosci 2:229-239.
Vertes RP (2004) Memory consolidation in sleep: Dream or reality. Neuron 44:135-148.
Vogel GW, Buffenstein A, Minter K, Hennessey A (1990) Drug effects on REM sleep and on
endogenous depression. Neurosci Biobeh Rev 14:49-63.
von Stein A, Sarnthein J (2000) Different frequencies for different scales of cortical integration:
from local gamma to long range alpha theta synchronization. Intl J Psychophysiol 38:301-313.
Wagner U, Gais S, Born J (2001) Emotional memory formation is enhancedacross sleep
intervals with high amounts of rapid eye movement sleep. Learn Memory 8:112-119.
Walker MP, Stickgold R (2004) Sleep-dependent learning and memory consolidation. Neuron
44:121-133.
Watkinson SC, Boddy L, Burton K, Darrah PR, Eastwood D, Fricker MD, Tlalka M (2005) New
approaches to investigating the function of mycelial networks. Mycologist 19:11–17.

42
Wilson MA, McNaughton BL (1994) Reactivation of hippocampal ensemble memories during
sleep. Science 265:676-679.
Wolfe JM, Cave KR, Franzel SL (1989) Guided search: an alternative to the feature integration
model for visual search. J Exp Psychol Hum Percept Perform 15:419-433.
Zerouali Y, Lina JM, Sekerovic Z, Godbout J, Dubé J, Jolicoeur P, Carrier J (2014) A time-
frequency analysis of the dynamics of cortical networks of sleep spindles from MEG-EEG
recordings. Front Neurosci 8:1-13.

43
Tables
Table 1
Participant characteristics (N = 10)
Characteristics Mean (SD) Range
Age 23.3 (3.2) 19-30
Years of education 15.9 (2.0) 12-18
CES-D 7.1 (4.8) 1-15
PSQI 2.8 (1.3) 1-4
MEQ-SA 53.4 (8.5) 38-68
ESS 4.8 (2.1) 2-7
ISI 3.4 (2.2) 0-6
BDI 1.8 (2.3) 0-5
BAI 2.0 (4.1) 0-13
EHI 0.66 (0.27) 0.33-1.00
Note. BAI, Beck anxiety inventory; BDI, Beck’s depression inventory; CES-D, Centre for
Epidemiological Studies – Depression screening; EHI, Edinburgh handedness inventory; ESS,
Epworth sleepiness scale; ISI, insomnia severity index; MEQ-SA, morningness-eveningness
questionnaire – self-assessment version; PSQI, Pittsburgh sleep quality index.

44
Table 2
Sleep parameters on experimental nights (N = 10)
Parameters Control,
M (SD)
Learning,
M (SD)
F P
Total sleep time (min) 379.00 (91.29) 393.00 (65.10) 0.62 0.81
WASO (min) 14.25 (12.82) 21.20 (37.44) 1.14 0.32
Sleep onset latency (min) 7.35 (9.01) 19.30 (30.41) 0.24 0.64
Sleep efficiency (%) 93.72 (3.87) 88.80 (9.96) 0.11 0.75
Stage N1 (% of TST) 3.63 (2.11) 3.97 (4.23) 0.23 0.65
Stage N2 (% of TST) 44.12 (8.04) 43.23 (10.59) 0.59 0.47
Stage N3 (% of TST) 28.27 (10.77) 29.87 (11.07) 0.05 0.83
Stage REMS (% of TST) 23.90 (5.82) 22.25 (4.51) 0.33 0.58
1st NREMS period (min) 79.00 (24.73) 68.25 (13.33) 2.55 0.15
Note. F-statistic and p-value are for main effect in ANCOVA with control and learning nights as
repeated measures and age as covariate. TST, total sleep time WASO, wake after sleep onset;.

45
Table 3
Learning task performance by participant
Participant Pre-sleep score (%) Post-sleep score (%) Change (% of total)
1 50 (41.7) 47 (39.2) -3 (-2.5)
2 55 (45.8) 55 (45.8) 0 (0)
3 38 (31.7) 32 (26.7) -6 (-5.0)
4 35 (29.2) 36 (30.0) 1 (0.83)
5 87 (72.5) 90 (75.0) 3 (2.5)
6 115 (95.8) 116 (96.7) 1 (0.83)
7 49 (40.8) 50 (41.7) 1 (0.83)
8 100 (83.3) 100 (83.3) 0 (0)
9 9 (7.5) 10 (8.3) 1 (0.83)
10 47 (39.2) 43 (35.8) -4 (-3.3)
Mean 59.8 (49.8) 59.6 (49.6) -0.22 (-0.19)
Note. The absolute number of word pairs recalled are shown, with percentages out of the total of
120 word pairs indicated in parentheses.

46
Table 4
Comparison of NREMS oscillatory parameters on experimental nights (N = 10)
Parameters Fz Cz
Control
M (SD)
Learning
M (SD)
F P Control
M (SD)
Learning
M (SD)
F P
Slow wave
Density 1.89
(1.51)
1.84
(1.29)
0.001 1.00 1.18
(0.92)
1.45
(0.86)
3.15 0.11
Duration (s) 1.25
(0.18)
1.26
(0.24)
1.16 0.31 1.28
(0.24)
1.31
(0.25)
0.99 0.35
RMS (μV) 66.70
(6.61)
68.07
(7.93)
5.37 0.049* 64.10
(5.85)
65.93†
(7.17)
2.57 0.15
Amplitude (μV) 200
(17.6)
201
(19.7)
5.29 0.050 194
(14.8)
197‡
(15.6)
0.99 0.35
Delta power,
normalized (%)
85.94
(3.19)
85.34
(4.15)
1.57 0.25 82.95
(3.91)
83.68
(3.99)
1.39 0.27
Spindle
Density 1.47
(0.21)
1.45
(0.26)
0.008 0.93 1.69
(0.18)
1.65
(0.27)
0.74 0.41
Duration (s) 0.80
(0.03)
0.81
(0.05)
1.51 0.25 0.81
(0.04)
0.82
(0.05)
0.14 0.72
RMS (μV) 8.65
(2.38)
8.46
(2.88)
1.33 0.28 9.49
(2.88)
8.68
(2.76)
1.27 0.29
Sigma power,
normalized (%)
1.04
(0.68)
1.10
(0.94)
1.02 0.34 1.43
(0.85)
1.18
(0.84)
3.41 0.10
Note. F-statistic and p-value are for the main effect in ANCOVA with control and learning nights
as repeated measures and age as covariate. Spindle and SW parameters are for all N2 and N3
epochs. M, mean; RMS, root-mean-square; SD, standard deviation. *p < 0.05

47
Table 5
Comparison of REMS oscillatory parameters on experimental nights (N = 10)
Parameters Fz Cz
Control
M (SD)
Learning
M (SD)
F P Control
M (SD)
Learning
M (SD)
F P
Delta train
Density 2.51
(0.78)
2.79
(0.39)
1.68 0.23 2.73
(0.79)
2.90
(0.34)
0.97 0.36
Duration (s) 0.91
(0.08)
0.87
(0.03)
2.14 0.18 0.92
(0.09)
0.89
(0.04)
1.37 0.28
RMS (μV) 28.44
(12.71)
25.15
(8.12)
0.16 0.70 29.88
(11.41)
28.76
(12.83)
0.12 0.92
Delta power,
normalized (%)
19.57
(4.47)
18.08
(4.90)
2.95 0.12 21.23
(5.85)
18.01
(6.10)
5.39 0.049
Theta train
Density 1.56
(0.28)
1.73
(0.23)
0.94 0.36 1.68
(0.21)
1.75
(0.26)
0.04 0.84
Duration (s) 0.82
(0.06)
0.82†
(0.07)
0.24 0.64 0.81
(0.04)
0.80
(0.04)
2.39 0.16
RMS (μV) 35.71
(20.61)
31.29
(10.17)
0.10 0.76 37.20
(16.76)
35.29
(12.34)
<0.001 1.00
Theta power,
normalized (%)
10.48
(3.63)
9.95
(4.08)
2.19 0.18 13.04
(5.99)
11.54
(6.89)
1.23 0.30
Gamma power,
normalized (%)
2.89
(2.36)
1.81
(1.13)
0.04 0.85 3.16
(2.38)
1.84
(1.03)
0.24 0.64
Note. F-statistic and p-value are for the main effect in ANCOVA with control and learning nights
as repeated measures and age as covariate. Delta, theta and gamma parameters are for all
REMS epochs. M, mean; RMS, root-mean-square; SD, standard deviation. †Predicted by pre-
sleep performance on learning task and age (F = 8.17, R2 = 0.70, b = 0.22, SEb = 0.06, β = 0.83,
p = 0.015).
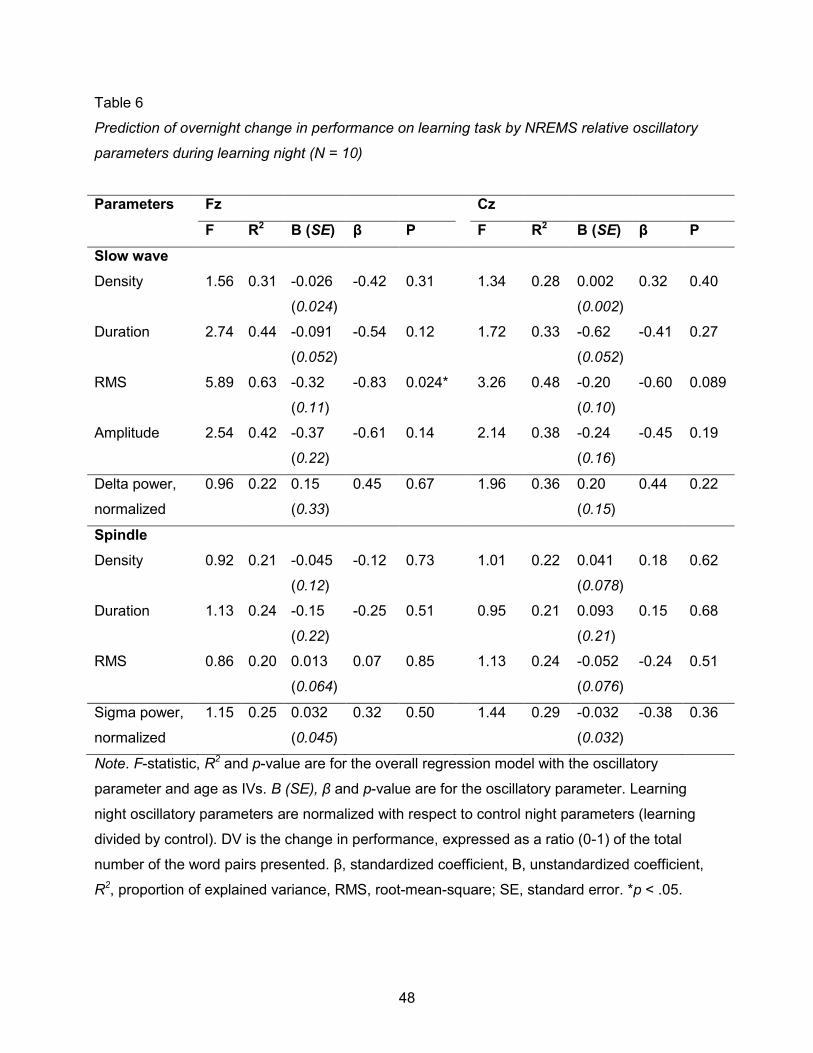
48
Table 6
Prediction of overnight change in performance on learning task by NREMS relative oscillatory
parameters during learning night (N = 10)
Parameters Fz Cz
F R2 B (SE) β P F R2 B (SE) β P
Slow wave
Density 1.56 0.31 -0.026
(0.024)
-0.42 0.31 1.34 0.28 0.002
(0.002)
0.32 0.40
Duration 2.74 0.44 -0.091
(0.052)
-0.54 0.12 1.72 0.33 -0.62
(0.052)
-0.41 0.27
RMS 5.89 0.63 -0.32
(0.11)
-0.83 0.024* 3.26 0.48 -0.20
(0.10)
-0.60 0.089
Amplitude 2.54 0.42 -0.37
(0.22)
-0.61 0.14 2.14 0.38 -0.24
(0.16)
-0.45 0.19
Delta power,
normalized
0.96 0.22 0.15
(0.33)
0.45 0.67 1.96 0.36 0.20
(0.15)
0.44 0.22
Spindle
Density 0.92 0.21 -0.045
(0.12)
-0.12 0.73 1.01 0.22 0.041
(0.078)
0.18 0.62
Duration 1.13 0.24 -0.15
(0.22)
-0.25 0.51 0.95 0.21 0.093
(0.21)
0.15 0.68
RMS 0.86 0.20 0.013
(0.064)
0.07 0.85 1.13 0.24 -0.052
(0.076)
-0.24 0.51
Sigma power,
normalized
1.15 0.25 0.032
(0.045)
0.32 0.50 1.44
0.29 -0.032
(0.032)
-0.38 0.36
Note. F-statistic, R2 and p-value are for the overall regression model with the oscillatory
parameter and age as IVs. B (SE), β and p-value are for the oscillatory parameter. Learning
night oscillatory parameters are normalized with respect to control night parameters (learning
divided by control). DV is the change in performance, expressed as a ratio (0-1) of the total
number of the word pairs presented. β, standardized coefficient, B, unstandardized coefficient,
R2, proportion of explained variance, RMS, root-mean-square; SE, standard error. *p < .05.

49
Table 7
Prediction of overnight change in performance on learning task by REMS relative oscillatory
parameters during learning night (N = 10)
Parameters Fz Cz
F R2 B (SE) β P F R2 B (SE) β P
Delta train
Density 4.50 0.56 -0.022
(0.009)
-0.70 0.045* 5.18 0.60 -0.019
(0.007)
-0.71 0.033*
Duration 2.28 0.40 0.17
(0.11)
0.48 0.17 2.94 0.46 0.16
(0.09)
0.54 0.11
RMS 2.72 0.44 0.19
(0.01)
0.50 0.13 4.99 0.60 0.041
(0.016)
0.64 0.036*
Delta power,
normalized
1.54 0.31 -0.033
(0.031)
-0.44 0.32 2.61 0.43 -0.047
(0.027)
-0.70 0.13
Theta train
Density 2.25 0.39 -0.032
(0.021)
-0.48 0.17 4.60 0.57 -0.062
(0.025)
-0.63 0.043*
Duration 0.93 0.21 0.049
(0.12)
0.14 0.70 1.66 0.32 0.17
(0.15)
0.41 0.29
RMS 3.15 0.48 0.023
(0.01)
0.53 0.095 3.73 0.52 0.026
(0.01)
0.57 0.067
Theta power,
normalized
1.75 0.33 -0.024
(0.015)
-0.47 0.26 2.29 0.17 -0.024
(0.016)
-0.52 0.17
Gamma
power,
normalized
3.02 0.46 -0.028
(0.015)
-0.52 0.10 1.06 0.23 -0.013
(0.021)
-0.20 0.57
Note. F-statistic, R2 and p-value are for the overall regression model with the oscillatory
parameter and age as IVs. B (SE), β and p-value are for the oscillatory parameter. Learning
night oscillatory parameters are normalized with respect to control night parameters (learning
divided by control). DV is the change in performance, expressed as a ratio (0-1) of the total
number of the word pairs presented. β, standardized coefficient, B, unstandardized coefficient,
R2, proportion of explained variance, RMS, root-mean-square; SE, standard error. *p < .05.

50
Table 8
Average oscillatory event density per 30-s epoch, by participant
Participant Slow wave Spindle Delta train Theta train
1 1.03 (0.41) 1.84 (0.11) 2.17 (1.40) 1.42 (0.49)
2 1.22 (0.08) 1.94 (0.13) 3.10 (0.67) 1.55 (0.11)
3 0.29 (0.08) 1.84 (0.22) 2.51 (0.24) 1.80 (0.18)
4 1.76 (0.15) 1.65 (0.11) 3.15 (0.22) 1.71 (0.10)
5 2.39 (1.71) 1.50 (0.20) 2.53 (0.58) 1.64 (0.18)
6 1.62 (0.36) 1.99 (0.09) 2.86 (0.23) 1.53 (0.14)
7 0.84 (0.30) 1.95 (0.17) 3.15 (0.35) 1.90 (0.14)
8 0.69 (0.23) 1.36 (0.29) 2.59 (0.27) 1.85 (0.23)
9 2.13 (0.59) 1.89 (0.07) 2.87 (0.51) 1.52 (0.15)
10 3.94 (0.75) 1.68 (0.10) 2.43 (0.21) 1.90 (0.10)
Mean (SD) 1.59 (1.05) 1.76 (0.21) 2.73 (0.34) 1.68 (0.18)
Note. Slow wave and spindle densities are for all N2 and N3 epochs. Delta and theta train
densities are for all REMS epochs. Means are presented, with SDs in parentheses.

51
Table 9
Comparison of MI on experimental nights (N = 10)
Band pair Fz Cz
Control
M (SD)
Learning
M (SD)
F P Control
M (SD)
Learning
M (SD)
F P
NREMS
δ - σ -5.69
(0.20)
-5.68
(0.20)
0.21 0.66 -5.59
(0.20)
-5.58
(0.20)
0.35 0.57
δ - σ, NP1 -5.80
(0.23)
-5.86
(0.26)
0.17 0.69 -5.70
(0.26)
-5.63
(0.22)
4.94 0.057
REMS
δ - γ -7.04
(0.41)
-7.07
(0.32)
0.94 0.36 -7.08
(0.40)
-7.13
(0.30)
1.99 0.20
θ - γ -7.71
(0.34)
-7.73
(0.35)
1.93 0.20 -7.80
(0.31)
-7.80
(0.30)
0.92 0.37
Note. F-statistic and p-value are for main effect in ANCOVA with control and learning nights as
repeated measures and age as covariate. MIs were log-transformed. γ, gamma (50-100 Hz); δ,
delta (0.25-4 Hz in NREMS; 1.5-3.5 Hz in REMS); θ, theta (3.5-8 Hz); σ, adapted sigma; M,
mean; MI, modulation index; NP1, NREMS period 1.

52
Table 10
Prediction of overnight change in performance on learning task by relative MI during learning
night (N = 10)
Band pair Fz Cz
F R2 B (SE) β P F R2 B (SE) β P
NREMS
δ - σ 1.81 0.34 0.34
(0.27)
0.39 0.25 0.85 0.20 0.37
(0.25)
0.051 0.89
δ - σ, NP1 11.42 0.77 0.51
(0.12)
0.77 0.004** 1.02 0.23 -0.13
(0.24)
-0.23 0.60
REMS
δ - γ 2.71 0.44 -0.32
(0.18)
-0.53 0.13 4.68 0.57 -0.35
(0.14)
-0.70 0.041*
θ - γ 8.91 0.72 -0.47
(0.13)
-0.82 0.009** 2.23 0.39 -0.24
(0.16)
-0.47 0.18
Note. F-statistic, R2 and p-value are for the overall regression model with MI and age as IVs. B
(SE), β and p-value are for the MI. Learning night MI was log-transformed, then normalized with
respect to control night log MI (learning divided by control). DV is the change in performance,
expressed as a ratio (0-1) of the absolute pre-to-post change in the number of word pairs
recalled over the total number of the word pairs presented. β, standardized coefficient γ, gamma
(50-100 Hz); δ, delta (0.25-4 Hz in NREMS; 1.5-3.5 Hz in REMS); θ, theta (3.5-8 Hz); σ, adapted
sigma; B, unstandardized coefficient; MI, modulation index; NP1, NREMS period 1; R2,
proportion of explained variance; SE, standard error. *p < .05. **p < .01.

53
Table 11
Prediction of MI during learning night by pre-sleep performance on learning task (N = 10)
Band pair Fz Cz
F R2 B (SE) β P F R2 B (SE) β P
NREMS
δ - σ 0.12 0.03 0.011
(0.04)
0.11 0.78 0.15 0.04 0.012
(0.05)
0.10 0.80
δ - σ, NP1 1.27 0.27 0.06
(0.04)
0.49 0.18 2.08 0.37 -0.16
(0.05)
-0.13 0.74
REMS
δ - γ 0.54 0.13 0.02
(0.06)
0.10 0.78 1.07 0.23 -0.009
(0.06)
-0.05 0.88
θ - γ 1.10 0.24 -0.02
(0.05)
-0.16 0.64 0.58 0.14 0.021
(0.05)
-0.15 0.68
Note. F-statistic, R2 and p-value are for the overall regression model with pre-sleep score and
age as IVs. B (SE), β and p-value are for the pre-sleep score. Pre-sleep score was expressed as
a ratio (0-1) of the number of words recalled to the total number of the word pairs presented. DV
is the log-transformed learning night MI. β, standardized coefficient; γ, gamma (50-100 Hz); δ,
delta (0.25-4 Hz in NREMS; 1.5-3.5 Hz in REMS); θ, theta (3.5-8 Hz); σ, adapted sigma; B,
unstandardized coefficient; MI, modulation index; NP1, NREMS period 1; R2, proportion of
explained variance; SE, standard error.

54
Table 12
Comparison of power-triggered MI on experimental nights (N=10)
Band pair Fz Cz
Control
M (SD)
Learning
M (SD)
F P Control
M (SD)
Learning
M (SD)
F P
NREMS
δ - σ, NP1 -6.06
(0.75)
-6.16
(1.36)
6.51 0.034* -5.42
(0.63)
-5.52
(1.07)
3.39 0.10
REMS
δ - γ -6.28
(1.08)
-6.17
(0.79)
0.60 0.46 -6.49
(1.08)
-6.30
(1.26)
0.024 0.88
θ - γ -6.91
(1.02)
-6.70
(1.03)
0.81 0.39 -6.96
(0.72)
-6.79
(0.93)
0.64 0.45
Note. F-statistic and p-value are for main effect in ANCOVA with control and learning nights as
repeated measures and age as covariate. MIs were log-transformed. γ, gamma (50-100 Hz); δ,
delta (0.25-4 Hz in NREMS; 1.5-3.5 Hz in REMS); θ, theta (3.5-8 Hz); σ, adapted sigma; M,
mean; MI, modulation index; NP1, NREMS period 1. *p < .05.

55
Table 13
Prediction of overnight change in performance on learning task by relative power-triggered MI
(N = 10)
Band pair Fz Cz
F R2 B (SE) β P F R2 B (SE) β P
NREMS
δ - σ, NP1 1.21 0.26 0.036
(0.046)
0.34 0.46 0.88 0.20 -0.013
(0.051)
-0.10 0.80
REMS
δ - γ 2.85 0.45 -0.082
(0.045)
-0.54 0.11 2.06 0.37 -0.003
(0.002)
-0.45 0.18
θ - γ 1.16 0.25 -0.041
(0.056)
-0.25 0.50 0.88 0.20 0.017
(0.060)
0.01 0.79
Note. F-statistic, R2 and p-value are for the overall regression model with MI and age as IVs. B
(SE), β and p-value are for the MI. Learning night MI was log-transformed, then normalized with
respect to control night log MI (learning divided by control). DV is the change in performance,
expressed as a ratio (0-1) of the absolute pre-to-post change in the number of word pairs
recalled over the total number of the word pairs presented. β, standardized coefficient; γ,
gamma (50-100 Hz); δ, delta (0.25-4 Hz in NREMS; 1.5-3.5 Hz in REMS); θ, theta (3.5-8 Hz); σ,
adapted sigma; B, unstandardized coefficient; MI, modulation index; NP1, NREMS period 1; R2,
proportion of explained variance; SE, standard error.

56
Table 14
Prediction of overnight change in performance on learning task by relative phase-binned MA
(N = 10)
Parameter Fz Cz
F R2 B (SE) β P F R2 B (SE) β P
MA over trough 2.28 0.40 -0.17
(0.11)
-0.53 0.17 5.35 0.61 -0.21
(0.78)
-0.71 0.031*
MA over peak 1.86 0.60 -0.16
(0.12)
-0.40 0.24 2.08 0.37 -0.16
(0.11)
-0.43 0.20
Note. F-statistic, R2 and p-value are for the overall regression model with MA and age as IVs. B
(SE), β and p-value are for the MA. Learning night MA was log-transformed, then normalized
with respect to control night log MA (learning divided by control). DV is the change in
performance, expressed as a ratio (0-1) of the absolute pre-to-post change in the number of
word pairs recalled over the total number of the word pairs presented. MAs are for NREMS
period 1 only. β, standardized coefficient, B, unstandardized coefficient, MA, mean amplitude,
R2, proportion of explained variance, SE, standard error. *p < .05.

57
Table 15
Comparison of comodulogram MI on experimental nights on Cz (N=10)
Phase band
(Hz)
Amplitude
band (Hz)
Control M (SD) Learning M (SD) T P
REMS
δ - γ
1.5 – 1.8 67.7 – 70.3 0.816 (0.088) 0.908 (0.086) 2.69 0.025*
1.8 – 2.0 57.4 – 61.4 1.077 (0.118) 0.978 (0.070) -2.59 0.029*
θ - β/γ
4.3 – 5.0 22.1 – 33.1 0.984 (0.055) 1.058 (0.078) 2.29 0.048*
4.3 – 5.0 27.6 – 37.6 0.947 (0.037) 1.065 (0.086) 4.70 0.0011**
5.0 – 5.8 22.1 – 33.1 0.972 (0.026) 1.059 (0.094) 2.83 0.020*
5.0 – 5.8 27.6 – 37.6 0.983 (0.048) 1.031 (0.071) 1.92 0.087
6.8 – 7.8 30.0 – 45.7 0.971 (0.042) 1.051 (0.077) 3.04 0.014*
β - γ
10.6 – 12.3 38.8 – 63.4 1.086 (0.090) 1.015 (0.059) -2.54 0.032*
14.3 – 16.6 27.4 – 60.6 1.011 (0.063) 1.080 (0.081) 3.26 0.0098**
NREMS
δ - β/γ
1.8 – 2.0 57.4 – 61.4 0.933 (0.065) 1.017 (0.11) 2.88 0.018*
2.0 – 2.4 18.4 – 23.2 1.043 (0.091) 0.951 (0.075) -2.53 0.032*
2.0 – 2.4 21.8 – 26.6 0.999 (0.073) 0.919 (0.082) -2.55 0.031*
2.0 – 2.4 41.6 – 46.4 0.994 (0.058) 0.935 (0.034) -2.60 0.029*
2.7 – 3.2 29.4 – 35.8 0.980 (0.067) 0.906 (0.062) -2.33 0.045*
θ - γ
3.7 – 4.3 64.7 – 73.3 1.016 (0.074) 0.960 (0.040) -2.38 0.041*
5.0 – 5.8 63.2 – 74.8 1.033 (0.081) 0.936 (0.063) -2.59 0.029*
6.8 – 7.8 51.6 – 67.2 1.056 (0.062) 0.996 (0.033) -2.71 0.024*
6.8 – 7.8 72.4 – 88.0 1.043 (0.061) 0.952 (0.059) -3.14 0.012*
Note. t-statistics and p-values are for paired samples t-tests. MIs were log-transformed, and
divided by the average of all MIs for that participant, experimental night and stage. β, beta; γ,
gamma; δ, delta; θ, theta; M, mean; MI, modulation index. *p < .05. **p < .01

58
Figures
Figure 1. Schematic of the study design. Participants underwent a first night of PSG screening,
followed 7 days later by either a learning night or a control night, counterbalanced between
participants. Both experimental nights consisted of three pre-sleep phases and one post-sleep
phase. In the learning task, participants were presented with 120 word pairs twice each, then
had to recall the learned association during pre-sleep and post-sleep test phases. In the control
task, participants had to simply count the number of curved letters (e.g. J, P, C) on-screen and
report the total. Participants completed the other task on a 3rd night, 7 days later.

59
NREMS delta NREMS sigma
REMS delta REMS theta
Figure 2. Topographical head maps of raw power spectral density means for NREMS delta (0.5-
4 Hz) and sigma (10-16 Hz), and REMS delta (1.5-3.5 Hz) and theta (4-8 Hz), across 16
electrodes and 9 participants (both nights averaged). The nasion is indicated by the upper
triangle. Cz and Fz show the greatest spectral power in all cases.

60
Figure 3. NREMS power spectral densities for all participants, in NP1 only. Learning nights are
in red and control nights in blue. Note the clear peaks in delta and sigma power. NP1, NREMS
period 1.
Frequency (Hz)
Log p
ow
er
(μV
2)

61
Figure 4. REMS power spectral densities for all participants. Learning nights are in red and
control nights in blue. Note the clear peaks in theta power in participants 3, 6, 8 and 10.
Frequency (Hz)
Log p
ow
er
(μV
2)

62
Figure 5. Power spectral density of all stage N2 epochs, concatenated, for one participant on
experimental nights. Blue is the learning night, and green is the control night. Note the close
agreement in peaks in the sigma range. The average of these two peaks for each participant
was taken as the adapted sigma centre frequency.

63
Figure 6. Correlation between stage N2 sigma peaks per participant on experimental nights (N =
10). The green line indicates equality.

64
Figure 7. Correlation between slow wave relative RMS during stages N2 and N3 on Fz and
overnight change in word pair recall (N = 10). Relative RMS is the learning night RMS divided by
the control night value. The correlation is driven by an outlier. RMS, root-mean-square.

65
Control
Learning
Figure 8. Grand average of all detected spindles for all participants during NREMS (all periods)
in control and learning nights, centered at the most negative trough (± SEM). The spindle is
visibly coupled to the rising phase of the SW. SEM, standard error of the mean; SW, slow wave.

66
Figure 9. SW trough-triggered adapted sigma average amplitude envelope on experimental
nights, over average SW, on Cz (N = 10). Red is learning night sigma power, blue is control
night sigma power, and green is the average SW signal. Dark lines are the mean, and light lines
are the ± standard deviation. Raw signal during all automatically detected SWs was filtered
within the adapted sigma band, Hilbert-transformed to obtain the amplitude envelope, averaged
for each participant, and normalized with respect to that participant’s pre-sleep, pre-task quiet
wakefulness recording RMS. Average amplitude envelopes were then averaged for each
experimental night, across participants. SW, slow wave.

67
Figure 10. Histogram of natural logarithm-transformed MIs (N = 16200). The frequency
distribution approximates the Gaussian. MIs were taken from the comodulogram analysis. The
heavy tail on the right is likely due to artefacts from the comodulogram. MI, modulation index.

68
Figure 11. Comparison of log-transformed modulation index between experimental nights, by
band pair and electrode (N = 10). SW-sigma is for NREMS period 1. RSA (delta)-gamma and
theta-gamma are for all REMS. Error bars indicate the standard deviation. RSA, rhythmic slow
activity; SW, slow wave.

69
Figure 12. Correlation between relative log-transformed delta-sigma MI in NREMS period 1 on
Fz and overnight change in word pair recall (N = 10). Delta (0.25-4 Hz) was the phase-giving
frequency, and adapted sigma the amplitude-giving frequency. Relative MI is the learning night
MI divided by the control night value. Model 2 multiple regression revealed a significant
prediction (F = 11.42, R2 = 0.77, b = 51, SEb = 12, β = 0.77, pMI = 0.004). MI, modulation index.

70
Figure 13. Correlation between relative log-transformed theta-gamma MI in REMS on Fz and
overnight change in word pair recall (N = 10). Theta (3.5-8 Hz) was the phase-giving frequency,
and gamma (50-100 Hz) the amplitude-giving frequency. Relative MI is the learning night MI
divided by the control night value. Model 2 multiple regression revealed a significant prediction
(F = 8.91, R2 = 0.72, b = -47, SEb = 13, β = -0.82, pMI = 0.009). MI, modulation index.

71
Figure 14. Comparison of log-transformed power-triggered modulation index between
experimental nights, by band pair and electrode (N = 10). SW-sigma MI is for NREMS period 1
only. Delta-gamma MI and theta-gamma MI are for all REMS. Error bars indicate the standard
deviation. RSA, rhythmic slow activity (delta); SW, slow wave.

72
Figure 15. Phase-amplitude plots for participant 10 in NREMS period 1 comparing experimental
nights. Mean amplitudes per phase bin (where 0° is the delta trough, corresponding to the SO
down-state) were log-transformed and normalized with respect to the log-transformed mean
amplitude of the pre-sleep, pre-task quiet wakefulness recording, The sinusoid below each plot
illustrates the phase of the delta oscillation corresponding to each bin. AU, arbitrary unit; SW,
slow wave.

73
Figure 16. Average delta-sigma phase-amplitude plot in NREMS period 1 on experimental nights
(N = 10). Mean amplitudes per phase bin (where 0° is the delta trough, corresponding to the SW
up-state) were log-transformed and normalized with respect to the log-transformed mean
amplitude of the pre-sleep, pre-task quiet wakefulness recording, then averaged across
participants. Error bars represent the standard error of the mean. The sinusoid below each plot
illustrates the phase of the delta oscillation corresponding to each bin. On learning nights, the
phase-amplitude relationship seems smeared to the right. AU, arbitrary unit; SW, slow wave.

74
Figure 17. Comparison of mean amplitudes over rising and falling phases of delta during
experimental nights (N = 10). Mean amplitudes per phase bin (rising or falling phase of SW)
were log-transformed and normalized with respect to the log-transformed mean amplitude of the
pre-sleep, pre-task quiet wakefulness recording, then averaged across participants. Error bars
represent the standard error of the mean. Rising phase corresponds to the SW down-state
transition, and falling phase to the up-state transition. AU, arbitrary unit; MA, mean amplitude;
SW, slow wave. *p < 0.05, **p < 0.01

75
NREMS
REMS
Figure 18. NREMS and REMS comodulograms for participant 1. Colours represent log-
transformed MIs, normalized with respect to the comodulogram average. Bandwidths for the
amplitude frequency are always double the upper limit of the phase frequency. MI, modulation
index.

76
Figure 19. Difference comodulogram for NREMS period 1 (N = 10). Colours represent
differences (learning minus non-learning) in normalized log-transformed MIs. Bandwidths for the
amplitude frequency are always double the upper limit of the phase frequency. MI, modulation
index. *p < 0.05.

77
Figure 20. Difference comodulogram for REMS (N = 10). Colours represent differences (learning
minus non-learning) in normalized log-transformed MIs. Bandwidths for the amplitude frequency
are always double the upper limit of the phase frequency. MI, modulation index. *p < 0.05, **p <
0.01.

78
Figure 21. Comodulogram for stage differences (N = 10). Colours represent differences (REMS
minus NREMS) in normalized log-transformed MIs, averaging between experimental nights.
Bandwidths for the amplitude frequency are always double the upper limit of the phase
frequency. MI, modulation index. *p < 0.05, **p < 0.01.