Jonel Nazareno Iurk, CEO Adriano Rudek de Moura, CFO 11.09ir.copel.com/enu/10597/3Q18.pdf ·...
12
Jonel Nazareno Iurk, CEO Adriano Rudek de Moura, CFO 11.09.2018
-
Upload
trinhnguyet -
Category
Documents
-
view
216 -
download
0
Transcript of Jonel Nazareno Iurk, CEO Adriano Rudek de Moura, CFO 11.09ir.copel.com/enu/10597/3Q18.pdf ·...

Jonel Nazareno Iurk, CEOAdriano Rudek de Moura, CFO
11.09.2018
Disclaimer
Any statements made during this conference call involving Copel’s business outlook or
financial and operating forecasts and targets constitute the beliefs and assumptions
of the Company’s Management, and the information currently available. Forward-
looking statements are not guarantees of performance and involve risks, uncertainties
and assumptions, given that they refer to future events, and thus are dependent on
circumstances that may or may not occur. The general economic conditions, industry
conditions and other operating factors could come to affect the future performance of
Copel and lead to results that are materially different from those expressed in said
forward-looking statements.
2

✓ Adjusted EBITDA of R$ 750 million in 3Q18(R$ 2.4 billion in 9M18)
✓ Operating cash generation of R$ 615 millionin 3Q18 (R$ 2.7 billion in 9M18)
✓ SHP Bela Vista
✓ 29MW of installed capacity✓ R$ 200 million of estimated investment
✓ Lot J Eletrobras Auction (SPC Uirapuru)
✓ APR of R$ 32.4 million✓ 120 Km of transmission line✓ Synergy with other assets
✓ Asset swaps with Eletrosul
✓ APR 100% Copel✓ SPC Costa Oeste✓ SPC Marumbi
✓ Start of test operation of the Cutia Complex
✓ 86% of the wind turbines in Cutia✓ 14% of the wind turbines in Bento Miguel
Highlights
3
Enterprises
CAPEX
Subsidiary / SPCCarried
9M18
Carried
3Q18
Scheduled
20181
Copel Geração e Transmissão 499,2 129,2 691,9
UHE Colíder 94,9 6,6 98,4
UHE Baixo Iguaçu 56,7 25,7 71,7
LT Curitiba Leste-Blumenau 134,0 46,0 243,5
LT Araraquara-Taubaté 57,7 1,9 40,4
SE Bateias - - 17,5
Other2 155,9 49,0 25,1
Copel Brisa Potiguar 1,3 0,7 131,3
Cutia Empreendimentos Eólicos 673,0 190,0 888,5
São Bento Energia 8,6 0,0 6,6
Copel Distribuição 462,0 217,2 660,0
Copel Telecomunicações 220,1 91,1 290,2
Copel Comercialização 0,0 0,0 0,2
Holding 0,0 0,0 2,4
Other Invesment3 36,2 0,0 0,8
Total 1.900,4 628,2 2.671,9
1 Capital budget originally approved by the Board of Directors and revised by Board of Directors, thelast update at the 184th Ordinary Meeting of the Board of Directors, with a reduction of R$ 256.7million in the total amount originally estimated, distributed in less R$130.0 million to Copel DIS, lessR$51.7 million to Copel GeT, less R$50.0 million for Copel Telecom and less R$25.0 million for CopelBrisa Potiguar. These values do not consider appropriation due to own labor, interest and others.2 Regarding the participation of Copel in Enterprise.3 Includes SPC Paraná Gás, SPC Voltalia São Miguel do Gostoso I, among others.
Consolidated Result

Highlights – Copel Distribuição
4
(R$ million)
✓ Reduction of 2.3% in personnel costs.
Consolidated Result
Copel Distribuição’s Result
✓ Growth of 94% in EBITDA
✓ Full application of tariff readjustment
✓ Reduction of the gap to the regulatory EBITDA
EBITDA Carried x Regulatory
Market Growth – Copel Distribuição
Source: EPE – Monthly Market Review
Brazil South Copel
Grid Market
9M18 1.1% 1.6% 1.9%
3Q8 0.8% 0.9% 1.7%
Default and PECLD Rates – Copel Distribuição
Quality of Supply– Copel Distribuição
7,33
4,99
6,96
4,25
Measured DEC Measured FEC
9M17 9M18
593
747776
129
462
624
9M16 9M17 9M18
EBITDA Regulatory EBITDA Carried
78.2%
38.2%
19.6%
195.2 200.3
19.9 13.4
1.37%
1.24%
Sep-17 Sep-18Overdue Debts (15 to 360 days) - R$ million
Delinquency Rate (PECLD)
Default Rate
Adjusted EBITDA
55
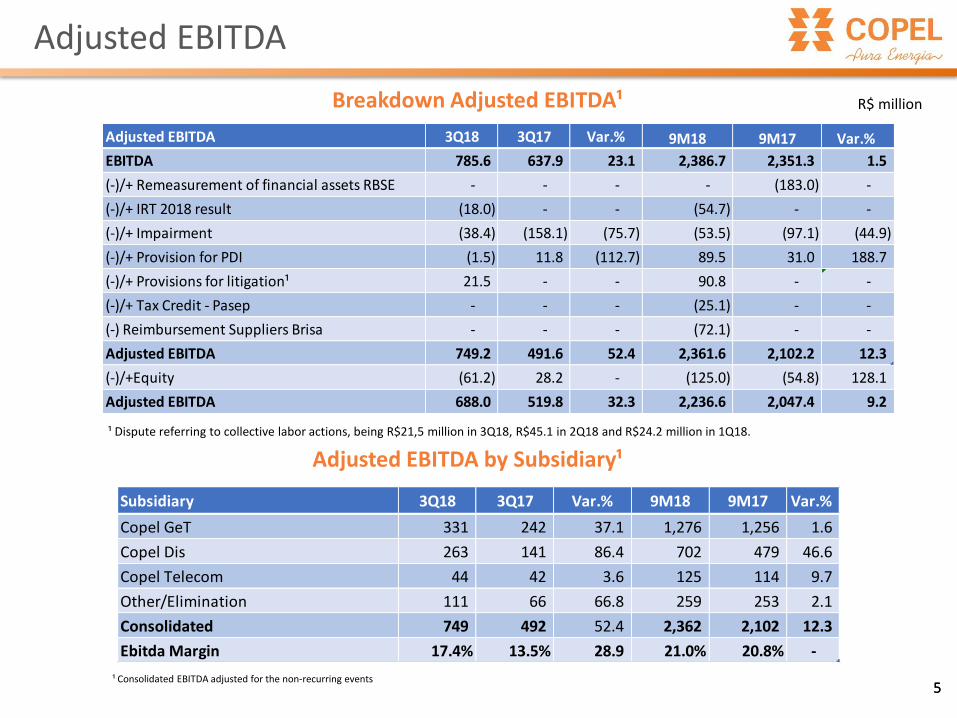
Breakdown Adjusted EBITDA¹ R$ million
¹ Consolidated EBITDA adjusted for the non-recurring events
Adjusted EBITDA by Subsidiary¹
Adjusted EBITDA 3Q18 3Q17 Var.% 9M18 9M17 Var.%
EBITDA 785.6 637.9 23.1 2,386.7 2,351.3 1.5
(-)/+ Remeasurement of financial assets RBSE - - - - (183.0) -
(-)/+ IRT 2018 result (18.0) - - (54.7) - -
(-)/+ Impairment (38.4) (158.1) (75.7) (53.5) (97.1) (44.9)
(-)/+ Provision for PDI (1.5) 11.8 (112.7) 89.5 31.0 188.7
(-)/+ Provisions for litigation¹ 21.5 - - 90.8 - -
(-)/+ Tax Credit - Pasep - - - (25.1) - -
(-) Reimbursement Suppliers Brisa - - - (72.1) - -
Adjusted EBITDA 749.2 491.6 52.4 2,361.6 2,102.2 12.3
(-)/+Equity (61.2) 28.2 - (125.0) (54.8) 128.1
Adjusted EBITDA 688.0 519.8 32.3 2,236.6 2,047.4 9.2
¹ Dispute referring to collective labor actions, being R$21,5 million in 3Q18, R$45.1 in 2Q18 and R$24.2 million in 1Q18.
Subsidiary 3Q18 3Q17 Var.% 9M18 9M17 Var.%
Copel GeT 331 242 37.1 1,276 1,256 1.6
Copel Dis 263 141 86.4 702 479 46.6
Copel Telecom 44 42 3.6 125 114 9.7
Other/Elimination 111 66 66.8 259 253 2.1
Consolidated 749 492 52.4 2,362 2,102 12.3
Ebitda Margin 17.4% 13.5% 28.9 21.0% 20.8% -

6
Cash Flow
✓ Expectation of start-up of new power plants
✓ Growth of 13% in installed capacity
✓ R$ 622 million of generation of operationalcash flow in 3Q18
✓ R$ 2,661 million of generation of operationalcash flow in 9M18
¹ It does not consider the transmission assets according to ICPC 01 IFRIC 12.
Cash Flow 3Q18 3Q17 9M18 9M17
EBIT 598 456 1,832 1,802
D/A 187 182 555 549
Change in operating assets and
liabilities(163) (75) 207 (108)
CASH GENERATED FROM
OPERATING ACTIVITIES622 563 2,661 2,243
Investments flow¹ (538) (412) (1,471) (1,375)
Cash flow after investments 84 151 1,190 868

7
Operating Income
R$ millionIncrease by 17.8% in Recurring Operating Revenue in the Quarter
✓ Adjustment of electric power tariff (TE);
✓ Growth of 6.1% in electricity sales to finalcustomers;
✓ Sale of 1,153 GWh by Copel Com to freecostumers;
✓ Growth of 1.7% in grid market;
✓ Expansion of Telecom's customers base;
✓ Growth of 40.1% in piped gas distributionrevenues.
* Amounts subject to rounding.¹ Adjusted for the positive effect of R$ 18.0 million related to IRT 2Q18.
² It considers the construction revenue, the fair value of the concession's assets, the distribution of piped gas, and other operating revenues.
+21.2% +5.1% +20.0% +15.0% -1.6% +17.8%+53.4%

8
Operating Costs and ExpensesR$ million
* Amounts subject to rounding.¹ Recurring cost adjusted by the positive impact of R$158.1 million referring to the provision for impairment and R$11.2 million related to the PDI.² Adjusted by the negative impact of R$21.5 million referring to collective labor actions and by the positive impacts of R$ 38.4 million and R$ 158.1 million relatedto the provision for impairment in 3Q18 and 3Q17, respectively.³ Adjusted for the positive impact of R$ 1.5 million due to the reversal of provision for the PDI, in addition to 11.8 million provisioned to the PDI in 3Q17.4 It considers the cost of raw materials and inputs for the production of energy, natural gas and inputs for gas operation, depreciation and amortization andconstruction costs.
Increase by 14.7% in the Recurring Operating Costs and Expenses
+17.9% +24.2% -7.6% +14.7%+25.1% +27.7%
✓ Purchase of 1,611 GWh by Copel Com in 3Q18 (versus1,103 GWh in 3Q17)
✓ R$ 41.5 million in labor provisions
✓ Increase of 65.9% with natural gas, mainly due toexchange variation and higher consumption of naturalgas
✓ GSF of 59.4% in 3Q18 compared to 61.8% in 3Q17
✓ Average PLD of R$ 494.37/MWh in 3Q18 versusR$ 436.20/MWh in 3Q17
✓ Dollar price (R$ 3,90 in 3Q18 versus R$ 3,17 in3Q17)

341
20
135 162
659
349
24
141 95
609
P M S O Total3Q17 3Q18
9
Manageable Costs
R$ million
✓ Salary Adjustment of 1.6% in October/17
✓ Reduction of 354 employees in the last 12 month
✓ Policy of not filling job vacancies
✓ Inflation of the last 12 months of 4.53%
✓ Real reduction of 2.0% with manageable costs
✓ Invoice recovery at Copel Distribution
✓ Reduction in financial compensation for the useof water resources
Increase by 1.2% in Recurring Manageable Costs in the quarter
* Values subject to rounding.¹ Considers staff and administrators and social security and welfare plan. Amount adjusted by the provision for indemnities related to the PDI, withpositive effect of R$0.2 million in 2Q8 and negative of R$12.0 million in 2Q17² Adjusted for the positive impact of R$ 1.5 million due to the reversal of provision for the PDI, in addition to 11.8 million provisioned to the PDI in3Q17.
+2.2%
+18.6%
+4.7% -41.6%
-7.6%
Debt
10
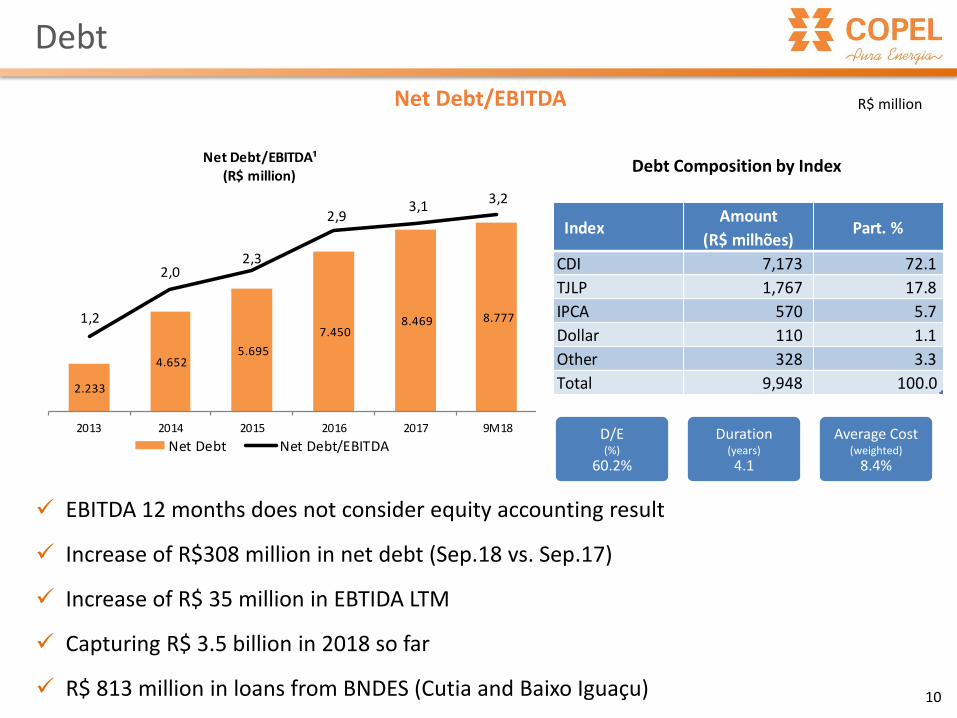
Net Debt/EBITDA
✓ EBITDA 12 months does not consider equity accounting result
✓ Increase of R$308 million in net debt (Sep.18 vs. Sep.17)
✓ Increase of R$ 35 million in EBTIDA LTM
✓ Capturing R$ 3.5 billion in 2018 so far
✓ R$ 813 million in loans from BNDES (Cutia and Baixo Iguaçu)
R$ million
Debt Composition by Index
IndexAmount
(R$ milhões)Part. %
CDI 7,173 72.1
TJLP 1,767 17.8
IPCA 570 5.7
Dollar 110 1.1
Other 328 3.3
Total 9,948 100.0
D/E(%)
60.2%
Duration(years)
4.1
Average Cost(weighted)
8.4%
2.233
4.652 5.695
7.450 8.469 8.777 1,2
2,0 2,3
2,9 3,1
3,2
-
2.000
4.000
6.000
8.000
10.000
2013 2014 2015 2016 2017 9M18
Net Debt/EBITDA¹(R$ million)
Net Debt Net Debt/EBITDA

Breakdown Net Income
GeT Distribuição Telecom
22.0 4.3 14.1
Net Income
11
R$ million
¹ Dividend approved at the 63rd. EGM of June 15, 2018.
Net Margin by Subsidiary (%) – 3Q18
Subsidiary 3Q18 3Q17 Var.% 9M18 9M17 Var.%
Copel GeT 195 168 16 651 658 (1)
Copel Dis 125 203 (38) 250 283 (12)
Copel Telecom 15 19 (22) 37 46 (19)
Other/Elimination 26 26 - 114 (1) -
Consolidated 361 417 (13) 1,053 985 7
Net Margin 8% 11% (27) 9% 10% (4)