Jonathan M Innes - University of Adelaide · effect on the natural tooth structure and the...
189
1 An investigation into surface texture and in-vitro two-body wear of CAD/CAM dental materials antagonised by acrylic denture teeth Jonathan M Innes Thesis submitted in partial fulfillment of the degree of Doctor of Clinical Dentistry (Prosthodontics) The University of Adelaide School of Dentistry, Faculty of Health Sciences December 2015
Transcript of Jonathan M Innes - University of Adelaide · effect on the natural tooth structure and the...

1
An investigation into surface texture and in-vitro two-body wear
of CAD/CAM dental materials antagonised by acrylic denture
teeth
Jonathan M Innes
Thesis submitted in partial fulfillment of the degree of
Doctor of Clinical Dentistry (Prosthodontics)
The University of Adelaide
School of Dentistry, Faculty of Health Sciences
December 2015

2
Preface
This thesis reports on research completed during my Doctorate of Clinical Dentistry
(Prosthodontics) at the University of Adelaide, from January 2012 to December 2014.
Two primary aims of the project were firstly, to investigate surface texture analysis
technology use on dental materials, and secondly, to complete a two-body in-vitro wear study
of modern dental restorative materials opposing a standardized artificial acrylic tooth.
3
Table of Contents
Section 1- Introduction ............................................................................................................. 1
1.1 Tooth Wear ................................................................................................................... 2
1.1.1 Background ........................................................................................................... 2
1.1.2 Aetiology of Tooth Wear ...................................................................................... 3
1.1.3 The Chewing Cycle ............................................................................................ 11
1.1.4 Methods of assessment of tooth wear ................................................................. 12
1.1.5 Surface texture analysis ...................................................................................... 14
1.1.6 Tribology ............................................................................................................ 27
1.2 Relevant Dental Materials .......................................................................................... 33
1.2.1 Acrylic Prosthetic Teeth ..................................................................................... 33
1.2.2 Nano-Ceramic Composite Resin ........................................................................ 35
1.2.3 Ceramics ............................................................................................................ 36
1.3 In-Vitro Dental Material Tribology ........................................................................... 51
1.3.1 General Considerations in in-vitro acrylic denture tooth testing ........................ 51
1.3.2 Material Wear Quantification ............................................................................. 52
1.3.3 Standardising wear simulation research protocols .............................................. 53
1.3.4 Dental Sample Material Test Parameters ............................................................ 53
1.4 Literature Review of Acrylic Denture Teeth Wear Testing ....................................... 64
1.5 Rationale for this research .......................................................................................... 68
Section 2- Study Aims and Hypothesis ................................................................................. 69
2.1 Study Aims ................................................................................................................. 70
2.2 Null Hypotheses ......................................................................................................... 71
Section 3- Methods and Materials ......................................................................................... 72
3.1 Sample Preparation .................................................................................................... 73
3.1.1 Monolithic Zirconia ............................................................................................ 73
3.1.2 Lithium Disilicate Specimen .............................................................................. 76
3.1.3 Resin Nano-Ceramic (RNC) ............................................................................... 76
3.1.4 Artificial acrylic denture tooth material (PMMA) .............................................. 76
3.1.5 Antagonist Preparation (PMMA) ........................................................................ 77
3.2 Mounting .................................................................................................................... 77
3.3 Scanning electron microscopy (SEM) observations and Surface texture
quantification .............................................................................................................. 80
3.3.1 MeX for Sa Analysis ........................................................................................... 81

4
3.3.2 Comparison of Ra and Sa ......................................................................................... 82
3.4 Profilometry ............................................................................................................... 85
3.5 Wear testing machine ................................................................................................. 87
3.6 Wear machine protocols ............................................................................................. 90
3.6.1 Load (Applied Force) .......................................................................................... 90
3.6.2 Lubrication .......................................................................................................... 90
3.6.3 Type of Movement .............................................................................................. 91
3.6.4 Cycles (duration of experiment) ......................................................................... 91
3.6.5 Cycling rate ......................................................................................................... 92
3.6.6 Area of specimen contact .................................................................................... 92
3.7 Experimental protocol ................................................................................................ 93
3.7.1 In vitro two-body Wear Study ............................................................................ 93
3.7.2 Conclusions and Antagonistic Wear Study Protocols ........................................ 95
3.7.3 Statistical Analysis .............................................................................................. 95
Section 4- Results .................................................................................................................... 96
4.1 Qualitative Surface Texture ....................................................................................... 97
4.1.1 Pre-wear Surface Evaluation .............................................................................. 97
4.1.2 Post wear surface evaluation ............................................................................. 113
4.2 Quantitative (Post Wear) Surface Texture Analysis ................................................ 128
4.2.1 Ra measurements post two body in-vitro wear testing of acrylic and sample
materials ............................................................................................................ 128
4.2.2 Ra values of acrylic antagonists and material specimens before and after two-
body wear testing .............................................................................................. 131
4.3 Volumetric analysis: Acrylic Antagonist (AA) and Material sample specimen
volume loss following 240,000 cycles of tribology testing (Volume loss in mm3).
.................................................................................................................................. 133
Section 5- Discussion ............................................................................................................. 137
5.1 Baseline/Pre-testing material analysis ...................................................................... 138
5.1.1 Qualitative Analysis .......................................................................................... 138
5.1.2 Quantitative Surface Texture Analysis ............................................................. 140
5.2 Post two-body in-vitro wear testing analysis ........................................................... 141
5.2.1 Qualitative analysis ........................................................................................... 141
5.2.2 Quantitative Analysis ........................................................................................ 143
5.2.3 Material Wear and Volume Changes ................................................................ 144
Section 6- Conclusions .......................................................................................................... 146
6.1 Surface texture analysis ............................................................................................ 147

5
6.1.1 Baseline/Pre-Wear testing ................................................................................. 147
6.1.2 Post two-body in-vitro wear testing .................................................................. 147
6.2 Volumetric changes of acrylic antagonist specimens and material sample specimens
following ............................................................................................................................. 148
Section 7- References ............................................................................................................ 149
Section 8- Appendices ........................................................................................................... 165
8.1 Appendix 1 – Literature review table summary of in-vitro wear studies on artificial
denture teeth ........................................................................................................................ 166
8.2 Appendix 2 – Complete set of baseline Ra and Sa values for all examined materials
………. ................................................................................................................................ 174
8.3 Appendix 3 –Post two-body wear testing material loss (wear) in mm3 for each two-
body wear testing group (material sample and acrylic antagonist) ..................................... 176
6
Abstract
Introduction:
Wear of teeth and of dental materials is a normal chemical and biomechanical process and is
one of the physical and behavioral characteristics of dental restorative materials that need to
be understood when planning the incorporation of a dental restoration into the stomatognathic
system. The aims for this investigation were to analyse and compare two-dimensional (Ra)
and three-dimensional (Sa) methods for surface texture analysis and to apply these methods in
a two-body in-vitro wear study using PMMA-acrylic denture teeth as antagonists and a range
of commonly used dental restorative materials as test specimens. The material wear
characteristics of the antagonist and sample materials were analysed both qualitatively and
quantitatively in order to better improve the decisions made by clinicians
Methods and Materials:
The dental materials analysed are all commercially available CAD/CAM materials for clinical
dentistry. They included three monolithic zirconia materials (BruxZir™, Lava Plus™,
DenZir™), a lithium disilicate ceramic (eMax™), a nano-ceramic composite resin (Lava
Ultimate™), and PMMA-acrylic denture teeth (Gnathostar™, Ivoclar Vivadent).
The first investigation involved SEM surface texture analysis of the materials using
commonly applied 2-D (Ra) methodology and a novel 3-D (Sa) surface profile generation
protocol (Me-X). Qualitative and quantitative information was considered to determine which
method gave the most accurate and consistent results for dental material surface topography
characterisation.

7
The second part of the investigation involved in-vitro two-body wear investigations using
PMMA-acrylic denture teeth as an antagonist and samples from each of the test groups. A
purpose-build wear simulator applied a load of 99.5N for 240,000 “chewing” cycles with
distilled water lubrication. The total material volume loss for the test materials and PMMA-
acrylic antagonist were analysed via 3-D surface profile methods. Qualitative analysis was
undertaken via SEM.
Results:
Ra and Sa surface texture analysis and quantification indicated that the 3-D Sa method was
more sensitive to surface topography variation in the materials than the 2-D Ra method. Both
the Ra and Sa methods gave the same ranking of the materials in terms of which had more
pronounced surface topography variation. The highest values were obtained for the PMMA-
acrylic group, followed by Lava Plus™, DenZir™, Lava Ultimate™, eMax™, and BruxZir™
in descending Ra and Sa order. Post two-body wear testing analysis showed qualitative and
quantitative changes in the materials. Obvious wear facets were noted for the acrylic
antagonist and control groups and the Lava Ultimate™ test material. No wear facets were
noted in the zirconia or eMax™ ceramic test samples.
The acrylic antagonist material showed the highest volume loss when opposing the nano-
ceramic Lava Ultimate™ sample material, followed by the eMax™ group, then the acrylic
control group. The Lava Plus™ group showed the least acrylic antagonist material volume
loss. The highest overall test material volume loss occurred in the nano-ceramic composite
resin (Lava Ultimate™), group followed closely by the acrylic-acrylic control group.

8
Conclusions:
The Ra and Sa surface texture analysis and quantification results indicated that either method
could be used to analyse the surface roughness of dental materials. The Ra method was
quicker and more cost effective than the Sa method. The highest values in descending Ra and
Sa order were obtained for the PMMA-acrylic group, followed by Lava Plus™, DenZir™,
Lava Ultimate™, eMax™, and BruxZir™. The monolithic zirconia material samples
(BruxZir™, Lava Plus™, DenZir™) showed significant intergroup variation both
qualitatively and quantitatively.
The two-body in-vitro wear analysis showed that the acrylic antagonist cusp had a clear wear
facet for each test group. Results showed that the nano-ceramic composite resin material was
more abrasive to the acrylic antagonist material than the other materials tested.

9
Declaration
This work contains no material which has been accepted for the award of any other degree in
any other tertiary institution, and to the best of my knowledge and belief contains no material
previously published or written by another person, except where due reference has been made
in the text.
I give consent to this copy of my thesis when deposited in the University library, being made
available for loan and photocopying, subject to the provisions of the relevant Copyright Act.
I give permission for the digital version of my thesis to be made available on the web, via the
university’s digital research repository, the library catalogue, the Australasian Digital Thesis
Program (ADTP) and also through the web search engines, unless permission has been
granted by the university to restrict access for a period of time.
Jonathan M Innes
Dated this 11th day of February 2015.

10
Acknowledgements
I take this opportunity to express my thanks to many people who have provided their
assistance in the production of this report and throughout my time at the School of Dentistry,
The University of Adelaide.
I would like to sincerely thank my supervisors Professor Lindsay Richards and Dr Thomas
Berekally for their continued advice and support. I greatly appreciate having the opportunity
to benefit from their knowledge and experience in the field.
I would also like to thank the staff at Adelaide Microscopy and the research staff of the
School of Dentistry, The University of Adelaide.
Finally, I would like to thank those close to me, without whom this would not have been
possible. Thank-you to my wife Hayley and son Ari for your love and support. Thank-you to
my father John, mother Suzanne, and sisters Jolene and Chanelle for your continued
encouragement. To my grandmother Joan and my pop Joel, thank-you for your guidance over
the years.

- 1 -
Section 1
Introduction

- 2 -
Introduction
1.1 Tooth Wear
1.1.1 Background
Anthropologists have investigated tooth wear in contemporary and pre-contemporary human
populations and have identified tooth wear as resulting from diet and the use of teeth as tools
(Molnar 1972). The differences in observed tooth wear patterns have been attributed to
cultural, gender, and environmental influences between and within different population
groups (Molnar 1972; Richards 1984). Observations have also been made on modern
populations such as Australian Aboriginals and associations drawn to geographical locations
and ingested food types (Beyron 1964; Richards 1984).
Begg (1954) reported that tooth wear occurred on occlusal surfaces and inter-proximally, both
of which were associated with human subject growth and development, and the maintenance
of function (Barrett 1969). More recently, it has been reported that human diets have changed
with an increased intake of softer food types and less coarse foods, which has resulted in less
tooth wear (Kaifu et al. 2003). However, in 2008 the UN reported that the life expectancy of
humans in western countries is increasing annually, which means that both natural and
artificial teeth will need to survive for longer than was previously the case.
Clinically, attention must be paid to this “normal process” in order to minimise or cease its
effect on the natural tooth structure and the stomatognathic system in general. Smith and
Robb (1996) reported on the prevalence of tooth wear and provided a system for identifying
tooth wear that should be considered excessive for the patients’ age and required treatment
increases. Richards (1990) reported on the link between what was considered “excessive”
- 3 -
tooth wear and pathological developments in the stomatognathic system including the
temporomandibular joints.
Dental clinicians aim to restore form, function, comfort and aesthetics to broken down teeth,
however in order to do this, many artificial materials must and can be utilised. An
understanding of the individual physical and behavioural characteristics of these materials is
key when planning the incorporation of a restoration into the functional and dynamic oral and
stomatognathic system.
1.1.2 Aetiology of Tooth Wear
Tooth wear is a natural and multifactorial process of which there are three main categories,
attrition, abrasion, and erosion (Smith and Knight 1984).
Tooth wear progresses throughout life as a normal phenomenon and is accelerated in some
cases by events such as changes in diet or stress leading to bruxism (Berry and Poole 1974).
Therefore it is important in clinical practice to identify an accelerated rate of tooth wear at an
early stage, diagnose its cause, apply preventive measures and monitor carefully over time
(Smith 1996).
Al-Omiri et al (2006) investigated the influence of tooth wear on patients’ quality of life and
satisfaction with their dentition. Of the subjects referred to a “tooth wear clinic”, 36% were
dissatisfied with their teeth and aesthetics, compared to only 3.9% in a group of patients with tooth
wear within “normal” physiological limits. These patients also reported that their tooth wear had a
deleterious effect on chewing and eating ability and that the tooth wear caused pain, and oral
discomfort. Thus, there was a clear impact on daily life activities for subjects suffering abnormal tooth
wear.

- 4 -
1.1.2.1 Attrition
Attrition is recognised as tooth wear that results from direct tooth-to-tooth or material-to-
material contact (Pindborg 1970) and is characterised by distinctive, well-defined, “shiny”
wear facets on opposing teeth (Kaidonis 2008). That is, there is a lack of cupping or scooping
on the worn surface (Figure 1) and microscopically, parallel striations can be seen (Figure 2)
within the wear facet borders (Kaidonis 2008).
Figure 1. Clinical images of a 22-year-old male demonstrating generalised attrition
associated with a parafunctional habit. Note the loss of the cusp tips, flattened
occlusal surface, equal dentine and enamel tissue height, and communication
of opposing tooth wear facets in lateral mandibular movement. (Courtesy Dr
M Zaninovich)

- 5 -
Figure 2. Scanning electron microscope image of wear facet showing parallel
striations. The dentine (d) is not scooped out and is at the same level as
the enamel (e) (Kaidonis 2008)
Attrition has been reported to affect a tooth’s interproximal, occlusal, palatal, and/or labial
surfaces as well as cusp tips and incisal edges (Lambrechts et al 1984). Depending on the
severity, all dental hard tissues can be affected.
Attrition can be classified as either physiologic or pathologic depending on the extent of the
loss tooth structure relative to the patient's age. Historically, tooth attrition was attributed to
“parafunctional” activity such as tooth grinding, or the presence of “occlusal interferences”,
that is tooth to tooth contacts that occur outside a theorised central or single occlusal position.
However there is growing support for the idea that tooth grinding is a normal physiological
behaviour as it has been observed in many different species (Every 1972; Kelleher and Bishop
1997).
Bruxism is defined in the Glossary of Prosthodontic Terms, 2005, as “the parafunctional
grinding of teeth…an oral habit consisting of involuntary rhythmic or spasmodic
nonfunctional gnashing, grinding, or clenching of teeth in other than chewing movements”

- 6 -
(Glossary of prosthodontic terms 8th
edition, 2005). Xhonga (1977) demonstrated that the
amount of enamel loss in an individual who is a “bruxer", is three to four times greater than
that found in individuals identified as non-bruxers. It has been suggested that there is a
correlation between an individual’s bite force and the amount of tooth wear he or she
demonstrates. For instance, Dahl et al (1993) noted that males have a higher bite force and
thus a higher severity and prevalence of attrition-related tooth wear compared to females.
However, the same group (Dahl et al 1985) had shown that muscle activity was not related to
maximum bite force and in fact no difference in maximum bite force was found between
groups who had “pathologic attrition” and those that had a “healthy dentition”.
Dentists have theorised that pathologic tooth attrition may also be related to a reduced number
of functional dental units. For instance, Bernhardt et al (2004) showed that the increase in
dental attrition was proportional to the number of occluding dental units lost. This finding
refuted earlier evidence by Poynter and Wright (1990) who suggested that, due to a tooth’s
periodontal proprioception, remaining teeth could not be subjected to increased load and
found no evidence of increased incisor tooth wear when posterior teeth were lost.
1.1.2.2 Abrasion
Abrasion occurs when exogenous materials are forced over the surfaces of occluding teeth
(Kaidonis 2008). Abrasion-related tooth wear results in larger worn areas than attrition as it
results from abrasive, coarse materials being forced over the entire occlusal surface of teeth.
Anthropological studies have shown that this type of wear has reduced in incidence in recent
times due to our contemporary diet being made up of less coarse foods (Kaidonis 2008). The
exogenous material can be any material, including food or dirt, and can be associated with
- 7 -
habits including items individuals place between their teeth such as tools, pipes, or bobby pins
(Kaidonis 2008; Hattab and Tassin 2000).
Richards and Brown (1981) suggested that abrasion-related tooth wear increases with age and
suggested that the rate is correlated with the abrasiveness or coarseness of foods consumed.
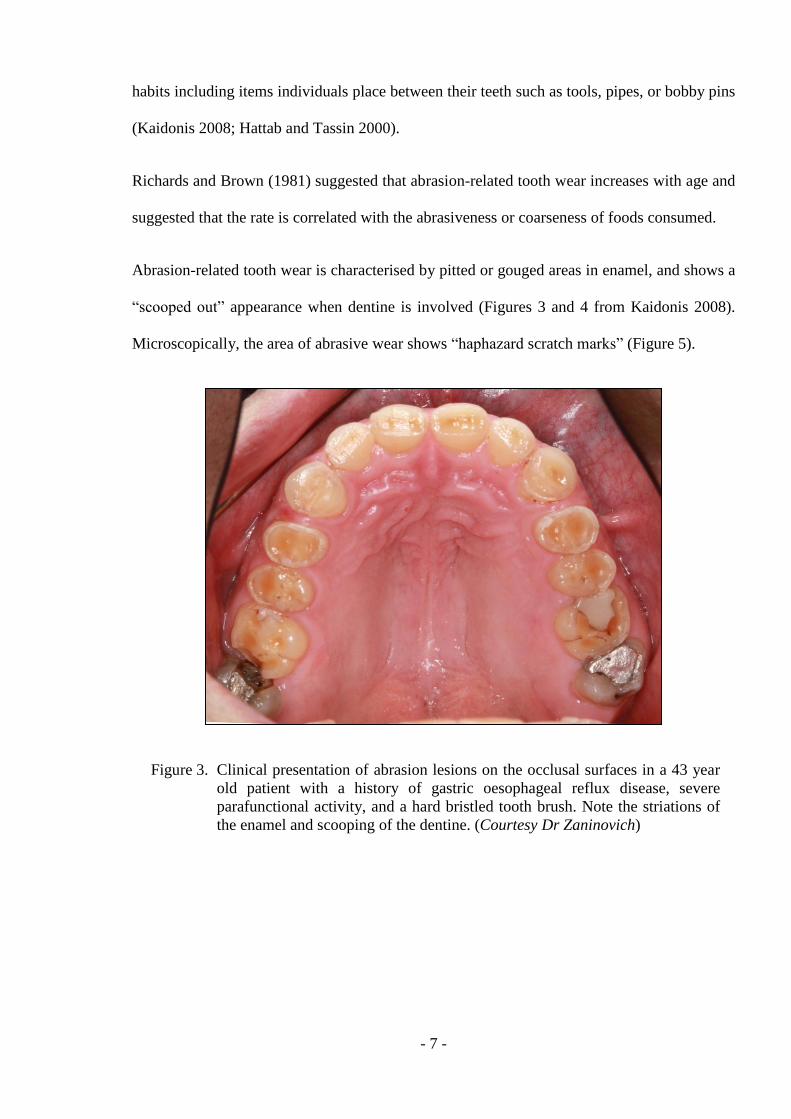
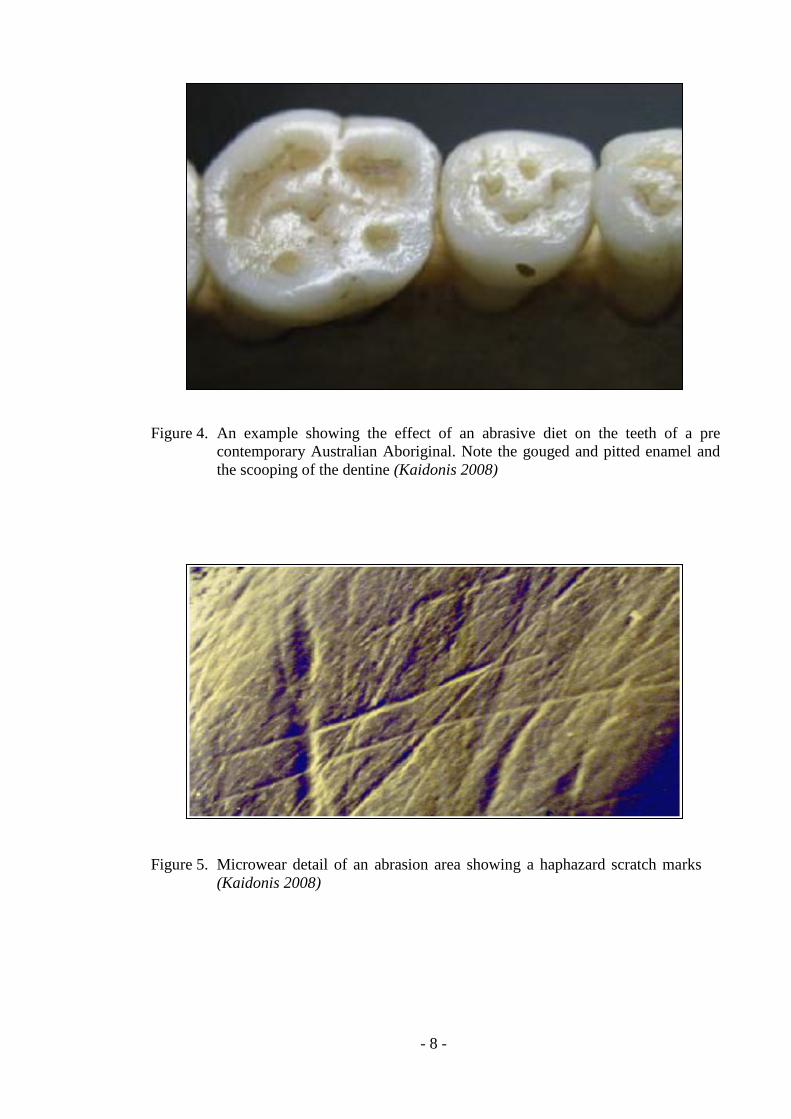
Abrasion-related tooth wear is characterised by pitted or gouged areas in enamel, and shows a
“scooped out” appearance when dentine is involved (Figures 3 and 4 from Kaidonis 2008).
Microscopically, the area of abrasive wear shows “haphazard scratch marks” (Figure 5).
Figure 3. Clinical presentation of abrasion lesions on the occlusal surfaces in a 43 year
old patient with a history of gastric oesophageal reflux disease, severe
parafunctional activity, and a hard bristled tooth brush. Note the striations of
the enamel and scooping of the dentine. (Courtesy Dr Zaninovich)
- 8 -
Figure 4. An example showing the effect of an abrasive diet on the teeth of a pre
contemporary Australian Aboriginal. Note the gouged and pitted enamel and
the scooping of the dentine (Kaidonis 2008)
Figure 5. Microwear detail of an abrasion area showing a haphazard scratch marks
(Kaidonis 2008)

- 9 -
Non-carious cervical lesions (NCCLs) are lesions of tooth wear at a tooth’s cervical area and
are the most common type of tooth wear lesion reported in human populations (Litonjua et al
2003). A common presentation for this type of lesion is the “wedge-shaped” NCCL, the
aetiology of which is controversial with some believing that it is solely an abrasion lesion
associated with tooth brush and toothpaste abrasion (Dawson 2007, ; Litonjua et al 2003).
Others refer to these lesions as “abfraction lesions” and hypothesise that they result from
concentrated tensile stress at the tooth's cervical area due to flexure under loading (Addy and
Shellis 2006). Nguyen et al (2008) investigated these lesions and found that they are in fact
the result of two processes, abrasion and erosion. Horizontal furrows were identified
microscopically which were related to toothbrush-type abrasion. However, the authors
highlighted that tensile stress cannot be completely ruled out.
1.1.2.3 Erosion
Dental erosion is the loss of tooth structure that results from attack by acids that are not of
bacterial origin (Pindborg 1970). Smith (1989) stated that erosion is a chemical process,
however mechanical factors (abrasion and attrition) contribute to the loss of tooth structure as
acid-softened surfaces are more susceptible to mechanical wear. Acids that are commonly
associated with erosive tooth wear include the endogenous acids resulting from gastric acid
regurgitation (GORD) and bulimia nervosa and exogenous (e.g. acid drinks, fruit).
Occupation-related sources including wine tasting and working in dusty environments are
also implicated (Wiegard and Attin 2007). Saliva also plays a key role with those with
diminished salivary buffering capacity showing increased rates of erosive tooth wear (Dahl et
al 1993; Meyers 2008).

- 10 -
Several researchers have identified a “high” and increasing prevalence of erosion-related
tooth wear. For example Auad et al (2009) highlighted the increasing prevalence in the
adolescent UK population with 37% of 14 year olds being affected. Signs of dental erosion
that are evident in early stages include: “glossy enamel” (i.e. smooth, glazed); yellowing of
teeth from underlying dentine; increased incisal translucency; and cupping of the occlusal
surface (Vialati and Belser 2012). Dentinal scooping is characterised by intact dentinal
tubules and may present as tooth sensitivity (Kaidonis 2008). The characteristic erosion
lesions are microscopically smooth and lack caries as shown in Figures 6 and 7.
Figure 6. A micrograph of an erosion lesion. The lack of mechanical wear
characteristics is noteworthy (image courtesy of Dr S. Ranjitkar).

- 11 -
Figure 7. A maxillary central incisor showing erosion on the incisor edge and palatal
surface. The enamel is eroded and the dentine is finely striated (image
courtesy of Dr S. Ranjitkar).
1.1.3 The Chewing Cycle
The chewing cycle can be divided into three distinct phases; preparatory, crushing, and
gliding (Begg 1954; Barrett 1969; Kaifu et al 2003; Smith and Robb 1996).
The initial preparatory phase involves positioning the mandible for food bolus contact. The
jaw opens and continues through the closing movement until the teeth contact the food bolus.
No occlusal forces are applied during this phase except with sticky foods (Barrett 1969; Kaifu
et al 2003).
Next is the crushing phase in which there is a three-body interaction of the opposing teeth
with the food bolus. It begins when teeth contact the food bolus and ends when there is tooth-
to-tooth contact or until the mandible opens or re-enters the preparatory phase (Barrett 1969;
Kaifu et al 2003). At initial food contact, forces are directed through the food bolus and the

- 12 -
force magnitude experienced by the teeth is dependent on the type or stiffness of the food
bolus (Barrett 1969; Kaifu et al 2003; Smith and Robb 1996). The food bolus is compressed
and the masticatory force is distributed over the surface of the food bolus which is in contact
with the maxillary and mandibular teeth, thus as the contact surface area increases, the force
per unit area decreases (Barrett 1969).
The final phase is the gliding phase which may or may not occur during mastication. The
gliding phase starts with tooth-to-tooth contact after complete penetration of the food bolus (if
food is present) and continues until the jaw re-enters the preparatory phase (Barrett 1969;
Kaifu et al 2003; Smith and Robb 1996). The force of mastication is concentrated through the
tooth contact, and thus two-body wear occurs (Barrett 1969). At this time, three-body wear is
also occurring when a food bolus is present (Barrett 1969). DeLong and Douglas (1983)
described a formula for the subsequent tooth wear as being equal to volume loss which is a
result of the wear mechanism multiplied by the occlusal force and total sliding distance
divided by the substrate hardness and pressure. These are physiological, dental material and
food dependent variables that are dynamic rather than constant in nature.
1.1.4 Methods of assessment of tooth wear
Tooth wear can be assessed qualitatively and quantitively both in vivo and in vitro.
Richards et al (2003) presented a “simple” mathematical model of occlusal and incisal tooth
reduction for the clinician to predict the progress of tooth wear in individual patients over
time. The investigators used a diagram-based system for scoring the extent of tooth surface
loss and the age of the patient to predict tooth wear outcomes from an age-based graph which
classified the wear rate as low, medium, or high.

- 13 -
Azzopardi (2000) described how in vivo tooth wear can be assessed using tooth wear indices
such as that described by Smith and Knight (1984), or by comparing longitudinal changes in
tooth form to a series of models or photographs. They stated that tooth wear indices cannot
detect subtle changes in tooth wear and are thus indicated only for epidemiological studies.
They discussed four quantitative methods for investigating in vitro and in situ wear which
were: chemical methods; microradiography; digital image analysis; profilometry and surface
mapping. The methods have been reported in literature and each have inherent advantages and
disadvantages.
There are two forms of profilometry available. Firstly, contacting, which consists of a
mechanical stylus sensor which contacts the sample with low force and secondly, non-
contacting which commonly uses a laser to scan in either two or three dimensions (Mehl et al
1997, Azzopardi 2000, DeLong 2006). The latter is much quicker in recording data than the
contacting devices. However it has stringent sample opacity requirement and can record “over
shoots”, thus providing inaccuracy.
A key aspect of investigating changes in tooth wear, is maintaining the correct orientation of
the sample to the scanner. Azzopardi (2000) reported that profilometry is able to measure
surfaces with precision of 2.2µm and an accuracy of approximately 10µm (Azzopardi 2000).
Errors in wear measurements can be introduced when a stylus instrument is used by factors
that include: the size of the stylus; stylus load; stylus speed; and, lateral deflection by
asperities. The influence of stylus size is illustrated in Figure 8. The effect of stylus size on
measurements becomes more significant as the curvature of the peaks and valleys decreases,
or the magnitude of the slope increases (Thomas 1998). It has been reported that stylus speed
and lateral deflection are generally only minor sources of error (Thomas 1998). In addition
the contacting stylus may damage the surface of a specimen, especially if the surface is
demineralised or has a low hardness (Attin 2006; DeLong 2006)

- 14 -
Figure 8. Distortion of a surface profile due to the effect of stylus size. This Figure is
a schematic diagram comparison of an actual profile against the traced
profile (Thomas 1998).
Scanning electron microscopy (SEM) has been used as a tool for both quantitative and
qualitative analysis as it produces high resolution and magnification images (Attin 2006).
SEM can now be used in conjunction with computer software to produce an image of the
three dimensional surface characteristics of the sample material surface and wear facet. This
image can be analysed to produce both quantitative and qualitative data (Bello et al 2011).
1.1.5 Surface texture analysis
1.1.5.1 Two dimensional surface texture analysis
High quality characterisation of surface topography is important in applications involving
friction, lubrication, and wear (Thomas 1998). Generally, it has been found that friction
increases with average roughness and therefore the roughness of ceramics and dental hard
tissue is an important variable, as it plays a major role in the wear process.
Tracing Stylus Tip
Tracing Stylus Tip
Tracing Stylus Tip
Tracing Stylus Tip
Traced Profile
Traced Profile
Traced Profile
Traced Profile
Original
profile

- 15 -
The characterisation of a material’s surface topography, texture and/or roughness can be done
in two principle planes (Thomas 1998). Using a sinusoidal curve as a simplified model of the
surface profile, material's surface roughness can be measured at right angles to the surface in
terms of the wave amplitude, and/or parallel to the surface in terms of the wavelength. The
latter plane is also recognised as texture. The technique used to measure roughness in either of
these two planes will inevitably have limitations.
Instrument limitations include vertical and horizontal resolution, which correspond to the
smallest amplitude and wavelength the instrument can detect. Also, the vertical and horizontal
range of the instrument correspond to the largest amplitude and wavelength that can be
measured (Thomas 1998).
In statistical terms, the parameters used to characterise material surface topography are
divided into central, second, third and fourth “moments”. Central moments are parameters
which assess the distribution of heights such as centre average line (CLA) or average surface
roughness (Ra or Sa) and root mean square (RMS) (Mair 1999). The second moment is
known as the “variance” and represents the deviation of the distribution from its mean. The
third moment is the “skewness” and is a measure of the asymmetry of the distribution. The
fourth moment is known as the “kurtosis” which represents the shape of the distribution curve
(Thomas 1998).
Amplitude parameters are the most important parameters to characterise surface topography.
They are used to measure vertical characteristics of surface deviations (Gadelmawla et al
2002).
In addition to the amplitude parameters, other parameters are used to characterise or evaluate
material texture. The high-spot count (HSC) is the number of peaks per unit length. Its
reciprocal, Sm, is the mean spacing between the peaks. The profile length ratio RL is the

- 16 -
length of the profile divided by its nominal length. Currently there are more than 100 two-
dimensional parameters that have been described in the literature (Thomas 1998). Common
surface texture parameters are listed in Table 1.
Table 1: Surface texture parameters. (From Leigh 1992)
1.1.5.1.1 Material Roughness Amplitude Parameters
Average Material Roughness (Ra) describes the overall mean roughness of a surface. Ra is
the area between the roughness profile and its mean line over a sampling length or the integral
of the absolute value of the roughness profile height over the evaluation length. It is also
known as arithmetic average, centre line average, and arithmetical mean deviation of the
profile (Poon and Bhushan1995).
- 17 -
Average roughness (Ra) is recognised as one of the most effective and common surface
roughness measures. It is simple to define, easy to measure, requires the least sophisticated
instruments and also gives a good general description of the height variations of a surface.
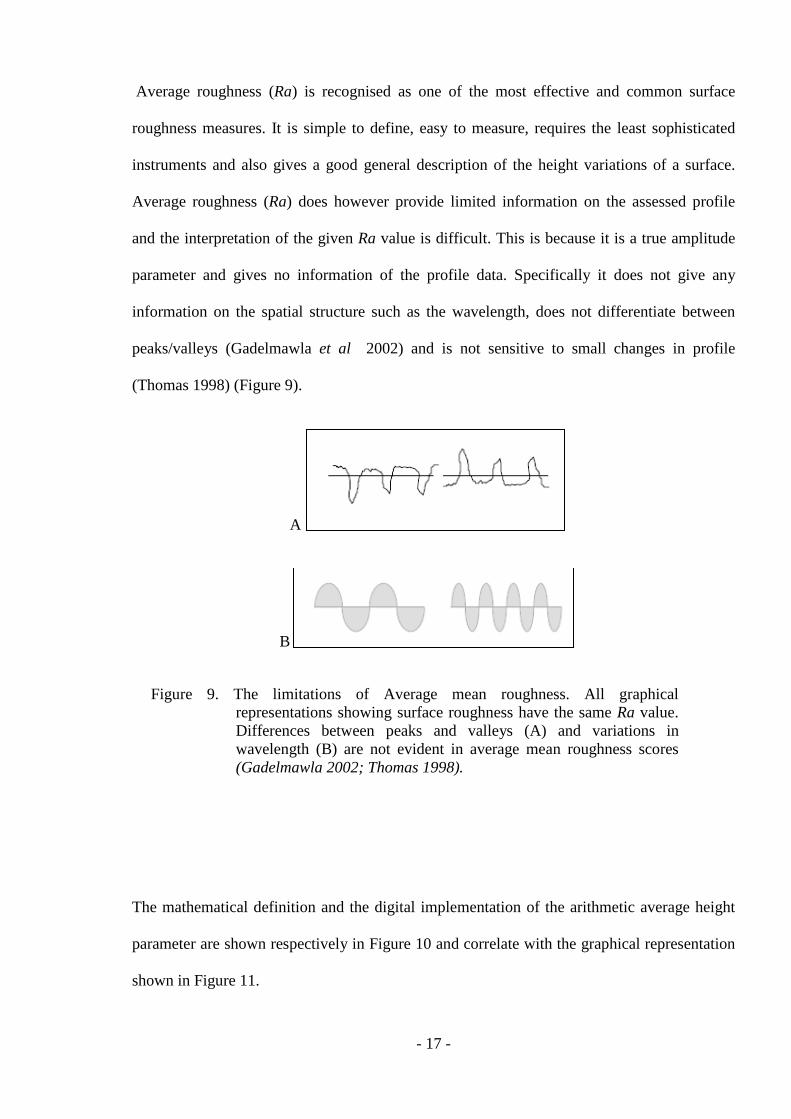
Average roughness (Ra) does however provide limited information on the assessed profile
and the interpretation of the given Ra value is difficult. This is because it is a true amplitude
parameter and gives no information of the profile data. Specifically it does not give any
information on the spatial structure such as the wavelength, does not differentiate between
peaks/valleys (Gadelmawla et al 2002) and is not sensitive to small changes in profile
(Thomas 1998) (Figure 9).
A
B
Figure 9. The limitations of Average mean roughness. All graphical
representations showing surface roughness have the same Ra value.
Differences between peaks and valleys (A) and variations in
wavelength (B) are not evident in average mean roughness scores
(Gadelmawla 2002; Thomas 1998).
The mathematical definition and the digital implementation of the arithmetic average height
parameter are shown respectively in Figure 10 and correlate with the graphical representation
shown in Figure 11.

- 18 -
Figure 10. Mathematical definition and the digital implementation of
arithmetic average height parameter (Ra). l = evaluation length, y =
height, x = distance along measurement, n = number of samples,
y(x) = profile ordinates of roughness profile (Mair 1999).
Figure 11. Ra is the arithmetic mean of the absolute departures of the roughness
profile from the mean line. It is the most often used parameter of
roughness (Mair 1999).
The Root Mean Square roughness (RMS or Rq) is the root mean square average of the
roughness profile ordinates (Leitao and Hegdahl 1981). RMS represents the standard
deviation (SD) of the distribution of surface heights, and is therefore an important statistical
- 19 -
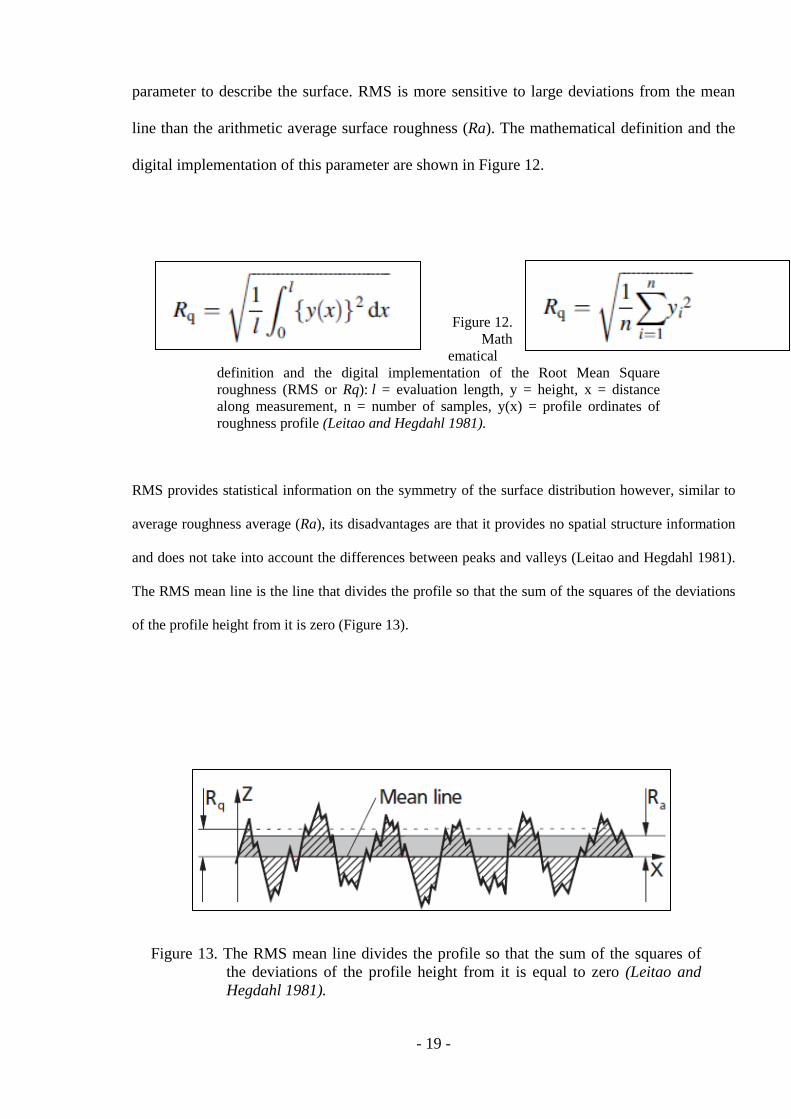
parameter to describe the surface. RMS is more sensitive to large deviations from the mean
line than the arithmetic average surface roughness (Ra). The mathematical definition and the
digital implementation of this parameter are shown in Figure 12.
Figure 12.
Math
ematical
definition and the digital implementation of the Root Mean Square
roughness (RMS or Rq): l = evaluation length, y = height, x = distance
along measurement, n = number of samples, y(x) = profile ordinates of
roughness profile (Leitao and Hegdahl 1981).
RMS provides statistical information on the symmetry of the surface distribution however, similar to
average roughness average (Ra), its disadvantages are that it provides no spatial structure information
and does not take into account the differences between peaks and valleys (Leitao and Hegdahl 1981).
The RMS mean line is the line that divides the profile so that the sum of the squares of the deviations
of the profile height from it is zero (Figure 13).
Figure 13. The RMS mean line divides the profile so that the sum of the squares of
the deviations of the profile height from it is equal to zero (Leitao and
Hegdahl 1981).

- 20 -
The mean roughness depth parameter (Rz) is a surface texture parameter which is more
sensitive to occasional high peaks or deep valleys than average surface roughness (Ra) as it
examines maximum profile heights and not averages (Leitao and Hegdahl 1981). The Single
Roughness Depth (Rzi) is the vertical distance between the highest peak and the deepest
valley within a given sampling length. The Mean Roughness Depth (Rz) is the arithmetic
mean value of the single roughness depths of consecutive sampling lengths (Leitao and
Hegdahl 1981). The mean roughness depth, Rz, is defined by two methods according to the
definition system. The international ISO system defines this parameter as the difference in
height between the average of the five highest peaks and the five lowest valleys along the
assessment lengths of the profile. The German DIN system defines Rz as the average of the
summation of the five highest peaks and the five lowest valleys along the assessment length
of the profile (Azzopardi 2000; Leitao and Hegdahl 1981). The mathematical and graphical
definition is shown in Figure 14.
Figure 14. The mathematical and graphical definition of mean roughness parameter Rz
where n is the number of samples along the assessment line (Leitao and
Hegdahl 1981).
- 21 -
The Maximum Roughness Depth (Rmax) is the largest single roughness depth within the
evaluation length. The Rmax parameter is useful for surfaces where a single defect is not
permissible. Rz and Rmax are used together to monitor the variations of surface finish in a
production process. Similar values of Rz and Rmax indicate a consistent surface finish, while
a significant difference indicates a surface defect in an otherwise consistent surface (Thomas
1998).
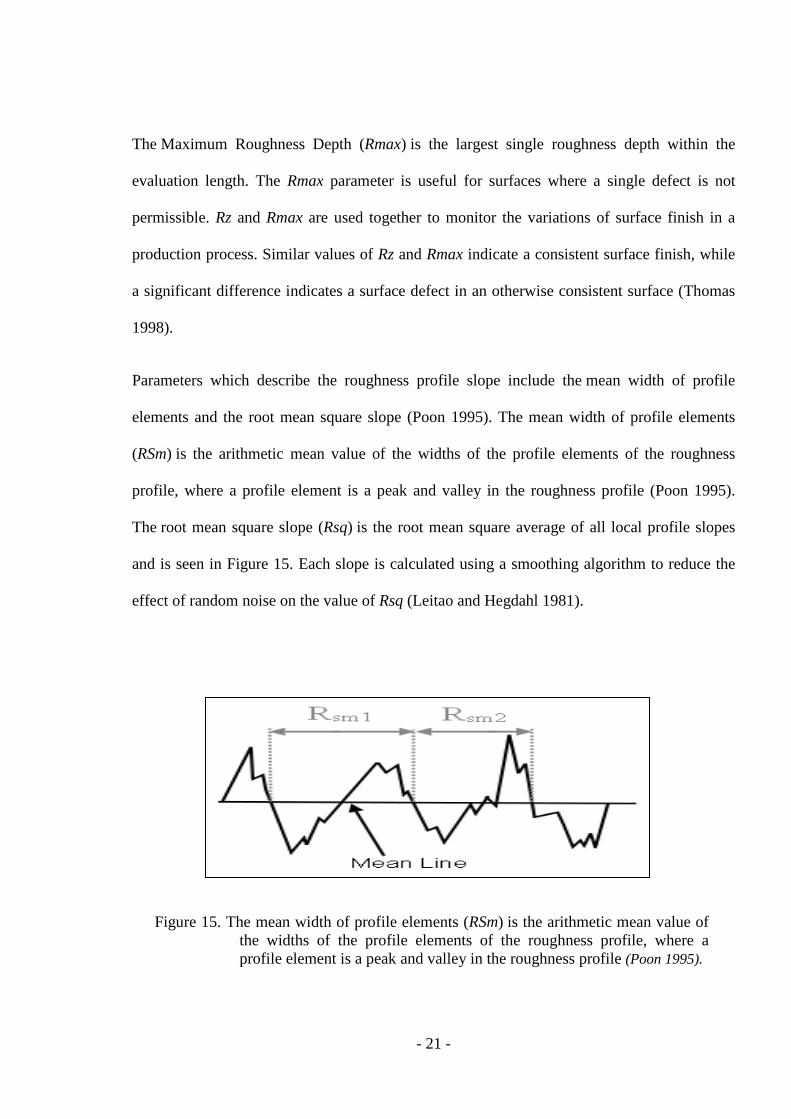
Parameters which describe the roughness profile slope include the mean width of profile
elements and the root mean square slope (Poon 1995). The mean width of profile elements
(RSm) is the arithmetic mean value of the widths of the profile elements of the roughness
profile, where a profile element is a peak and valley in the roughness profile (Poon 1995).
The root mean square slope (Rsq) is the root mean square average of all local profile slopes
and is seen in Figure 15. Each slope is calculated using a smoothing algorithm to reduce the
effect of random noise on the value of Rsq (Leitao and Hegdahl 1981).
Figure 15. The mean width of profile elements (RSm) is the arithmetic mean value of
the widths of the profile elements of the roughness profile, where a
profile element is a peak and valley in the roughness profile (Poon 1995).
- 22 -
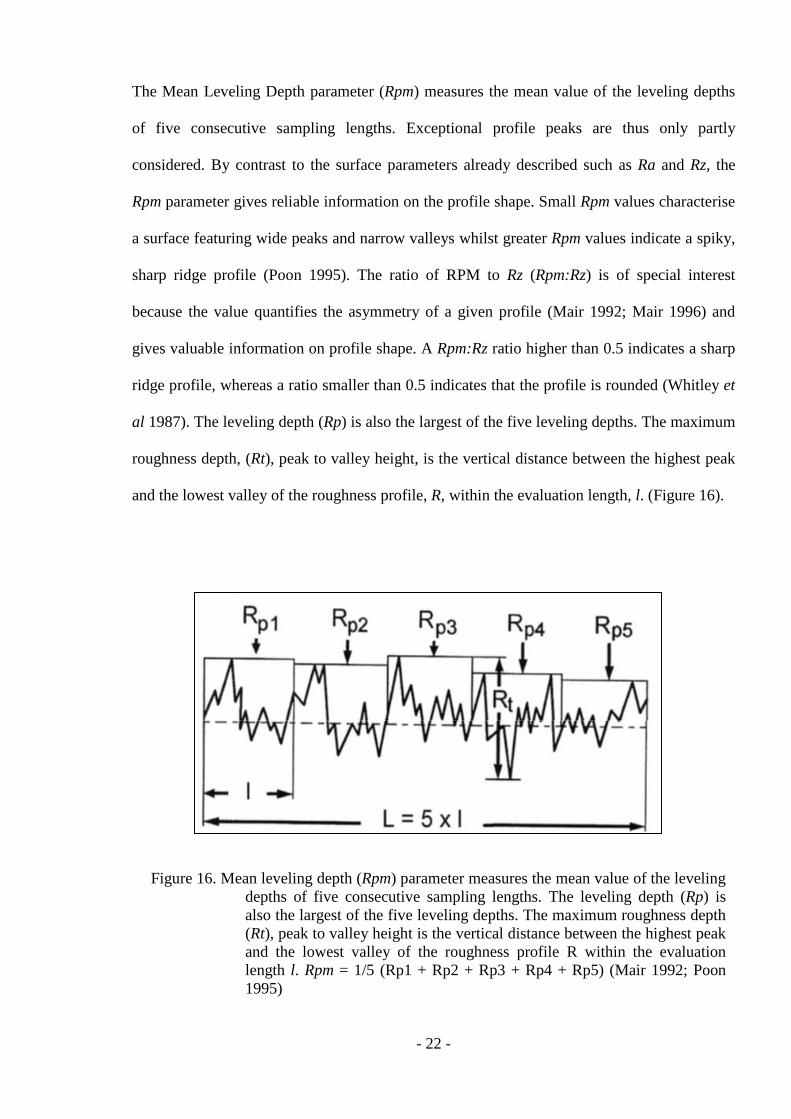
The Mean Leveling Depth parameter (Rpm) measures the mean value of the leveling depths
of five consecutive sampling lengths. Exceptional profile peaks are thus only partly
considered. By contrast to the surface parameters already described such as Ra and Rz, the
Rpm parameter gives reliable information on the profile shape. Small Rpm values characterise
a surface featuring wide peaks and narrow valleys whilst greater Rpm values indicate a spiky,
sharp ridge profile (Poon 1995). The ratio of RPM to Rz (Rpm:Rz) is of special interest
because the value quantifies the asymmetry of a given profile (Mair 1992; Mair 1996) and
gives valuable information on profile shape. A Rpm:Rz ratio higher than 0.5 indicates a sharp
ridge profile, whereas a ratio smaller than 0.5 indicates that the profile is rounded (Whitley et
al 1987). The leveling depth (Rp) is also the largest of the five leveling depths. The maximum
roughness depth, (Rt), peak to valley height, is the vertical distance between the highest peak
and the lowest valley of the roughness profile, R, within the evaluation length, l. (Figure 16).
Figure 16. Mean leveling depth (Rpm) parameter measures the mean value of the leveling
depths of five consecutive sampling lengths. The leveling depth (Rp) is
also the largest of the five leveling depths. The maximum roughness depth
(Rt), peak to valley height is the vertical distance between the highest peak
and the lowest valley of the roughness profile R within the evaluation
length l. Rpm = 1/5 (Rp1 + Rp2 + Rp3 + Rp4 + Rp5) (Mair 1992; Poon
1995)

- 23 -
1.1.5.2 Three Dimensional (3-D) Surface Texture Analysis
The SEM image formation process is based on “perspective projection” and, similar to
conventional light microscopy, a three dimensional object is projected onto a two dimensional
image plane with the loss of the information in the third dimension. SEM provides a large
depth of focus, but does not allow depth measurements and thus only two dimensional
measurements are feasible.
A eucentric tilting of the SEM stage, which means that the intersection of the primary electron
beam with the specimen defines the centre of tilting, yields a second image of a material
specimen observed from a different viewpoint. In this way a stereoscopic image is generated.
Subsequently, overlay techniques including red-green colouring provide anaglyph viewing
and thus depth perception but at this stage, no quantitative analysis can be undertaken.
Utilising analysis software (MeX, Alicona), reference points called “homologous points”, can
be aligned on each image taken. This allows the true three dimensional (3D) coordinates of
the observed points to be recovered. Each point is a single pixel. A third image, from a third
tilt position, allows the software to generate a dense 3D model of the material surface, from
which measurements can be made. Traditional surface texture analysis only utilises two
images, and thus the third image allows improved accuracy by a reduction of error
influencing variables such as the stage tilt angle. Figure 17 shows an overview of the imaging
process.
The MeX software utilises EN/ISO standards for material surface area and texture analysis
and can also measure material volume.

- 24 -
Figure 17. Image acquisition and construction of the 3-D representation of the material
surface with MeX software. (from http://www.alicona.com)

- 25 -
This form of surface texture analysis has been employed in the analysis of bone and tooth
surfaces in fossil specimens (Bello et al 2011) and perikymata (Bocaego et al 2011). Both
reported that a detailed 3D model of the surface can be constructed from the series of images,
calculating x, y, and z coordinates for any point within the scan images with a resolution of up
to 0.4µm horizontally and 0.01µm vertically.
The tilting of the stage enables the elimination of errors related to the steepness of slopes. For
instance, historically with microscopic analysis, slopes of 80º or more were unmeasurable.
The stage tilting approach allows the accurate measurement of peaks with slopes greater than
80º (Bello et al 2011).
The 3D model is rendered as a rotatable, shaded image by the MeX software. Prior to
analysis, the plane to which all the measured points are referenced is adjusted to correct for
bias introduced by the stereoscopic images (Bello et al 2011). This process involves
numerical algorithms based upon pixel-to-pixel image intensity and depth. Subsequently, a
profile path oriented perpendicular to the line of the surface irregularities is defined on each
image field. Following filtering of the high-frequency irregularities on the profile, which
separates the roughness from the waviness and the overall geometrical form of the surface, the
coordinates of the profile path are used to construct a quantitative profile diagram (Bocaege et
al 2010). This diagram represents a selected part of the profile path that is delimited according
to internationally standardised surface roughness parameters (ISO 4288). The profile diagram
is able to reveal many structural irregularities on material surfaces that are quantifiable.
The two-dimensional measurements are made along a single line between two points at a
given distance and the measurements are taken in a two-dimensional manner. The 3D method
here requires a rectangular surface area to be scanned and selected which results in a
significantly larger field and importantly a larger sample area from which 3D interpretation
can be made (Figure 18).

- 26 -
Figure 18. 3D Diagram of material surface generated with MeX software.
The surface texture analysis using the 3D technique described here results in five measurable
variables which are comparable to those attainable by 2D methods. The 3D variables are
measured in nanometers (nm) and include:
Sa: Average height of selected area
Sq: Root-Mean-Square height of selected area
Sp: Maximum peak height of selected area
Sv: Maximum valley depth of selected area
Sz: Maximum height of selected area

- 27 -
1.1.6 Tribology
Multiple definitions for tribology exist. In its simplest terms, Mair (1992) defined it as “the
study of friction, lubrication, and wear”. An important, basic principle in wear studies that is
not often appreciated is that no known surface is perfectly smooth, and under magnification
surfaces will appear wavy and rough to varying degrees (Kragelskii 1965). When considering
two surfaces being brought into contact, the contact is “point to point”, and the number of
contacts increases as the surfaces are brought closer together by increasing force. In a
dynamic process, these contacts also change over time.
Halling (1975) described how the interaction of two solid surfaces within a given
environment results in two phenomena. Firstly, there is energy dissipation which is the
resistance to motion and is indicated by the coefficient of friction. This energy dissipation
results in a heat release at the contact and noise. Secondly, during the sliding process all
surfaces are to a greater or lesser extent changed in their basic characteristics. They may
become smoother or rougher, have physical properties such as their hardness altered, and
some material may be lost in the process.
Halling (1975) also stated that the consequence of the dynamic interaction of two surfaces is
the “wear process” which involves a variety of factors that are difficult to quantify. He went
on to define wear as “the progressive loss of substance from the surface of a body brought
about by mechanical action”. Earlier, Kragelskii (1965) had defined wear as "the destruction
of material produced as a result of repeated disturbances on the frictional bonds”
Generally in tribology, there are several definitions used for various types of wear. They have
been classified by Pugh (1973) as: abrasive wear; adhesive wear; fatigue wear; corrosive
wear; erosive wear; and fretting wear.

- 28 -
Importantly, even though some of the terminology overlaps with that used by dentists the
definitions of the terms are very different.
1.1.6.1 Abrasive wear
Mair (1992) reported that abrasive type wear is the most common and defined it as the cutting
away of a surface by abrasive asperities or particles. Abrasive wear occurs as a result of
asperities ploughing into a softer surface which results in either plastic deformation without
the removal of material, or low cycle fatigue which results in material loss as demonstrated in
Figure 19 (Mair 1992, Mair 1996).
Figure 19. Abrasive wear (from Mair 1996)
Several factors have been noted by Mair (1996) and Halling (1975) as influencing abrasive
wear. These include the hardness of the contacting materials; abrasive particle geometry; load
applied; and the distance of the slide contact.
There are two forms of abrasive wear, namely “two-body” and “three-body” wear. Two-body
wear occurs as a result of two opposing surfaces wearing against each other directly as
demonstrated in Figure 20 (Mair 1992; 1999).

- 29 -
Figure 20. Two-body abrasive wear (from Mair 1999). Both surfaces are brittle and there
is subsequent fracture of the asperities. The lower surface is “softer” than the
upper surface which “plows” into the softer surface.
Figure 21 shows three-body wear, which occurs when a third “body” of abrasive particles is
interposed on the wear interface between two opposing surfaces which are being rubbed
together. Three body wear commonly follows an initial two-body wear period (Mair 1992;
Mair 1996).
Figure 21. Three-body abrasive wear (from Mair 1999). The abrasive particles in the
slurry flow under pressure and cut away the surfaces.

- 30 -
1.1.6.2 Adhesive wear
Adhesive wear is the result of “cold welding” of the protuberances of contacting surfaces due
to friction between two moving surfaces (Mair 1992; Mair 1996; Halling 1975; Zum-Gahr
1987). As the movement continues, the welds are sheared, which if it occurs at the subsurface
level results in the deposition of the separated material onto the opposing surface. With
further movement, this material may form a loose particle “third-body” of material which
results in abrasion. This process is illustrated in Figure 22 (Mair 1996).
Figure 22. Adhesive wear (from Mair 1996). This Figure shows the “cold welding” and
detachment of material.
1.1.6.3 Fatigue wear
Fatigue wear results when two surfaces moving under dynamic loads cause the formation and
propagation of subsurface micro-cracks. Loss of material occurs via delamination due to the
growth and propagation of subsurface micro-cracks resulting from cyclical loading of the
opposing surface layers with repetitive compressive, tangential and tensile stresses, as shown
in Figure 23 (Mair 1992; Mair1999).

- 31 -
Figure 23. Fatigue wear (from Mair 1996). A rolling action of two surfaces causes
shear subsurface stresses which result in nucleation of cracks which
propagate laterally to the material surface with the continued rolling action
resulting in delimitation and fatigue wear or failure.
Suh (1973) introduced the theory of delamination to fatigue wear. Delamination is defined as
the formation of fractured surface material or “chips” and occurs after a critical number of
loading cycles when the surface material becomes surrounded by a network of linked cracks.
The breakup of the material surface increases the risk of the formation of larger fragments
which leads to larger pits on the surface (Suh 1973; Jahanmir 1994).
The rate at which fatigue wear occurs is non-linear and behaves much differently from
adhesive or abrasive wear. With fatigue, negligible wear occurs prior to the point of surface
fracturing, whereas in both adhesive and abrasive wear mechanisms, there is a gradual
deterioration of the surface. The time to fatigue failure is dependent on several factors
including the amplitude of the reversed shear stresses, the interface lubrication conditions, and
the fatigue properties of the materials (Mair 1992; Mair 1999). It has been shown that
adhesive wear can exacerbate surface fracturing and delamination by weakening the
subsurface thus allowing adhesive forces to “pluck out” the surface fragments (Suh 1973).

- 32 -
1.1.6.4 Corrosive (Tribochemical) wear
Corrosive wear is the wear process involving the chemical degradation of a surface that is
rubbed away by an opposing surface and differs from corrosion which is a static chemical
degradation of a surface (Mair 1992; Helling 1973; Zum-Gahr 1987). In a static environment
the products of corrosion form a barrier which slows the rate of corrosion. When there is a
rubbing or sliding action, this protective barrier is worn away, exposing the original material
and allowing the corrosive attack to continue (Mair 1996). This process is illustrated in Figure
24.
Figure 24. Corrosive wear. This process results from a sliding movement of opposing
materials in a corrosive environment (from Mair 1996).
1.1.6.5 Erosive wear
Plugh (1973) described erosive wear as damage occurring in a solid body by the impact of
external particles or fluid under pressure. The wear medium here is particles or fluid which
acts as the second surface. An example is the erosion of rocks by water.

- 33 -
1.1.6.6 Fretting wear
Halling (1975) defined fretting wear as wear resulting from the low amplitude vibratory
motion that takes place between two surfaces when they are loaded together. Mair (1992)
stated that there is no evidence that fretting wear occurs in the mouth and is thus not relevant
regarding dental wear.
Tribology concepts are based on the observations of tribologists on a micro- and nano-scale.
The understanding of the mechanical and chemical engineering principles of the wear process
aids the interpretation and understanding of the macro-level wear of dental tissue. Dental
terminology has generally been used in this project other than when the alternative, more
specific tribology terminology allows a clearer explanation of an observation or process.
1.2 Relevant Dental Materials
In this section relevant properties of each of the materials included in this study are reviewed
to provide a background for the interpretation of the results.
1.2.1 Acrylic Prosthetic Teeth
Acrylic resin denture teeth present advantages over porcelain denture teeth. These include:
being less brittle; superior bonding to acrylic denture base materials; ease of adjustment and
polishing, a more natural appearance; and, less noise produced during mastication (Mello
2009).
Historically, acrylic teeth have shown a higher wear rate compared with porcelain denture
teeth which has longer term implications for the maintenance of function and occlusal vertical

- 34 -
dimension. Significant improvements have been made in the formulation of acrylic denture
teeth to improve their mechanical properties. These improvements include an interpenetrated
polymer network (IPN), polymers with double-cross links (DCL), and resin teeth with added
inorganic agents (Mello 2009).
Polymethyl methacrylate (PMMA) was developed in the 1930s by chemists Rowland Hill and
John Crawford and was first registered as Perspex®. It is a synthetic resin produced by the
polymerisation of methyl methacrylate and is commonly used in the manufacture of denture
teeth
Methyl methacrylate is an ester of methacrylic acid (CH2=C[CH3]CO2H) obtained primarily
from propylene, a compound refined from the lighter fractions of crude oil. Propylene and
benzene are reacted together in order to form cumene, or isopropylbenzene; the cumene is
then oxidized to cumene hydroperoxide, which is treated with acid to form acetone. Acetone
is in turn converted in a three-step process to methyl methacrylate (CH2=C[CH3]CO2CH3).
Methyl methacrylate, in bulk liquid form or suspended as fine droplets in water, is
polymerized under the influence of free-radical initiators to form solid PMMA (Anusavice
2003).
The chemical structure of the polymer repeating unit is:
.
The presence of the pendant methyl (CH3) groups prevents the polymer chains from packing
closely in a crystalline fashion and from rotating freely around the carbon-carbon bonds. As a
result, PMMA is a tough and rigid material.

- 35 -
1.2.2 Nano-Ceramic Composite Resin (LAVA Ultimate, 3M ESPE)
Lava Ultimate Resin Nano Ceramic (RNC) is a novel dental material designed specifically for
CAD/CAM (Computer Aided Design/Computer Aided Manufacture) use for dental
restorations (Figure 25).
Figure 25. LAVA Ultimate CAD/CAM blocks
(http://www.3m.com/3M/en_US/Dental/Products/Lava-Ultimate/)
The material consists of nano-ceramic particles (80%wt) embedded in a highly cross-linked
resin matrix (20%wt). Aspects of the manufacturing are proprietary process secrets (3M
Company information). The nanometer particles are mono-dispersed, non-aggregated, and
non-agglomerated nanoparticles as shown in Figure 26.
Figure 26. Nano-ceramic aggregates (http://www.3m.com/3M/en_US/Dental/Products/Lava-
Ultimate/)

- 36 -
LAVA Ultimate restorative contains two types of nanoparticles: silica nanomers of 20nm
diameter, and zirconia nanomers of 4-11nm diameter. The nanomers are treated with a silane
coupling agent which bonds to the nano-ceramic surface and the resin matrix during block
manufacture. The “nano-cluster particles” consist of bound aggregates of engineered
nanoparticles. The nano-clusters have structural integrity that allow a high proportion of
ceramic filler to be incorporated into the blocks which provides strength and both fracture and
wear resistant properties. The average nanocluster size is 0.6-10µm. The LAVA Ultimate
Flexural strength is reported to be 200MPa.
1.2.3 Ceramics
1.2.3.1 Historic Background
Ceramic use in dentistry originated in 1774 when Alexis Duchateau, a French apothecary, and
a Persian dentist, Dubois de Chemant fabricated porcelain paste for denture construction as an
alternative to ivory which absorbed oral fluids, stained and was unhygienic (Jones 1985; Van
Noort 1994; Craig 2006). Following de Chemant’s immigration to Britain, he collaborated
with the Wedgewood porcelain factory to manufacture porcelain paste for dentures (Jones
1985; Craig 2006).
In 1808 an Italian dentist, Giuseppangelo Fonzi fabricated the first porcelain dental crown for
use in complete dentures (Craig 2006). These early porcelains were opaque, and it was not
until 1838, when an American dentist Dr Elias Wildman improved the formula, that
translucency and “tooth colours” were introduced. This formula had increased amounts of
feldspar and eliminated kaolin (Kelly et al 1996).

- 37 -
In 1849, the Dentist Supply Company made a significant advancement by improving
translucency and colour through the introduction of vacuum firing (Kelly et al 1996) and later
an American dentist Dr Charles H Land patented a technique of fusing porcelain to thin
platinum foil pioneering the process for fabricating the porcelain - metal crown (Zeilgler
1905).
1.2.3.2 Dental Ceramics
The word “ceramics” originates from the Greek word “keramos” which means “burnt
material” (Giordano 1996; Rosenblum and Schulman 1997). The use of the word “ceramic” in
dentistry refers to inorganic crystalline materials that are fired at high temperatures in order to
achieve desired properties (Craig 2006; Rosenblum and Schulman 1997). The dental term
encompasses materials used for veneering, core structure, and one piece (monolithic)
restorations (Naylor 2009).
Dental ceramics generally exhibit many desirable properties for dental restorations such as:
biocompatibility; high compressive strength; aesthetics; low thermal conductivity and
diffusivity; abrasion wear resistance; colour stability; and reduced plaque accumulation
compared with other dental materials (McLean 1979; 1984). Dental ceramics do have
limitations however, including: brittleness; low fracture toughness; and low tensile strength
(Zheng and Zhou 2006; 2007; Anusavice 2003).
1.2.3.3 Structures of Dental Ceramics
Dental ceramics or porcelain consist of a crystalline silicon-oxygen network such as quartz,
feldspar and/or alumina, and an amorphous glass-forming matrix. These form a large three-
dimensional network of silica tetrahedra which are connected by oxygen atoms (Figures 27,

- 38 -
28, and 29) (Mclean 1979; Oh et al 2002). The amount of glass and crystal varies depending
on the porcelain formulation (McLean 1979).
Figure 27. Diagram of a silica unit with each SiO terahedra sharing an oxygen
atom. (from McLean 1979).
Figure 28. Three dimensional drawing of a silica unit in which the silicon
atom Si is surrounded by four oxygen atoms
(from McLean 1979).

- 39 -
Figure 29. Three dimensional drawing of linked silicate units which form the
continuous network in glass
(from McLean 1979).
When considering improving properties of dental ceramics such as low-fusing temperature,
high viscosity, and resistance to detriviation, oxides of potassium, sodium, aluminium, and
boron can be added (McLean 1979). Metal oxides can also be added to provide the porcelain
with various colours. In addition of starch and sugar may be added to the porcelain powder
for easier manipulation (Van Noort 1994).
Following firing, there are two main “phases” that make up the ceramic. These are the
“crystalline phase” and the “glass phase”. The relative amount of each of these phases varies
between porcelain type. The proportion of leucite in the crystalline phase, and the heat
treatment time are affected by the K2O content (McLean 1979). Feldspar (potash feldspar), a
potassium aluminium silicate (K2O.Al2O3.6SiO2), is the main ingredient of classic porcelains
used for veneers and metal-ceramic crowns. At 1150oC (considered a “high” temperature)
feldspar melts and fuses with quartz to form leucite (KAlSi2O6 or K2O.Al2O3.4SiO2) with a
tetragonal structure (crystalline phase) and molten glass with an amorphous structure (glass
phase) (Craig 2006). As much as 85% of total volume can be comprised of glass matrix. The
volume of leucite may range from 10%-35% depending on formula. This process where a
material melts to create a liquid and a different crystalline material is called “incongruent
- 40 -
melting” (Anusavice 2003; Denry 1996). The leucite crystals are formed by a process called
“surface crystallisation” as the porcelain is heated to between 700oC and 1200
oC, where
crystals grow slowly along grain boundaries towards the centre of the grain (Anusavice 2003;
Denry 1996).
Each phase of the ceramic material contributes to its individual mechanical and optical
properties. The glass phase is responsible for properties including brittleness, translucency,
and a non-directional fracture pattern. The feldspathic leucite crystalline phase is responsible
for the thermal and mechanical behaviour of the porcelain which are dependent on the
distribution and size of the crystals. Leucite crystal phase enhances porcelain strength, optical
properties, fracture toughness, and hardness (Rosenblum and Schulman 1997; Craig 2006).
The high thermal expansion of leucite improves control of the porcelain’s thermal expansion
coefficient, depending on the amount present which generally ranges 10-20%. Matching the
thermal contraction characteristics between metal crown copings and overlaying porcelain
reduces internal stresses which are a common cause of porcelain cracking and delamination
which is a common cause of failure of metal ceramic restorations (Anusavice 2003). Leucite
has limitations as it is a relatively unstable phase and thus, repeated firing cycles, slow
cooling, and extended heat soaks can affect the leucite content and the overall mechanical
properties of porcelain (Kelly et al 1996).
The amount of potash present, the firing temperature, and the length of time porcelain is held
at high temperatures affect the extent of leucite crystal formation (Kelly and Benetti 2011).
The leucite content can be increased or decreased depending on the number of firings and
slow cooling. “Secondary crystallisation” is the process whereby the leucite crystal quantity
increases with subsequent firings, thus increasing the coefficient of thermal expansion with
each firing cycle. Firing at temperatures that are too high can cause the leucite crystals to

- 41 -
dissolve into the glass matrix which reduces the crystalline phase volume, thus lowering the
coefficient of thermal expansion and weakening the ceramic (Anusavice 2003).
Quartz (SiO2) or “silica” possesses a high fusion temperature and acts as a framework around
which the other porcelain ingredients can flow. Quartz stabilises the porcelain at high
temperatures and, along with potash feldspar, prevents the porcelain from undergoing
pyroplastic flow on the metal substructure during the sintering process and results in a
stronger fired porcelain (Muia 1982). The hardest and strongest component of porcelain is
alumina (Al2O3). The water molecules naturally attached to alumina are removed resulting in
alpha alumina, which is ground into a fine powder (McLean 1979). The addition of alumina
increases the viscosity of the melt and the overall strength of the porcelain.
Dental porcelain is considered chemically stable and thus does not deteriorate over time.
Porcelain also has a similar thermal conductivity and coefficient of thermal expansion to tooth
enamel and dentine, as well as high compressive strength and low tensile strength (Van Noort
1994). Craig (2006) outlined selected physical properties of dental porcelain and enamel
(Table 2).
Table 2. Selected physical properties of dental porcelain and enamel. (from Craig
2006).
Feldspathic Porcelain Enamel
Tensile Strength (MPa) 25 10
Compressive Strength
(MPa)
149 384
Elastic Modulus (GPa) 69-70 84
Fracture Toughness (KIC) 0.9-1.0 0.7-1.3

- 42 -
Although very strong, dental porcelain has two concerns. Firstly, it is brittle and can fail
catastrophically, and secondly, it has been shown to adversely wear opposing teeth which is a
general concern in restorative dentistry (Giordano 1996; Rosenblum and Schulman 1997).
Kelly (2011) formulated an overview of dental ceramics based on the physical properties of
fracture toughness and bending strength (Figure 30).
Figure 30. Classification of dental ceramics based on the physical properties of fracture
toughness and bending strength (from Kelly and Benetti 2011).
1.2.3.4 Classification of dental ceramics
Many methods have been proposed in order to classify dental ceramics including: fusion
temperature; fabrication method; crystalline composition and phase; and clinical application.
- 43 -
1.2.3.4.1 Fusion temperature
Fusion temperature outlines the temperature range at which the ceramic particles fuse
together, as the melting process does not occur at a specific temperature. This has been used
to classify ceramics since the 1940’s and has been described by Craig (2006) in four main
groups:
High-fusing: 1315℃ - 1370℃
Medium-fusing: 1090℃ - 1260℃
Low-fusing: 870℃ - 1065℃
Ultra low-fusing: <870℃
1.2.3.4.2 Clinical Application
Craig (2006) outlined three major applications for ceramics in dentistry:
Veneering metal substructures
Indirect all-ceramic restorations including crowns, bridges, inlays, onlays
and veneers
Ceramic denture teeth
1.2.3.4.3 Crystalline composition
Ceramic classification based on composition or microstructure results in four main groups
(McLaren 2009):
Glass based systems (mainly silica)
Glass based systems (mainly silica) with fillers (crystalline such as leucite
or more recently lithium disilicate)
Crystalline-based systems with glass fillers (mainly alumina)
Polycrystalline solids (alumina and zirconia)

- 44 -
As an alternative, Kelly and Benetti (2011) proposed three main categories including:
predominantly glass; particle filled glass (with a subgroup called “glass ceramics”); and fully
polycrystalline (Figure 31).
a. b.
c.
Figure 31. Schematic representation of three basic classes of dental ceramics. (a)
Predominantly glass-based ceramics, the weakest of all groups, are lightly
filled with opacifiers and colorants to mimic natural tooth aesthetics. (b)
Glass containing 35-70% filler particles to improve strength are moderately
aesthetic as full contour restorations. (c) Completely polycrystalline (no
glass) ceramics. These can be used for frameworks or full contour
restorations (from Kelly and Benetti 2011).
1.2.3.4.3.1 Glass-based systems
Predominantly glass-based ceramics are an amorphous three-dimensional network of atoms
with an irregular pattern of spacing and arrangement. These are derived primarily from
feldspar and are based on silica (silicon oxide) and alumina (alumina oxide). They are known
as “feldspathic porcelains” (glass ceramics) and are a member of the aluminosilicate family of

- 45 -
materials. This group of ceramics most closely resemble the optical properties of natural
enamel and dentine (Kelly and Benetti 2011; McLaren 2009).
Some of the advantages of glass-based ceramics include resistance to devitrification
(crystallisation) during firing and an extended temperature firing range, which resists
slumping when temperatures are higher than optimal. They are also biocompatible.
These materials have multiple uses including veneering core structures (including metal,
zirconia, or alumina), use as monolithic veneer materials, and in a CAD/CAM block form
(e.g. Vita mark 2™ for Cerec™) (McLaren 2009).
These ceramics are composed primarily of: silica (SiO2) 64%; alumina (Al2O3) 18%; and
potash (K2O) and soda (Na2O) in various amounts (Giordano 1996).
1.2.3.4.3.2 Glass-Based Systems with fillers
These ceramics have a large range of crystal types and glass-crystalline ratios and are
commonly subdivided into three categories. Although the glass composition is essentially the
same as the predominantly glass category, the crystal phase consists of different types and/or
amounts which have been added or grown in the glass matrix (McLaren 2009). The primary
crystal types used are leucite, lithium disilicate, or fluorapatite (McLaren 2009).
Leucite crystals are created by increasing the potash (K2O) content of the alumino-silicate
glass matrix, which also lowers the ceramic melting temperature.
1.2.3.4.3.2.1 Low-to-moderate leucite containing (<50%) feldspathic glass
This sub-category has become commonly known as “feldspathic porcelains”. Leucite is added
to raise the coefficient of thermal expansion (CTE) of the material to allow addition to metals

- 46 -
and polycrystalline substructures (the amount of leucite is dependent on the material being
veneered). This group of materials can also be used for veneers. They are usually in a liquid
and powder form and have a random size and distribution of leucite crystals with a high
average size of 20µm (McLaren 2009; Kelly and Benetti 2011).
The large particle size and random distribution results in relatively low fracture resistance and
high abrasivity towards natural tooth enamel. The later generations of this material (such as
Vita VM13™) have a finer leucite crystal and consistent particle distribution throughout the
glass matrix which results in improved flexural strengths and reduced abrasivity (McLaren
2009).
1.2.3.4.3.2.2 High-leucite containing (50%) glass
This sub-categories glass matrix is also based on alumino-silicate glass and is known as a
“glass ceramic” which has had the crystalline phase grown within the glassy matrix through a
“controlled crystallisation of glass” process. This material is available in three forms; powder-
liquid, machinable, and pressable. The most widely used commercial product in this group is
IPS Empress™ (Mclaren 2009; Kelly and Benetti 2011).
The fracture resistance of this group is based primarily on the material fabrication processing
technique than the crystal type, amount, and distribution of the crystals within the glass
matrix. The pressable and machinable forms have much higher fracture resistance than the
powder-liquid variant (Mclaren 2009; Kelly and Benetti 2011).
1.2.3.4.3.2.3 Lithium Disilicate containing (70%) glass
The commercial version of this material is known as eMax™ (formerly IPS Empress II™).
The alumino-silicate glass has lithium oxide added and the crystals that form are needle-like
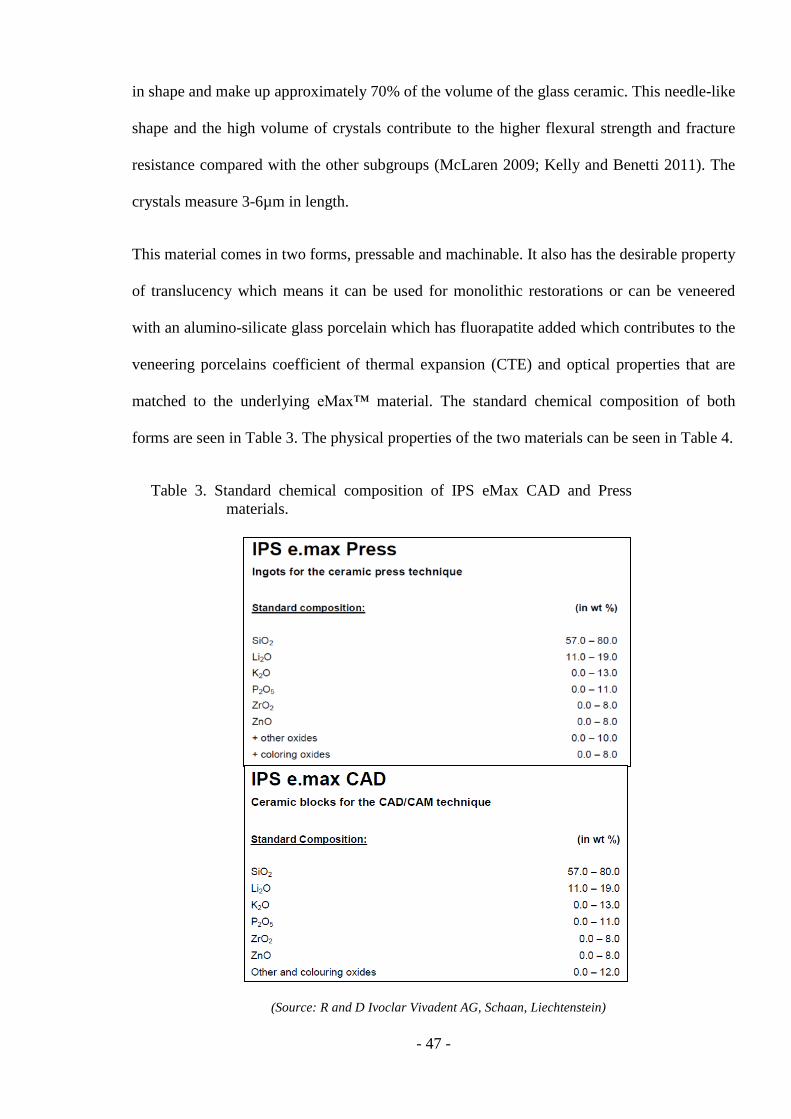
- 47 -
in shape and make up approximately 70% of the volume of the glass ceramic. This needle-like
shape and the high volume of crystals contribute to the higher flexural strength and fracture
resistance compared with the other subgroups (McLaren 2009; Kelly and Benetti 2011). The
crystals measure 3-6µm in length.
This material comes in two forms, pressable and machinable. It also has the desirable property
of translucency which means it can be used for monolithic restorations or can be veneered
with an alumino-silicate glass porcelain which has fluorapatite added which contributes to the
veneering porcelains coefficient of thermal expansion (CTE) and optical properties that are
matched to the underlying eMax™ material. The standard chemical composition of both
forms are seen in Table 3. The physical properties of the two materials can be seen in Table 4.
Table 3. Standard chemical composition of IPS eMax CAD and Press
materials.
(Source: R and D Ivoclar Vivadent AG, Schaan, Liechtenstein)

- 48 -
Table 4. Physical properties of IPS eMax Press and CAD)
Physical Properties of IPS eMax™ Press CAD
CTE (100-400oC [10-6/K] 10.2 10.2
CTE (100-500oC [10-6/K] 10.5 10.5
Flexural strength (biaxial) [MPa] 400 360
Fracture toughness [MPa M1/2] 2.75 2.25
Modulus of elasticity [GPa] 95 95
Vickers hardness [MPa] 5800 5800
Chemical resistance [µg/cm3] 40 40
Press temperature EP 600 [oC] 920
(Source: R and D Ivoclar Vivadent AG, Schaan, Liechtenstein)
1.2.3.4.3.3 Crystalline-based systems with glass fillers
The first material in this category was introduced in 1988 as glass-infiltrated, partially
sintered alumina (In-Ceram™). This material has a sintered crystalline matrix that is 85% of
the volume with a junction of the particles in the crystalline phase. This contrasts with the
previously discussed ceramics which have a glass matrix and no junctions between crystals.
The crystalline phase may consist of alumina, alumina-zirconia, or an alumina-magnesia
mixture known as “spinell” and can be manufactured by slip casting or milling from a pre-
sintered block. The alumina or spinell framework is then infiltrated at high temperature with a
low-viscosity lanthanum glass (McLaren 2009; Kelly and Benetti 2011).
This material has a very high flexural strength (up to four times that of the previously
mentioned materials), which is due to the mainly crystal nature of the material. It is important
to note that the spinell version (alumina-magnesia) has half the strength of the alumina-
zirconia version (McLaren 2009; Kelly and Benetti 2011).

- 49 -
1.2.3.4.3.4 Polycrystalline solids
Polycrystalline solid-sintered monophase ceramics are formed by directly sintering crystals
together without an intervening matrix to form a dense, glass-free, air-free polycrystalline
structure. The frameworks may be either solid-sintered aluminous-oxide or zirconia-oxide
(McLaren 2009). There were two significant developments in the 1980’s which allowed the
use of these materials in dentistry; the availability of highly controlled starting powders; and
the use of computers in ceramic processing (Ritter 2010).
There are three techniques for fabricating solid-sintered, mono-phase, ceramic frameworks for
porcelain application. These are:
1. DCS Precident™. This process machines the final desired framework shape from
a solid sintered block of material.
2. Procera™. This uses a virtual oversized die where a slurry of either aluminous
oxide or zirconia-oxide is applied and subsequently fired. It fully sinters and
shrinks to fit the die.
3. Zirconia. This process machines an oversized coping from a partially sintered
block of zirconia-oxide material, which is subsequently fired to full sintering
temperature. The material shrinks to fit the die.
The zirconia form has improved physical properties (see Table 5) compared with the alumina
variant which results in a material that is twice as tough and strong. Its flexural strength range
is 900-1,100MPa, although there is no correlation between flexural strength and clinical
performance of materials even though some authors suggest this is an advantage (McLaren
2009; Anusavice 2003; Kelly and Benetti 2011). Zirconia ceramic also has a fracture
toughness, which is a measure of a material’s ability to resist crack growth, of 8-10MPa

- 50 -
which is significantly higher than other dental ceramics and has been reported as a benefit for
this material.
Table 5. Tetragonal Zirconia Polycrystals 3Y-TZP: Mechanical and
Physical Properties.
Equiaxed grains µm D 0.2-0.5
Flexural strength MPa 800-1200
Fracture toughness MPa m1/2 6.1-8.5
Weibull modulus 10-18
Porosity % 8.1-11.5
Threshold Intensity factor MPa m1/2 3.1
Critical crack Intensity MPa m1/2 7.4
Thermal Conductivity Wm-1K-1 2
One of the reported concerns with zirconia framework restorations that are veneered has been
a relatively high incidence of fracture of the veneering porcelain (Al-Amleh et al 2010).
These limitations have led to the introduction of several monolithic or “full contour” zirconia
dental restoration materials along with the development of CAD/CAM systems for the
manufacture of these restorations. There is little clinical data on the performance of these
monolithic zirconia restorations, however anecdotal evidence suggests its use in restorative
dentistry is growing.

- 51 -
1.3 In-Vitro Dental Material Tribology
1.3.1 General Considerations in in-vitro acrylic denture tooth testing
There is significant complexity in the process of opposing dental material wear as there are
many factors which are difficult to control in the laboratory. Although, in-vitro wear testing
does provide a valuable research tool as a large number of tests can be run safely and thus a
large amount of relevant information and data can be obtained within a relatively short period
of time. This type of research design can also assess individual factors which may be related
to material wear.
In-vitro testing does however have some short comings for instance when trying to compare
data or findings from different studies or when trying to extrapolate in vitro study data to the
clinical situation (Ghazal et al 2008). This shortcoming is a concern as there is significant
variability in the study instrumentation, materials and protocols, and each of these parameters
can influence wear mechanisms (Jahanmir and Fischer 1994; Lawn et al 1984; Fisher et al
1983). Examples relevant here include: the wide range of wear machines; the contact
geometry; the loading protocols; chemistry; and flow of lubricants in the in-vitro wear studies
(Seghi et al 1991; DeLong et al 1986; Hacker et al 1996; Krejci et al 1994; Mahalick et al
1971; Monasky and Taylor 1971; White 1993). Other influencing factors may include:
contact pressure; material microstructures and physical properties; friction; third body
characteristics; and chemicals or medium, all of which will influence the mechanism(s) of
wear.

- 52 -
1.3.2 Material Wear Quantification
Tooth and material wear quantification has been historically undertaken via a number of
methods. In 2001, ISO standards relating to two or three body wear were updated regarding
recommendations and eight different wear assessment methods are discussed. (ISO 2001
Guidance on testing of wear) If different instruments are used, inaccuracies can result which
reduces the validity of the data when comparing different studies and when determining
dental material rankings.
Early studies of tooth wear investigated individual pre- and post-wear sample weight.
However, over time, methods with improved accuracy were introduced to overcome errors
associated with water uptake by tooth structure or dental materials during the testing process.
The more accurate methods involve microscopic specimen contour/volume assessments, and
recently, scanning specimens and the use of individualized software to quantify the material
sample volumes. The literature generally includes assessment methods such as sample height
loss (Ghazal et al 2008, Al-Hiyastat et al 1998; Elmaria et al 2006: Esquivel-Upshaw et al
2006: Etman et al 2008; Fisher et al 1983; Kadokawa et al 1906; O’Kray and O’Brian 2005;
Ramp et al 1999; Ramp et al 1997), volume loss (Ghazal et al 2008; Alarcon et al 2009 ;
Metzler et al 1999; Palmer et al 1991), weight loss (Monasky and Taylor 1971), and wear
surface area (Clelland et al 2003). Height and volume measurements have been performed
with a stereomicroscope with a micrometer-calibrated movable platform (Palmer et al 1991)
or a reflex microscope (Al-Hiyasat et al 1998), although the most common and effective
technique for measuring height and volume loss is scanning profilometry (Ghazal et al 2008;
Elmaria et al 2006; Esquivel-Upshaw et al 2006; Etman et al 2008; Kadokawa et al 2006;

- 53 -
O’Kray and O’Brian 2005; Ramp et al 1999; Ramp et al 1997; Alarcon et al 2009; Metzler et
al 1999; Clelland et al 2003).
1.3.3 Standardising wear simulation research protocols
The lack of standardization of in vitro material wear protocols has been cited as being a
limitation to the results attained (Ghazal et al 2008). It is generally concluded that the
standardisation of protocols would significantly improve the quality of dental wear studies by
facilitating comparisons and improving extrapolation to the clinical situation. Despite efforts
in the dental community, the International Standards Organization (ISO) Technical
Committee 106 (dentistry) has been unable to reach a consensus on the standardisation of
dental related material wear testing protocols (Condon and Ferracane 1996). The committee’s
statement outlined that despite the many wear tests being used and proposed for dental
materials, there is no one generally accepted method and none of the in vitro wear simulators
used have been developed based on direct intra-oral observations of mechanisms of damage
accumulation (Condon and Ferracane 1996). The committee’s report also concluded that due
to the extensive variability in research methodologies, it is not surprising that differences in
results and outcomes occur even when studies are examining the same materials (Krejci et al
1994; Grossman 1991; DeLong et al 1992).
1.3.4 Dental Sample Material Test Parameters
In vitro wear simulation and testing between dental materials and natural dental hard tissues
commonly use prepared enamel specimens from extracted molars or premolars where the
tooth structure acts as the antagonist and is worn against a flat material sample. Other research

- 54 -
and testing parameters lack any standardisation and thus no thorough analysis including meta-
analysis has been performed on specific categories of natural and/or artificial dental materials.
There are several test parameters which vary significantly in the literature. These include: the
type of tooth contact or chewing simulator; the applied force; the cycle number and
frequency; the form of lubricating medium if any; the pH of the lubricant; the inclusion of
exogenous abrasive materials; the geometry of samples (Czichos 1986; Denry 1996; DeLong
et al 1992).
1.3.4.1 Tooth contact (chewing) simulators
Many different chewing or wear simulators are described in literature. These include: pin to
disc simulators (Alarcon et al 2009; Clelland et al 2003; Kadokawa et al 2006); Willytec
(Ghazal et al 2008); University of Alabama (Kadokawa 2006); Oregon health sciences
university (Clelland et al 2003; Clelland et al 2001); Leinfelder (Ramp et al 1999; Alarcon et
al 2009); the closed loop servo hydraulics (Magne et al 1999), as well as various custom wear
simulators (Al-Hiyasat et al 1998).
1.3.4.2 Loads applied to specimens
Past wear studies have published a wide variety of applied loads during testing. The units for
measuring load also vary depending on the origin of the study and include: grams; kilograms;
pounds; or Newton (Elmaria et al 2006; Ranjitkar et al 2008; Shabanian and Richards 2002).
The range of loads is large with 0.75N being the lowest reported, and 80N being the highest
(Ramp et al 1999; Ramp et al 1997; Kadokawa et al 2006; O’Kray and O'Brian 2005; Metzler
et al 1999, Magne et al 1999; Palmer et al 1991; Al-Hiyasat et al 1998; Ghazal et al 2008;

- 55 -
Alarcon et al 2009). Loads less than 32N have been reported as being insignificant as very
low wear rates have been reported, and loads greater than 160N have also been excluded as
they often result in catastrophic failure of the test material. Numerous authors have reported
that a load of approximately 50N is the mean value for physiologic biting force in non-
bruxing patients (Gibbs et al 1981) It has also been well demonstrated that by increasing the
load, the resultant material wear increases (Lutz et al 1992).
1.3.4.3 The number of cycles
The number of cycles or study duration of in vitro experiments must be planned to result in
sufficient wear or material loss to allow consistent and reliable measurements and comparison
within the study and between consecutive studies using the same parameters. Wear testing
between various natural and artificial dental materials have been reported to run from 5,000 to
1,200,00 cycles depending on the overall study protocol and material as well as study aims
(Fisher et al 1983; Elmaria et al 2006; O’Kray and O’Brian 2005; Ramp et al 1999; Ramp et
al 1997; Palmer et al 1991; Al-Hiyastat et al 1997; Al-Hiyastat et al 1999; Taylor et al 1989;
Hacker et al 1996; Monasky et al 1971; Kadokawa et al 2006; Ghazal et al 2008; Metzler et
al 1999; Alarcon et al 2009; Magne et al 1999, Albashaireh et al 2010; Stawarczyk et al
2012; Preis et al 2011; Ghazal et al 2009; Beuer et al 2012; Heintze et al 2006; Albrecht et al
2011; Ghazal et al 2008).
It has been uniformly cited that the amount of material wear increases with the increasing
number of loaded cycles (Fisher et al 1983; Elmaria et al 2006; O’Kray and O’Brian 2005;
Ramp et al 1997 and 1999; Palmer et al 1991; Al-Hiyastat et al 1997 and 1999; Taylor et al
1989; Hacker et al 1996; Monasky et al 1971; Kadokawa et al 2006; Ghazal et al 2008;

- 56 -
Metzler et al 1999; Alarcon et al 2009; Magne et al 1999). This increasing wear generally
follows a linear pattern but variation has been described (Hacker et al 1996; Richards 1990).
1.3.4.4 Lubrication and pH variations
Distilled water is the most commonly reported lubricating medium in dental material wear
studies (Ghazal et al 2008; Al-Hiyasat et al 1998; Fisher et al 1983; Ramp et al 1999; Ramp
et al 1997; Metzler et al 1999; Palmer et al 1991; Magne et al 1999). Artificial saliva has
been used as has tap water and even natural saliva (O’Kray and O’Brian 2005; Elmaria et al
2006; Kadokawa et al 2006; Monasky et al 1971; Hacker et al 1996; Kaidonis et al 1983). All
approaches have both theoretical and actual advantages and disadvantages. Distilled and tap
water offers a low cost and easy to use medium which has low corrosion qualities, however
they don’t perfectly mimic natural saliva. Artificial saliva also doesn’t mimic natural saliva
and also adds the variable of potential remineralisation (when testing enamel or dentine) and
thus influences results. Natural saliva denatures within a few minutes potentially influencing
results and making analysis and extrapolation difficult.
1.3.4.5 Material Specimen Geometry
In vitro studies mostly analyse flat specimens which as the specimens are easy to fabricate
and can be standardised. It is noteworthy that the flat specimens have been associated with
more wear of both the specimens and the antagonist material when compared to crown
specimens. This is believed to be the result of a greater surface contact area (Heintze et al
2008).

- 57 -
Studies have varied the form of the antagonist material. Various forms include various cusp
forms (Stawarczyk et al 2012) or balls (Ghazal et al 2009),
1.3.4.6 The outcome of in-vitro test parameter variation
Significant efforts have been made to standardise test parameters, methodologies, materials
and sample preparations. However, the variation and lack of consistency between studies have
made this impossible to date. The result is a lack of agreement on the ranking of specific
materials for tooth and dental material wear. Regarding the surface finish of ceramics, there
has been limited consistency between studies, however, more recently studies have agreed
that polishing or glazing are both effective methods in reducing surface roughness and thus
optimising the surface texture of the material (Heintze et al 2008, DeLong et al 1992; Jagger
et al 1995; de Silva et al 2006; Sarikaya and Guler 2010).
1.3.4.7 Factors influencing material wear when opposed by ceramic
Dental ceramics are generally considered resistant to wear and are abrasive to opposing
materials (McLaren 2009). Historically, the importance of polishing and reducing the surface
texture of ceramic occlusal surfaces was not appreciated and the impact on opposing
dentitions was noteworthy. Heintze et al (2008) reported that the severity of tooth surface
wear is influenced by dental materials as well as patient factors (Heintze et al 2008). Ceramic
material factors which can influence the rate of opposing material wear include physical,
micro-structural, chemical, and surface characteristics (Etman et al 2008; Esquivel-Upshaw et
al 2006). It has been reported that harder materials with higher surface roughnesses result in

- 58 -
higher opposing material wear. Two factors that contribute to this are crystal phase
concentrations and crystal sizes, with those that are smaller being less abrasive (Derand and
Vereby 1999). Patient factors that have been implicated in tooth wear include acidic or
erosive diets, dysfunctional occlusion, increased biting force, and parafunctional habits
(Heintze et al 2008).
Although investigators have proposed several physical factors as being predictors of wear, no
specific physical factors of ceramic materials have been universally identified (Lawn et al
1984; Heintze et al 1998; Jahanmir et al 1994; Fischer et al 1989). In the 1980’s, dental
ceramic surface hardness was thought to determine enamel wear (Lawn 1984). However
research during the 1990’s demonstrated that surface hardness alone is not a reliable predictor
of opposing dentition wear (Heintze et al 1998; Jahanmir et al 1994; Fischer et al 1989).
More recent studies have indicated that surface texture, especially surface roughness, has the
most influence on opposing material wear when compared to other dental ceramic physical
properties (Elmaria et al 2006; Monasky and Taylor 1971; Seghi et al 1991). It must be noted
that any reported “influencing” factors are derived from in vitro wear studies which have
shortcomings and may not have a direct clinical correlation (Etman et al 2008; Esquivel-
Upshaw et al 2006).
1.3.4.8 Dental ceramic physical micro structural properties
Physical properties of dental ceramics influence the polishability of the surface and also the
possible wear of the opposing material, whether it be an artificial or natural dental material
(Martinez-Gomis et al 2003). The exact influence of material physical properties including
hardness, fracture toughness, frictional resistance, leucite content, porosities, crystal

- 59 -
characteristics, creaming, and surface texture still face disagreement (Al-Wahadni and Martin
1999).
1.3.4.8.1 Hardness
The term hardness describes the resistance a material has to plastic deformation. It was
previously assumed that higher hardness values were associated with an increased rate of
opposing material wear. Recent studies, however, have shown that there is in fact no strong
correlation between hardness value and opposing material wear (Monasky and Taylor 1999).
The wear process appears to be more closely related to a materials microstructure, the surface
roughness of both contacting materials, and environmental factors including lubrication and
pH (Oh et al 2002; Magne et al 1999). Several reasons have been given in literature for the
weak correlation between material hardness and its ability to wear an opposing material. One
is that when materials such as dental ceramic and enamel wear against each other, the wear
process is not via plastic deformation as with metals, but is in fact via a process of fracturing
(Heintze et al 2008, Elmaria et al 2006). Another reason is that the micro-hardness of
crystalline ceramics varies depending on the orientation of the indenter to the crystals.
Finally, it may be due to the variability in the hardness between the glass matrix and the
crystals (De Long et al 1986). Thus, it is not surprising that relatively soft ceramics exhibit
more abrasive action against human enamel than harder ceramics, and the same may be said
for any opposing materials undergoing a wear process (De Long et al 1986).

- 60 -
1.3.4.8.2 Frictional Resistance
The term frictional resistance describes the resistance to lateral sliding of two materials in
contact with each other (Al-Wahadni and Martin 1999). This depends on a number of factors
including the relative motion, the properties and structure of the materials, and the
environment. An example is the friction between porcelain-to-porcelain contact points has
been reported at almost twice that of porcelain-to-acrylic contact points and approximately
three times that of enamel-to-enamel contacts (Zheng and Zhou 2006). Zheng stated that
roughness, high loads, and high sliding speeds have all been shown to increase the coefficient
of friction and thus materials wear (Zheng and Zhou 2006). All known finishing and polishing
methods still leave microscopic irregularities and it is the interaction between these
irregularities on opposing materials that determines the friction between them (Heintze et al
2008, Elmaria et al 2006). Aqueous environments such as saliva or lubricants are known to
reduce the surface hardness of dental ceramic materials which results in increased friction due
to adhesion at a microscopic level. Therefore, the outcomes of in vitro wear studies can be
influenced by the lubrication medium and may cause issues with wear result extrapolation
(Zheng and Zhou 2007).
1.3.4.8.3 Fracture Toughness
Fracture toughness refers to the resistance a material has to rapid crack propagation under
tensile stress (Oh et al 2002). This is an intrinsic property that depends on two factors. Firstly,
the stress intensity at a crack tip in the material, and the second factor is the crack size relative
to the micro structural features of the material in question including crystal size, aspect ratio,
porosity, and orientation and distribution of the glass phase. The fracture of ceramic materials

- 61 -
starts when the applied load produces a stress at the tip of a crack or material flaw. This type
of wear can start with the formation of a crack followed by slow crack propagation over time,
and then eventually catastrophic failure and fracture of the material. As plastic deformation
doesn’t apply, the influence of fracture toughness on ceramic material wear is significant (Oh
et al 2002, Zheng and Zhou 2007).
A materials surface roughness may increase as a result of brittle fracture if the material has
insufficient toughness to resist fracture. The brittle chips that are formed during the abrasion
process can further contribute to the wear process. Brittle fracture of ceramic materials can be
more pronounced when they are positioned adjacent to processing defects including porosity
and impurity inclusions, and they can also contribute to crack propagation under loading
(Zheng and Zhou 2007).
Heintze et al (2008) stated that as enamel has a lower hardness and fracture resistance when
compared to leucite and lithium dislicate dental ceramics, the enamel undergoes more
antagonistic wear when opposed by these two ceramics. The roughness of the ceramic then
further contributes to the wear process. Enamel also has a lower fracture toughness compared
with these ceramics, which further enhances the wear of the enamel (Heintze et al 2008).
1.3.4.8.4 Porosity
Sintered porcelains are produced by powder and liquid being mixed together, which is then
condensed and sintered. This process can allow the accumulation of porosities within the
porcelain structure that are difficult or in some cases impossible to remove, and may
contribute to inferior material characteristics such as reduced strength and aesthetics. If during
the wear process porosity is exposed, the sharp edge of the defect present an area of stress
concentration which can increase the wear of the opposing material and add to deterioration
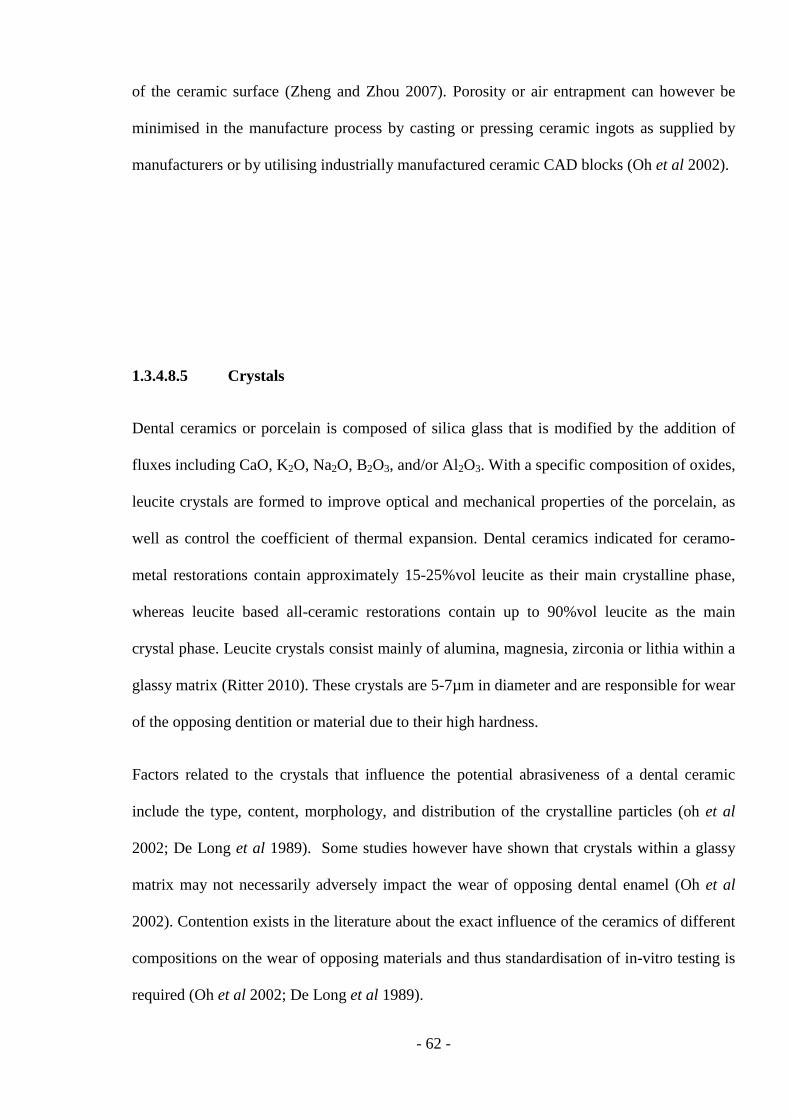
- 62 -
of the ceramic surface (Zheng and Zhou 2007). Porosity or air entrapment can however be
minimised in the manufacture process by casting or pressing ceramic ingots as supplied by
manufacturers or by utilising industrially manufactured ceramic CAD blocks (Oh et al 2002).
1.3.4.8.5 Crystals
Dental ceramics or porcelain is composed of silica glass that is modified by the addition of
fluxes including CaO, K2O, Na2O, B2O3, and/or Al2O3. With a specific composition of oxides,
leucite crystals are formed to improve optical and mechanical properties of the porcelain, as
well as control the coefficient of thermal expansion. Dental ceramics indicated for ceramo-
metal restorations contain approximately 15-25%vol leucite as their main crystalline phase,
whereas leucite based all-ceramic restorations contain up to 90%vol leucite as the main
crystal phase. Leucite crystals consist mainly of alumina, magnesia, zirconia or lithia within a
glassy matrix (Ritter 2010). These crystals are 5-7µm in diameter and are responsible for wear
of the opposing dentition or material due to their high hardness.
Factors related to the crystals that influence the potential abrasiveness of a dental ceramic
include the type, content, morphology, and distribution of the crystalline particles (oh et al
2002; De Long et al 1989). Some studies however have shown that crystals within a glassy
matrix may not necessarily adversely impact the wear of opposing dental enamel (Oh et al
2002). Contention exists in the literature about the exact influence of the ceramics of different
compositions on the wear of opposing materials and thus standardisation of in-vitro testing is
required (Oh et al 2002; De Long et al 1989).

- 63 -
1.3.4.8.6 Ceram Layer
“Ceramming” is the process of controlled crystallisation of the glass resulting in the formation
of crystals which are evenly distributed throughout the glass structure. The crystal size,
amount, and rate of growth are determined by the time and temperature of the ceramming heat
treatment. Ceramming results in crystals which are oriented perpendicular to the external
surface of a glass ceramic and the outermost layer of the ceramic is called the “ceram” layer.
The ceram layer has been reported as being up to twice as abrasive to the opposing dentition
and four times as wear resistant than a polished ceramic (De Long et al 1989).
1.3.4.8.7 Ceramic chemical degradation due to acid attack
Oh et al (2002) reported that the wear rate of dental enamel opposed by ceramic is
significantly higher in a highly acidic environment versus neutral situations. There were two
reasons cited for this. The first being that the acidic environment affects the solubility of tooth
structure (at pH 5.5 vs pH 6.5) by up to eight times for enamel. The second is that forms of
chemical degradation including glass corrosion, etching, and crystal deposition increase the
degree of surface roughness and reduce the ceramics wear resistance by continually exposing
a rough surface (Oh et al 2002). Occlusal forces accelerate this process further (De Long et al
1986).
1.3.4.8.8 Effect of surface finish

- 64 -
An uneven distribution of dental ceramic crystals within the glassy matrix can result in flaws
in the ceramics internal structure. Dental laboratory processing can further enhance these
defects which can result in a reduction in material strength and thus increased wear rate on
opposing materials (Metzler et al 1999). The processes of polishing and glazing can reduce or
seal respectively the ceramic surface which reduces the abrasiveness of the ceramic. This may
only influence the early stages of wear though (Monasky and Taylor 1971).
The surface texture of dental porcelain should be as smooth as possible to enhance the
function, aesthetics, and biologic compatibility of a ceramic restoration (Cook et al 1984; Ma
et al 1999). Rough surfaces have numerous undesirable outcomes including reduced flexural
strength (Rosenblum and Shulman 1997), increased antagonistic abrasion of opposing
materials (Al-Hiyasat et al 1997; Wright et al 2004; Kramer et al 2006), accumulation of stain
and plaque (Tholt de Vasconcellos et al 2006; Clayton and Green 1970).
1.4 Literature Review of Acrylic Denture Teeth Wear Testing
A literature search was conducted via PubMed and Embase for published studies which
investigated the wear of highly cross-linked acrylic denture teeth. The search resulted in ten in
vitro two-body wear simulation studies. One group lead by Ghazal have published seven of
the in-vitro studies. A summary of each two-body in vitro wear study including wear testing
machine, number of cycles, load, lubricant, antagonist, and denture teeth test materials is
outlined in Table form in Appendix 1.
The literature search revealed a number of studies which have looked at in vitro wear testing
and surface texture analysis of artificial denture teeth. Various methods of testing were
reported with significant variation in all aspects of the wear studies.

- 65 -
The artificial teeth testing included various types of acrylic (PMMA) based denture teeth such
as PMMA, Highly cross linked PMMA, direct cross-linked (DCL)-PMMA, PMMA with
interpenetrating polymer network (IPN), PMMA with fillers, urethane dimethacrylate
(UDMA), as well as composite resin, and feldspathic ceramic denture teeth. Various studies
indicated that the PMMA artificial teeth may suffer more wear than other materials depending
on test parameters (Ghazal et al 2008; Hahnel et al 2009; Heintze et al 2012; Hirano et al
1998; Mello et al 2009); Reis et al 2008; Hao et al 2014; Stober et al 2006; Suwan 2001).
The antagonist materials tested against the artificial acrylic test materials included: natural
tooth enamel; steatite; zirconia oxide; alumina; aluminium oxide; silicone nitride; feldspathic
ceramic; stainless steel; Ni-Cr Alloy; composite resin; and, acrylic denture teeth (Ghazal et al
2008; Hahnel et al 2009; Heintze et al 2012; Hirano et al 1998; Mello et al 2009); Reis et al
2008; Hao 2014; Stober et al 2006; Suwannaroop et al 2001). The form that the antagonists
took varied significantly from balls, to cusps, sandpaper, or natural tooth forms.
The wear machines that were used included Dual-axis chewing simulator (Willytec, Munich,
Germany), Pin-on-disc (EGO, Regensburg, Germany, and Abrasive tester (TE88; Phoenix
Tribology Ltd)), Customised wear testing machine (Tsurumi University), Customised wear
testing machine developed by Wagner and Hacker (1996), a “simulated brushing machine”,
Ducom Friction wear machine (custom), and Mello et al (2009) used another custom variant.
There is clearly no consensus nor consistency within this literature regarding a standardised
machine for wear testing. Heintze et al (2012) aimed to correlate laboratory testing protocols
with clinical wear results for the same materials. Only the results of the experimental setup
with standardised antagonists of the same denture tooth material against flat specimens were
similar to the clinical wear results with a comparable relative difference in mean wear
between the materials.

- 66 -
There was significant variation in the test parameters regarding lubricant, cycle number, and
load applied to the material samples. The lubricants utilised included nothing, tap water,
distilled water, and human saliva. Some studies used thermo-cycling of lubricants whereas
others did not.
Regarding the number of cycles and rate of cycles, these ranged from 1,000 to 1,200,000 total
cycles at varying rates from constant contact up to 265 cycles per minute. One study reported
a rate of 1,000rpm. The nature of the cycles varied as well, with some samples being in
constant contact with the antagonist with either linear or rotating actions, while others enacted
the gliding phase of mastication with period of no contact then contact with a horizontal slide.
The slide distances varied from 0.2mm to 20mm.
The force applied to the samples is also an important variable. Here, the forces varied from
0.2kg (2N) up to 50N.
Methods of sample and antagonist analysis included qualitative methods such as SEM which
was also used for surface texture analysis. Methods for analysis of material loss due to
antagonistic wear included height change measurements, volume assessment via weight, and
3-D surface profilometry via stylus and laser methods. DeLong (2006) reported that 3D
analysis is the most accurate method for measuring wear.
Surface roughness analysis was undertaken by several studies (Ghazal et al 2008). All of
these studies utilised two-dimensional analysis and reported in Ra values. An understanding
of surface roughness is important (as outlined by Ghazal et al (2008)) who studied zirconia
antagonists of varying roughness and their effects on opposing samples. The investigators
found a positive correlation between the roughness of the zirconia antagonist and the degree
of wear of the opposing sample material.

- 67 -
Hahnel et al (2009) stated that the outcome of in vitro studies on the wear resistance of
artificial resin teeth appears to be influenced markedly by the antagonist material used for
mastication simulation. Thus, for the prevention of vertical height loss, clinicians might
consider in vitro studies using ceramic antagonist materials for mastication simulation, which
allow for the better differentiation between various artificial resin teeth with regard to wear
resistance.
Only one author has investigated zirconia opposing denture tooth materials, however, only
feldspathic ceramic and nano-filled composite resin denture teeth were assessed. No studies
have been reported which have investigated zirconia, eMax™ or Lava Ultimate™ opposing
PMMA denture teeth. Ghazal (2008) investigated composite resin denture teeth alongside
human enamel and feldspathic ceramic denture teeth which opposed three antagonist
materials including steatite (6mm balls), zirconia (inceram™), and alumina (inceram AL™).
They found that composite resin denture teeth had more wear than human enamel and
discussed the mechanism of composite resin material degradation and the influence it has on
the wear process.
“In the abrasion mechanism of composite resin materials, the size, shape, volume and
hardness of fillers, the bonding between fillers and polymer matrix, and the polymerisation
dynamics, all have an effect on the wear characteristics. During the wear process of
composite resin, inorganic filler particles are exposed after the softer resin is abraded,
which causes a high friction coefficient and leads to high internal shear stresses in the
polymer matrix. This corresponds to increased sensitivity to wear which might have
accelerated the wear of composite resin teeth during long term testing.”
Ghazal et al (2008) also stated that the wear resistance of all PMMA based teeth is less than
the composite resin teeth in their study and highly cross-linked PMMA and conventional

- 68 -
PMMA teeth showed the same overall wear. Feldspathic ceramic showed a similar wear rate
to enamel.
1.5 Rationale for this research
Understanding the behaviour of dental materials subjected to “chewing-like” actions is
essential to understanding how and when each material should be used. The introduction of
new dental materials into the market place often comes with a lack of laboratory and/or
clinical testing which may have implications for not only a patients’ existing restorations and
teeth, but also any dental restorations which are undertaken in the future.
It has been well documented that different dental materials have varying effects on other
opposing dental materials which may in turn result in a shorter life of restorations or
prostheses. There has been numerous studies into the wear behaviour of various artificial
denture teeth, however, no studies have investigated the behaviour of these teeth when
opposing novel materials, namely, monolithic zirconia, lithium dislocate ceramic, and nano-
ceramic composite resins for CAD/CAM use.
Multiple studies have identified the correlation between in vitro and in vivo attrition and
abrasion wear testing of dental materials in a chewing simulator (Finger and Thiemann 1987;
Heintze et al 2006). This evidence validates to some extent the use of in vitro wear testing in
the prediction of in vivo performance of materials. However due to the dynamic nature,
including multiple influencing factors in vivo, a clinical observation of material performance
is paramount in making final decisions about material choice (Heintze et al 2006 and 2012).

- 69 -
Section 2
Study Aims and Hypotheses

- 70 -
2.1 Study Aims
1. Qualitative assessment of the dental material surfaces prior to wear testing
2. Investigate a novel three-dimensional surface roughness analysis method, Sa, for use
in dental material analysis as opposed to conventional two-dimensional Ra values.
3. Investigate the surface texture before and after wear testing of dental materials
including:
o Monolithic Zirconia
Lava Plus™ (non-HIP)
BruxZir™ (non-HIP)
DenZir™ (HIP)
o Monolithic Lithium Disilicate Ceramic (eMax™)
o Lava Ultimate™ Nano-Ceramic Composite Resin
o Conventional Acrylic (PMMA) Artificial Denture Teeth
4. Investigate the in vitro two-body wear behavior of the sample dental materials
opposing the conventional acrylic (PMMA) artificial denture tooth antagonist. Tested
materials will include:
o Monolithic Zirconia (one representative material)
Lava Plus™ (non-HIP)
o Monolithic Lithium Disilicate Ceramic (eMax™)

- 71 -
o Lava Ultimate™ Nano-Ceramic Composite Resin
o Conventional Acrylic (PMMA) Artificial Denture Teeth
5. Measure the volume loss (wear) of the acrylic antagonist and the opposing sample
dental materials using three-dimensional profilometry.
6. Analyse material sample wear characteristics using SEM in the post-testing state.
2.2 Null Hypotheses
1. The two-dimensional (Ra) values for materials and three-dimensional (Sa) values will
provide comparable information about surface roughness.
2. There is no relationship between Ra and Sa values regarding dental material surface
topography characterisation
3. The dental sample materials will have similar Ra and Sa values
4. Surface roughness of all tested materials will increase following wear simulation
testing
5. The monolithic zirconia material will cause more antagonistic wear of the opposing
artificial acrylic denture tooth material (PMMA) compared to all other materials tested

- 72 -
Section 3
Methods and Materials

- 73 -
3.1 Sample Preparation
3.1.1 Monolithic Zirconia
Lava Plus™ (3M ESPE) is a “translucent” all-zirconia (monolithic) based ceramic restoration
material. It is a tetragonal polycrystalline zirconia (ZrO2) partially stabilised with 3mol yttria
and has a lower alumina dopent content (0.1%) compared to LAVA™ framework zirconia
materials, as such it is a “non-HIP’d” zirconia material. The original Lava Zirconia material
was brought to market in 2001. Lava Plus™ is a new generation material which is claimed to
have superior physical properties and aesthetics. Lava Plus™ is indicated for various dental
restorations including partial or complete crowns, bridges, and implant restorations.
These restorations are CAD/CAM-based and are designed using the Lava Design 7™ (3M
ESPE) software and digital workflow system. The restorations are milled in the “pre-sintered”
state using a LAVA CMC 500™ (3M ESPE) CAD/CAM milling machine with a series of
diamond burs. Following characterisation, the restoration undergoes final sintering in a
LAVA Furnace 200™ (3M ESPE) to achieve its final dimensions. Following this, the
restorations can be finished by polishing, glazing, and/or staining with subsequent sintering as
required.
In this study, the material samples were manufactured using the “monolithic” restoration
work flow without glazing or staining. The material samples were in the post-sintered state
prior to polishing in order to demonstrate the characteristics of the material in its potentially

- 74 -
roughest state. The samples were 10mm x 8mm and were 1.5mm thick as recommended by
the manufacturer.
“BruxZir™” (Glidewell) is also a non-HIP’d all-zirconia (monolithic) based ceramic
restoration material. It is a tetragonal polycrystalline zirconia (ZrO2) partially stabilised with
yttria. Restorations fabricated from this material are CAD/CAM-based and are compatible
with a number of CAD software systems including CEREC™, E4D™, TRIOS™, and 3M
ESPE®. The manufacture process is the same as that for the Lava Plus™ material in that
partially sintered zirconia blanks are used in the milling process and are subsequently sintered
to the desired restoration dimensions (Table 6).
Table 6. BruxZir manufacturer instructions for sintering.
Ramp up cycle Ramp down cycle
Start temp: 25°C Start temp: 1,530°C
Heat rate: 10°C/min Ramp time: 180mins
Ramp rate: 151 mins Final temp: 70°C
Final temp: 1,530°C
Hold time: 120 mins
In this study, BruxZir™ samples were manufactured following the same basic process as was
used to prepare the Lava Plus™ specimens except that the final samples were 10mm x 10mm
and were 1.5mm thick due to the original block dimensions and as recommended by the
manufacturer.
DenZir™ (DenZir, Stockholme, Sweden) is a ceramic material consisting of HIP (Hot
Isostatically Pressed) Yttrium Oxide stabilised zirconium dioxide. These restorations have

- 75 -
similar indications to the two previously mentioned systems. This material is also designed
for CAD/CAM fabrication techniques. DenZir™ utilises the “Cad.esthetics System™”
(DenZir) or the “open system” which allows image capture and design from using any
company’s system.
DenZir™ restorations are fabricated in a two-step process. First, the manufacturing of the
DenZir blocks of material, and second, the “grinding” phase in which the dental restoration is
fabricated. The block manufacturing phase involves the refinement of zirconia dioxide
powder. This powder is pressed and shaped into the desired block dimensions and
subsequently sintered under a proprietary process. Following this, in order to achieve
improved physical properties regarding maximum density, strength and aging resistance, the
blocks are hot isostatically pressed (HIP), and finally inspected as part of the quality control
process.
Unlike the LAVA™ and BruxZir™ materials these restorations are milled, in the completely
sintered state. The second “grinding” phase involves shaping of the HIP blocks into the
desired dental restoration form. DenZir™ proprietary CAD/CAM software is used to input the
desired restoration shape and dimensions and calculate the milling time. After the restoration
is milled, it is inspected and vapour cleaned, and logged according to zirconia dioxide batch
number.
In this study, the material samples were manufactured following the “monolithic” restoration
work flow without glazing or staining. The material samples were in the post-sintered state
prior to polishing in order to demonstrate the characteristics of the material in its potentially
roughest state. The samples had a 10mm diameter and were 1.5mm thick as per manufacturer
instructions.

- 76 -
3.1.2 Lithium Disilicate Specimen
Milled and pressable lithium disilicate is indicated for any restorative prosthesis that is less
than three units in total, for example inlays, inlays, crowns, and bridges. The standard
chemical composition of the IPS eMax CAD™ (Ivoclar Vivadent) which was used in this
study is listed in Table 3 (page 47) and the physical characteristics of both the pressable
version and CAD/CAM version are seen in Table 4 (page 47).
In this study, the IPS eMax™ samples were manufactured from CAD/CAM blocks. As with
the zirconia specimens, these samples were in the post-sintered state prior to polishing in
order to demonstrate the characteristics of the material in its potentially roughest state. These
samples were 10mm x 6mm and were 2mm thick.
3.1.3 Resin Nano-Ceramic (RNC)
The LAVA Ultimate™ is delivered from manufacturer (3M ESPE) in CAD/CAM block form.
The blocks were sectioned with a diamond cutting wheel to dimensions of 10mm x 10mm
with a thickness of 3mm. The samples were subsequently wet polished with 2000 grit silicon
abrasive paper to achieve the desired polished finish.
3.1.4 Artificial acrylic denture tooth material (PMMA)
In this study “Gnathostar™ (Ivoclar Vivadent) artificial denture teeth were sectioned to
provide PMMA samples. Upper first molars were chosen, the cusps were removed to produce
a flat surface and the testing surface was wet polished with 2000 grit silicone abrasive paper

- 77 -
to achieve the desired polished finish. The samples were approximately 10mm x 8mm and
had a thickness of 4mm.
3.1.5 Antagonist Preparation (PMMA)
In each wear study an (PMMA) artificial acrylic denture tooth material (“Gnathostar™”,
Ivoclar Vivadent) was used as an antagonist. Premolar artificial teeth were chosen and
sectioned to leave the buccal cusp tip. The tips were then wet polished with 2000 grit silicon
abrasive paper to achieve a standardised polished finish.
3.2 Mounting
All prepared samples were mounted on SEM mounting studs for subsequent SEM analysis
and wear testing procedures. The bonding surfaces were prepared according to the
cementation instructions for Rely-X Ultimate™ resin cement (3M ESPE). The bonding
surfaces of the PMMA, resin nano-ceramic and zirconia specimens, and the SEM studs were
subjected to airborne particle abrasion with Rocatec (3M ESPE) at 4 bar, and the Lithium
Disilicate samples (eMax™) were acid etched with 6% hydrofluoric acid (Kerr) according to
the manufacturers recommendations.
The SEM studs and the material sample bonding surfaces were treated with Scotchbond
Universal Adhesive™ (3M ESPE) for twenty seconds and subsequently air-dried for five

- 78 -
seconds. Scotchbond Universal Adhesive™ is a mild self-etch adhesive consisting of
phosphorylated monomers in a water/ethanol solution which provides acidity (pH 2.7). There
are three “adhesion promoters” in the formulation: Vitrebond™ copolymer for dentine
adhesion; MDP phosphate monomer which provides self-etching properties and chemically
bonds to zirconia, alumina, and metal alloys; and silane for chemical adhesion to glass-based
ceramic systems. The system also consists of dimethacrylate resins and HEMA for matrix
formation around the filler components. The constituents of Rely-x ultimate™ resin cement
are listed in Table 7 and the physical properties are listed in Table 8.
Table 7. Rely-X Ultimate™ resin cement constituents
Base paste Catalyst paste
Methacrylate monomers Methacrylate monomers
Radiopaque, silanated fillers Radiopaque alkaline (basic) fillers
Initiator components Initiator components
Stabilizers Stabilizers
Rheological additives Pigments
Rheological additives
Fluorescence dye
Dark cure activator for
Scotchbond universal adhesive

- 79 -
Table 8. Rely-X Ultimate™ resin cement physical properties.
Properties Rely-x Ultimate (lc)
Flexural strength (MPa) 98
Compressive strength (MPa) 262
Modulus of elasticity (GPa) 7.7
Surface hardness (HV 0.2) 40
Film thickness (µm) 12
Water sorption (µg/mm3) 21
Solubility (µg/mm3) 0
Expansion after 1 month (%) 0.5
The bonding surfaces were coated with a thin film of Rely-x ultimate™ cement. Three 2mm
diameter stainless steel balls were cemented adjacent to the samples for orientation during
surface profilometry. The material samples with applied cement were then light cured (3M
- 80 -
ESPE) for twenty seconds. Figure 32 shows examples of mounted zirconia and acrylic
specimens.
Figure 32. Mounted specimens. Left: Zirconia. Right: Acrylic.
3.3 Scanning electron microscopy (SEM) observations and Surface
texture quantification
Scanning electron microscopy (SEM) was used for two main purposes in this investigation:
o To investigate a novel three-dimensional surface roughness analysis method (Sa) for
use in dental material analysis as opposed to conventional two-dimensional Ra values.
Assessment was undertaken prior to and after completion of in-vitro wear testing. This
is the first time this technology has been used for the study of dental materials.
o To investigate the surface roughness of the materials before and after wear testing.
All specimens were mounted on SEM studs as described. All material samples were subject to
nitrogen air spray under high pressure to remove surface contaminants. The materials were
then coated with a 15nm layer of carbon prior to analysis with the Phillips XL30 FEG
Scanning Electron Microscope (Figure 33). Images were first taken for surface
characterisation at up to 650x magnification. The samples were then subjected to the 3-D

- 81 -
surface texture analysis protocol for the MeX software analysis which required three scans
from 0º, +11.5º, and -8.5º in order to generate the data set for analysis. Ra measurements were
taken from identical 10 pixel wide lines drawn horizontally across the centre of the image
region. Areas for Sa and Ra analysis were kept identical from sample to sample. All data was
stored on removable data storage devices.
Figure 33. Phillips XL30 FEG Scanning Electron Microscope
3.3.1 MeX for Sa Analysis
Three dimensional reconstructions were performed in Alicona MeX®. In order to carry out
the reconstructions, stereoscopic tilt-series images were acquired at Adelaide Microscopy,
The University of Adelaide, on a Philips XL30 FEG-SEM. Samples were coated in a layer of
carbon prior to imaging in order to make the sample conductive. The imaging process
involved acquiring secondary electron (SE) images at zero, +11.5 and -8.5 degree tilts, on
multiple regions per sample. Secondary electron imaging provides detail on topography and

- 82 -
surface features. Contrast and brightness settings can be altered in the SEM software, and
were optimised for each area imaged to provide the greatest contrast possible without
saturating the image.
Once acquired, images are imported into the MeX® software, and calibrated for X-Y distance
using the scale bar on the SEM image. Z-distance is resolved by the software using the tilt-
series images and is partly dependent on the changing brightness of pixels as they are tilted
towards and away from the SE detector. Once the 3D model is created (Figure 34), before
measurements are carried out a 2nd
order polynomial “form removal” step is carried out. This
removes any contribution to the roughness measurement from any large-scale surface
variations, such as a non-flat surface as seen in some of the implant samples. Following this
both Ra and Sa measurements were performed. Ra measurements were taken from identical
parts of every reconstruction, in which a 10 pixel wide line was drawn horizontally across the
centre of the imaged region, and data output. Areas for Sa measurements were kept identical
from sample to sample, and comprised the entire imaged area.
Figure 34. MeX generated image of a material sample for Sa analysis.
3.3.2 Comparison of Ra and Sa

- 83 -
One of the study aims was to undertake surface roughness (texture/topography) analysis of
each sample utilising the most commonly used approach in dental material analysis (Ra) and a
potentially more accurate three-dimensional method (Sa) in order to determine if there is a
relationship between Ra and Sa. Both are measured in nanometers (nm). Six measurements
were taken in order to improve the confidence of the given Ra and Sa values for each
material. The results in terms of means and standard deviations (SD) are presented in Tables 9
and 10 (the complete set are shown in Appendix 2). They are demonstrated in Figures 35 and
36.
Table 9. Baseline Ra measurements. Mean and SD values are shown for the materials
of interest. Acrylic sample material (A), Acrylic Antagonist material (AA),
BruxZir™ Zironia (BZ), Lava Plus™ (LP), DenZir™ Zirconia (DZ), Lithium
Disilicate (eMax™), and Lava Ultimate™ nanoceramic composite resin
(LU).
Ra (nm)
A AA BZ LP DZ eMax LU
Mean 457.2 627.0 148.2 375.3 297.6 160.5 217.9
s.d. 161.3 138.6 12.5 84.7 83.1 31.9 47.1
Table 10. Baseline Sa measurements. Mean and SD values are shown for the materials
of interest. Acrylic sample material (A), Acrylic Antagonist material (AA),
BruxZir™ Zironia (BZ), Lava Plus™ (LP), DenZir™ Zirconia (DZ), Lithium
Disilicate (eMax™), and Lava Ultimate™ nanoceramic composite resin
(LU).
Sa (nm)
A AA BZ LP DZ eMax LU
Mean 708.6 837.0 390.4 690.9 546.8 410.5 480.0
s.d. 93.2 74.3 86.1 53.4 84.5 42.8 74.7

- 84 -
Figure 35. Baseline Ra value graph. Mean and SD values are shown for the materials of
interest. Acrylic sample material (A), Acrylic Antagonist material (AA),
BruxZir™ Zironia (BZ), Lava Plus™ (LP), DenZir™ Zirconia (DZ), Lithium
Disilicate (eMax™), and Lava Ultimate™ nanoceramic composite resin
(LU).
Figure 36. Baseline Sa value graph. Mean and SD values are shown for the materials of
interest. Acrylic sample material (A), Acrylic Antagonist material (AA),
BruxZir™ Zironia (BZ), Lava Plus™ (LP), DenZir™ Zirconia (DZ), Lithium
Disilicate (eMax™), and Lava Ultimate™ nanoceramic composite resin
(LU).
0
100
200
300
400
500
600
700
BruxZir eMax Lava Ulti DenZir Lava Plus Acrylic
Baseline Ra (nm)
s.d. high s.d. low Mean (nm)
0
100
200
300
400
500
600
700
800
900
BruxZir eMax Lava Ulti DenZir Lava Plus Acrylic
Baseline Sa (nm)
s.d. High s.d. Low Mean (nm)

- 85 -
Data for both Ra and Sa values were plotted and a liner regression model (Excel, Microsoft
Corporation) was fitted to assess the relationship between the two methods (Figure 37).
Figure 37. Scatter plot and R2 correlation of the baseline Ra and Sa values.
The R2 value (coefficient of determination) of 0.89 indicates a close relationship between the
Ra and Sa values.. This suggests that the Ra and Sa methods of surface texture analysis are
providing very similar information. Experience with the two methods suggests that in a
relatively homogenous specimens such as dental materials used here, the Ra method is
adequate, whereas for more heterogeneous specimens the Sa method has advantages because
it draws on data from a wider area of the specimen
3.4 Profilometry
A 3-D scanner (Pix-4, Roland DG, Tokyo, Japan) with a piezo sensor that detects contact
between its stylus and the surface being scanned was utilised for material surface scanning
prior to and following the wear testing. The scanner was interfaced with a Windows-based PC
to record mesh points of the scanned material. The software, “Dr PICZA” (Roland DG,
R² = 0.8858
R² = 0.8858
0
100
200
300
400
500
600
700
0 200 400 600 800 1000 1200
Ra
Sa
Ra vs Sa Scatter Plot

- 86 -
Tokyo, Japan), was provided with the scanner in order to define the scanning area, set the
scanning limits, define the resolution, and calibrate the scanner prior to each scan. The
resolution of the Pix-4 scanner was set for the finest values or “highest resolution” which was
50µm for the X and Y coordinates and 25µm for the Z axis. This required up to five hours for
scanning of each sample. The Dr PICZA software also allowed data visualisation and export
for further analysis (Ha 2011). Figure 38 shows the 3-D scanner used in this study.
Figure 38. The 3-D scanner (Roland DG, Tokyo, Japan)
Purpose-written MATLAB 6.5 software (The Mathworks Inc, Natick MA, USA) was used to
analyse the data sets (Liu et al 2004). This software enabled the production of a 3-D graphic
of the scanned sample, on which the reference plan defined by the three stainless steel balls
could be identified (Figure 39). The software calculated the volume of the scanned sample
above this reference plan. For this study the volume was determined as a mean of three
separate scans of each sample and software analysis.

- 87 -
Figure 39. A snapshot of a 3-D graphic of a scanned specimen
The validity and reliability of this scanning system has been confirmed in experiments
reported by Liu et al (2004). It was shown that the difference in the scanning volume
compared to the true volume was between 3.7% and 8.5%, depending on the geometry of the
specimen. Wear volumes were recorded in cubic millimeters and the pre- and post-wear scans
were tabulated in Microsoft Excel (Microsoft, USA) spreadsheets for subsequent analysis.
3.5 Wear testing machine
In the mid 1990’s an electro-mechanical wear machine was designed and fabricated by the
Department of Mechanical Engineering at The University of Adelaide. The original machine,
along with its sister machine have been used in tribology studies of various types and have
resulted in a series of publications on tooth and dental restorative material wear (Kaidonis et
al 1998; Shabanian and Richards 2002; Ranjitkar et al 2008). The wear machine and was
originally described by Kaidonis et al (1998) in the following way:

- 88 -
“The tooth wear apparatus consists of a stainless steel base and frame onto which all parts
are secured. The machine is driven by a 75-watt D.C. electric motor configured to operate
at variable speeds. The motor powers a 10:1 reduction gearbox that moves a series of
interchangeable cams controlling the movement of one of two opposing specimen holders.
These holders allow the specimens to be accurately repositioned at all times. Depending
on the selected cam, movement can be controlled in either or both of two dimensions
(horizontal and vertical). A simple adjustment screw on the cam follower, accurately
establishes the degree of movement in the horizontal plane, allowing for control of the
duration of contact of the enamel surfaces of specimen teeth (and material samples). A magnetic
counter, attached to the drive of the gearbox, records the number of cycles of the machine”
“The upper mobile section of the machine was designed to support weights for applying
loads to the specimens. Without the addition of load, the inherent weight of the upper
component is 3.2 kg. Therefore, for load below 3.2 kg, the moveable component of the
machine is attached to a counterbalanced overhead pulley system.”
“Experiments were based on uni-directional movements where a moving upper specimens
was rubbed against a fixed lower specimen in one direction for a specified duration, after
which the cam lifted the upper specimen and repositioned it at the beginning of the stroke.
This action constituted one cycle.”
Stainless steel specimen holders accommodate stainless steel cylinders which are secured to
the stationary base by two screws in an anti-rotational fixture. The upper specimen holder is
fixed in place and receives the stainless steel cylinder which holds the antagonist sample
material. The cylinders themselves are secured by lateral-directed screws.

- 89 -
The upper, moveable section, was designed to support additional weight which is desired to
be applied to the sample(s). The weight range allowed load between 2.5N and 162N, which
was stated as the range which represents a physiologic functional range (Kaidonis et al 1998).
The wear machine is shown in Figure 40.
a b
Figure 40. a. The University of Adelaide customised wear machine. b. The set
Acrylic Antagonist opposing an Acrylic sample material.

- 90 -
3.6 Wear machine protocols
3.6.1 Load (Applied Force)
There is no agreement in the literature on the most appropriate load for in vitro wear studies
(Li 2001) and the relevant ISO standard provides no guidelines. Kelly (1996) stated that loads
during mastication and swallowing ranges from 5N to 364N, and Nishigawa (2001) stated that
nocturnal bite force may be up to 423N, while Gibbs et al (1981) stated that maximum bite
forces may be as high as 1270N. Eisenburger and Addy (2002) found that researchers have
used loads ranging from 2N to 162N. While previous studies using the University of Adelaide
wear machines have utilised 99.5N (Kaidonis et al 1998; Shabanian and Richards 2002;
Ranjitkar et al 2008), a literature review in this study on two-body in vitro, denture tooth wear
found loads from 2N to 50N were commonly used.
3.6.2 Lubrication
Several lubricants have been used for in vitro two-body wear testing of human dental tissues
and restorative dental materials. These have included: nothing (ie dry testing); tap water;
distilled water; and human saliva. Some studies used thermo-cycling of lubricants (5℃ to
55℃) whereas others are conducted at either room temperature or 37℃. The purpose of two-
body in vitro wear testing is to investigate the influence of direct contact between the
materials without a third body present, thus the lubricant acts to “simulate” a moist oral
environment as well as to remove wear debris generated.
Ha (2011) investigated the potential effect of water uptake or loss during testing on the
dimensional change of natural tooth enamel, and restorative materials including dental
ceramics and composite resin materials. She found no significant dimensional changes.

- 91 -
In this study the lubrication system as described by Kaidonis et al (1998) was employed. It
consisted of a plastic lubricant reservoir which was connected by plastic tubing to a pipette
tip. The reservoir was placed 0.5m above the pipette tip and a flow device was attached to the
tubing to control the flow rate. The tubing was suspended using laboratory stand and the
pipette was positioned for direct flow on to the wearing interface of both upper antagonist and
lower sample material. The flow rate was fixed at 0.5ml/min as previously described, and the
water lubricant that had passed over the wearing materials was collected and discarded. In this
study all specimens were lubricated with distilled water.
3.6.3 Type of Movement
The wear machine is adjustable for either uni- or bi-directional movements. Kaidonis et al
(1998) concluded that measured wear rates for enamel specimens were the same for both
movements at 32N and 99.5N. Shabanian and Richards (2000) confirmed when testing
composite resin, glass ionomers and enamel at pH 7 under loads of 32N, 67N, and 99.5N.
3.6.4 Cycles (duration of experiment)
As outlined in the literature review of denture teeth tribology, there is a wide range in testing
cycles depending on the study with as little as 1,000 cycles noted for one study and up to
1,200,000 being employed in another study (Ghazal et al 2008; Heintze et al 2012). The
number of cycles depends on the minimum detectable tooth reduction (i.e. the measurement
system), applied load, nature of the lubricant, and the wear of the specimens under the test
conditions. On this particular wear machine, Kaidonis et al (1998) utilized 32N of load for
89,000 cycles at a speed of 80 cycles/min with data collected at intervals during the study.
This provided discernable differences in wear in enamel worn with lubricant at a range of

- 92 -
pHs. Kaidonis et al (1998) found that enamel showed two phases of wear: Phase one in the
first 20,000 cycles and phase two which continued up to the 89,000 cycles and beyond in a
linear fashion.
A preliminary investigation in this study established that 240,000 cycles at 80 cycles/min
under 97N of load utilising distilled water lubricant at room temperature produced detectable
differences in wear.
3.6.5 Cycling rate
Kaidonis et al (1998) demonstrated that there was no statistically significant difference in
mean enamel loss when the machine was run at either 80 cycles/min or 160 cycles/min. These
study conditions included an applied load of 32N and were conducted for 89,000 cycles.
Kaidonis et al (1998) also noted that at a speeds over 160 cycles/min, the upper specimen
impacted the lower specimen with greater force during the return movement which resulted in
an increase in surface breakdown. He concluded that the return movement was “controlled” at
a rate of 80 cycles/min which was later confirmed by Ha (2011).
3.6.6 Area of specimen contact
The shape and size of natural teeth and artificial tooth restorations and denture teeth vary
significantly, and as a result the facet areas vary. Kaidonis et al (1998) described the pattern
of change in facet area during the wear process over 15,000 cycles. He found that an increase
in facet area was linearly related to the increase in the number of cycles the samples were
subjected to. This was also observed by Ratledge et al (1994).

- 93 -
Shabanian and Richards (2000) tested the effect of facet area on the rate of material wear
under 99.5N with a water lubricant using SEM to quantify facet area at intervals up to 40,000
cycles. Height changes were also measured. The results indicated a low correlation between
initial area and the change in height, but no significant relationship between facet area and
wear rate could be established (Shabanian and Richards 2000).
3.7 Experimental protocol
3.7.1 In vitro two-body Wear Study
The study involved the antagonistic wear of an acrylic antagonist denture tooth (polished)
opposing various dental material samples. The acrylic material itself acted as the control
(acrylic antagonist opposing acrylic sample material) with which the other material groups
were compared. A single representative specimen material was chosen for each material
group for the wear testing component of the study (ie Lava Plus™ represented the zirconia
group with BruxZir™ and DenZir™ excluded). The following experiments were conducted:
1. Acrylic Antagonist opposing acrylic sample material (control series)
2. Acrylic Antagonist opposing nano-ceramic composite resin (Lava Ultimate™, 3M
ESPE)
3. Acrylic Antagonist opposing monolithic zirconia (Lava Plus™, 3M ESPE)
4. Acrylic Antagonist opposing lithium disilicate (eMax™, Ivoclar-Vivadent)
There was 8 pairs in each test group and the control group. There were three measurements
taken prior to testing (baseline) of the material volume as per the above mentioned protocol
for the acrylic antagonist and its paired opposing material. Following testing, three further

- 94 -
measurements were taken for comparison. A mean and standard deviation was calculated
from the three measurements.
For the material volume loss (wear) experiments, data sets for both the acrylic antagonist
material and sample dental materials were summarised in tabular form with material sample,
all measurements, and mean measurements. These results were plotted on a bar chart to
demonstrate the material volume loss for each group as a whole, the respective acrylic
antagonist for each group, and its respective opposing dental material sample.
The material samples of interest were tested against the acrylic material which acted as a
control for all groups. The material specimen groups were also statistically tested against each
other to determine if significant differences in the amount of material and/or antagonist
specimen wear volumes occurred.
The null hypothesis was that all groups displayed the same amount of material wear and
acrylic antagonist material wear.
- 95 -
3.7.2 Conclusions and Antagonistic Wear Study Protocols
The final wear experimental protocols were:
• Wear machine: The University of Adelaide customised wear machine
• Load: 97N (9.9kg)
• Cycles: 240,000 cycles at 80 cycles/min to maintain consistency and minimise effects of
impact stress
• Movement: Uni-directional
• Lubricant: Distilled water at room temperature
• Sample Mounting: Antagonist PMMA denture teeth were mounted as antagonists and
material samples (flat) were mounted as “samples”. All were mounted on SEM studs
which were utilised for all objectives of the study. The Rely-x ultimate™ Resin cement
was used to the manufacturer's instructions and three orientation stainless steel 1mm
diameter balls were mounted alongside the materials.
• Samples were analysed before and after wear testing for surface texture (qualitative
assessment and quantitative (Ra and Sa)) and volume changes for wear analysis.
3.7.3 Statistical Analysis
For each quantitative experiment, data sets were summarised in tabular form with sample
size, raw measurements, and mean measurements.
Statistical significance testing was undertaken with student’s t-tests using a significance level
of p<0.05 and these data were tabulated. This method was also utilized for the analysis of the
wear testing volumetric changes for each of the material specimen groups.

- 96 -
Section 4
Results
- 97 -
4.1 Qualitative Surface Texture
4.1.1 Pre-wear Surface Evaluation
Qualitative surface texture characteristics are presented for the acrylic antagonist, acrylic
sample, Lava ultimate™, Lava Plus™, DenZir™, BruxZir™, and eMax™ samples. At a
gross view level (naked eye), the surfaces of all materials appeared “smooth” with no
irregularities, with the zirconia materials being most light reflective. The sample were
subjected to analysis by SEM at magnifications of 120x, 150x and 650x and the MeX
software was utilised to develop a three-dimensional (3-D) image of the surface topography
of each material.
The various materials showed characteristic surface topographies which subsequently
underwent quantitative surface topography analysis using the two-dimensional method (Ra)
and the three-dimensional method of (Sa). The images are presented below in the Figures
outlined.
4.1.1.1 Acrylic Antagonist and Acrylic Test Samples (PMMA)
The Acrylic Antagonist (AA) material is an unfilled PMMA material, as is the acrylic Sample
Material (A). The gross view of the AA and A specimens is seen in Figure 41. AA material
was analysed at 120x and 650x magnification and the MeX 3-D image generated for
quantitative analysis of the surface topography which is shown in Figures 42, 43 and 44. At
120x magnification, the area of the cusp tip which was hand polished shows parallel striations
in various directions up to the border with the unpolished part of the sample (Figure 42). 650x
magnification, as seen in Figure 43, Shows more detail of the polished area and the evidence
of surface contamination by what is most probably debris from the polishing of the surface.

- 98 -
The MeX generated 3D image in Figure 44 gives a very clear projection of a sample area of
the specimen and demonstrates the surface topography in high resolution. Here, the striations
are clearly seen and the peaks and troughs are clearly evident. Figures 45, 46 and 47 show the
surface topography of the acrylic sample material specimen, which as expected displays the
same characteristics as the acrylic antagonist surface with both having been prepared in a
same manner by hand polishing with abrasive paper.
a. b.
Figure 41. Gross views of the acrylic antagonist (a) and acrylic sample material surface
(b).

- 99 -
Figure 42. Acrylic Antagonist material at 120x magnification.
Figure 43. Acrylic Antagonist material at 650x magnification. The red arrows
indicate possible surface contaminants left from the polishing process. The
blue arrows indicate the striations left in the materials surface following
hand polishing.
Figure 44. MeX 3-D image generated of the acrylic antagonist specimen for
quantitative analysis of the surface topography. Dimensions are 468µm (x-
axis) x 318µm (y-axis) x 27µm (z-axis).

- 100 -
Figures 45 and 46 show the acrylic sample specimen at 120x and 650x magnification and the
MeX 3-D image (Figure 47) generated for quantitative analysis of the surface topography.
Figure 45. Acrylic Sample material at 120x magnification.
Figure 46. Acrylic sample material at 650x magnification.

- 101 -
Figure 47. Acrylic sample material MeX 3-D image generated for quantitative analysis
of the surface topography. Dimensions are 468µm (x-axis) x 318µm (y-
axis) x 27µm (z-axis).
4.1.1.2 Lava Ultimate™ (LU)
The Lava Ultimate™ Sample material was examined at gross level (Figure 48), 150x and
650x magnification, and a MeX 3-D image was generated for qualitative and quantitative
analysis of the surface topography. The Lava Ultimate™ sample material was hand polished
in the same manner as the acrylic material sample. The same striation pattern can be seen at
both magnifications and in the MeX generated 3D image as seen in the acrylic images which
is expected. The images are shown in Figures 49, 50, and 51.
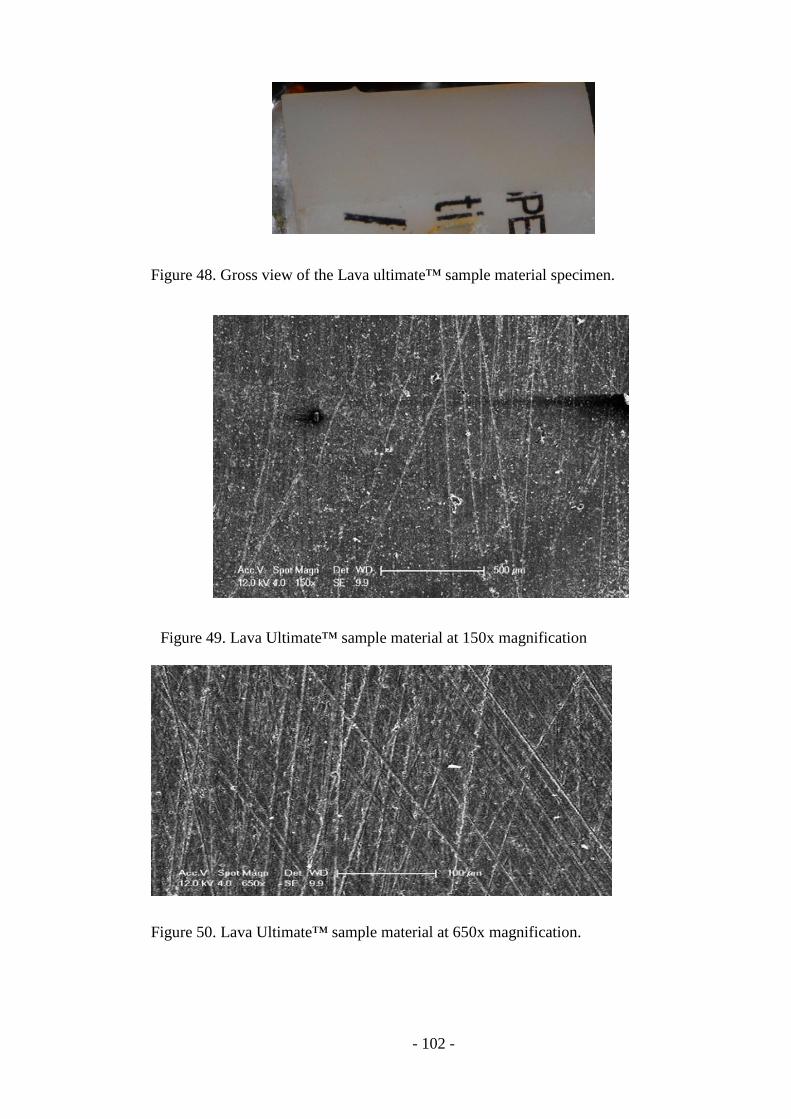
- 102 -
Figure 48. Gross view of the Lava ultimate™ sample material specimen.
Figure 49. Lava Ultimate™ sample material at 150x magnification
Figure 50. Lava Ultimate™ sample material at 650x magnification.
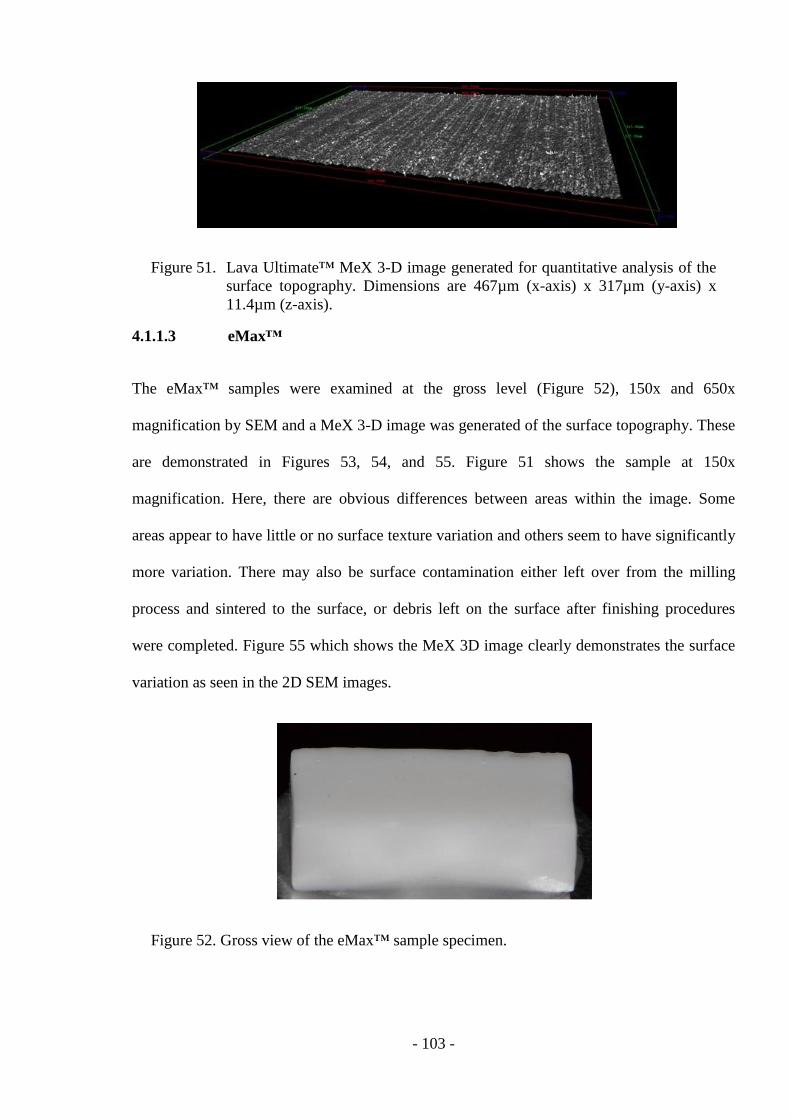
- 103 -
Figure 51. Lava Ultimate™ MeX 3-D image generated for quantitative analysis of the
surface topography. Dimensions are 467µm (x-axis) x 317µm (y-axis) x
11.4µm (z-axis).
4.1.1.3 eMax™
The eMax™ samples were examined at the gross level (Figure 52), 150x and 650x
magnification by SEM and a MeX 3-D image was generated of the surface topography. These
are demonstrated in Figures 53, 54, and 55. Figure 51 shows the sample at 150x
magnification. Here, there are obvious differences between areas within the image. Some
areas appear to have little or no surface texture variation and others seem to have significantly
more variation. There may also be surface contamination either left over from the milling
process and sintered to the surface, or debris left on the surface after finishing procedures
were completed. Figure 55 which shows the MeX 3D image clearly demonstrates the surface
variation as seen in the 2D SEM images.
Figure 52. Gross view of the eMax™ sample specimen.
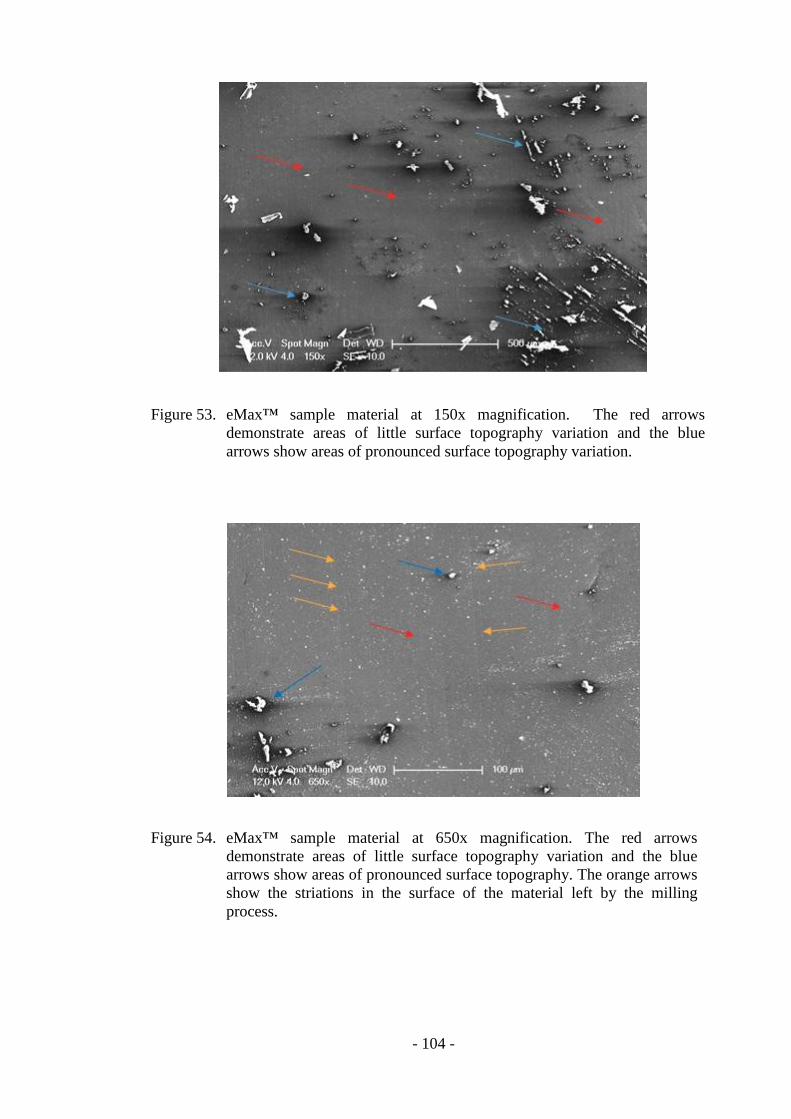
- 104 -
Figure 53. eMax™ sample material at 150x magnification. The red arrows
demonstrate areas of little surface topography variation and the blue
arrows show areas of pronounced surface topography variation.
Figure 54. eMax™ sample material at 650x magnification. The red arrows
demonstrate areas of little surface topography variation and the blue
arrows show areas of pronounced surface topography. The orange arrows
show the striations in the surface of the material left by the milling
process.

- 105 -
Figure 55. MeX 3-D image generated for quantitative analysis of the surface topography.
Dimensions are 466µm (x-axis) x 317µm (y-axis) x 11.85µm (z-axis). . The
red arrows demonstrate areas of little surface topography variation and the
blue arrows show areas of pronounced surface topography.
4.1.1.4 Lava Plus™ (LP)
The Lava Plus™ samples were examined at 150x and 650x magnification via SEM and a
MeX 3-D image was generated of the surface topography. These are demonstrated in Figures
57, 58, and 59. Figure 56 shows the gross view of a Lava Plus specimen material surface
which has a high luster. Figure 57 shows the sample at 150x magnification. Here, there are
obvious striations in the material surface within the image. These striations are very
pronounced. There may also be surface contamination either left over from the milling
process and sintered to the surface, or debris left on the surface after finishing procedures
were completed. Figure 59, which shows the MeX 3D image clearly demonstrates the surface
variation as seen in the 2D SEM images.

- 106 -
Figure 56. Gross view of Laval Plus™ sample with high surface luster evident.
Figure 57. Lava Plus™ sample material at 150x magnification. Red arrows show
the obvious striations in the material surface. The blue arrows show
surface contamination or debris.

- 107 -
Figure 58. Lava Plus™ sample material at 650x magnification.
Figure 59. Lava Plus™ MeX 3-D image generated for quantitative analysis of the
surface topography. Dimensions are 466µm (x-axis) x 317µm (y-axis) x
20µm (z-axis).

- 108 -
4.1.1.5 BruxZir™
The BruxZir™ sample was examined at 150x and 650x magnification via SEM and a MeX 3-
D image was generated of the surface topography. These are demonstrated in Figures 61, 62,
and 63. Figure 60 shows the gross view of the material surface which has a mat type finish
with little luster. Figure 61 shows the sample at 150x magnification. Here, there are obvious
striations in the material surface within the image. These striations are very pronounced.
There may also be surface contamination either left over from the milling process and sintered
to the surface, or debris left on the surface after finishing procedures were completed. Figure
63 which shows the MeX 3D image clearly demonstrates the surface variation as seen in the
2D SEM images.
.
Figure 60. Gross view of BruxZir™ sample

- 109 -
Figure 61. BruxZir™ sample material at 150x magnification. The red arrows
demarcate the striations in the material surface and the blue arrows
show possible debris on the surface.
Figure 62. BruxZir™ sample material at 650x magnification.

- 110 -
Figure 63. MeX 3-D image of a BruxZir™ specimen generated for quantitative analysis of
the surface topography. Dimensions are 468µm (x-axis) x 318µm (y-axis) x
17µm (z-axis).
4.1.1.6 DenZir™
The DenZir™ sample was examined at 150x and 650x magnification via SEM and a MeX 3-
D image was generated of the surface topography. These are demonstrated in Figures 65, 66,
and 67. Figure 64 shows the gross view of the material surface which has a high luster finish.
Figure 65 shows the sample at 150x magnification. Here, there are no obvious striations in the
material surface within the image. There are areas of inclusion in the material surface as
shown in Figure by the red arrows. There may also be surface contamination either left over
from the milling process and sintered to the surface, or debris left on the surface after
finishing procedures were completed. Figure 67 which shows the MeX 3D image clearly
demonstrates the surface variation as seen in the 2D SEM images.

- 111 -
Figure 64. Gross view of DenZir™ sample
Figure 65. DenZir™ sample material at 150x magnification.

- 112 -
Figure 66. DenZir™ sample material at 650x magnification. The red arrows indicate
surface defects and the blue arrows show possible surface contamination.
Figure 67. MeX 3-D image generated for quantitative analysis of the surface topography.
Dimensions are 467µm (x-axis) x 317µm (y-axis) x 12µm (z-axis).

- 113 -
4.1.2 Post wear surface evaluation
The SEM qualitative analysis was also undertaken for the materials post testing which are
seen in Figures outlined in the following section.
4.1.2.1 Acrylic antagonist and test material samples
Group 1: Acrylic Antagonist opposing Acrylic material sample
The acrylic antagonist is shown in Figure 68 at the pre-testing and post-testing intervals at the
gross level. Figure 68 (b) shows a clear wear facet in the acrylic antagonist as indicated by the
red arrow. Figure 69 demonstrates the acrylic sample specimen at the completion of
antagonist wear testing and a clear wear facet with a change in surface topography is shown
by the red arrows.
a. b.
Figure 68. a. The acrylic antagonist pre-testing, and b. the acrylic antagonist post
testing (representative of the group). The red arrows indicate the area of
change on the cusp tip.

- 114 -
Figure 69. The gross view of an acrylic sample post testing with red arrows clearly
showing a wear facet area.
Figure 70 shows the worn surface of the acrylic antagonist following 240,000 cycles. The red
arrows indicates the wear facet area where attrition type striations are obvious. The blue arrow
shows the polished surface which has not been subjected to two-body wear. There are clear
differences between the two areas of the material surface. Breakdown in the surface can also
be seen adjacent the green arrows and debris or surface artifact is visible at the orange arrows.
The Me-X generated image of the surface is seen in Figure 71 which highlights the surface
texture.

- 115 -
Figure 70. The worn surface of acrylic antagonist (versus acrylic) at 120x
magnification. a. The edge of the wear facet, b. The polished, but unworn
area of the antagonist. The red arrows indicates the wear facet area where
attrition type striations are obvious. The blue arrow shows the polished
surface which has not been subjected to two-body wear. There are clear
differences between the two areas of the material surface. Breakdown in
the surface can also be seen adjacent the green arrows and debris or
surface artifact is visible at the orange arrows.
Figure 71. The worn surface of acrylic antagonist (opposing acrylic).

- 116 -
Figure 72. The worn area of the acrylic sample (opposing acrylic antagonist) at 120x
magnification SEM. a. The contact wear facet. b. The non-contacted
polished area.
Figure 72 demonstrates the worn surface of acrylic sample (opposing acrylic antagonist)
showing parallel striations up to the border with the unpolished part of the sample which was
described by Kaidonis (2008) as being representative of attrition. The Me-x generated image
of the acrylic sample material specimen wear facet is shown in Figure 73.
Figure 73. Me-X generated image of the wear facet within the acrylic material specimen.

- 117 -
Group 2: Acrylic Antagonist opposing Lava Ultimate material sample
The acrylic antagonist is shown in Figure 74 (page 123) at the pre-testing and post-testing
intervals at the gross level. Figure 74 (b) shows a clear wear facet in the acrylic antagonist as
indicated by the red arrow.
a. b.
Figure 74. acrylic versus laval ultimate. a. The acrylic antagonist pre-testing, and b, the
acrylic antagonist post testing in a specimen representative of the group.
Figure 75 shows the worn surface of the acrylic antagonist (versus lava ultimate) at 120x
magnification. No obvious striations are present, however the red arrows indicate areas of
surface degradation in the acrylic antagonist material. The Me-X generated image of the
AA specimen is represented in Figure 76.

- 118 -
Figure 75. An SEM image taken at 150x magnification of the worn surface of acrylic
antagonist (versus LU). a. The wear facet area. b. The unworn polished area.
Figure 76. The MeX 3D image of the acrylic antagonist material surface opposing the lava
ultimate sample material.
Figure 77 shows a representative specimen of the lava ultimate sample™ at the completion of
antagonist wear testing and no clear wear facet is present. There was no change in surface
topography obvious at the gross level in most samples. Figure 78 demonstrates images from a
lava ultimate™ specimen where relatively deep grooves or striations are present. This only

- 119 -
occurred in two of the tested specimens. SEM images were taken at a higher magnification of
650 x (Figure 79) which highlights these “grooves”. Figures 80 and 81 respectively represent
the Me-X images of the wear facet of lava ultimate showing the area of little surface
topography variation marked by the letter ‘a’ in Figure 78 and the area of significant surface
topography variation indicated by the letter ‘b’ in Figure 78.
Figure 77. The worn surface of the lava ultimate material sample post testing
Figure 78. The worn surface of the lava ultimate™ (opposing acrylic antagonist) at
120x magnification. a. The wear facet. b. Significant texture change within
the wear facet area. ‘C’. The unworn polished surface area. The red arrow
indicates an area of deep grooves or striations in the material surface.

- 120 -
Figure 79. The worn surface of the lava ultimate (opposing acrylic antagonist) at 650x
magnification. The blue arrow indicates significant surface topography
changes were identified in the wear facet area of the lava ultimate material.
The orange arrow indicates the filler particles are clearly visible at 650x
magnification. . The red arrow demarcates an area of deep grooves or
striations in the material surface.
Figure 80. MeX generated image of the worn surface of lava ultimate (versus
acrylic antagonist).

- 121 -
Figure 81. MeX generated image of the worn surface of the lava ultimate sample (versus
acrylic antagonist) where the significant change is surface topography is
obvious.
Group 3: acrylic antagonist opposing eMax material sample
The acrylic antagonist is shown in Figure 82 at the pre-testing and post-testing intervals at the
gross level. Figure 82 (b) shows a clear wear facet in the acrylic antagonist as indicated by the
red arrow. The acrylic antagonists’ wear facet following the wear study is shown in the SEM
image at 150x magnification in Figure 83. The worn surface of the acrylic antagonist is
represented by the Me-X generated image of Figure 84. Figure 85 shows the eMax™ sample
at the completion of antagonist wear testing and no clear wear facet is present. There was no
change in surface topography obvious at the gross level in most samples (Figure 86). Figure
87 is representative of Me-X images from an eMax™ sample specimen where no striations or
grooves are present.

- 122 -
a.
b.
Figure 82. acrylic antagonist opposing eMax™. .a. The acrylic antagonist pre-testing, and
b, the acrylic antagonist post testing. This is a representative sample from the group.
Figure 83. The worn surface of the acrylic antagonist (opposing eMax™) at 120x
magnification. a. The wear facet. b. The unworn polished area. The red arrow indicates
areas of surface degradation. The blue arrow shows an area of debris on the surface.
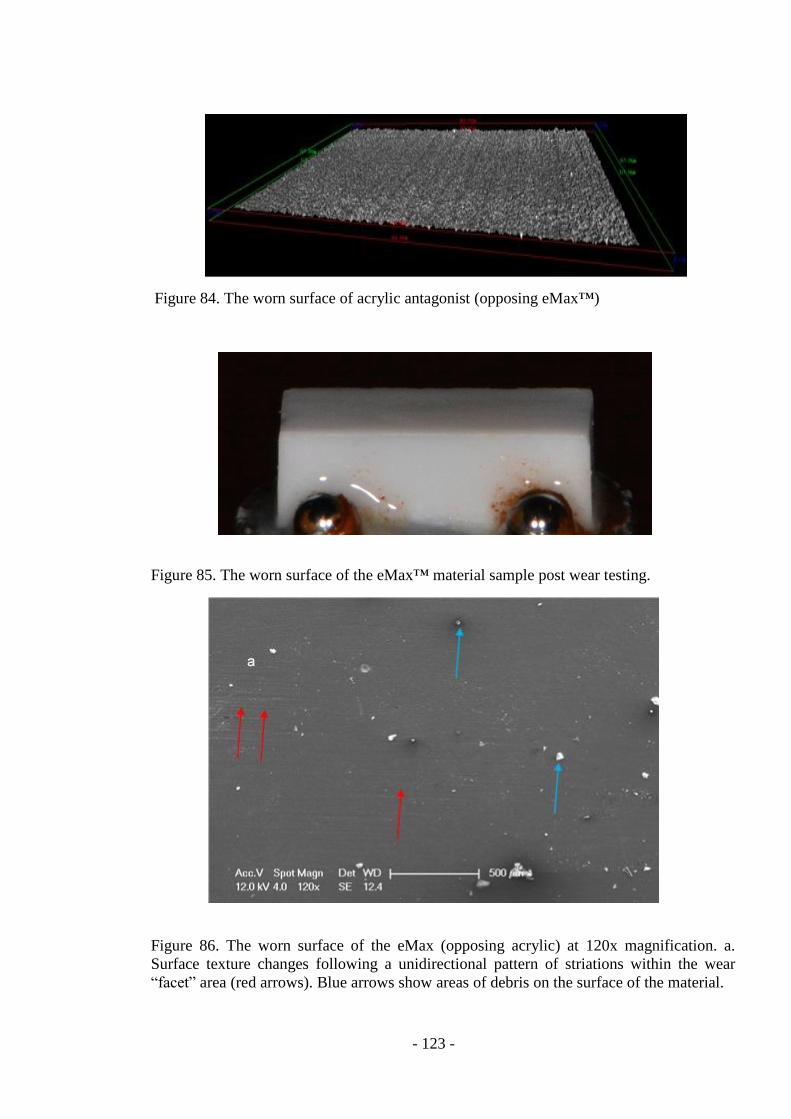
- 123 -
Figure 84. The worn surface of acrylic antagonist (opposing eMax™)
Figure 85. The worn surface of the eMax™ material sample post wear testing.
Figure 86. The worn surface of the eMax (opposing acrylic) at 120x magnification. a.
Surface texture changes following a unidirectional pattern of striations within the wear
“facet” area (red arrows). Blue arrows show areas of debris on the surface of the material.

- 124 -
Figure 87. The worn surface of the eMax™ sample (opposing acrylic antagonist)
Group 4: Acrylic Antagonist opposing Lava Plus material sample
The acrylic antagonist is shown in Figure 88 at the pre-testing and post-testing intervals at the
gross level. Figure 88 (b) shows a clear wear facet in the acrylic antagonist as indicated by the
red arrow. The SEM image of the worn surface of the acrylic antagonist at 120x
magnification clearly demonstrates a wear facet (Figure 89) and the Me-X generated image
(Figure 90) highlights the striations of the wear facet. The Lava Plus™ specimen at the
completion of wear testing and no clear wear facet (Figure 91). There was no change in
surface topography obvious at the gross level in most samples. Figure 92 shows images from
a Lava Plus sample where striations or grooves are present which are consistent with those
that were present in the pre-testing state. These are also obvious in the Me-X generated image
(Figure 93).

- 125 -
a. b.
Figure 88. acrylic versus Lava Plus™. .a. The acrylic antagonist pre-testing, and b, the
acrylic antagonist post testing.
Figure 89. The worn surface of the acrylic antagonist (opposing Lava Plus™) at 120x
magnification. Blue arrow - The wear facet area. Red arrow - The unworn polished area.

- 126 -
Figure 90. The worn surface of acrylic antagonist (versus LP). Red arrows indicate
striations (unidirectional) in the acrylic antagonist material surface.
Figure 91. The worn surface of the Lava Plus™ material sample.

- 127 -
Figure 92. The worn surface of the Lava Plus (opposing acrylic) at 120x
magnification. a. Similar surface topography as seen in the baseline scan.
Figure 93. MeX generated 3D image of the worn surface of Lava Plus™ (opposing
acrylic antagonist). The surface topography of the Lava Plus sample is as it
was prior to the testing phase with clear unidirectional features in the
material surface. As discussed earlier, these may be the result of the milling
process in manufacturing this material.
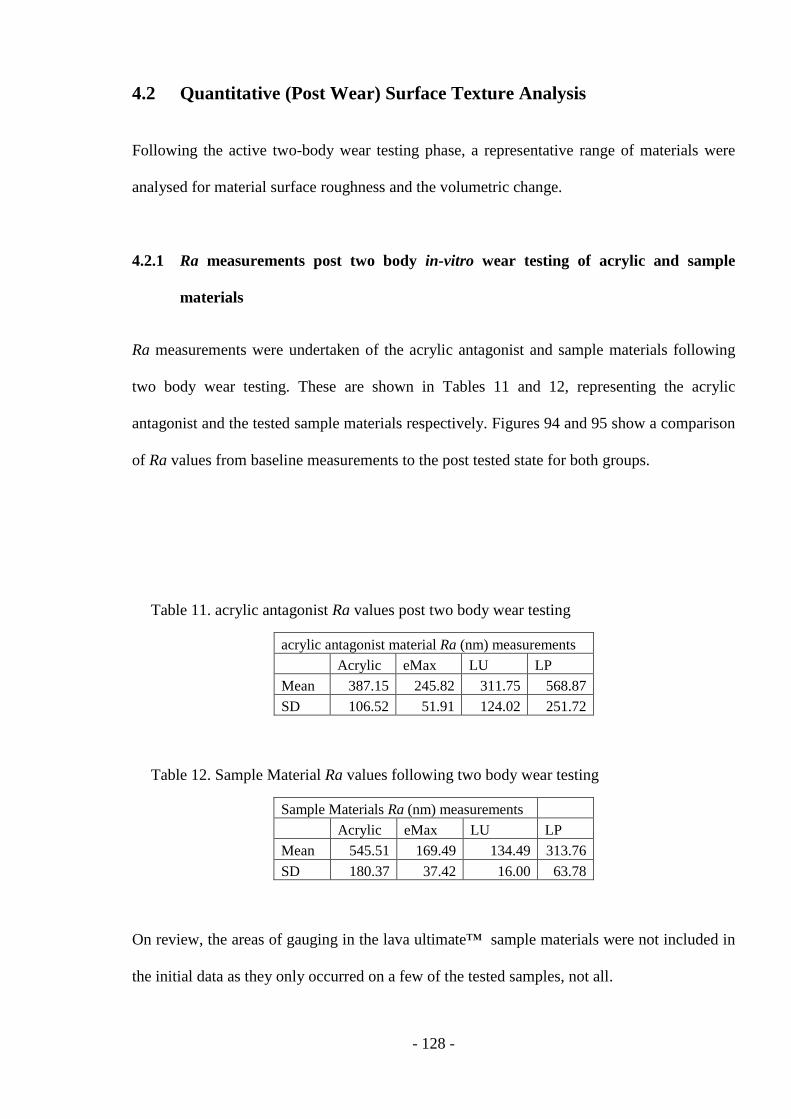
- 128 -
4.2 Quantitative (Post Wear) Surface Texture Analysis
Following the active two-body wear testing phase, a representative range of materials were
analysed for material surface roughness and the volumetric change.
4.2.1 Ra measurements post two body in-vitro wear testing of acrylic and sample
materials
Ra measurements were undertaken of the acrylic antagonist and sample materials following
two body wear testing. These are shown in Tables 11 and 12, representing the acrylic
antagonist and the tested sample materials respectively. Figures 94 and 95 show a comparison
of Ra values from baseline measurements to the post tested state for both groups.
Table 11. acrylic antagonist Ra values post two body wear testing
acrylic antagonist material Ra (nm) measurements
Acrylic eMax LU LP
Mean 387.15 245.82 311.75 568.87
SD 106.52 51.91 124.02 251.72
Table 12. Sample Material Ra values following two body wear testing
Sample Materials Ra (nm) measurements
Acrylic eMax LU LP
Mean 545.51 169.49 134.49 313.76
SD 180.37 37.42 16.00 63.78
On review, the areas of gauging in the lava ultimate™ sample materials were not included in
the initial data as they only occurred on a few of the tested samples, not all.

- 129 -
Figure 94. sample material Ra values (nm) at baseline and post two-body wear testing.
Acrylic sample material (A), Lava Plus™ (LP), Lithium Disilicate (eMax™),
and Lava Ultimate™ nanoceramic composite resin (LU).
Figure 95. Acrylic Antagonist material Ra values (nm) at baseline and post two-body
wear testing. Acrylic sample material (A), Lava Plus™ (LP), Lithium
Disilicate (eMax™), and Lava Ultimate™ nanoceramic composite resin
(LU).
Post Testing
Baseline
0
100
200
300
400
500
600
LU eMax LP Acrylic
Sample material Ra Pre- & Post-wear testing
Post Testing Baseline
Post testing
Baseline
0
200
400
600
800
eMax LU Acrylic LP
Acrylic Antagonist Ra Pre- & post-wear testing
Post testing Baseline

- 130 -
Student’s t-test was undertaken to determine if the differences in Ra values for the acrylic
antagonists opposing the sample materials of interest and the sample materials themselves
were significantly different from each other before and after two-body wear testing. The t-test
was done for all the materials within the tested groups. The results are shown in the Tables
outlined below.
When the Ra values in the post wear tested sample materials were compared, the pair-
wise comparisons (Table 13) show that apart from the eMax™ with a surface roughness
intermediate between that of the lava ultimate™ and Lava Plus™ (and not significantly
different to either) all other difference were statistically significant. Thus the null hypothesis
that all the materials would have the same Ra values post testing is rejected. It is evident that
after 240,000 cycles of two-body wear against and acrylic antagonist that:
The acrylic specimens were rougher than all other materials
The Lava Plus™ specimens were smoother than the acrylic but rougher than the lava
ultimate™
The eMax™ was smoother than the acrylic but similar in roughness to both the Lava
Plus™ and lava oltimate™
Lava ultimate™ was similar in roughness to the eMax™ but smoother than all of the
other materials.
Table 13. P-values for pairwise comparisons of Ra values within the post-wear testing
sample materials
Post Testing Ra differences between acrylic and the
other materials (p=0.05)
acrylic eMax
Lava
ultimate Lava
Plus
acrylic 0.022654 0.019352 0.022654
eMax 0.159515 0.012102
ultimate 0.00885
plus

- 131 -
When the Ra values in the post wear tested acrylic antagonists (see Table 14) were compared
the results show that none of the compared Ra values differed significantly (Table 14). Thus
the null hypothesis that after 240,000 cycles of two-body wear the Ra values for the acrylic
agonists will not differ significantly is supported.
Table 14. P-values for pairwise comparisons of the Ra values within the post-wear
testing acrylic antagonists
Post Testing Ra differences between acrylic antagonists
(p=0.05)
acrylic emax
Lava
ultimate Lava
Plus
acrylic 0.070398 0.445639 0.253731
emax 0.460952 0.080086
ultimate 0.141833
plus
4.2.2 Ra values of acrylic antagonists and material specimens before and after two-
body wear testing
A positive difference between pre- and post-wear Ra values between the acrylic antagonists
indicates and increase in roughness.
P-values for the pairwise comparisons of the pre-and post-test data for the acrylic
agonists (see Figure 95) for each material specimen group are shown in Table 15. The results
show that for the acrylic, eMax™, and lava ultimate™ groups the opposing acrylic
antagonists increased significantly in roughness. Only the Lava Plus™ specimens did not
result in a significant increase in roughness of the opposing tooth. Therefore, the null

- 132 -
hypothesis that the acrylic antagonists in all groups would have the same Ra values following
wear testing can be rejected.
Table 15. P-values for comparisons of Ra values of the acrylic antagonists before and
after two-body wear testing
Pre- and Post-Testing Ra differences of acrylic
antagonists between groups (p=0.05)
acrylic eMax
Lava
ultimate Lava
Plus
acrylic 0.015649
eMax 0.000529 Lava
ultimate 0.020995 Lava
Plus 0.693907
P-values for the comparison of pre-and post-wear Ra values of the tested sample
materials (see Figure 94) are shown in Table 16. The results showed no significant change in
surface roughness with 240,000 cycles of wear against an acrylic antagonist for that the
acrylic sample material, eMax™, and Lava Plus™ supporting the null hypothesis that there
would be no significant differences. The lava ultimate™ group, however, showed a
significant reduction in Ra indicating that it becomes smoother with wear.
Table 16. Significance testing of Ra values of the tested material samples before and
after two-body wear testing.
Post Testing Ra differences of sample materials between
groups (p=0.05)
acrylic eMax
Lava
ultimate Lava
Plus
acrylic 0.459246
eMax 0.706658
ultimate 0.005903
plus 0.254077

- 133 -
4.3 Volumetric analysis: acrylic antagonist (AA) and material sample specimen
volume loss following 240,000 cycles of tribology testing (Volume loss in mm3).
Paired opposing surfaces were profile mapped and digitally recorded at the beginning and end
of the wear cycle tests. There were three measurements taken of the antagonist material and
its paired sample material from which a mean value for each acrylic antagonist and its paired
material sample were formulated. These measurements were done prior to and after the wear
testing cycles. The mean and standard deviations were formulated from these data sets. The
mean volume losses for each opposing material are presented in Table 17 for both the acrylic
antagonist and its opposing material sample. These are presented graphically in Figure 96.
The complete results are shown in Appendix 3. Each antagonist material pairing consisted of
eight (8) pairs of acrylic antagonist material and sample test material.
The material volume change data following the two body wear testing phase indicated that the
Lava Ultimate™ material was the most abrasive of the acrylic antagonist, and the Lava
Plus™ was the least abrasive. Statistical significance testing was undertaken for the acrylic
antagonist material and the sample materials regarding their respective changes following
testing when compared to the acrylic control group. The null hypotheses here were that the
acrylic antagonists were worn equally by each opposing sample material and also, that the
sample materials were equally affected by the acrylic antagonist when compared to the acrylic
control group.

- 134 -
Table 17. Post testing material loss (wear) in mm3. Acrylic sample material (A), Lava
Plus™ (LP), Lithium Disilicate (eMax™), and Lava Ultimate™ nanoceramic
composite resin (LU).
Material Antagonist
Mean
(mm3)
s.d. Mean
(mm3)
s.d.
Acrylic 0.792 0.309 0.446 0.249
Lava
Ultimate
0.030 0.020 1.318 0.324
eMax 0.012 0.017 0.676 0.117
Lava Plus 0.024 0.045 0.405 0.102
Figure 96. Total mean material volume loss (mm3) for acrylic antagonists and sample
materials by test group and total overall combined antagonist and sample
material volume loss for each test group. Acrylic sample material (A), Lava
Plus™ (LP), Lithium Disilicate (eMax™), and Lava Ultimate™ nanoceramic
composite resin (LU).
P-values for the comparisons of the volumetric changes for the acrylic antagonists opposing
the sample materials of interest and the sample materials themselves are shown in Tables 18
and 19.
Sample Materials
Acrylic Antagonist
0
0.2
0.4
0.6
0.8
1
1.2
1.4
eMax Lava plus Lava Ultimate
Acrylic
Total Mean Material Loss (mm3)
Sample Materials Acrylic Antagonist

- 135 -
The data clearly show that when opposed to Lava Ultimate™ and eMax™, the acrylic
antagonist wear was significantly greater than the acrylic and Lava Plus™ groups. The Lava
Plus™ and acrylic versus acrylic antagonists wore at comparable rates. The acrylic antagonist
wear rates were greatest when worn against Lava Ultimate™ and least when worn against
Lava Plus™, with the differences between Lava Ultimate™, Lava Plus™ and eMax™ being
significantly different from each other. Ultimately Lava Plus™ is the same as the denture
tooth as highlighted in Table 18.
For the sample materials (Table 19), none of them wore significantly when compared with
acrylic.
Table 18. P-values for pairwise comparisons of acrylic antagonist wear when opposing
different sample materials.
AA wear RE
AA-A Control
Acrylic eMax Lava ultimate Lava Plus
Acrylic 0.039 0.000 0.677
eMax 0.001 0.000
Lava ultimate 0.000
Lava Plus

- 136 -
Table 19. P-values for pairwise comparison of different sample material wear when
opposing acrylic antagonist.
Sample wear RE
AA-A Control
Acrylic eMax
Lava
ultimate Lava Plus
Acrylic 0.0002 0.0002 0.0002
eMax 0.0803 0.5259
Lava ultimate 0.7418
Lava Plus

- 137 -
Section 5
Discussion

- 138 -
Section 5.0 - Discussion
5.1 Baseline/Pre-testing material analysis
The acrylic antagonist material and the material samples were examined prior to testing at the
“naked eye” level up to 650x magnification via SEM and by 3-D reconstruction of the surface
texture profile.
5.1.1 Qualitative Analysis
On visual examination the DenZir™ monolithic zirconia material demonstrated the highest
lustre of any of the materials. It is noteworthy that the DenZir™ material is a “HIP” zirconia
which was prepared in the post sintered state, unlike the other monolithic zirconia materials,
BruxZir™ and Lava Plus™ which are non-HIP zirconia materials which are initially prepared
in the pre-sintered state. The remaining zirconia materials also demonstrated a lustrous finish
similar to the eMax™ material. The Lava Ultimate™ and the acrylic material used for the
antagonist and control sample appeared smooth to the naked eye, however they lacked the
lustre of the ceramic materials.
SEM analysis of the surface texture of the materials was conducted at 120 x, 150 x, and 650
x magnification. Under these magnifications it became obvious that the DenZir™ zirconia
material which showed the highest lustre to the naked eye, also demonstrated a surface which
generally lacked surface topography changes. The BruxZir™ and Lava Plus monolithic
zirconia materials had obvious peaks and rises in their respective surfaces which may be the
result of the manner in which they are manufactured with diamond burs to reduce a solid
block of this material to the crown form designed on the relevant software system. The Lava
Plus material demonstrated what appeared to be larger peaks and troughs in the surface
topography when compared to the BruxZir™ material. The eMax™ material demonstrated a

- 139 -
surface which was closer to the DenZir™ material than the other materials. The eMax™
surface demonstrated minimal variations in the surface texture, however there were a number
of isolated rises which may be particles that have been sintered to the surface as a result of the
milling process. The Lava Ultimate™ and the acrylic antagonist and sample were all polished
with 2000 grit silicone abrasive paper prior to testing. All three materials demonstrated a
similar surface finish under magnification with obvious peaks and troughs in the surface
texture.
The 3-D surface texture images clearly demonstrated variations in the surface topography of
each of the materials used within this study. The striations present in the acrylic, Lava
Ultimate™, Lava Plus™, and BruxZir™ materials were clearly reproduced in the generated
3-D images.
The 3-D images for the DenZir™ material samples showed little surface texture variation as
with the preceding SEM images. From a qualitative perspective, the DenZir™ material
clearly lacked the surface topography of the other materials. This was followed by the
eMax™ sample, the BruxZir™ material, then the Lava Plus™, Lava ultimate™, and acrylic
materials.
The SEM MeX generated images of the surface topography of dental materials provided a
useful tool for qualitative assessment of a materials surface and gave a valuable insight into
the changes in surface topography from a pre-testing state to the post-testing state. Clear
patterns emerged for the different materials regarding the development of a wear facet and the
degradation of a given materials surface following antagonistic two-body wear.

- 140 -
5.1.2 Quantitative Surface Texture Analysis
Quantitative analysis via SEM images following the Ra and Sa protocol of the acrylic
antagonist and sample material, eMax™, Lava Ultimate™, Lava Plus™, BruxZir™, and
DenZir™ materials was undertaken. Historically, the two-dimensional Ra method has been
used to quantify surface texture. However, a novel three-dimensional approach is now
available, the Sa (3-D), which was also undertaken in this study to assess if this can provide
more accurate surface texture analysis results for dental materials of interest. To firstly
characterize the materials of interest and secondly compare the Ra and Sa values for given
materials, Ra and Sa analysis was undertaken on the material samples prior to any testing
phase.
To allow a direct comparison of the Ra and Sa data analysis was undertaken here on the
same images. The results showed that the Sa method appeared to be more sensitive to
variations in surface topography but both the Ra and the Sa methods indicated the same
overall order of the materials regarding the values for the surface topography and the Ra and
Sa were highly correlated (r=0.94). In terms of surface texture or roughness, the highest
values were attained for the Acrylic group followed by Lava Plus™, DenZir™, Lava
Ultimate™, eMax™, and BruxZir™ in descending Ra and Sa value order.
Given that the same order was achieved in terms of ranking the materials of interest in terms
of most to least rough, it is logical to suggest that both methods can be used to rank materials
and give a quantifiable value of the relative surface roughness or texture of a given material of
interest. One important factor to consider is that the Ra method is much quicker and cheaper
- 141 -
to undertake when compared to the 3-D Sa method and thus can be more readily used in
dental material surface texture analysis.
5.2 Post two-body in-vitro wear testing analysis
Two-body in-vitro wear testing was undertaken utilising an acrylic antagonist cusp-form
opposing four materials including acrylic as control, Lava Ultimate™, Lava Plus™, and
eMax™. The samples were subjected to 240,000 cycles of wear testing in a customised wear
machine. Following testing, the materials were subjected to the same methods of analysis
used for baseline assessments including qualitative analysis via visual inspection, SEM
imaging up to 650x magnification, and 3-D surface texture profile reproduction.
Quantitatively, the tested materials underwent Ra and Sa surface texture analysis in order to
quantify any changes in the worn or wear facet area. The materials were also examined via 3-
D profilometry to assess material volume loss over the 240,000 testing cycles. This was
conducted in order to quantify the wear (material loss) relationship between these opposing
materials.
5.2.1 Qualitative analysis
Visual assessment of the materials revealed that a clear wear facet developed on the acrylic
antagonist material for all tests undertaken. There were obvious wear facets in the control
acrylic material and the Lava Ultimate™ material, albeit to a much lesser extent, and no clear
wear facets were seen on the eMax™ or Lava Plus™ materials.
The wear facets in the acrylic antagonist material all appeared smooth, except in several cases
where it was opposing Lava Ultimate™ where gouged areas were obvious. There were also

- 142 -
gouge marks seen in the opposing Lava Ultimate™ material sample specimen. This type of
deterioration was only seen in three (3) of the tested Lava Ultimate™ groups.
The ceramic materials appeared unchanged following testing.
SEM analysis of the surface texture of the materials was conducted at 120 x, 150 x, and 650
x magnification. Under these magnifications it was evident that the surface topography of the
acrylic antagonist materials had changed from the baseline, where there was a clear
demarcation between the wear facet which now appeared much smoother than it did at
baseline. The exceptions to this were the gouge marks which appeared in some of the acrylic
antagonists opposing the Lava Ultimate™ material. It is speculated that this could be the
result of breakdown between the filler and matrix components in the Lava Ultimate™ surface
which creates irregularity in the opposing surfaces, and thus a gouging effect. This
irregularity is then exaggerated over the course of the wear cycles.
Where the acrylic opposed acrylic, there were obvious gouges which followed the uni-
directional movement of the antagonist material. The acrylic antagonists for the acrylic
control and the Lava Ultimate™ material sample clearly demonstrated more variation in
surface texture than the acrylic antagonists opposing the ceramic materials.
SEM imaging of the Lava Plus™ and the eMax™ material samples showed only minor
changes from the baseline images. The eMax™ images showed minor texture changes along
the unidirectional path of the wear machine. It is apparent that the ceramic materials had
“polishing” effect on the opposing acrylic antagonist material as less surface texture variation
was seen after the wear cycles.

- 143 -
The 3-D surface texture images clearly demonstrated variations in the surface topography of
each of the materials used within this study which corresponded to those evident is the 2-D
SEM images.
The 3-D image regenerated the surface profile of the Lava Ultimate™ samples and clearly
demonstrated the gouge marks in the material surface post testing. The 3-D images of the
eMax™ and Lava Plus™ materials demonstrated little qualitative change from the baseline
images. The MeX images provided a high resolution of the material surfaces which aided in
the qualitative assessment of the materials tested.
5.2.2 Quantitative Analysis
Ra measurements were undertaken of the acrylic antagonist and sample materials following
two body wear testing.
The Ra values for the Acrylic Antagonists changed significantly from the baseline values as
the result of 240,000 cycles of in vitro wear. In this form of testing, the 240,000 cycles
corresponds to approximately 24 months in situ (Mello et al 2009).
The Ra data for the tested sample materials revealed that:
The acrylic specimens were rougher than all other materials
The Lava Plus™ specimens were smoother than the acrylic but rougher than the Lava
Ultimate™
The eMax™ was smoother than the acrylic but similar in roughness to both the Lava
Plus™ and Lava Ultimate™
Lava Ultimate™ was similar in roughness to the eMax™ but smoother than all of the
other materials.

- 144 -
5.2.3 Material Wear and Volume Changes
The volumetric analysis of material loss indicate that the acrylic antagonist suffered more
aggressive attrition-type wear and thus material loss when opposing the Lava Ultimate™
material compared to the control acrylic group and the eMax™ and Lava Plus™ groups. The
least acrylic antagonist wear was demonstrated for the acrylic versus Lava Plus group
followed by the acrylic control and the eMax groups. One possible reason for the Lava
Ultimate™ resin nano-ceramic composite causing a higher amount of wear on the acrylic
antagonist material is that the softer resin matrix is broken down quicker than the nano-
ceramic clusters, thus leaving the ceramic clusters exposed which results in an increase in
surface texture and a resulting increase in attrition effect.
Statistical significance testing via student’s t-test was undertaken regarding the differences in
Antagonist (Acrylic) wear (volume loss) when opposing different sample materials when
compared to the Acrylic versus Acrylic group which acted as a control. The p-value for
significance testing was set at p<0.05. The results of the testing are shown in Table 18 and the
data revealed the following;
The acrylic antagonists in the Lava Plus™ group were not significantly different from
the acrylic versus acrylic group.
The acrylic antagonists in the eMax™ and Lava Ultimate™ groups had p-values
<0.05 and were thus were worn significantly more than the acrylic antagonists in the
acrylic versus acrylic group.
The null hypothesis that the acrylic antagonist would be equally affected and thus
worn by each opposing material sample, was rejected.

- 145 -
The ceramic materials, eMax™, Lava Plus™, and the nano-ceramic composite resin Lava
Ultimate™ showed no significant change in volume from baseline levels. Statistical
significance testing was undertaken regarding the differences in sample material wear
(volume loss) when opposing the acrylic antagonist material when compared to the Acrylic
opposing Acrylic group. The p-value for significance testing was set at p<0.05. The results of
the testing are shown in Table 19 and the data revealed the following;
All of the material sample groups, eMax™, Lava Ultimate™, and Lava Plus™ had p-
values <0.05.
The null hypothesis that the material specimens would be as equally affected as the
acrylic specimen in the acrylic versus acrylic group was rejected.
The results for the overall combined material volume loss for the material specimen and the
corresponding acrylic antagonist showed the following:
The highest overall material volume loss that occurred (when both the acrylic
antagonist material and the material samples were combined) was found for the
acrylic-Lava Ultimate™ group.
This was followed closely by the acrylic-acrylic group.
The Lava Plus™ and eMax™ groups had the least amount of combined material wear
(volume loss).
Therefore, the ceramic materials, Lava Plus™ and eMax™ had the most favourable
interaction with the acrylic antagonist material in terms of the sample materials ability to
wear the opposing acrylic antagonist material.

- 146 -
Section 6
Conclusions

- 147 -
6.1 Surface texture analysis
6.1.1 Baseline/Pre-Wear testing
Qualitative assessment of the material sample specimens indicated that the DenZir™
material demonstrated a higher luster and little surface texture variation.
Two-Dimensional SEM imaging reviewed all materials have surface inclusions and
despite efforts to clean the surfaces, surface contaminants remained.
The surface texture analysis revealed that the BruxZir™ monolithic zirconia material
specimen had the lowest baseline surface texture values for Ra and Sa analysis and was
thus the smoothest material.
The Sa method of dental material surface texture analysis displays a higher sensitivity
to surface texture variation when compared to the simpler and less complex Ra method.
Both the Ra and Sa methods resulted in the same ranking of the tested materials in
terms of roughness or surface texture even though they gave different values.
The R-squared analysis revealed a value of 0.8858 which indicates a strong
relationship between the Ra and Sa values in terms of measuring dental material
surface texture.
The Sa method is more complex, time consuming and expensive than the Ra method.
6.1.2 Post two-body in-vitro wear testing
The acrylic antagonist materials showed a significant reduction in surface texture
following wear testing.
The sample material specimens didn’t show a significant reduction in surface texture
following wear testing opposing acrylic antagonist material.
- 148 -
6.2 Volumetric changes of acrylic antagonist specimens and material sample
specimens following
The ceramic materials, eMax™, Lava Plus™, and the nano-ceramic composite resin
Lava Ultimate™ showed no significant change in volume from baseline levels.
The material volume loss of the acrylic test sample material showed statistically
significant changes when compared to the ceramic and resin nano-ceramic material
specimens.
The acrylic antagonist had significantly higher volume loss when opposing the resin
nano-ceramic composite material compared to the other tested materials.
The use of an acrylic tooth cusp form in in-vitro two-body dental material wear
analysis allows for simple preparation and good quality control of the antagonist
material.

- 149 -
Section 7
References

- 150 -
1. Addy M, Shellis RP. Interaction between attrition, abrasion and erosion in tooth wear.
Monogr Oral Sci 2006;20:17-31
2. Al-Amleh B, Lyons K, Swain M. Clinical trials in zirconia: A systematic review. J
Oral Rehab 2010;37:641-652
3. Alarcon JV, Engelmeier RL, Powers JM, Triolo PT. Wear testing of composite, gold,
porcelain, and enamel opposing a removable cobalt-chromium partial denture alloy. J
Prosthodont 2009;18(5): 421-6.
4. Albashaireh ZSM, Ghazal M, Kern M. Two-body wear of different ceramic materials
opposed to zirconia ceramic. J Prosth Dent 2010;104:105-113
5. Albrecht T, Kirsten A, Kappert HF, Fischer H. Fracture load of different crown
systems on zirconia implant abutments. Dent Mater 2011;27(3):298–303.
6. Al-Hiyasat AS, Saunders WP, Sharkey SW, Smith GM, Gilmour WH. The abrasive
effect of glazed, unglazed, and polished porcelain on the wear of human enamel, and
the influence of carbonated soft drinks on the rate of wear. Int J Prosthodont, 1997;10:
269-82.
7. Al-Hiyasat AS, Saunders WP, Smith GM. Three-body wear associated with three
ceramics and enamel. J Prosth Dent 1999;82(4): 476-48.
8. Al-Hiyasat AS, Saunders SW, Sharkey SW, Smith GM, Gilmour WH. Investigation of
human enamel wear against four dental ceramics and gold. J Dent 1998;26(5):487-95.
9. Al-Omiri MK, Lamey PJ, Cooper C, Clifford T. Relationship between personality and
satisfaction with the dentition in tooth wear patients. Eur J Prosthodont Restor Dent
2006;14(4):179-84
10. Anusavice KJ. Phillips’ Science of Dental Materials, ed 11. Philadelphia: Saunders;
2003.

- 151 -
11. Al-Wahadni AM, Martin DM. An in vitro investigation into the wear effects of glazed,
unglazed and refinished dental porcelain on an opposing material. J Oral Rehab
1999;26(6): 538-546.
12. Attin T. Methods for assessment of dental erosion. Monogr Oral Sci 2006;20:152-72.
13. Auad SM, Waterhouse PJ, Nunn JH, Moynihan PJ. Dental caries and its association
with sociodemographics, erosion, and diet in schoolchildren from southeast Brazil.
Pediatr Dent 2009;31(3):229-35
14. Azzopardi, A., et al., A literature review of the techniques to measure tooth wear and
erosion. . Eur J Prosthodont Restor Dent 2000. 8: p. 93-7.
15. Bates JF, Stafford GD, Harrison A. Masticatory function-A review of the literature.
Part 1 The form of the masticatory cycle. J Oral Rehab 1975;2;281-301
16. Bates JF, Stafford GD, Harrison A. Masticatory function-A review of the literature.
Part 3 Masticatory performance and efficiency. J Oral Rehab 1976;3;57-67
17. Begg PR. Stone age man’s dentition. Am J Orthod 1954; 40: 298-312, 373-83, 462-75,
517-31.
18. Bello SM, Verveniotou E, Cornish L, Parfitt SA. 3-dimensional microscope analysis
of bone and tooth surface modifications: Comparisons of fossil specimens and
replicas. Scanning 2011;33(5):316-324
19. Bernhardt O, Gesch D, Splieth C, Schwahn C, Mack F, Kocher T. Risk factors for
high occlusal wear scores in a population-based sample: Results of the study of health
in Pomerania (SHIP). Int J Prosthodont 2004; 17:333-9
20. Berrett MJ. Functioning occlusion. Ann Aust Coll Dent Surg 1969; 2: 68-80
21. Berry DC, Poole DF. Masticatory function and oral rehabilitation. J Oral Rehab
1974;1(2):191-205.

- 152 -
22. Beuer F, Stimmelmayr M, Gueth J-F, Edelhoff D, Naumann M. In vitro performance
of full-contour zirconia single crowns. Dent Mater 2012;28(4);449-456
23. Beyron H. Optimal Occlusion. Dent Clin North Am 1969;(13): 537-554
24. Bocaege E, Humphrey LT, Hillson S. Technical Note: A new three-dimensional
technique for high resolution quantitative recording of perykymata. Am J Phys
Anthrop 2010;141:498-503.
25. Clayton JA, Green E. Roughness of pontic materials and dental plaque. J Prosth Dent
1970; 23(4): 407-411
26. Clelland NL, Agartala V, Knobloch LA, Seghi RR. Relative wear of enamel opposing
low-fusing dental porcelain. J Prosthodont 2003;12(3):168-75.
27. Clelland NL, Agartala V, Knoblock LA, Seghi RR. Wear of enamel opposing low-
fusing and conventional ceramic restorative materials. J Prosthodont 2001;10(1) 8-15.
28. Condon JR, Ferracane JL. Evaluation of composite wear with a new multimode oral
wear simulator. Dent Mater 1996;12(4): 218-26.
29. Cook PA, Griswold WH, Post AC. The effect of superficial colorant and glaze on the
surface texture of vacuum fired porcelain. J Prosth Dent 1984;51(4): 476-484.
30. Craig RG. Ceramics. In: Powers JM, Sakaguchi RL, editors. Craig's restorative dental
materials. London. Elsevier Mosby; 2006
31. Czichos H. Introduction to friction and wear. In: Friction and wear of polymer
composites. K Friedrich editor. Amsterdam: Elsevier 1986.
32. Dahl BH, Carlsson GE, Ekfeldt A. Occlusal wear of teeth and restorative materials: A
review of classification, etiology, mechanisms of wear, and some aspects of
restorative procedures. Act Odontol Scand 1993; 51:299-311

- 153 -
33. Dahl BL, Floystrand F, Karlsen K. Pathologic attrition and maximal bite force. J Oral
Rehab 1985; 12:337-42
34. Dawson P. Functional occlusion: From TMJ to smile design. Canada: Mosby; 2007.
35. DeLong R. Intra-oral restorative materials wear: rethinking the current approaches:
how to measure wear. Dent Mater 2006;22:702-11.
36. De Long R, Douglas WH. Development of the artificial environment for testing of
dental restoratives: Biaxial force and movement control. J Dent Res 1983; 62:92-113
37. DeLong RP, Pintado MR, Douglas WH. The wear of enamel opposing shaded ceramic
restorative materials. An in vitro study. J Prosth Dent 1992;68(1): 42-48.
38. DeLong R, Douglas WH, Sakaguchi RL, Pintado MR. The wear of dental porcelain in
an artificial mouth. Dent Mater 1986;2(5):214-9.
39. DeLong R, Sasik C, Pintado MR, Douglas WH. The wear of enamel when opposed by
ceramic systems. Dent Mater 1989;5;266-271
40. Denry I. Recent advances in ceramics for dentistry. Crit Review Oral Biol
Med1996;131: 47s-51s.
41. Denry IL. Recent advances in ceramics for dentistry. Crit Review Oral Biol Med
1996;7(2):134-43.
42. Derand P, Vereby P. Wear of low-fusing dental porcelains. The Journal of Prosthetic
Dentistry 1999;81(4): 460-463.
43. de Silva MFA, Davies RM, Stewart B. Effect of whitening gels on the surface
roughness of restorative materials in situ. Dent Mater 2006;22(10):919-924.
44. Eisenburger M, Addy M. Erosion and attrition of human enamel in vitro part 1:
interaction effects. J Dent 2002;30(7):341-7.

- 154 -
45. Elmaria A, Goldstein G, Vijayaraghavan T, Legeros RZ, Hittelman EL. An evaluation
of wear when enamel is opposed by various ceramic materials and gold. J Prosth Dent
2006;96(5):345-53.
46. Esquivel-Upshaw JF, Young H, Jones J, Yang M, Anusavice KJ. In vivo wear of
enamel by a lithia disilicate-based core ceramic used for posterior fixed partial
dentures: first-year results. Int J Prosthodont 2006;19(4): 391-6.
47. Etman MK, Woolford M, Dunne S. Quantitative measurement of tooth and ceramic
wear: in vivo study. Int J Prosthodont 2008;21(3): 245-52.
48. Every RG. A new terminology for mammalian teeth: Founded on the phenomenon of
thegosis. Parts 1 and 2. Christchurch, New Zealand: Pegasus; 1972.
49. Finger W, Thiemann J. Correlation between in vitro and in vivo wear of posterior
restorative materials. Dent Mater 1987: 3: 280-286.
50. Fisher RM., et al., The effects of enamel wear on the metal-porcelain interface. . J
Prosth Dent 1983. 50: p. 627-31.
51. Fischer TE, Anderson MP, Jahanmir S. Influence of fracture toughness on the wear
resistance of yttria-doped zirconium oxide. J Am Ceram Soc 1989;72(2): 252-7.
52. Fisher RM, Moore BK, Swartz ML, Dykema RW. The effects of enamel wear on the
metal-porcelain interface. J Prosth Dent 1983;50(5): 627-31.
53. Gadelmawla ES, Koura MM, Maksoud TM, Elewa IM, Soliman HH. Roughness
parameters. . J Mater Process Tech 2002;123: 133-14.
54. Ghazal M, Albashaireh ZS, Kern M. Wear resistance of nanofilled composite resin
and feldspathic ceramic artificial teeth. J Prosth Dent 2008;100(6):441-448.
55. Ghazal M, Hedderich J, Kern M. Wear of feldspathic ceramic, nano-filled composite
resin and acrylic resin artificial teeth when opposed to different antagonists. Eur J Oral
Sci 2008;116(6): 585-92
- 155 -
56. Ghazal M, Kern M. The influence of antagonistic surface roughness on the wear of
human enamel and nanofilled composite resin artificial teeth. J Prosth Dent
2009;101(5);342-349.
57. Ghazal M, Kern M. Wear of human enamel and nano‐filled composite resin denture
teeth under different loading forces. Journal of oral rehabilitation 2009;36(1): 58-64.
58. Ghazal M, Kern M. Wear of denture teeth and their human enamel antagonists.
Quintessence Int 2010;41(2):157-163.
59. Ghazal M, Steiner M, Kern M. Wear resistance of artificial denture teeth. Int J
Prosthodont 2008;21(2):166-8.
60. Ghazal M, Yang B, Ludwig K, Kern M. Two-body wear of resin and ceramic denture
teeth in comparison to human enamel. Dent Mater 2008;24(4);502-507.
61. Gibbs CH, Mahan PE, Lundeen HC, Brehnan K, Walsh EK, Holbrook WB. Occlusal
forces during chewing and swallowing as measured by sound transmission. J Prosth
Dent 1981;46(4): 443-9.
62. Giordano RA. Dental ceramic restorative systems. Compend Contin Educ Dent
1996;17(8): 779-82, 784-6 passim; quiz 794.
63. Grossman DG. Structure and physical properties of Dicor/MGC glass-ceramic. In:
Proceedings of the International Symposium on Computer Restorations. Mormann
WH, editor. Chicago:Quintessence Publishing. Co. 1991.
64. Glossary of Prosthodontic Terms 2005. No author. J PROSTH DENT July 2005.
Volume 94, issue 1. Pages 10-92.
65. Hacker CH, Wagner WC, Razzoog ME. An in vitro investigation of the wear of
enamel on porcelain and gold in saliva. J Prosth Dent 1996; 75(1):14-7.

- 156 -
66. Hahnel S, Behr M, Handel G, Rosentritt M. Two-body wear of artificial acrylic and
composite resin teeth in relation to antagonist material. J Prosth Dent 2009;101(4):
269-278.
67. Halling J. Principles of tribology. 1st ed. London: The Macmillan Press; 1975.
68. Hao Z, Yin H, Wang L, Meng Y. Wear behaviour of seven artificial resin teeth
assessed with three-dimensional measurements. J Prosth Dent 2014;
69. Hattab FN, Tassin OM. Etiology and diagnosis of tooth wear: A literature review and
presentation of selected cases. Int J Prosthodont 2000;13:101-7
70. Heintze SD. How to quality validate wear simulation devices methods. Dent Mater
2006;22(8):712–34.
71. Heintze SD, Cavalleri A, Forjanicb M, Zellweger G, Rousson V. Wear of ceramic and
antagonist-A systematic evaluation of influencing factors in vitro. Dental Mater
2008;24(4):433-449.
72. Heintze SD, Zellweger G, Grunert I, Muñoz-Viveros CA, Hagenbuch K. Laboratory
methods for evaluating the wear of denture teeth and their correlation with clinical
results. Dent Mater 2012;28(3): 261-272.
73. Hirano S, May K B, Wagner WC, Hacker CH. In vitro wear of resin denture teeth. J
Prosth Dent 1998;79(2): 152-155.
74. ISO, D.m., Guidance on testing of wear. Part 2: Wear by two-and/or three body
contact. Techn Specific 2001. No. 14569-2.
75. Ivoclar R D Vivadent AG, Schaan, Liechtenstein
76. Jagger DC, Harrison A. An in vitro investigation into the wear effects of selected
restorative materials on enamel. J Oral Rehab 1995; 22(4):275-81.

- 157 -
77. Jahanmir S. Friction and wear of ceramics. Chicago: CRC Press; 1993.
78. Jahanmir S, Fischer TE. Friction and wear of ceramics. In: Booser ER, editor. CRC
handbook of lubrication andtribology, vol. III, Monitoring, materials, synthetic
lubricantsand applications. Boca Raton, FL: CRC Press; 1994
79. Jones DW. Development of dental ceramics. An historical perspective. Dent Clin
North Am 1985;29(4): 621-44.
80. Kadokawa A, Suzuki S, Tanaka T. Wear evaluation of porcelain opposing gold,
composite resin, and enamel. J Prosth Dent 2006;96(4):258-65.
81. Kaidonis JA. Tooth wear: The view of the anthropologist. Cli Oral Invest 2008; Suppl
1:S21-26
82. Kaidonis JA, Richards LC, Townsend GC, Tansley GD. Wear of human enamel: a
quantitative in vitro assessment. J Dent Res 1998;77(12): 1983-90.
83. Kaifu Y, Kasai K, Townsend GC and Richards LC. Tooth wear and the “design” of
the human dentition: a perspective from evolutionary medicine. Am J Phys Anthropol
Suppl 2003; 37: 47-61
84. Kelleher M, Bishop K. The aetiology and clinical appearance of tooth wear. Euro J
Prosthodont Restor Dent 1997; 5:157-60
85. Kelly JR, Benetti P. Ceramic materials in dentistry: historical evolution and current
practice. Aust Dent J 2011;56(1 Suppl): 84-96.
86. Kelly J, Nishimura I, Campbell SD. Ceramics in Dentistry. Historical roots and
current perspectives. J Prosth Dent 1996;75(1): 18-32.
87. Kragelskii IV. Friction and wear. London: Butterworths, 1965.
- 158 -
88. Kramer N, Kunzelmann KH, Taschner M, Mehl A, Garcia-Godoy F, Frankenberger R.
Antagonist enamel wears more than ceramic inlays. J Dent Res 2006;85(12) 1097-
100.
89. Krejci I, Lutz F, Reimer M. Wear of CAD/CAM ceramic inlays: restorations,
opposing cusps, and luting cements. Quintessence Int 1994;25(3):199
90. Lambrechts P, Braem M, Vuylsteke-Wauters M, Vanherle G. Quantitative in vivo
wear of human enamel. J Dent Res 1989;68:1752-4.
91. Lambrechts P, Vanherle G, Vuylsteke M, Davidson CL. Quantiative evaluation of the
wear resistance of posterior dental restorations: A new three-dimensional measuring
technique. J Dent 1984; 12:252-67
92. Lawn BR, Wiederhorn SM, Roberts DE. Effect of sliding friction forces on the
strength of brittle materials. J Mater Sci 1984;19:2561-9.
93. Lee A, He LH, Lyons K, Swain MV. Tooth wear and wear investigations in dentistry.
J Oral Rehab 2012;39(3):217-25.
94. Leigh M. Surface texture analysis: The handbook. Hommelwerke GmbH; 1992.
95. Leitao J, Hegdahl T. On the measuring of roughness. Acta Odontol Scand 1981;39:
379-8.
96. Li H, Zhou Z. Wear behavior of human teeth in dry and artificial saliva conditions.
Wear 2001;246:980-984.
97. Litonjua LA, Andreana S, Bush PJ, Cohen RE. Tooth wear: Attrition, erosion, and
abrasion. Quintessence Int 2003;34:435-46
98. Liu PR, Ranjitkar S, Kaidonis J, Townsend G, Richards L.. A system for the
acquisition and analysis of three-dimensional data describing dental morphology. Dent
Anthrop 2004;17(3):70-4

- 159 -
99. Lutz F, Krejci I, Barbakow F. Chewing pressure vs. wear of composites and opposing
enamel cusps. J Dent Res 1992;71(8): 1525-9.
100. Ma T, Johnson GH, Gordon GE. Effects of chemical disinfectants on surface
characteristics and color of three fixed prosthodontic crown materials. J Prosth Dent
1999;82(5):600-607.
101. Magne P, Oh WS, Pintado MR, DeLong R. Wear of enamel and veneering
ceramics after laboratory and chairside finishing procedures. J Prosth Dent 1999;82(6)
669-79.
102. Mahalick JA, Knap FJ, Weiter EJ. Occlusal wear in prosthodontics. J Am Dent Assoc
1971; 82:154-9.
103. Mair LH. Wear in dentistry-current terminology. J Dent 1992;20(3): 140-4.
104. Mair LH, Stolarski TA, Vowles RW, Lloyd CH. Wear: Mechanisms, manifestations
and measurement: Report of a workshop. J Dent 1996; 24:141-8.
105. Martinez-Gomis J, Bizar J, Angled JM, Samso J, Peraire M. Comparative evaluation
of four finishing systems on one ceramic surface. Int J Prosthodont 2003;16(1): 74-77.
106. McLaren EA, Cao PT. Ceramics in dentistry-part 1: Classes of materials. Inside
dentistry 2009; 10: 94-103.
107. McLean JW. The Science and Art of Dental Ceramics. Volume I: The Nature of
Dental Ceramics and Their Clinical Use. Chicago, IL: Quintessence Publishing Co;
Monograph 1; 1979.
108. McLean J. Perspectives on dental ceramics. In: Dental Ceramics. Proceedings of the
First International Symposium on Dental Ceramics. Chicago: Quintessence; 1984.
109. Mehl A, Gloger W, Kunzelmann KH, Hickel R. A new optical 3-D device for the
detection of wear. J Dent Res 1997;76:1799-807

- 160 -
110. Mello PC, Coppede AR, Macedo AP, Mattos MDG, Rodrigues RCS, Ribeiro RF.
Abrasion wear resistance of different artificial teeth opposed to metal and composite
antagonists. J Appl Oral Sci 2009;17(5):451-456
111. Metzler KT, Woody RD, Miller AW, Miller BH. In vitro investigation of the wear of
human enamel by dental porcelain. J Prosth Dent 1999;81(3):356-64.
112. Meyers IA. Diagnosis and management of the worn dentition: Risk management and
pre-restorative strategies for the oral and dental environment. Ann R Australas Coll
Dent Surg 2008;19:27-30
113. Molnar S. Tooth wear and culture: a survey of tooth functions among some
prehistoric populations. Curt Anthropol 1972; 13:511-26
114. Monasky GE, Taylor DF. Studies on the wear of porcelain, enamel and gold. J Prosth
Dent 1971;25(3):299-306.
115. Muia PJ, The four Dimensional tooth colour system. Chicago: Quintessence; 1982.
116. Naylor WP. Introduction to metal ceramic technology. Chicago: Quintessence
publishing; 2009.
117. Nishigawa K, Bando E, Nakano M. Quantitative study of bite force during sleep
associated bruxism. J Oral Rehab 2001;28(5):485-91.
118. Nguyen C, Ranjitkar S, Kaidonis JA, Townsend GC. A qualitative assessment of non-
carious cervical lesions in extracted human teeth. Aust Dent J 2008;53:46-51
119. Oh WS, Delong R, Anusavice KJ. Factors affecting enamel and ceramic wear: a
literature review. J Prosth Dent 2002;87:451-9.
120. O'Kray, HP, O’Brien WJ. In vitro human enamel wear by a hydrated high alkali
porcelain. Quintessence Int 2005;36(8): 617-22.
121. Palmer DS, Barco MT, Pellet GB, McKinney JE. Wear of human enamel against a
commercial castable ceramic restorative material. J Prosth Dent 1991;65(2) 192-5.
- 161 -
122. Pindborg JJ. Pathology of the dental hard tissues. Copenhagen: Munksgaard;
1970:312-21, 294-325.
123. Poon CY, Bhushan B. Comparison of surface roughness measurements by stylus
profiler, AFM, and non-contact optical profiler. Wear 1995;190:76-88.
124. Poynter ME, Wright PS. Tooth wear and some factors influencing its severity.
Restorative Dent 1990;6:8-11
125. Preis V, Behr M, Kolbeck C, Hahnel S, Handel G, Rosentritt M. Wear performance
of substructure ceramics and veneering porcelains. Dent Mater 2011;27(8):796–804.
126. Pugh B. Wear. In: Friction and Wear. London: Newnes-Butterworths; 1973: 141-172.
127. Ramp MH, Ramp LC, Suzuki S. Vertical height loss: an investigation of four
restorative materials opposing enamel. J Prosthodont 1999;8(4): 252-7.
128. Ramp MH, Suzuki S, Cox C, Lichfield WR, Koth DL. Evaluation of wear: enamel
opposing three ceramic materials and a gold alloy. J Prosth Dent 1997;77(5) 523-30.
129. Ranjitkar S, Kaidonis JA, Townsend GC, Vu Am, Richards LC. An in vitro
assessment of the effect of load and pH on wear between opposing enamel and dentine
surfaces. Arch Oral Biol 2008;53:1011-6
130. Ratledge DK, Smith BG, Wilson RF. The effect of restorative materials on the wear of
human enamel. J Prosth Dent 1994;72(2):194-203.
131. Reis KR, Bonfante G, Pecoraro LF, Conti PCR, Oliveira PCGD, Kaizer OB. In vitro
wear resistance of three types of Polymethyl Methacrylate denture teeth. J App Oral
Sci 2008;16(3):176-180
132. Richards LC. Principal axis analysis of dental attrition data from two Australian
Aboriginal populations. Am J Phys Anthropol 1984;65(1)5-13.

- 162 -
133. Richards LC. Tooth wear and temporomandibular joint change in Australian
Aboriginal populations. Am J Phys Anthropol 1990; 82:377-84
134. Richards LC, Brown T. Dental attrition and age relationships in Australian
Aboriginals. Archaeol Phys Anthropol Ocean 1981;16:94-8
135. Richards LC, Kaidonis JA, Townsend GC. A model for the prediction of tooth wear
in individuals. Aust Dent J 2003;48:259-62
136. Ritter R. Dental ceramics. J Esthet Restor Dent 2010;22(5).
137. Rosenblum MA, Schulman A. A review of all-ceramic restorations. J Am Dent Assoc
1997;128(3):297-307.
138. Sarikaya I, Guler AU. Effects of different polishing techniques on surface roughness
on the surface roughness of dental porcelains. Journal of applied science 2010;
18(1):10-16.
139. Seghi, R.R., F. Rosenstiel S, and B. P., Abrasion of human enamel by different dental
ceramics in vitro. J Dent Res, 1991. 70: p. 221-5.
140. Shabanian M, Richards LC. In vitro wear rates of materials under different loads and
varying pH. J Prosth Dent 2002; 87(6): 650-6.
141. Shetty MS, Shenoy KK. An in vitro analysis of wear resistance of commercially
available acrylic denture teeth. J Ind Pros Soc 2010;10(3):149-153
142. Smith BG. Tooth wear: Aetiology and diagnosis. Dent Update 1989;16:204-12.
143. Smith BG. A personal, historical view of the management of tooth wear. Br Dent J
1996;180(6):204-5
144. Smith BG, Knight JK. An index for measuring the wear of teeth. Br Dent J
1984;157:16-9

- 163 -
145. Smith BG, Robb ND. The prevalence of tooth wear in 1007 dental patients. J Oral
Rehab 1996;23(4): 232-9.
146. Stawarczyk B, Ozcan M, Schmutz F, Trottmann A, Roos M, Hammerle CH. Two-
body wear of monolithic, veneered and glazed zirconia and their corresponding enamel
antagonists. Acta Odontol Scand 2012 Early Online, 1-11.
147. Stober T, Lutz T, Gilde H, Rammelsberg, P. Wear of resin denture teeth by two-body
contact. Dent Mater 2006;22(3):243-249.
148. Suh NP. The delamination theory of wear. Wear 1973;25: 111-124.
149. Suwannaroop P, Chaijareenont P, Koottathape N, Takahashi H, Arksornnukit M. In
vitro wear resistance, hardness and elastic modulus of artificial denture teeth. Dental
Mater 2011;30(4): 461-468.
150. Taylor DF, Bayne SC, Sturdevant JR, Wilder AD. Comparison of direct and indirect
methods for analyzing wear of posterior composite restorations. Dent Mater 1989;
5(3):157-60.
151. The glossary of prosthodontics terms. J Prosth Dent 2005; 94(1):10-92
152. Tholt de Vasconcellos B, Miranda-Júnior WG, Prioli R. Surface roughness in
ceramics with different finishing techniques using atomic force microscope and
profilometer. Oper Dent 2006;31(4):442-449.
153. Thomas TR. Trends in surface roughness. International Journal of Machine Tools and
Manufacture 1998;38(5-6):405-411
154. United Nations, Department of Economic and Social Affairs, Population Division (2009).
World Population Prospects: The 2008 Revision, Highlights, Working Paper No.
ESA/P/WP.210

- 164 -
155. Vailati F, Belser UC. Palatal and facial veneers to treat severe dental erosion: A case
report following the three-step technique and the sandwich approach. Eur J Esthet Dent
2011;6(3):268-78
156. Van Noort R. Introduction to dental materials. London: Mosby; 1994.
157. White SN. Mechanical fatigue of a feldspathic dental porcelain. Dent Mater 1993;
9(4): 260-4.
158. Whitley JQ, Kusy RP, Mayhew MJ, Buckthat JE. Surface roughness of stainless steel
and electoformed nickel standards using a HeNe laser. Optics and Laser technology
1987;19:18.
159. Wiegand A, Attin T. Occupational dental erosion from exposure to acids: A review.
Occup Med 2007;57:169-76.
160. Wright MD, Masri R, Driscoll CF. Comparison of three systems for the polishing of
an ultra-low fusing dental porcelain. J Prosth Dent 2004;92(5):486-49.
161. Xhonga FA. Bruxism and its effect on the teeth. J Oral Rehab 1977; 4:65-76
162. Zeilgler H. The father of porcelain dental art. Dominion Dent J 1905.
163. Zeng J, Sato Y, Ohkubo C, Hosoi T. In vitro wear resistance of three types of
composite resin denture teeth. J Prosth Dent 2005;94(5): 453-457.
164. Zheng J, Zhou ZR. Effect of age on the friction and wear behaviors of human teeth.
Tribology Int 2006;39(3): 266-273.
165. Zheng J, Zhou ZR. Friction and wear behaviour of human teeth under various wear
conditions. Tribology Int 2007;40(2): 278-284.
166. Zum-Gahr KH. Classification of wear processes. In: Microstructure and Wear of
materials. Amsterdam: Elsevier; 1987: 80-90.

- 165 -
Section 8
Appendices

- 166 -
8.1 Appendix 1 – Literature review table summary of in-vitro wear studies on artificial denture teeth
Author Denture tooth
materials
Tested
Antagonist
material and
type
Wear
Machine
Load
(N)
Cycle
number
Lubricant Wear
measurement
method
Findings Summary
Hao et al 2014 Seven: 1.
Cross-linked
PMMA with
PMMA pearls;
2. MPM-
PMMA with
polymerised
PMMA;
3. 10% IPN &
90% HXL
polymers;
4. Composite
resin;
5. PFMA with
particle fillers;
6. PMMA;
7. PMMA
12mm diameter
silicone nitride
ceramic ball
Abrasive
tester; Pin-
on-Block
design
(TE**;
Phoenix
Tribology
Ltd)
49 50,000 cycles
@ 1.2Hz,
1mm
movement
Thermocyclin
g 5-55º water
@ 2min
cycles
Height and volume
via laser scanning
microscope
Composite resin and
highly cross-linked
teeth showed better
wear resistance versus
the conventional
PMMA teeth

- 167 -
Ghazal et al
2010
Four: 1.
Feldspathic
ceramic;
2. Acrylic
(UDMA/PMM
A);
3. Composite
resin;
4. IPN-PMMA
Human enamel Dual-axis
chewing
simulator
(willytec)
49 300,000 Thermocyclin
g 5-55º water
@ 2min
cycles
Laser scanning
profilometry, SEM.
Microscopy
Acrylic teeth showed
less wear resistance
versus composite resin
teeth and ceramic
teeth. Composite resin
teeth showed more
wear versus ceramic
teeth. Acrylic shows
fatigue type wear and
composite resin shows
attritional wear with
loss of filler particles.
Shetty et al
2010
Three: 1.
Surana
Ultradent;
2. Premadent;
3. Dentek.
600 Grit
silicone carbide
paper
Ducom
friction
wear
machine
(custom)
2 10,000 Nil Volume change Surana Ultradent
acrylic denture teeth
showed the least wear

- 168 -
Mello et al 2009 Seven in total:
1. High-density
Cross-linked
PMMA;
2. PMMA,
EDMA;
3. Cross-linked
PMMA;
4. PMMA,
EDMA,
Pigments;
5. Synthetic
polymer-based
on PMMA,
double cross-
linked;
6. Synthetic
polymer based
on PMMA
(Gnathostar);
7. Microfilmed
composite
resin, UDMA.
Two:
1. Ni-Cr Alloy
(Vera Bond 2,
Aalba Dent Inc,
Cordelia, CA,
USA);
2. Indirect
Composite
Resin
“Solidex”
(Shofu Inc.
Tokyo, Japan)
“Customise
d”
5 40,000 @ 265
cycles/min
(equivalent to
120 days)
Distilled
water at 37℃
Nikon 6C profile
projector measuring
height change.
1. Most samples (inc
Gnathostar) showed
no significant
difference in wear rate
between metal &
composite resin
antagonists. 2.
Antagonists showed
no measurable wear
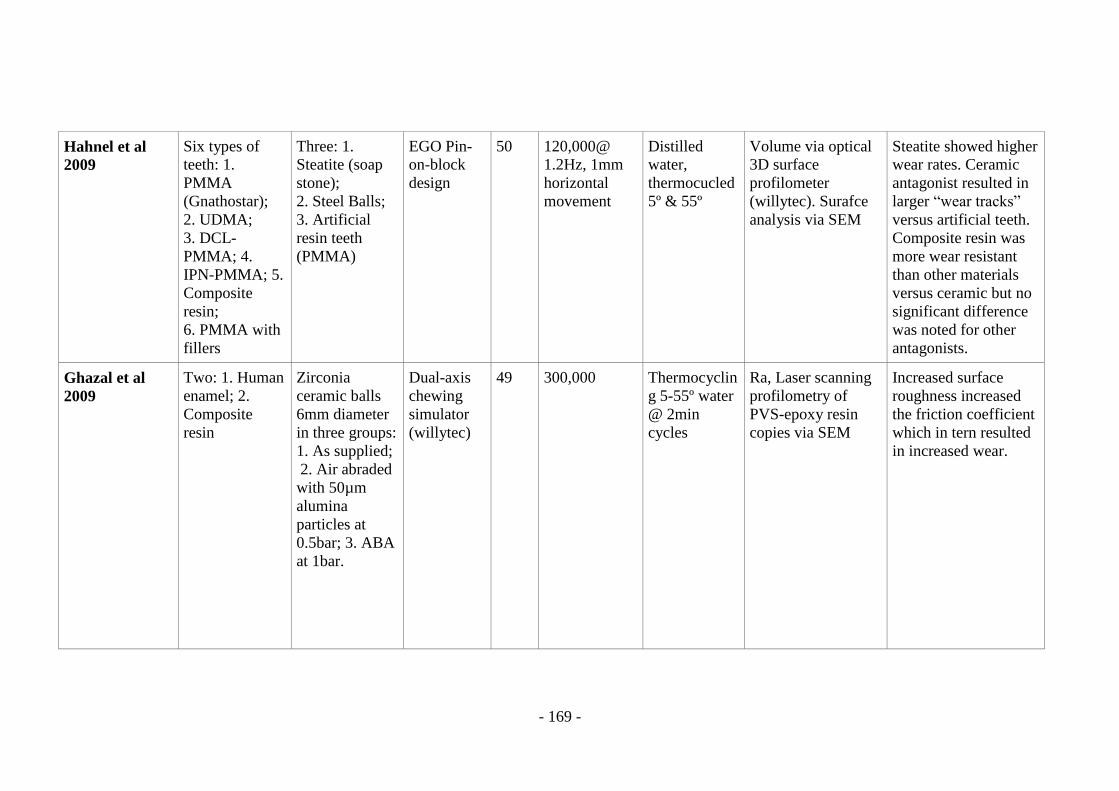
- 169 -
Hahnel et al
2009
Six types of
teeth: 1.
PMMA
(Gnathostar);
2. UDMA;
3. DCL-
PMMA; 4.
IPN-PMMA; 5.
Composite
resin;
6. PMMA with
fillers
Three: 1.
Steatite (soap
stone);
2. Steel Balls;
3. Artificial
resin teeth
(PMMA)
EGO Pin-
on-block
design
50 120,000@
1.2Hz, 1mm
horizontal
movement
Distilled
water,
thermocucled
5º & 55º
Volume via optical
3D surface
profilometer
(willytec). Surafce
analysis via SEM
Steatite showed higher
wear rates. Ceramic
antagonist resulted in
larger “wear tracks”
versus artificial teeth.
Composite resin was
more wear resistant
than other materials
versus ceramic but no
significant difference
was noted for other
antagonists.
Ghazal et al
2009
Two: 1. Human
enamel; 2.
Composite
resin
Zirconia
ceramic balls
6mm diameter
in three groups:
1. As supplied;
2. Air abraded
with 50µm
alumina
particles at
0.5bar; 3. ABA
at 1bar.
Dual-axis
chewing
simulator
(willytec)
49 300,000 Thermocyclin
g 5-55º water
@ 2min
cycles
Ra, Laser scanning
profilometry of
PVS-epoxy resin
copies via SEM
Increased surface
roughness increased
the friction coefficient
which in tern resulted
in increased wear.

- 170 -
Ghazal et al
2008
Three: 1.
Human Teeth;
2. Composite
resin;
3. Feldspathic
ceramic
Steatite 6mm
balls, Zirconia
(inceram),
alumina
(inceram AL)
Dual-axis
chewing
simulator
(willytec)
49 600,000
cycles
Thermocyclin
g 5-55º water
@ 2min
cycles
Vertical height loss
and volume loss.
Custom
profilometer with
5µm stylus with
0.02µm SEM
surface analysis
Zirconia and alumina
showed less wear than
nano-filled composite
resin but weren’t
significant.
Ghazal et al
2008
Seven: 1.
Feldspathic
ceramic;
2. Composite
resin;
3. IPN-PMMA;
4. PMMA;
5. TCR resin;
6. DCL resin;
7. PMMA U-
derivative.
Polished with
4000 grit
abrasive paper.
Human
premolar as
control
Steatite 6mm
balls
Dual-axis
chewing
simulator
(willytec)
49 1,200,00 at
1.3Hz, 0.3mm
horizontal
slide
Thermocyclin
g 5-55º water
@ 2min
cycles
Vertical height loss
and volume loss.
Custom
profilometer with
5µm stylus with
0.02µm SEM
surface analysis
CR teeth had more
wear than enamel. The
wear resistance of all
PMMA teeth was less
than composite resin.
Feldspathic ceramic
showed similar wear
to enamel.

- 171 -
Ghazal et al
2008
Three types: 1.
Feldspathic
ceramic;
2. Nano-filled
composite
resin;
3.
UDMA/PMMA
Matched the
same materials
for control and
human enamel
Dual-axis
chewing
simulator
(willytec)
49 200,000
cycles (two
body, then
three-body of
100,000 each)
Distilled
water at 21º
then a “food
bolus
material”
(PMMA
powder +
distilled
water)
Vertical height loss
and volume loss.
Custom
profilometer with
5µm stylus with
0.02µm SEM
surface analysis
CR-CR and
feldspathic -
feldspathic showed
similar wear and both
were significantly less
than acrylic-acrylic.
Reis et al 2008 Three: 1.
Cross-linked
PMMA;
2. Highly cross-
linked IPN-
PMMA;
3. Highly cross-
linked PMMA
Two: 1.
Duceram
glazed and
polished;
2. Duceram
glazed and air
abraded
“customise
d”
3 100,000 @
4.5 cycles/min
for 20mm
Distilled
water at 37℃
Height loss All teeth showed more
wear against the air
abraded ceramic
antagonist. Highly
cross linked teeth
showed less wear for
the abraded group
only.

- 172 -
Stober et al
2006
Ten materials
of: 1. PMMA;
2. MPM-
PMMA; 3.
DCL-PMMA;
4. IPN-PMMA;
5. INPEN-
PMMA;
6. Isostit
(UDMA +
Inorganic
fillers);
7. PMMA +
fillers;
8. Nano-
composite
resin;
9. Human
enamel control
Al2O3 balls of
4.8mm
diameter
Two-axis
chewing
simulator
(willytec)
40 100,000
cycles @
8mm/sec
Distilled
water at room
temperature
Volume. 3-D
measurements with
optical 3D surface
profilometer
“laserscan 3D”
(willytec) with
matched software
Enamel was highly
variable. No
significant difference
between different
denture tooth types
compared to enamel.
Zeng 2005 Composite
resin with
various fillers
The same
material as
tested
Customised
wear
testing
machine
(Tsurumi
University)
50 50,000, 60
strokes/min,
2mm distance
Water at 37℃ Height and volume
via weight
calculations
The composite resin
teeth with more fillers
showed less wear

- 173 -
Suwannaroop
2001
Five denture
teeth: 1.
PMMA;
2. UDMA;
3. IPN-PMMA;
4. FM-
inorganic filler
CR;
5. Porcelain
Aluminium
oxide 3mm
diameter balls
(Ra 2.28µm)
Pin-on-disc 15 10,000 cycles
at 1,000rpm
rotating/spinni
ng
Distilled
water at room
temperature
Weight and volume
loss with contact
stylus profilometer
and matched
software
Highly-cross-linked
PMMA teeth had the
greatest surface loss.
The volume losses of
ceramic teeth,
composite teeth, and
acrylic teeth weren’t
significantly different.
Hirano et al
1998
Two materials;
1. PMMA;
2. Composite
resin denture
teeth
“Enamel
abraders”
Customised
developed
by Wagner
and Hacker
1996
13.4 10,000 Human
Saliva
Volume.
Surfanalyser system
400 Profilometer
PMMA showed more
wear than the
composite resin teeth

- 174 -
8.2 Appendix 2 – Complete set of baseline Ra and Sa values for all
examined materials
Type Repeat Sa (nm/um) Ra (nm/um)
A 1 786.46 493.12
2 789.74 750.26
3 666.94 388.85
4 631.29 436.64
5 793.97 404.39
6 583.02 270.23
Mean 708.57 Mean 457.24
Aa 1 959.79 588.32
2 794.47 568.69
3 798.49 828.87
4 895.68 539.53
5 805.9 472.58
6 767.78 764.25
Mean 837.01 Mean 627.04
BruxZir 1 313.58 142.53
2 368.01 160.38
3 429.91 135.01
4 545.89 166.82
5 355.74 143.95
6 329.45 140.73
Mean 390.44 Mean 148.23
Lava U 1 548.57 226.45
2 408.97 148.63
3 510.92 288.89
4 448.85 220.11
5 391.35 188.23
6 571.62 235.33
Mean 480.04 Mean 217.94
LP 1 709.29 343.21
2 760.82 477.67
3 710.26 445.94
4 641.87 338.64
5 632.49 271.04

- 175 -
6 1.25 773.84
Mean 575.99 Mean 441.72
DenZir 1 640.13 392.46
2 475.42 237.97
3 1.05 651.88
4 524.75 262.24
5 1.62 920.55
6 1.89 528.58
Mean 274.14 Mean 498.94
eMax 1 389.67 223.78
2 396.89 139.41
3 391.39 148.77
4 497.7 161.27
5 392.15 145.98
6 395.43 143.65
Mean 410.53 Mean 160.47

- 176 -
8.3 Appendix 3 –Post two-body wear testing material loss (wear) in mm3
for each two-body wear testing group (material sample and acrylic
antagonist). Acrylic Antagonist (AA), Acrylic sample material (A), Lava
Plus™ (LP), Lithium Disilicate (eMax™), and Lava Ultimate™
nanoceramic composite resin (LU).
Table – Acrylic Antagonist (AA) opposing Acrylic sample material (A). AA volume
change.
AA - A Volume change (mm3)
AA Values Pre Wear Volume
(means)
Post Wear Volume
(means)
Mean volume loss
Test group 1 87.212 86.245 0.9672
Test group 2 109.51 108.909 0.6006
Test group 3 83.197 83.0366 0.1605
Test group 4 94.103 93.816 0.2869
Test group 5 101.55 101.247 0.2996
Test group 6 95.978 95.607 0.3716
Test group 7 50.427 49.944 0.4837
Test group 8 91.0337 90.6344 0.3993
mean 0.446175
s.d. 0.248694855
Table – Acrylic Antagonist (AA) opposing Acrylic sample material (A). A volume
change.
AA - A Volume change A Sample
Values Pre Wear Volume
(means) Post Wear Volume
(means) Mean volume loss
Test group 1 98.397 97.151 1.2458
Test group 2 61.317 60.452 0.8655
Test group 3 96.892 96.432 0.4602
Test group 4 71.308 70.172 1.1358
Test group 5 110.11 109.2 0.9094
Test group 6 48.636 47.869 0.7667
Test group 7 120.99 120.45 0.5494
Test group 8 113.61 113.21 0.4002
mean
0.791625
s.d.
0.308547309
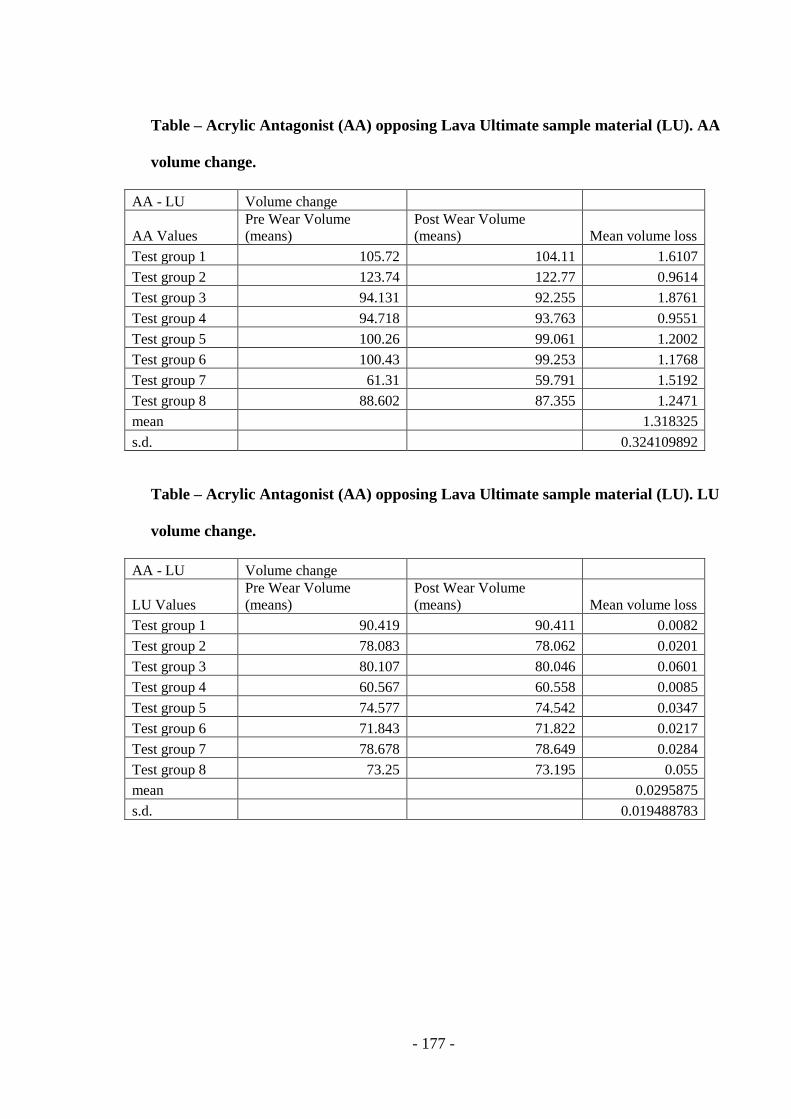
- 177 -
Table – Acrylic Antagonist (AA) opposing Lava Ultimate sample material (LU). AA
volume change.
AA - LU Volume change
AA Values Pre Wear Volume
(means) Post Wear Volume
(means) Mean volume loss
Test group 1 105.72 104.11 1.6107
Test group 2 123.74 122.77 0.9614
Test group 3 94.131 92.255 1.8761
Test group 4 94.718 93.763 0.9551
Test group 5 100.26 99.061 1.2002
Test group 6 100.43 99.253 1.1768
Test group 7 61.31 59.791 1.5192
Test group 8 88.602 87.355 1.2471
mean
1.318325
s.d.
0.324109892
Table – Acrylic Antagonist (AA) opposing Lava Ultimate sample material (LU). LU
volume change.
AA - LU Volume change
LU Values Pre Wear Volume
(means) Post Wear Volume
(means) Mean volume loss
Test group 1 90.419 90.411 0.0082
Test group 2 78.083 78.062 0.0201
Test group 3 80.107 80.046 0.0601
Test group 4 60.567 60.558 0.0085
Test group 5 74.577 74.542 0.0347
Test group 6 71.843 71.822 0.0217
Test group 7 78.678 78.649 0.0284
Test group 8 73.25 73.195 0.055
mean
0.0295875
s.d.
0.019488783

- 178 -
Table – Acrylic Antagonist (AA) opposing eMax. AA volume change.
AA - eMax Volume change
AA values Pre Wear Volume
(means) Post Wear Volume
(means) Mean volume loss
Test group 1 100.558 99.739 0.8192
Test group 2 111.904 111.144 0.76
Test group 3 103.203 102.459 0.7442
Test group 4 48.636 48.005 0.6309
Test group 5 87.992 87.464 0.5285
Test group 6 94.365 93.807 0.5582
Test group 7 89.845 89.276 0.5692
Test group 8 101.859 101.065 0.7941
mean
0.6755375
s.d.
0.116639076
Table – Acrylic Antagonist (AA) opposing eMax. eMax volume change.
AA - eMax Volume change
eMax values Pre Wear Volume
(means) Post Wear Volume
(means) Mean volume loss
Test group 1 84.497 84.47 0.0263
Test group 2 74.069 74.06 0.0001
Test group 3 73.281 73.293 -0.0117
Test group 4 79.284 79.259 0.0252
Test group 5 75.574 75.559 0.0148
Test group 6 74.925 74.92 0.0055
Test group 7 77.613 77.613 0.0002
Test group 8 74.375 74.336 0.0387
mean
0.0123875
s.d.
0.016831301

- 179 -
Table – Acrylic Antagonist (AA) opposing Lava Plus (LP). AA volume change.
AA - LP Volume change
AA values Pre Wear Volume
(means) Post Wear Volume
(means) Mean volume loss
Test group 1 87.409 86.913 0.4964
Test group 2 93.268 92.833 0.4347
Test group 3 135.79 135.492 0.2985
Test group 4 104.374 103.931 0.4429
Test group 5 107.456 107.139 0.3167
Test group 6 115.432 115.167 0.2645
Test group 7 101.305 100.751 0.5538
Test group 8 109.913 109.478 0.4351
mean
0.405325
s.d.
0.101839127
Table – Acrylic Antagonist (AA) opposing Lava Plus (LP). LP volume change.
AA - LP Volume change
LP values Pre Wear Volume
(means) Post Wear Volume
(means) Mean volume loss
Test group 1 28.459 28.464 -0.0048
Test group 2 40.828 40.786 0.0422
Test group 3 37.9 37.896 0.004
Test group 4 33.173 33.163 0.0101
Test group 5 26.8 26.67 0.1292
Test group 6 41.841 41.833 0.0084
Test group 7 33.394 33.402 -0.0088
Test group 8 35.717 35.708 0.0092
mean
0.0236875
s.d.
0.045290158