Jonathan Gershuny - ARE WE RUNNING OUT OF TIME.pdf
20
ARE WE RUNNING OUT OF TIME? Jonathan Gershuny Through analysis of time-use, the proposition that ‘time is running out’ is examined. This view has been based on arguments that the richer a society becomes, the less its members have the opportunity to relax and do as they please. The opposing view is put that the ‘leisure society’ continues to emerge in developed countries, and that the experience of the 1980s is somewhat exceptional. Long-term prospects for the leisure society are examined, and the conclusion is reached that the economic development process of the shift of time-use from production to con- sumption is continuing. This popular image of the future corresponds to arguments from various academic disciplines which suggest that economic development leads to time congestion. These arguments are convincing, at least for the UK during the 1980s. But do they hold more generally? A new multina- tional comparative collection of time-use evidence suggests that there may still be some hope for the leisure society. The idea of an emerging leisure society, the sort of society that Keynes wrote about in his essay, ‘On the economic prospects for our grandchild- ren’,l and which formed part of the flower-power future of the 196Os, looks distinctly old-fashioned in a post-Thatcher ‘New Model Britain’. In its place, we have altogether much more strenuous images: young men in spectacles eating sandwiches in front of their VDUs; women springing from their BMWs at the prospect of a 7.00 am power breakfast. Leisure and sufficiency are replaced, as our image of the future, by the ever fuller wallet and the ever fuller diary. Thesis A number of recent articles and television programmes in the UK and the USA have promoted the view that as we get richer we get busier. It is a trendy pessimism, a successor to previous trendy pressimisms like the ‘limits to growth’ scare of the early 1970s. And, like the limits to growth debate, ‘running out of time’ does have some quite solid foundations. In what follows I outline three ways in which it has been recently argued that ‘time is running out’-that the richer a society becomes, the less its Jonathan Cershuny is a Fellow of Nuffield College, Oxford OX1 INF, UK. This article was originally published in French in Futuribles, 756, July-August 1991, pages 3-18. FUTURES January/February 1992 0016-3287/92/010003-20 @ 1992 Butterworth-Heinemann Ltd
-
Upload
deorion7777 -
Category
Documents
-
view
17 -
download
0
Transcript of Jonathan Gershuny - ARE WE RUNNING OUT OF TIME.pdf
ARE WE RUNNING OUT OF TIME?
Jonathan Gershuny
Through analysis of time-use, the proposition that ‘time is running out’ is examined. This view has been based on arguments that the richer a society becomes, the less its members have the opportunity to relax and do as they please. The opposing view is put that the ‘leisure society’ continues to emerge in developed countries, and that the experience of the 1980s is somewhat exceptional. Long-term prospects for the leisure society are examined, and the conclusion is reached that the economic development process of the shift of time-use from production to con- sumption is continuing.
This popular image of the future corresponds to arguments from various academic disciplines which suggest that economic development leads to time congestion. These arguments are convincing, at least for the UK during the 1980s. But do they hold more generally? A new multina- tional comparative collection of time-use evidence suggests that there may still be some hope for the leisure society.
The idea of an emerging leisure society, the sort of society that Keynes wrote about in his essay, ‘On the economic prospects for our grandchild- ren’,l and which formed part of the flower-power future of the 196Os, looks distinctly old-fashioned in a post-Thatcher ‘New Model Britain’. In its place, we have altogether much more strenuous images: young men in spectacles eating sandwiches in front of their VDUs; women springing from their BMWs at the prospect of a 7.00 am power breakfast. Leisure and sufficiency are replaced, as our image of the future, by the ever fuller wallet and the ever fuller diary.
Thesis
A number of recent articles and television programmes in the UK and the USA have promoted the view that as we get richer we get busier. It is a trendy pessimism, a successor to previous trendy pressimisms like the ‘limits to growth’ scare of the early 1970s. And, like the limits to growth debate, ‘running out of time’ does have some quite solid foundations. In what follows I outline three ways in which it has been recently argued that ‘time is running out’-that the richer a society becomes, the less its
Jonathan Cershuny is a Fellow of Nuffield College, Oxford OX1 INF, UK. This article was originally published in French in Futuribles, 756, July-August 1991, pages 3-18.
FUTURES January/February 1992 0016-3287/92/010003-20 @ 1992 Butterworth-Heinemann Ltd
4 Are we running out of time?
members have the opportunity to relax and, in the now unfashionable 1960s’ phrase, ‘do their own thing’.
The three arguments are respectively to do with paid work, unpaid domestic work and leisure.
The first is that, through history, work time increases: time spent working for money in ‘the economy’ grows with economic development. The second refers particularly to women. It has two parts: first, it suggests, domestic work (broadly defined) does not reduce, and may even increase over time despite improvements in domestic technology; second, women do most of it, and as they move into paid work they continue to have the main responsibility for it. The third is that what leisure we have is increasingly congested with more
and more consumption activities. There is a nice paradox here-each year we have to work harder in our free time to consume all those things that we have been working harder to produce in our work time.
Let us go through these three lines separately.
More paid work over time?
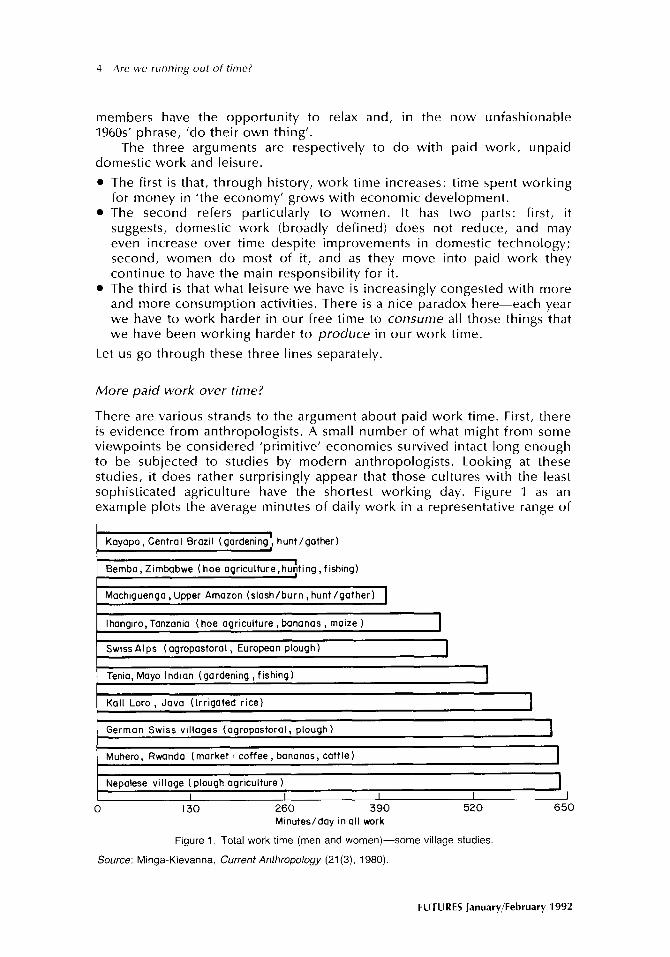
There are various strands to the argument about paid work time. First, there is evidence from anthropologists. A small number of what might from some viewpoints be considered ‘primitive’ economies survived intact long enough to be subjected to studies by modern anthropologists. Looking at these studies, it does rather surprisingly appear that those cultures with the least sophisticated agriculture have the shortest working day. Figure 1 as an example plots the average minutes of daily work in a representative range of
Kayapo, Central Brazil (gardening! hunt/gather) I
Bemba, Zimbabwe (hoe agriculture, hu;ting , fishing)
Mochiguenga, Upper Amazon (slash/burn, hunt/gather)
1 Ihanairo, Tanzania (hoe aariculture . bananas, maize ) I
1 Swiss Alps (agropastoral, European plough) I
Tenia, Mayo Indian (gardening, fishing) I
1 Kall Loro . Java (Irriaated rice) I
German Swiss villoges (agropastorol, plough ) I
Muhero, Rwando (market : coffee, bonanos, cattle) I
Nepolese village ( plough agriculture ) I I I I I
0 130 260 390 520 650
Minutes/day in all work
Figure 1. Total work time (men and women)-some village studies
Source: Minga-Klevanna, Current Anthropology (21(3), 1980).
FUTURES January/February 1992
Are we running out of time? 5
different cultures.* We see that hunter-gatherers, or those with rather
low-technology agriculture, have very short work times, hardly more than four hours per day in some cases. As more sophisticated techniques such as
irrigation and ploughing emerge, and particularly as patterns of consump-
tion become more complex, and the societies move from subsistence to
market production, so hours of work rise. The most economically sophisti-
cated of these groups have around 11 hours work per day. The evidence for this is summarized most entertainingly in Marshall
Sahlins’s classic text, Stone Age fconorr~ics.~ We can sum up his view by quoting his description of an African culture:
The Hadza, tutored by life and not by anthropology, reject the neolithic revolution in order to keep their leisure. Although surrounded by cultivators, they have until recently refused to take up agriculture themselves ‘mainly on the ground that this would involve too much hard work’. In this they are like the Bushmen, who respond to the neolithic question with another: ‘Why should we plant, when there are so many mongomongo nuts in the world’.”
Historians of economic development in the west echo this same argument. In pre-industrial societies there may have been as much as 12 hours of work on work days. But the large number of public holidays and religious feast days, together with low levels of activity during the winter, mean that for both artisans and agriculturalists, work time averaged across the year could have been as low as 2100 hours, considerably less than in a modern economy.5 From the Reformation onwards, the number of public holidays declined, and the amount of off-season agricultural work increased, so that by the mid-19th century in Europe yearly work hours had risen to 3500 or more.
Modern economics explains this level of increase in work time in terms of a rational choice. Avoiding the technical details, the argument comes down to a proposition that by working longer hours, we can earn more money, which we can spend to make our leisure time more intensely enjoyable. We work more and have less leisure. But the shorter leisure time, when combined with the extra money we can spend on it, provides us with more satisfaction in total than we might alternatively have gained by taking more leisure combined with less money.6
Last but not least, sociologists studying time-use have regularly ob- served that the better qualified and hence higher-earning workers, tend to work considerably longer hours than less well qualified and lower-earning workers.’ Presumably then, as the working population gets on average more highly qualified, and earnings rise, so will hours of work.
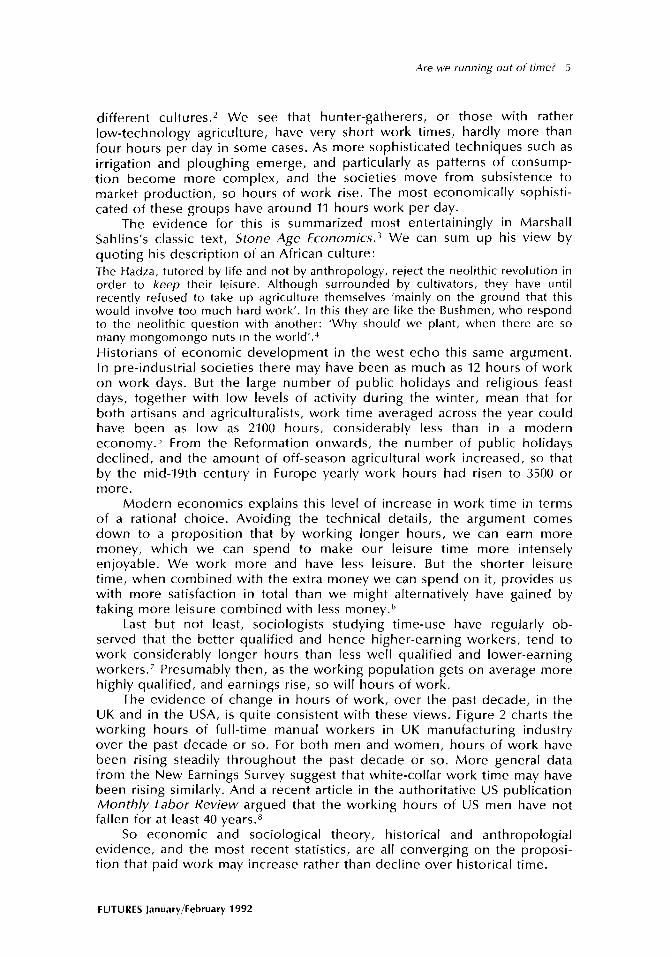
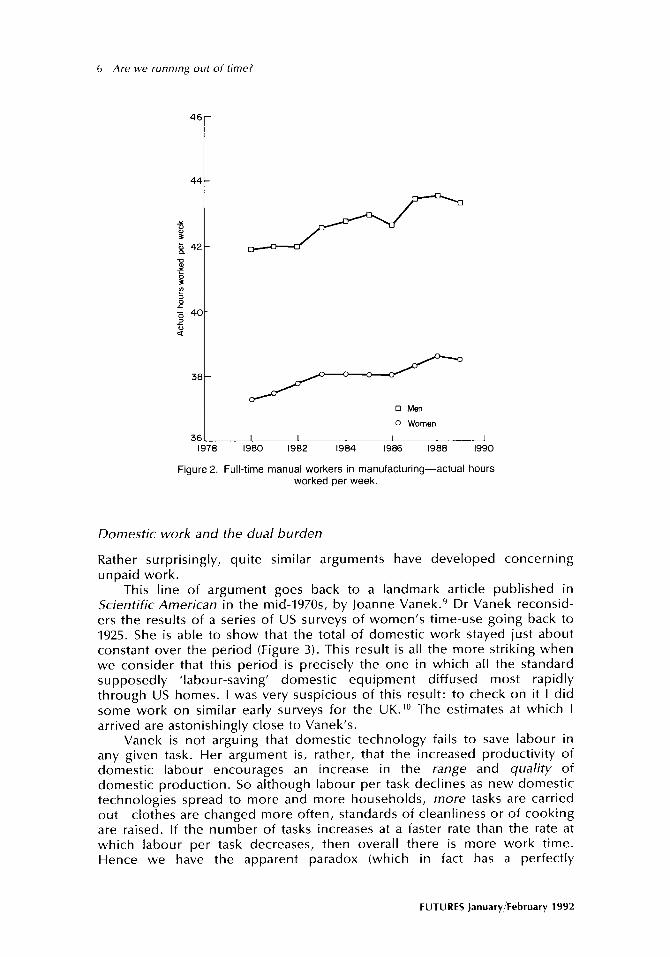
The evidence of change in hours of work, over the past decade, in the UK and in the USA, is quite consistent with these views. .Figure 2 charts the working hours of full-time manual workers in UK manufacturing industry over the past decade or so. For both men and women, hours of work have been rising steadily throughout the past decade or so. More general data from the New Earnings Survey suggest that white-collar work time may have been rising similarly. And a recent article in the authoritative US publication Monthly Labor Review argued that the working hours of US men have not fallen for at least 40 years.8
So economic and sociological theory, historical and anthropologial evidence, and the most recent statistics, are all converging on the proposi- tion that paid work may increase rather than decline over historical time.
FUTURES January/February 1992
6 Are we running out of time?
c 0 Men
0 Women
36t. I I I I I I 1978 1980 1982 1984 1986 1988 1990
Figure 2. Full-time manual workers in manufacturing-actual hours worked oer week.
Domestic work and the dual burden
Rather surprisingly, quite similar arguments have developed concerning unpaid work.
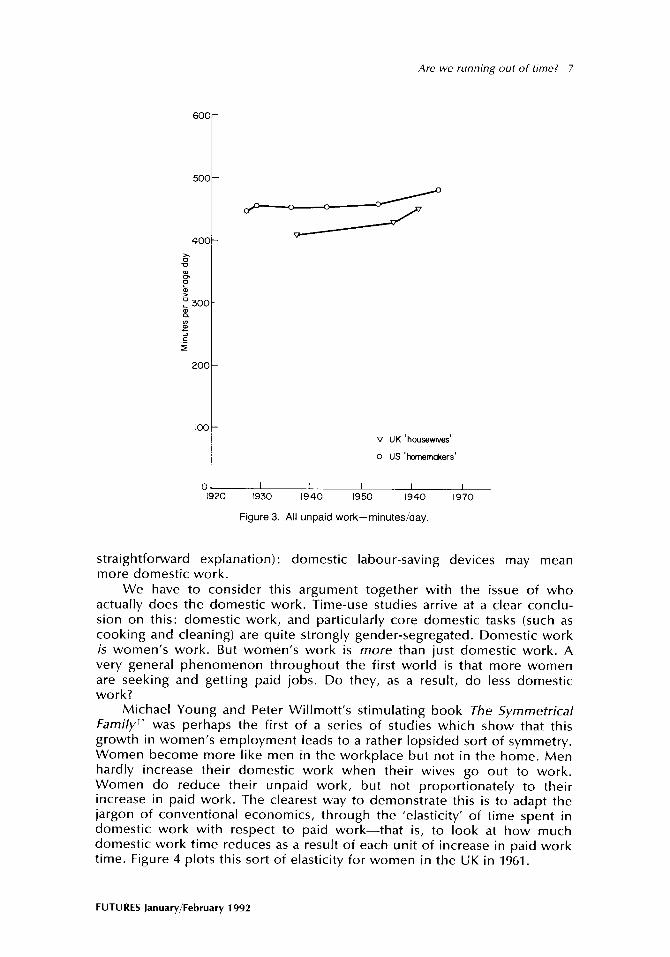
This line of argument goes back to a landmark article published in Scientific American in the mid-1970s, by Joanne Vanek.9 Dr Vanek reconsid- ers the results of a series of US surveys of women’s time-use going back to 1925. She is able to show that the total of domestic work stayed just about constant over the period (Figure 3). This result is all the more striking when we consider that this period is precisely the one in which all the standard supposedly ‘labour-saving’ domestic equipment diffused most rapidly through US homes. I was very suspicious of this result: to check on it I did some work on similar early surveys for the UK.1° The estimates at which I arrived are astonishingly close to Vanek’s.
Vanek is not arguing that domestic technology fails to save labour in any given task. Her argument is, rather, that the increased productivity of domestic labour encourages an increase in the range and quality of domestic production. So although labour per task declines as new domestic technologies spread to more and more households, more tasks are carried out-clothes are changed more often, standards of cleanliness or of cooking are raised. If the number of tasks increases at a faster rate than the rate at which labour per task decreases, then overall there is more work time. Hence we have the apparent paradox (which in fact has a perfectly
FUTURES January/February 1992
Are we running out of time? 7
d-
OL 192
V UK ‘housewes’
0 US ‘homemakers’
I I I I I 0 1930 1940 1950 1940 1970
Figure 3. All unpaid work-minutes/day.
straightforward explanation) : domestic labour-saving devices may mean more domestic work.
We have to consider this argument together with the issue of who actually does the domestic work. Time-use studies arrive at a clear conclu- sion on this: domestic work, and particularly core domestic tasks (such as cooking and cleaning) are quite strongly gender-segregated. Domestic work is women’s work. But women’s work is more than just domestic work. A very general phenomenon throughout the first world is that more women are seeking and getting paid jobs. Do they, as a result, do less domestic work?
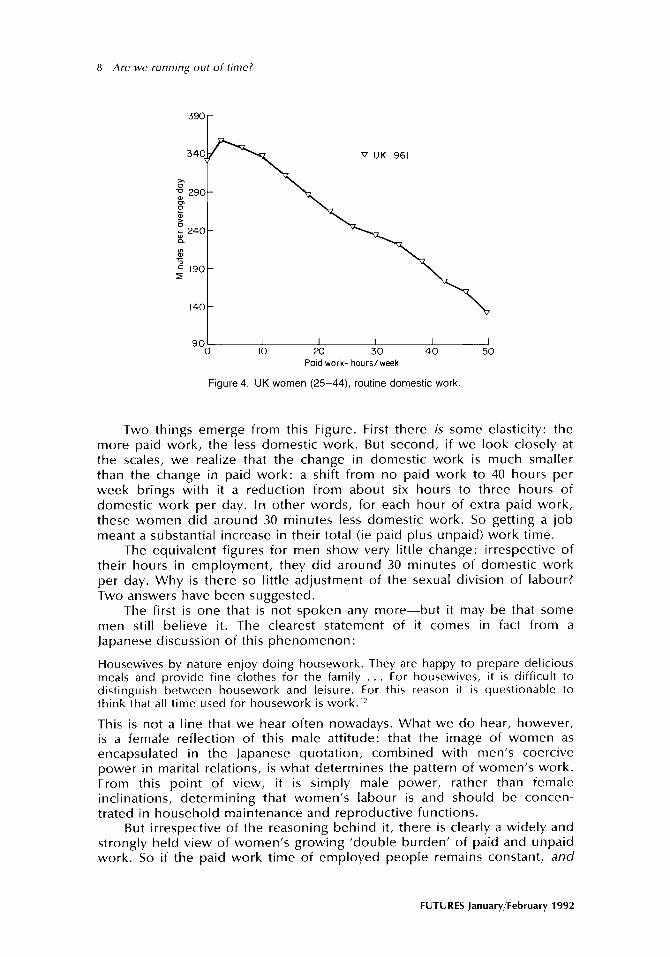
Michael Young and Peter Willmott’s stimulating book The Symmetrical familyll was perhaps the first of a series of studies which show that this growth in women’s employment leads to a rather lopsided sort of symmetry. Women become more like men in the workplace but not in the home. Men hardly increase their domestic work when their wives go out to work. Women do reduce their unpaid work, but not proportionately to their increase in paid work. The clearest way to demonstrate this is to adapt the jargon of conventional economics, through the ‘elasticity’ of time spent in domestic work with respect to paid work-that is, to look at how much domestic work time reduces as a result of each unit of increase in paid work time. Figure 4 plots this sort of elasticity for women in the UK in 1961.
FUTURES January/February 1992
8 Are we running out of time?
V UK 1961
Poid work- hours/week
Figure 4. UK women (2544), routine domestic work.
Two things emerge from this Figure. First there is some elasticity: the more paid work, the less domestic work. But second, if we look closely at the scales, we realize that the change in domestic work is much smaller than the change in paid work: a shift from no paid work to 40 hours per week brings with it a reduction from about six hours to three hours of domestic work per day. In other words, for each hour of extra paid work, these women did around 30 minutes less domestic work. So getting a job meant a substantial increase in their total (ie paid plus unpaid) work time.
The equivalent figures for men show very little change: irrespective of their hours in employment, they did around 30 minutes of domestic work per day. Why is there so little adjustment of the sexual division of labour? Two answers have been suggested.
The first is one that is not spoken any more-but it may be that some men still believe it. The clearest statement of it comes in fact from a Japanese discussion of this phenomenon:
Housewives by nature enjoy doing housework. They are happy to prepare delicious meals and provide fine clothes for the family . . For housewives, it is difficult to distinguish between housework and leisure. For this reason it is questionable to think that all time used for housework is w0rk.l’
This is not a line that we hear often nowadays. What we do hear, however, is a female reflection of this male attitude: that the image of women as encapsulated in the Japanese quotation, combined with men’s coercive power in marital relations, is what determines the pattern of women’s work. From this point of view, it is simply male power, rather than female inclinations, determining that women’s labour is and should be concen- trated in household maintenance and reproductive functions.
But irrespective of the reasoning behind it, there is clearly a widely and strongly held view of women’s growing ‘double burden’ of paid and unpaid work. So if the paid work time of employed people remains constant, and
FUTURES January/February 1992
Are we running out of time! 9
more women are getting jobs, and women do not reduce housework proportionately when they get jobs, then women in particular must have had an increase in their total of work over recent historical time.
Congested leisure?
We have considered change in paid and unpaid work time. Let us assume that not much happens to sleep time with economic development: what we are left with is free time. The literature here is similarly pessimistic. Indeed, it is simply the mirror of the argument about paid work. The first element in the argument was that better paid people, or people higher in the occupa- tional scale work longer hours for money. Better paid people who work longer hours have more money to spend but less time to spend it in. Thus they have to cram more spending into our free time. The richer we become, the more our ‘free’ time is crowded with consumption activities.
The origin of this line of argument is Staffan Linder’s The Harried Leisure Class.13 His central message is a sort of social developmental sequence. He starts with the sorts of anthropological data on which we have already touched, and draws from these the general conclusion that ‘tradi- tional’ societies have a surplus of free time. Linder claims that there is an intermediate stage, which he terms ‘time affluence’, exemplified by early 20th century Sweden, or Japan in the 1950s. And finally, economic develop- ment leads to ‘time famine’ cultures, exemplified by the USA.
Linder provides us with a series of delightful vignettes of harried Americans trying, with diminishing success, to cope simultaneously with all the mechanical and gustatory fruits of their affluence. Here is the ultimate
harassed consumer:
. . after dinner he may find himself drinking Brazilian coffee, smoking a Dutch cigar, sipping a French cognac, reading the New York Times, and entertaining his Swedish wife, all at the same time, and with varying degrees of success.14
The Harried Leisure Class is a very funny book. But the central question that Linder poses for us is a serious one: is leisure still leisure when it ceases to be leisurely? Although it is now 20 years old, Linder’s book prophetically outlines the whole of the modern ‘running out of time’ argument. We pay for economic growth by losing the essential characteristics of leisure.
May I ask readers to pause for a moment to consider whether they find these arguments convincing ? Is it in fact their experience that, as time passes, work time increases and that they also have to work harder at their leisure?
Antithesis
Economic growth and the leisure preference
I have tried to spell out this pessimistic view as fully and as fairly as I am able. I should now say that my own view, for what it is worth, is that this is all a lot of . . . old mongomongo nuts.
Let us go right back to the begining of the argument, to the anthropolo- gical evidence of very short work times in very ‘primitive’ cultures. It seems
FUTURES January/February 1992
10 Are we running out of time!
that the most important question we have to ask is: why did these particular cultures survive to be studied? Presumably these particular groups found particularly cosy ecological niches. I suspect that the reason there were so many mongomongo nuts in the world was that no one, other than the Bushmen, was particularly keen on them. If there were competition for them, they would become more difficult to find, work time would rise. And then, perhaps, their answer to the neolithic question would be different. It is only when gathering becomes difficult that we begin to consider garden- ing.
In other words, the surviving palaeolithic cultures may well be highly unrepresentative of palaeolithic cultures in general. Similarly, the mediaeval historical evidence of rather short year-average hours of work comes from the surviving records of relatively rich and successful towns, where the profits on artisanal work were sufficient to support frequent holidays. Can we be sure that the evidence that we do not have, of struggling towns and of the ultimately unsuccessful guilds whose records have not come down to us, would not tell us a different story? Again, it may be that that the conditions for the survival of the evidence are also conditions which select those cases with shorter than average work years. Again, a problem of selection.
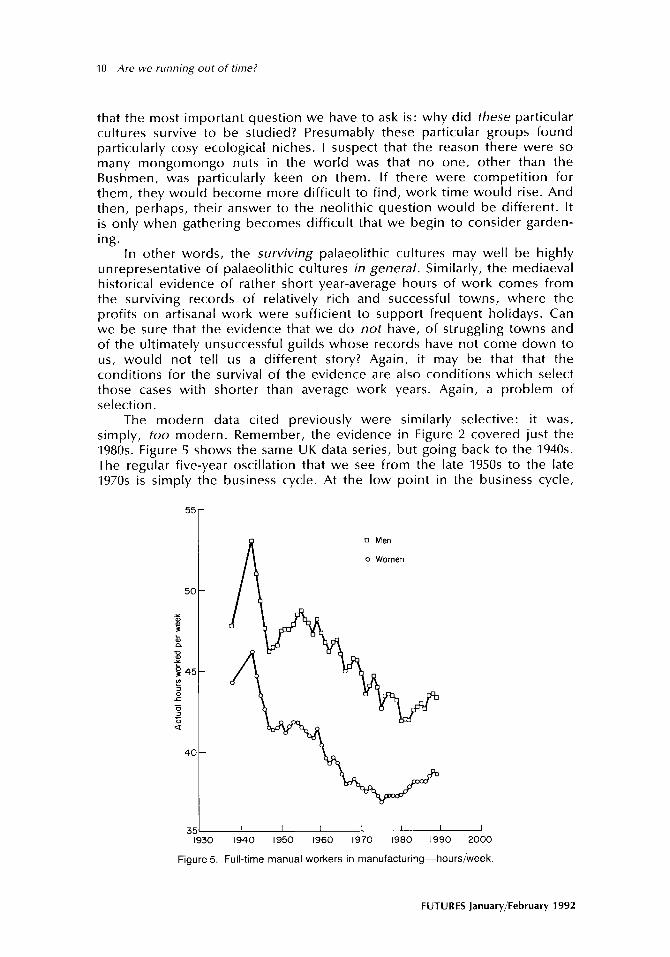
The modern data cited previously were similarly selective: it was, simply, too modern. Remember, the evidence in Figure 2 covered just the 1980s. Figure 5 shows the same UK data series, but going back to the 1940s. The regular five-year oscillation that we see from the late 1950s to the late 1970s is simply the business cycle. At the low point in the business cycle,
55-
50-
‘: % $ a P r p45-
5 e
: t Q
40-
q Men
0 Women
35’ I I I I I I I 1930 1940 1950 1960 1970 1980 1990 2000
Figure 5. Full-time manual workers in manufacturing-hours/week.
FUTURES January/February 1992
Are we running auf of time? 11
there is less overtime, and unions are successful in negotiating shorter basic hours, since the employers are happier with this than with higher pay rises. After the upturn, hours at first rise, but then as the business cycle approaches its peak and profitability increases, unions succeed in lowering basic hours further. The cycle of increase and decrease in hours is repeated, but each time at a lower level. There is in effect a ratchet, to the beginning of the 1980s: a slow, regular, step-by-step reduction of work hours.
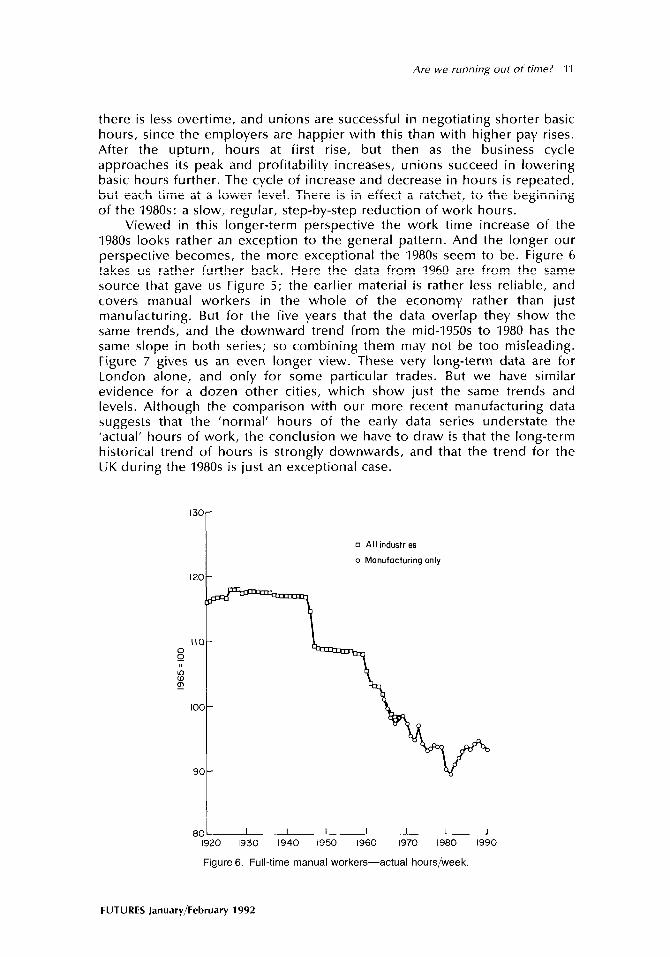
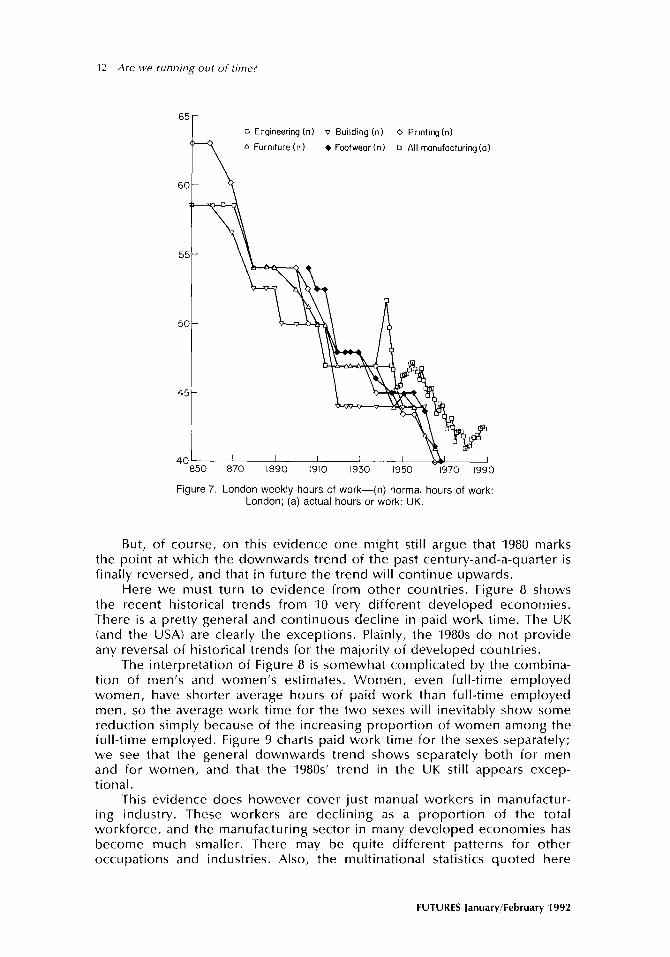
Viewed in this longer-term perspective the work time increase of the 1980s looks rather an exception to the general pattern. And the longer our perspective becomes, the more exceptional the 1980s seem to be. Figure 6 takes us rather further back. Here the data from 1960 are from the same source that gave us Figure 5; the earlier material is rather less reliable, and covers manual workers in the whole of the economy rather than just manufacturing. But for the five years that the data overlap they show the same trends, and the downward trend from the mid-1950s to 1980 has the same slope in both series; so combining them may not be too misleading. Figure 7 gives us an even longer view. These very long-term data are for London alone, and only for some particular trades. But we have similar evidence for a dozen other cities, which show just the same trends and levels. Although the comparison with our more recent manufacturing data suggests that the ‘normal’ hours of the early data series understate the ‘actual’ hours of work, the conclusion we have to draw is that the long-term historical trend of hours is strongly downwards, and that the trend for the UK during the 1980s is just an exceptional case.
q All industnes
a Manufactunng only
1920 1930 1940 1950 1960 1970 1980 1990
Figure 6. Full-time manual workers-actual hours/week.
FUTURES January/February 1992
12 Are we running out of time?
Figure 7. London weekly hours of work-(n) normal hours of work: London; (a) actual hours or work: UK.
But, of course, on this evidence one might still argue that 1980 marks the point at which the downwards trend of the past century-and-a-quarter is finally reversed, and that in future the trend will continue upwards.
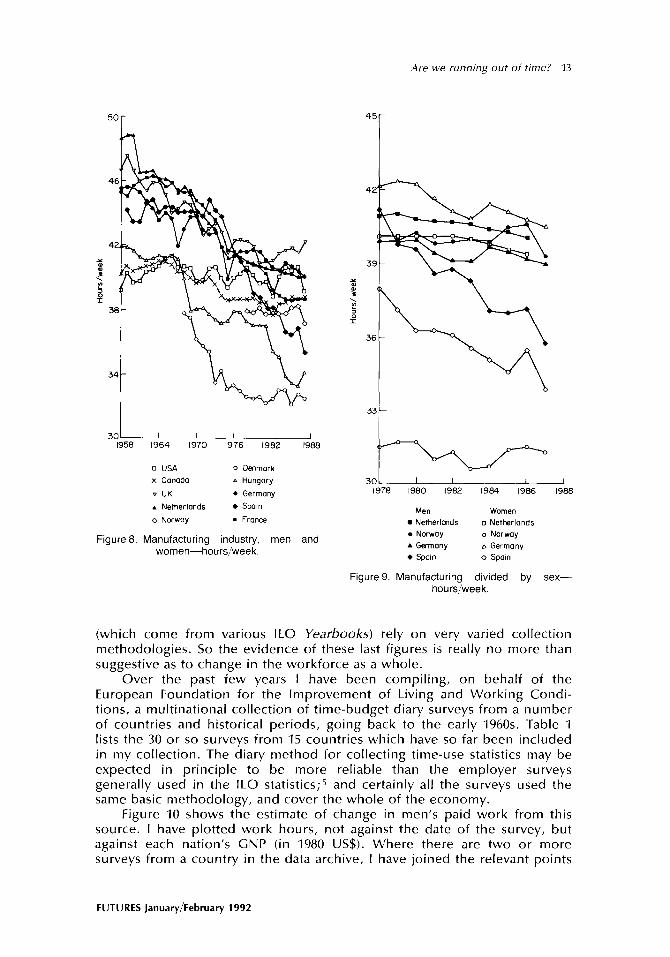
Here we must turn to evidence from other countries. Figure 8 shows the recent historical trends from IO very different developed economies. There is a pretty general and continuous decline in paid work time. The UK (and the USA) are clearly the exceptions. Plainly, the 1980s do not provide any reversal of historical trends for the majority of developed countries.
The interpretation of Figure 8 is somewhat complicated by the combina- tion of men’s and women’s estimates. Women, even full-time employed women, have shorter average hours of paid work than full-time employed men, so the average work time for the two sexes will inevitably show some reduction simply because of the increasing proportion of women among the full-time employed. Figure 9 charts paid work time for the sexes separately; we see that the general downwards trend shows separately both for men and for women, and that the 1980s’ trend in the UK still appears excep- tional.
This evidence does however cover just manual workers in manufactur- ing industry. These workers are declining as a proportion of the total workforce, and the manufacturing sector in many developed economies has become much smaller. There may be quite different patterns for other occupations and industries. Also, the multinational statistics quoted here
FUTURES January/February 1992
Are we running out of time? 13
301 I I I I I 1958 1964 1970 1976 1982 1985
q USA 0 Denmark
x Canodo A Hungary
v UK l Germany
. Netherlands . Span
o Norway n France
Figure 8. Manufacturing industry, men and women-hours/week.
301 I I I I I 1970 1980 1982 1984 1986 1988
Mell Women
. Netherlmds o Netherlands
. Norway o Norway
A Germany o Germany
l Span 0 SpaIn
Figure 9. Manufacturing divided by sex- hours/week.
(which come from various IL0 Yearbooks) rely on very varied collection methodologies. So the evidence of these last figures is really no more than suggestive as to change in the workforce as a whole.
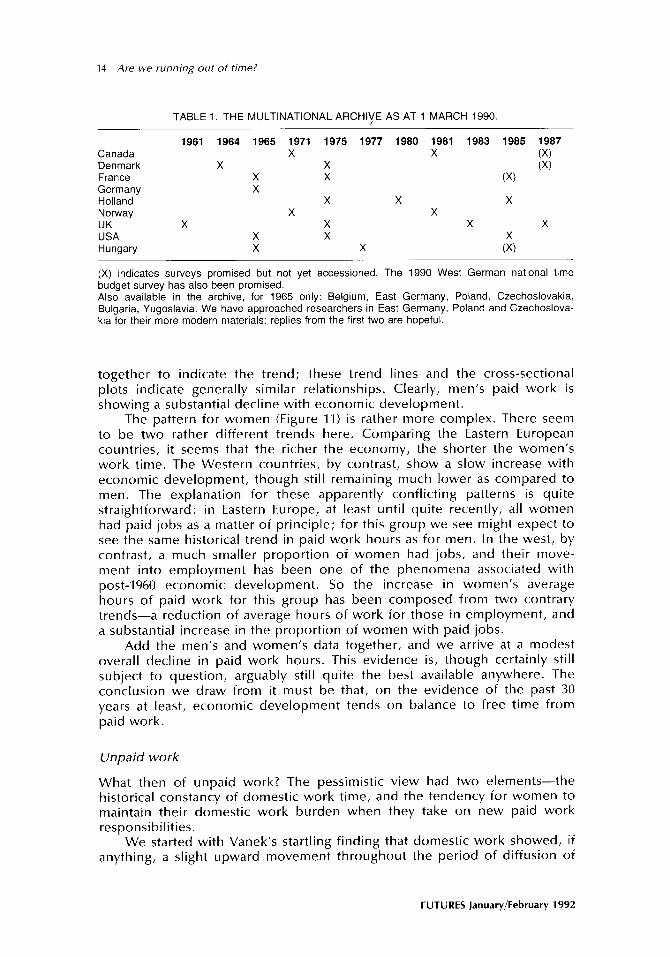
Over the past few years I have been compiling, on behalf of the European Foundation for the Improvement of Living and Working Condi- tions, a multinational collection of time-budget diary surveys from a number of countries and historical periods, going back to the early 1960s. Table 1 lists the 30 or so surveys from 15 countries which have so far been included in my collection. The diary method for collecting time-use statistics may be expected in principle to be more reliable than the employer surveys generally used in the IL0 statistics;5 and certainly all the surveys used the same basic methodology, and cover the whole of the economy.
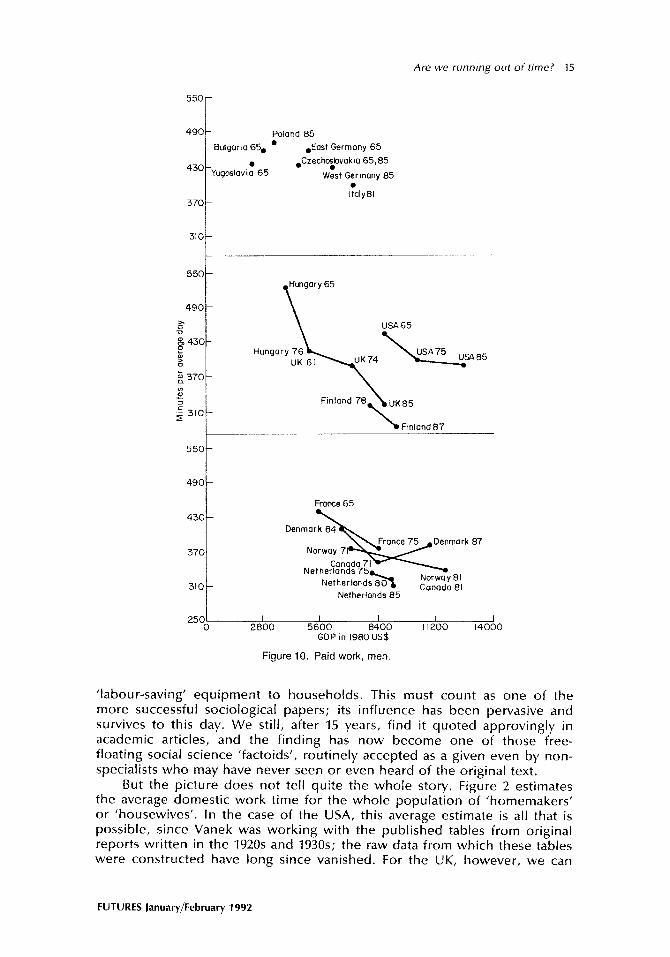
Figure 10 shows the estimate of change in men’s oaid work from this source. against surveys
I have plotted work hours, not agiinst the date of the survey, but each nation’s GNP (in 1980 US$). Where there are two or more from a country in the data archive, I have joined the relevant points
FUTURES lanuary/February 1992
14 Are we running out of time?
TABLE 1. THE MULTINATIONAL ARCHlYE AS AT 1 MARCH 1990.
Canada Denmark France Germany Holland Norway UK USA Hungary
1961 1964 1965 1971 1975 1977 X
X X X X X
X X
X X X X X X
1960 1961 1963 1965 1967 X (X)
(X) (X)
X X X
X X
(X) indicates surveys promised but not yet accessioned. The 1990 West German national time budget survey has also been promised. Also available in the archive, for 1965 only: Belgium, East Germany, Poland, Czechoslovakia, Bulgaria, Yugoslavia. We have approached researchers in East Germany, Poland and Czechoslova- kia for their more modern materials; replies from the first two are hopeful.
together to indicate the trend; these trend lines and the cross-sectional plots indicate generally similar relationships. Clearly, men’s paid work is showing a substantial decline with economic development.
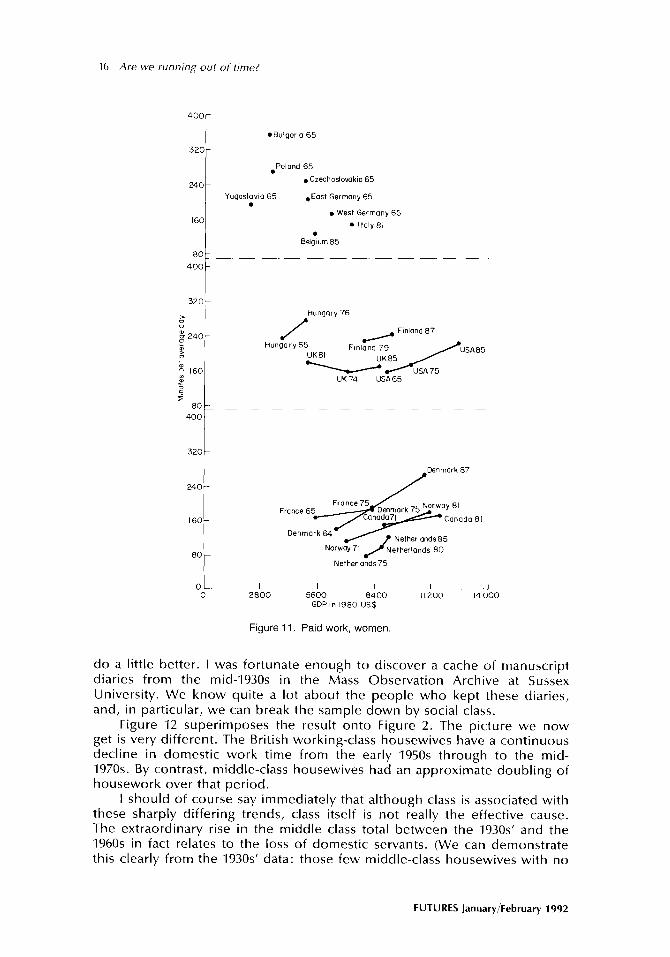
The pattern for women (Figure 11) is rather more complex. There seem to be two rather different trends here. Comparing the Eastern European countries, it seems that the richer the economy, the shorter the women’s work time. The Western countries, by contrast, show a slow increase with economic development, though still remaining much lower as compared to men. The explanation for these apparently conflicting patterns is quite straightforward: in Eastern Europe, at least until quite recently, all women had paid jobs as a matter of principle; for this group we see might expect to see the same historical trend in paid work hours as for men. In the west, by contrast, a much smaller proportion of women had jobs, and their move- ment into employment has been one of the phenomena associated with post-1960 economic development. So the increase in women’s average hours of paid work for this group has been composed from two contrary trends-a reduction of average hours of work for those in employment, and a substantial increase in the proportion of women with paid jobs.
Add the men’s and women’s data together, and we arrive at a modest overall decline in paid work hours. This evidence is, though certainly still subject to question, arguably still quite the best available anywhere. The conclusion we draw from it must be that, on the evidence of the past 30 years at least, economic development tends on balance to free time from paid work.
Unpaid work
What then of unpaid work? The pessimistic view had two elements-the historical constancy of domestic work time, and the tendency for women to maintain their domestic work burden when they take on new paid work responsibilities.
We started with Vanek’s startling finding that domestic work showed, if anything, a slight upward movement throughout the period of diffusion of
FUTURES January/February 1992
Are we running out of time? 15
550
490. [ Poland 85
Bulgaria 65. b *East Germany 65
43Q l .Czech$ovokla 65,85
Yugoslavia 65 West 85 Germany
I:aly81 370 -
310-
550
490 t
550
490
Hungary 65
\ USA65
Finland 78
France 65
Netherlands 85
2501 I I I I I 0 2800 5600 8400 11200 14000
GDP in 1980 US$
Figure 10. Paid work, men.
‘labour-saving’ equipment to households. This must count as one of the more successful sociological papers; its influence has been pervasive and survives to this day. We still, after 15 years, find it quoted approvingly in academic articles, and the finding has now become one of those free- floating social science ‘factoids’, routinely accepted as a given even by non- specialists who may have never seen or even heard of the original text.
But the picture does not tell quite the whole story. Figure 2 estimates the average domestic work time for the whole population of ‘homemakers’ or ‘housewives’. In the case of the USA, this average estimate is all that is possible, since Vanek was working with the published tables from original reports written in the 1920s and 1930s; the raw data from which these tables were constructed have long since vanished. For the UK, however, we can
FUTURES January/February 1992
16 Are we running out of time!
400 r *Bulgaria 65
80 L 400
t
Poland 65 .
. Czechoslovaklo 65
Yugoslavia 65 .East Germany 65 .
. West Germany 65
l Italy 81
Bel;“m 85
Hungo ry 65
UK 74 USA 65
240-
160-
80- Netherlands75
01 0
I I L I 1 2800 5600 8400 11200 I4 000
GDP I” 1980 US$
Figure 11. Paid work, women
do a little better. I was fortunate enough to discover a cache of manuscript diaries from the mid-1930s in the Mass Observation Archive at Sussex University. We know quite a lot about the people who kept these diaries, and, in particular, we can break the sample down by social class.
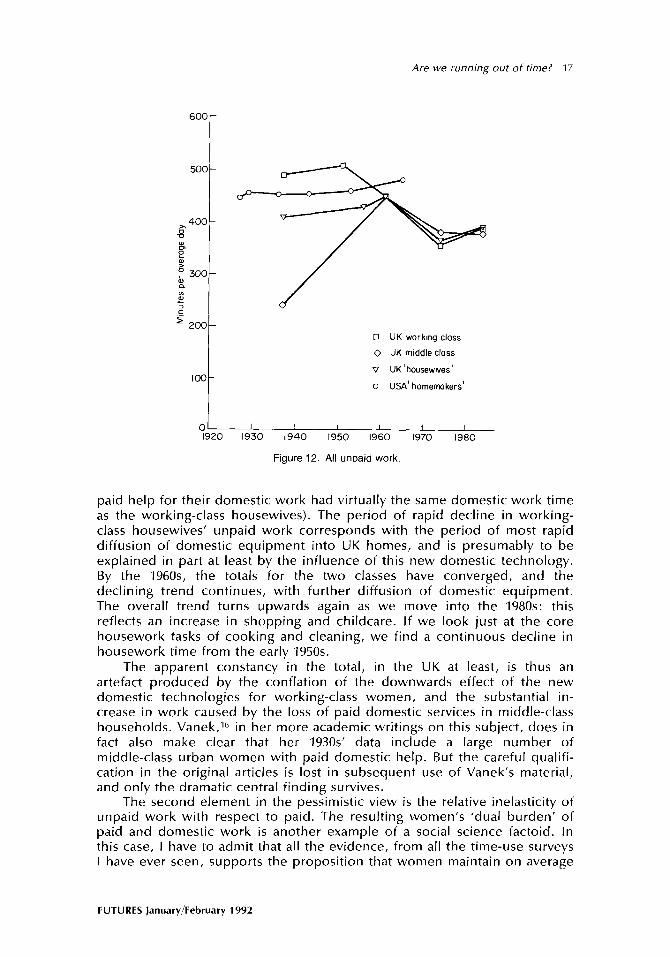
Figure 12 superimposes the result onto Figure 2. The picture we now get is very different. The British working-class housewives have a continuous decline in domestic work time from the early 1950s through to the mid- 1970s. By contrast, middle-class housewives had an approximate doubling of housework over that period.
I should of course say immediately that although class is associated with these sharply differing trends, class itself is not really the effective cause. The extraordinary rise in the middle class total between the 1930s’ and the 1960s in fact relates to the loss of domestic servants. (We can demonstrate this clearly from the 1930s’ data: those few middle-class housewives with no
FUTURES January/February 1992
Are we running out of time? 17
600-
500-
,400-
s
E tl
; 300- a
z 2
i 200-
IOO-
0 UK working class
0 UK middle class
v UK ‘housewlves’
0 USA’ homemakers’
01 I I I I I I
1920 1930 1940 1950 1960 I970 1980
Figure 12. All unpaid work
paid help for their domestic work had virtually the same domestic work time as the working-class housewives). The period of rapid decline in working- class housewives’ unpaid work corresponds with the period of most rapid diffusion of domestic equipment into UK homes, and is presumably to be explained in part at least by the influence of this new domestic technology. By the 196Os, the totals for the two classes have converged, and the declining trend continues, with further diffusion of domestic equipment. The overall trend turns upwards again as we move into the 1980s: this reflects an increase in shopping and childcare. If we look just at the core housework tasks of cooking and cleaning, we find a continuous decline in housework time from the early 1950s.
The apparent constancy in the total, in the UK at least, is thus an artefact produced by the conflation of the downwards effect of the new domestic technologies for working-class women, and the substantial in- crease in work caused by the loss of paid domestic services in middle-class households. Vanek, I6 in her more academic writings on this subject, does in fact also make clear that her 1930s’ data include a large number of middle-class urban women with paid domestic help. But the careful qualifi- cation in the original articles is lost in subsequent use of Vanek’s material, and only the dramatic central finding survives.
The second element in the pessimistic view is the relative inelasticity of unpaid work with respect to paid. The resulting women’s ‘dual burden’ of paid and domestic work is another example of a social science factoid. In this case, I have to admit that all the evidence, from all the time-use surveys I have ever seen, supports the proposition that women maintain on average
FUTURES January/February 1992
18 Are we running out of time?
a disproportionate burden of housework even when they enter paid work. (And similarly, all the evidence is consistent with the view that, in general, husbands fail to increase their contributions to housework so as to to reduce the burden on their wives.)
But the evidence usually employed to demonstrate this tends to be cross-sectional (ie comparing people in different employment situations at particular points in time). The longitudinal evidence, although it still quite worrying, does suggest a slightly less pessimistic conclusion.
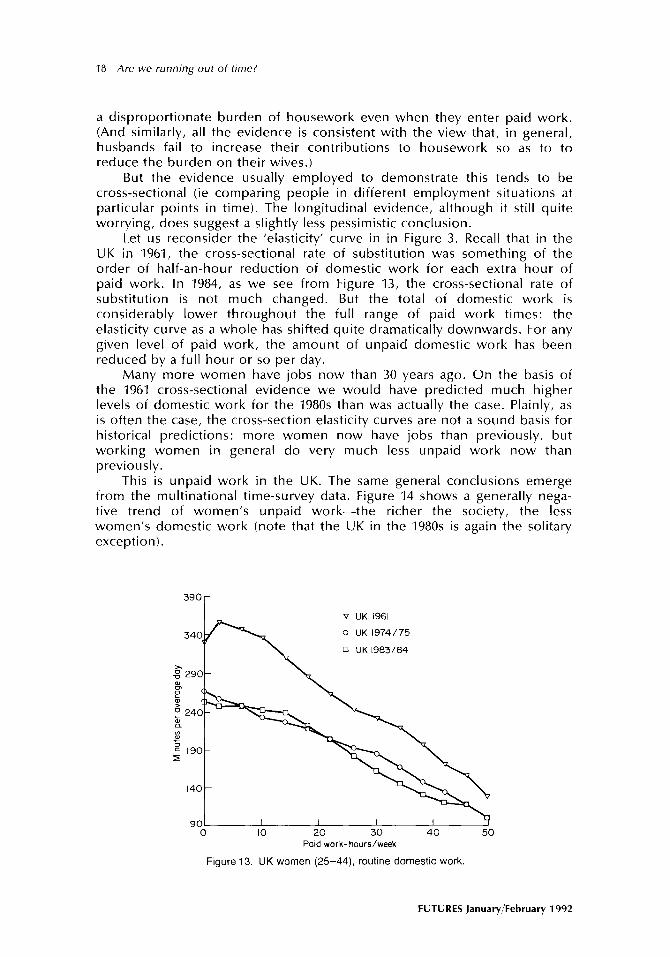
Let us reconsider the ‘elasticity’ curve in in Figure 3. Recall that in the UK in 1961, the cross-sectional rate of substitution was something of the order of half-an-hour reduction of domestic work for each extra hour of paid work. In 1984, as we see from Figure 13, the cross-sectional rate of substitution is not much changed. But the total of domestic work is considerably lower throughout the full range of paid work times: the elasticity curve as a whole has shifted quite dramatically downwards. For any given level of paid work, the amount of unpaid domestic work has been reduced by a full hour or so per day.
Many more women have jobs now than 30 years ago. On the basis of the 1961 cross-sectional evidence we would have predicted much higher levels of domestic work for the 1980s than was actually the case. Plainly, as is often the case, the cross-section elasticity curves are not a sound basis for historical predictions: more women now have jobs than previously, but working women in general do very much less unpaid work now than previously.
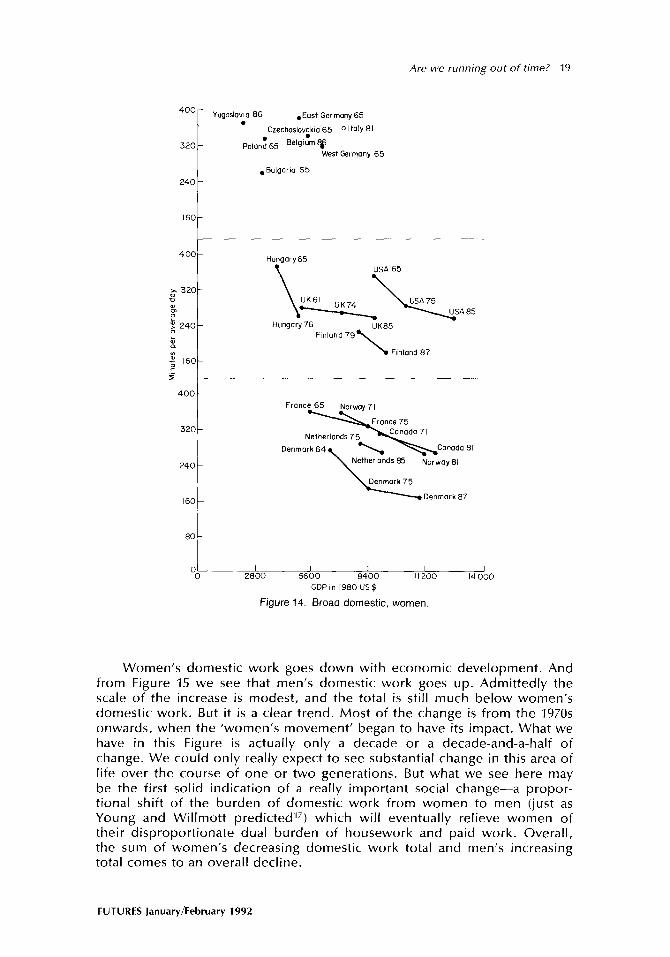
This is unpaid work in the UK. The same general conclusions emerge from the multinational time-survey data. Figure 14 shows a generally nega- tive trend of women’s unpaid work-the richer the society, the less women’s domestic work (note that the UK in the 1980s is again the solitary exception).
v UK 1961
0 UK 1974/75
0 UK 1983/84
0 IO 20 30 40 Paid work-hours/week
Figure 13. UK women (2%44), routine domestic work.
FUTURES January/February 1992
Are we running out of time? 19
400
320
240 :
Yugoslawo 86 .Eost Germany 65 .
Czechoslov~km 65 0 Italy 81
Pola”: 65 8e’gi”m%J West Germany 65
l Bulgaria 65
Hungary65
Hungary 76 UK85
\ FInland 87
France 65
N-do 171
Denmark 64 \
\ Netherlands
wonada 81
240 t 65 Norway 81
160
1
w Denmark 87
I I I I
2800 5600 8400 11200
GDP I” 1980 US $
Figure 14. Broad domestic, women.
I 14 000
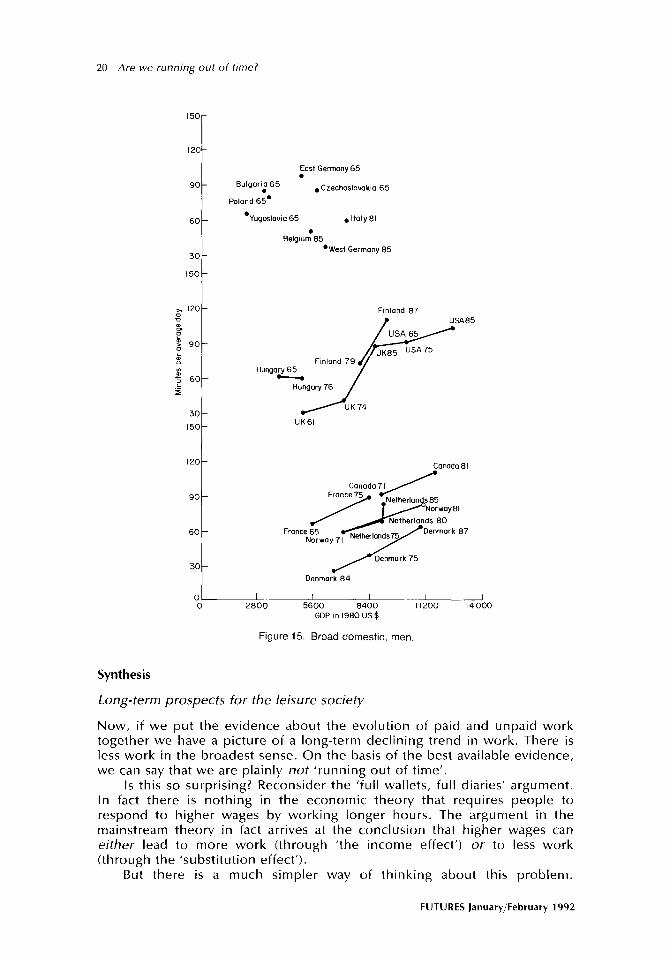
Women’s domestic work goes down with economic development. And from Figure 15 we see that men’s domestic work goes up. Admittedly the scale of the increase is modest, and the total is still much below women’s domestic work. But it is a clear trend. Most of the change is from the 1970s onwards, when the ‘women’s movement’ began to have its impact. What we have in this Figure is actually only a decade or a decade-and-a-half of change. We could only really expect to see substantial change in this area of life over the course of one or two generations. But what we see here may be the first solid indication of a really important social change-a propor- tional shift of the burden of domestic work from women to men (just as Young and Willmott predictedI’) which will eventually relieve women of their disproportionate dual burden of housework and paid work. Overall, the sum of women’s decreasing domestic work total and men’s increasing total comes to an overall decline.
FUTURES January/February 1992
20 Are we running out of time?
150-
120-
go-
60-
30-
150-
,, 120-
B
$
% $ go- L “a
P 2 60-
5
30-
150-
l20-
go-
60-
30-
East Germany 65 .
Bulgarii 65 . Czechoslowkm 65
Poland 65’
l Y”goslavla 65 l Italy 81
8elg,u”T*5
*West 85 Germany
Fanland 87
9 USA85
- r / USA 65
UK85 usA75 Finland 79
Hungary 65
Hungary 76
AK74
UK61
Canada 81
Pnmork 75 Denmark 84
01 0
I 2800
I I 5600 8400
GDPml980US$
I I 11200 I4 000
Figure 15. Broad domestic, men.
Synthesis
Long-term prospects for the leisure society
Now, if we put the evidence about the evolution of paid and unpaid work together we have a picture of a long-term declining trend in work. There is less work in the broadest sense. On the basis of the best available evidence, we can say that we are plainly not ‘running out of time’.
Is this so surprising? Reconsider the ‘full wallets, full diaries’ argument. In fact there is nothing in the economic theory that requires people to respond to higher wages by working longer hours. The argument in the mainstream theory in fact arrives at the conclusion that higher wages can either lead to more work (through ‘the income effect’) or to less work (through the ‘substitution effect’).
But there is a much simpler way of thinking about this problem.
FUTURES January/February 1992
Are we running out of time? 21
Economic growth consists principally of growth in labour productivity. Productivity growth means an increase in output per hour of work. Now, if output per hour of work increases, and we do not want to lose jobs then consumption has to increase at an equivalent rate. But consumption takes time. So, if hours of work per worker stay constant, and there is an increase of productivity, there must be an equivalent increase of consumption per hour of leisure. This was precisely Linder’s point-productivity growth, if work hours do not vary, and unemployment is not to rise, must be matched by an equivalent growth in what we might term ‘consumptivity’. Consump- tivity growth, growth in the intensiveness of consumption to maintain demand in the economy, could be as important as productivity growth.
But of course there is an alternative. Rather than increasing the intensity of consumption per hour, we simply reduce the hours of work and increase the time free for consumption activities. The alternative recipe for a balanced economy is-productivity growth plus shorter working hours plus increasing hours for consumption of the increasing social product. This is certainly the most straightforward interpretation of the data that I have been considering.
I used to think that the reduction in work in the society that we have been considering indicated what some sociologists have termed ‘a post- materialistic economic ideology’-that money and material things become less important, But what I am suggesting now is rather different: simply, that productivity growth leads to a need for more time to consume the social product. Consumption takes time: the more we produce, the more time we need for consumption. Working time reduction, in short, is a phenomenon of a deeply materialist society.
This is, of course, an oversimplification in two particular respects. I am considering a closed economy with no imports or exports; in a more complex model we would have to take account of the possibility of manic exporting countries (eg Japan) which maintain relatively long hours of paid work though a long-running balance-of-payments surplus, and of other importing countries which have relatively long hours of consumption sup- ported by an equivalent international payments deficit. (We might, however, question whether such a circumstance could be maintained indefinitely).
I have also assumed away unemployment. In terms of the foregoing argument, this may be conceptualized as a problem of the distribution of time, in which some (the unemployed) have underutilized time while others (the employed) have relatively long hours of paid work. Just as the 1930s’ Keynesians sought to stimulate production by redistributing money income, so, on these arguments, we might seek to stimulate the jobs (particularly in the service sector, where consumption is particularly time-intensive) by redistributing hours of work. Shorter work time for those in employment would mean more time for consumption by those who have money to pay for leisure services, and hence more jobs in the service sector and less unemployed. More free time means more consumption, means more jobs.
I must admit that I am hardly more than half serious in this last argument. My point, for the moment, is simply the observation that there is a field of social accounting, the macro-social arithmetic of time, dealing with the implications of productivity growth for the balance between work and leisure, which is potentially as important as the macroeconomic arithmetic with which we are much more familiar, and is not yet at all well developed.
FUTURES January/February 1992
22 Are ~‘e running out of time?
Over the long term, over decades or centuries, this arithmetic works itself out without any conscious inter~/ention by any human agency-thus, our increased productive capabilities have meant that we have moved from the 12-hour work day of the 19th century, to the eight-hour day of the 20th century. Perhaps, by seeking to understand this arithmetic, we may identify how to move towards a stable 21st century pattern by some means other than the gross dislocations of mass unemployment, and all that follows from it.
But, speculation aside, and returning to the question with which I started, we can certainly conclude the foregoing that there is no basis, theoretical or empirical, for thinking that we are ‘running out of time’.
Postscript
As a very brief postscript, let me return to the question that I asked half-way through this article, about people’s own experience of ‘running out of time’. Most will say that their experience is that the world is busier now than before. But, even if everyone answers positively, the society as a whole may still be getting more leisurely. This is not really a paradox, but rather the confusion of the lifecycle process with a historical one. We all maybe get busier throughout our lives. Nevertheless, on the basis of the evidence presented here, our lives as a whole may still be less busy than those of previous generations. As we grow up, gather interests and responsibilities, so our own time gets more precious and pressured. And yet, on the evidence considered here, it still appears that work, in the broadest sense, is reduced. The economic development process is the long and gradual shift of time from production to consumption: all the evidence available to us suggests that the process continues.
Notes and references
1. J. M. Keynes, ‘The economic prospects for our grandchildren’, in Essays in Persuasion (Cambridge, Cambridge University Press, 11183).
2. W. Min~a-KIevanna, ‘Does labor time decrease with industriai~sation? A survey of time
allocation studies’, Current Anthropology, June 1980, pages 279-298. 3. M. Sahlins, Stone Age Economics (London, Tavistock, 1974). 4. /bid, page 27. 5. H. Wilenskv. ‘The uneven distribution of leisure: the impact of economic growth on free
time’, Sock’Problems, 9, Summer 1961, pages 32-36. 6. C. Becker, ‘A theory of the allocation of time’, Economic Journal, 393, September -1965,
page 517; T. Juster and F. Stafford, ‘The A/~ocaf;(?~ of Time ilSR Working Paper Series, Ann airbor, 1990).
7.
8.
9. 10.
11. 12. 13. 14. 15. 16.
M. Young and P. Willmott, The Symmefricaf Family (London, Routledge and Kegan Paul, 1973). 1, D. Owen, ‘Work time reduction in the US and Western Europe, Monthly Labor Review, December ‘1988, pages 46-54. I. Vanek, ‘Time spent in housework’, Scientific American, 231, 1974, pages 116-120. I. I. Cershuny, ‘Changing use of time in the United Kingdom 1937-1975: the Self-Service Era’, Studies of Broadcasting, March 1983. Young and Willmott, op cif, reference 7. NHK, How do People Spend their Time in Japan (Tokyo, NHK, 1971). S. Linder, T/x Harried Leisure C/ass (New York, Columbia University Press, 1970). /bid, page 79. luster and Stafford, op tit, reference 6. J. Vanek, ‘Household technology and social status’, Technology and Culture, 19(X), 1978, pages 361-375.
17. Young and ~~illmott, op tit, reference 7.
FUTURES January/February 1992