Joints and Shear Fractures (continued) We use a Mohr stress diagram to map the failure, by plotting...
26
Joints and Shear Fractures (continued) We use a Mohr stress diagram to map the failure, by plotting both normal and shear stresses, as well as the greatest and least stresses on the Mohr circle. After we test a numerous rocks at different confining pressures, we get a family of failure values that define a failure envelope.
-
date post
21-Dec-2015 -
Category
Documents
-
view
260 -
download
5
Transcript of Joints and Shear Fractures (continued) We use a Mohr stress diagram to map the failure, by plotting...

Joints and Shear Fractures
(continued)We use a Mohr stress diagram to map the failure, by plotting both normal and shear stresses, as well as the greatest and least stresses on the Mohr circle. After we test a numerous rocks at different confining pressures, we get a family of failure values that define a failure envelope.

Creation of Joints & Shear Fractures in the Lab
There are 2 basic types of rock strength tests:
1) Tensile strength tests: specimen is pulled along its axis () with or without confining pressure is applied to it’s sides () until failure, and;
2) Compressive strength tests: specimen is compressed along its axis (1) with or without confining pressure is applied to it’s sides () until failure.
At failure, the values of the principal stresses are noted and so is the orientation of the plane of failure wrt either or .
These data are plotted in Mohr space.
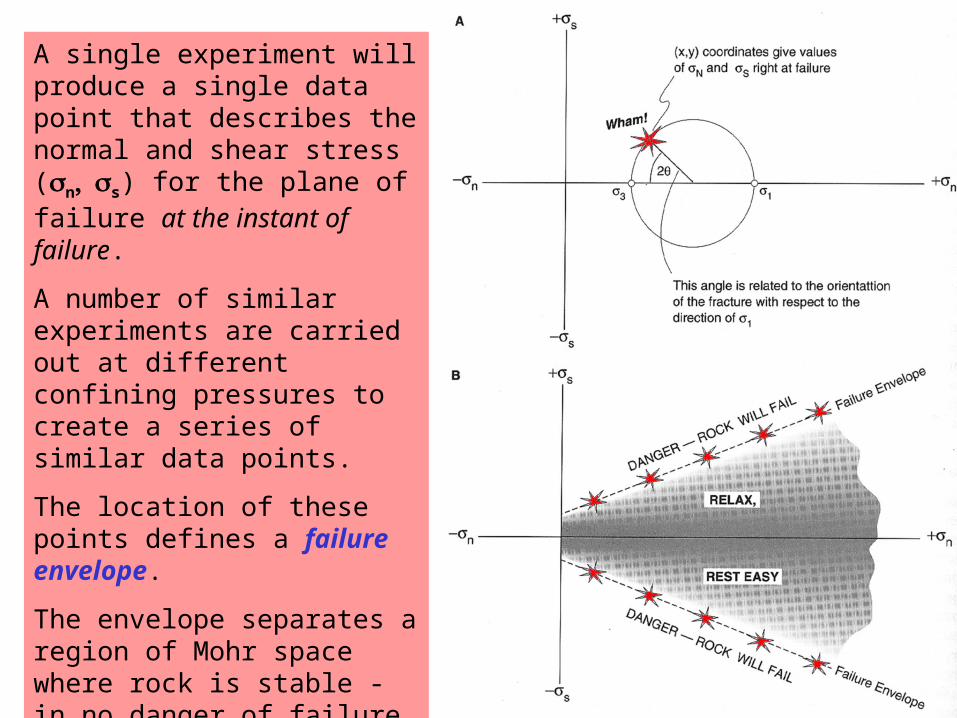
A single experiment will produce a single data point that describes the normal and shear stress (ns) for the plane of failure at the instant of failure.
A number of similar experiments are carried out at different confining pressures to create a series of similar data points.
The location of these points defines a failure envelope.
The envelope separates a region of Mohr space where rock is stable - in no danger of failure - from a region outside the envelope, where intact rock cannot exist.

Each bam along the failure envelope represents rock failure (e.g., fracture) at different differential stress.
So each Mohr circle towards the right of the Mohr plot is a larger circle.
Rx failure (fracture) at a specified 3 and 1).

Tensile Strength Tests
Rocks are typically very weak in tension. Rocks are typically 2 to 30 times stronger in compression than in tension.
Remember: in structural geology, tensile stresses are negative (-) and compressive stresses are positive (+).
We can visualize tensile failure in Mohr space, and get an idea of what a tensile failure law might look like.
Tensile Strength Tests
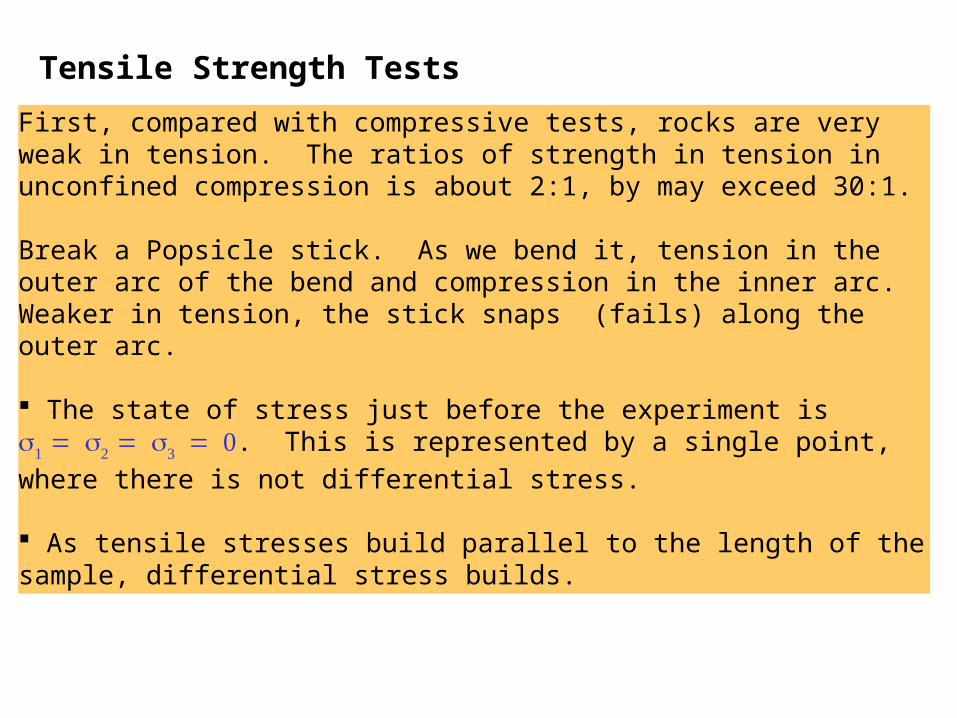
First, compared with compressive tests, rocks are very weak in tension. The ratios of strength in tension in unconfined compression is about 2:1, by may exceed 30:1.
Break a Popsicle stick. As we bend it, tension in the outer arc of the bend and compression in the inner arc. Weaker in tension, the stick snaps (fails) along the outer arc.
The state of stress just before the experiment is . This is
represented by a single point, where there is not differential stress.
As tensile stresses build parallel to the length of the sample, differential stress builds.

A beginning of experiment, no differential stress (e.g., hydrostatic state of stress).
Tensile failure simply occurs when the tensile strength of the rock is exceeded, and the plane of failure is perpendicular to the tensile stress (3).
Increasing tensional stresses, with increases of circle diameter

When tensile strength of the rock is exceeded, the rock breaks perpendicular to the direction of tension (e.g., 3).
A mode I fracture forms.
Tensile stresses builds up parallel to length of sample. As differential stress increases, the diameter of the Mohr circle increases.
Stress perpendicular to the axis of the rock core is the default direction of 1.
During the test, since tensile stress is negative, it’s the least principal stress (3).

Tensile Strength Law:
A rock will fail by mode I fracturing if the magnitude of least principal stress (3) equals or exceeds the tensile strength of the rock.
3 = To
The mode I fracture is parallel to 1 and perpendicular to 3.
In Mohr space, the radius that connects the center of the differential stress circle with the point of failure lies along the x-axis.

Tensile & Compressive Strength Tests
We can also run triaxial tests (with a small amount of compressive confining pressure applied to the flanks of the specimen while at the same time applying a tensile stress along the axis.
Lets explore the relations between differential stress, confining pressure, and fracture strength of a rock in compression.
10 MPa

10 MPa
If we begin the experiment at confining pressure of 10 MPa. Then we increase the tensile stresses parallel to the length of the specimen.
When tensile strength of the rock is exceeded, the rock breaks perpendicular to the direction of tension (e.g., ).
A mode I fracture forms.
Here, increasing levels is represented by points () moving to the left of the origin along the normal stress axis. Ultimately, the differential stress is sufficient to break the rock.

As the test goes on, the differential stress () increases (the diameter of the Mohr circle) until failure occurs.

We begin the experiment at confining pressure of 40 MPa.
If the confining pressures are in the range of 1 = 3 to 5To (from 3 to 5 times the tensile strength of the sandstone),
the failure envelope flatten slightly as passes the shear stress axis and is parabolic (dark line).
Conguate fractures form under transitional tensile behavior.

Failure under compressive stress
At increasing confining pressure (3), we need increased differential stress ().
The increase of differential stress is shown by an change in the Mohr circle diameter.

σc =σ 0 +tanφ(σN)
Coulomb's Law of Failure:Dynamic and mechanical models
developed by Coulomb (1773) and Mohr (1900).
The law describes the height and slope of a linear envelope of failure for rocks in compression.
Where c = o + tan
= angle of internal frictiontan = coefficient of internal
frictionc = critical shear stress required
for faultingo = cohesive strength = normal stress

Relationship between stress and fracturing
These tests define a failure envelope for a particular rock.
All of the normal and shearing stresses inside the envelop are stable – no fractures produced.
All of the stresses on or outside the envelope will producing fracturing

When the Mohr circle becomes tangent to the envelope, then the c at that point causes a fracture.
No fractures are produced by any other combination of c on the circle.
Relationship between stress and fracturing

σc =σ 0 +tanφ(σN)Coulomb's Law of Failure:
The slope and straightness of the envelope reveal that compressive strength of a rock increases linearly with increasing confining pressure.
The actual angle of slope is called, the angle of internal friction ().
The envelope is called the Coulomb envelope.
A law that describes the conditions under which a rock will fail by shear fracturing under compressive stress conditions.

The point of failure on the Coulomb envelope reveal magnitudes of N = 43 and s = 47.
In terms of Coulomb Law of failure, the shear stress value of 47 MPa is the critical shear stress (c) necessary for fracturing to occur.
Part of its magnitude is cohesive strength (0) expressing in units of stress, read directly off of the Mohr y-intercept of the envelope of failure.

The rest of critical shear stress (c) is the stress required to overcome internal frictional resistance to triggering movement on the fracture. This component is labeled: N tan or the coefficient of
internal friction.
This value is expressed in terms of the normal stresses acting on the fault plane and the angle of internal friction, which is the slope of the failure envelope

The cohesive strength (0) is a small part of critical shear stress required for shear fracture.
Most shear fractures form when shear stresses on a plane of failure reach a level slightly over 50% of the normal shear stresses acting on the plane.

σc =σ 0 +tanφ(σN)

What happens with higher confining pressures
At very high confining pressures, Coulomb theory is not valid. With increasing confining pressure, rocks behave in a less brittle fashion.
This is apparent in our stress/strain curves, where at higher confining pressures there is a departure from the linear relations between stress and strain.
Analogous to stress/strain, the linear
Coulomb relations between fracture strength and confining pressure breaks down at higher confining pressures – the rock becomes weaker.
The straight-line envelope becomes a concave downwards envelope of lesser slope.
Note change in slope
The von Mises criterion describes deformational behavior above the brittle-ductile transition.
When the critical yield stress is surpassed, the rock will fail by ductile shear along planes of maximum shear stress, oriented at 45° to the greatest principal stress.

Measured values of tensile strength, cohesive strength, and internal friction for a few rock types.
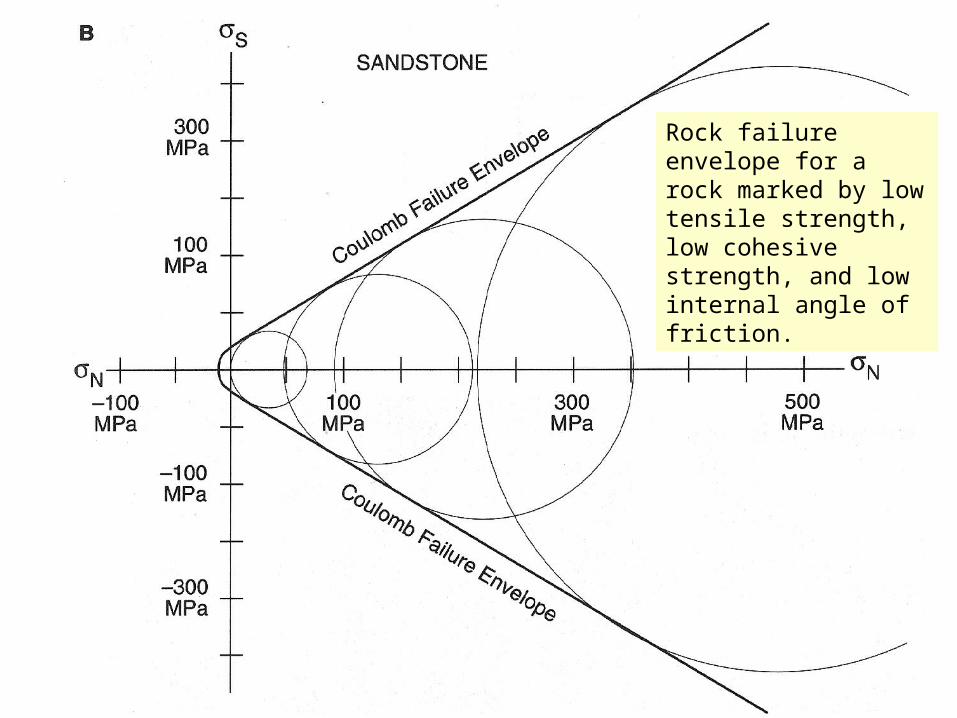
Rock failure envelope for a rock marked by low tensile strength, low cohesive strength, and low internal angle of friction.

Rock failure envelope for a rock marked by high tensile strength, high cohesive strength, and high internal angle of friction.