Joint Research Centre - ec.europa.eu · Manuel Palazuelos Martinez S3 Platform Team Leader, JRC,...
25
The European Commission’s science and knowledge service Joint Research Centre
Transcript of Joint Research Centre - ec.europa.eu · Manuel Palazuelos Martinez S3 Platform Team Leader, JRC,...

The European Commission’s science and knowledge service
Joint Research Centre

Smart Specialisation in the Western Balkans
– potential for knowledge-based economic cooperation
Bucarest, 18 June 2019
Manuel Palazuelos Martinez
S3 Platform Team Leader, JRC, European Commission

The concept of smart specialisation
Smart Specialisation, an innovative approach to innovation
Smart Specialisation is an integrated place-based economic transformation agenda
via research and innovation
‣ SMART: Identify the region’s own strengths and comparative assets
‣ SPECIALISED: Prioritise research and innovation investment in competitive areas
‣ STRATEGIC: Define a shared vision for territorial innovation
Smart Specialisation Platform

The concept of smart specialisation
Economic potential
Societal challenges
Scientific potential
Innovative potential
Niches to
compete on
international
markets
Opportunities to
move up the
value chains
Adding value to
existing
activities
Create new
solutions

The key features of smart specialisation
Smart Specialisation: approach and main features
• Promoted by the Commission
• National/regional research and innovation strategies for smart specialisation (RIS3) are integrated, place-based economic transformation agendas
Build on strength
s
Focus on key
priorities
Place-based
RIS 3
Support
innovation
and foster
investment
Inclusive,
bottom-up
process
(EDP)
Monitoring
and
evaluation
systems

The process of smart specialisation in the EU

Smart specialisation in the world Smart Specialisation worldwide
• Based on
expression of
interest
• JRC support
where possible
• Ownership and
involvement
needed

Smart Specialisation generates interest inside… but also outside the EU: Smart Specialisation worldwide
The role of the Smart Specialisation Platform Smart Specialisation is inspiring countries all over the world
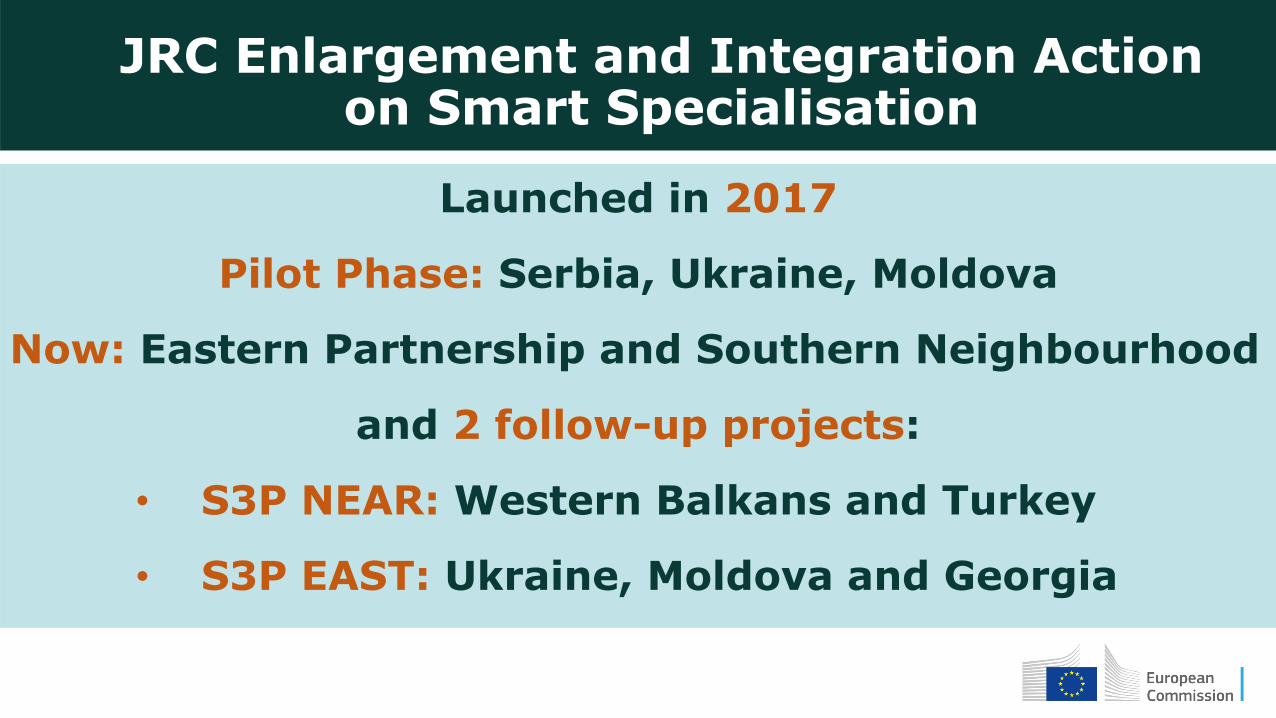
JRC Enlargement and Integration Action on Smart Specialisation
Launched in 2017
Pilot Phase: Serbia, Ukraine, Moldova
Now: Eastern Partnership and Southern Neighbourhood
and 2 follow-up projects:
• S3P NEAR: Western Balkans and Turkey
• S3P EAST: Ukraine, Moldova and Georgia

JRC Enlargement and Integration Action on Smart Specialisation

Smart Specialisation Framework for Enlargement and Neighbourhood Countries
INSTITUTIONAL CAPACITY BUILDING
MAPPING EXERCISE
ENTREPRENEURIAL DISCOVERY PROCESS
INSTITUTIONAL CAPACITY FOR IMPLEMENTATION
FINAL S3 STRATEGY
Albania Bosnia and Herzegovina Kosovo* Montenegro North Macedonia Serbia Turkey (3 regions)
Serbia Montenegro Albania (ongoing) North Macedonia (ongoing)
Montenegro Serbia (ongoing)
Montenegro
Montenegro (public consultation)
*This designation is without prejudice to positions on status, and is in line with UNSCR 1244/1999 and the ICJ Opinion on the Kosovo declaration of independence.

Support to S3 in the Western Balkans
Presidency events
Peer exchange

Support to S3 in the Western Balkans
Smart specialisation in the
Western Balkans –
potential for knowledge-
based economic
cooperation
In preparation
Analytical reports
Analytical reports
Smart Specialisation Framework for EU Enlargement and Neighbourhood Countries
Guidebook for practitioners and policy-makers
2019
EUR xxxxx xx
In preparation
Dedicated guidebook

Evidence for policy-making – economic specialisations of Western Balkan economies
0,000
5,000
10,000
15,000
20,000
25,000
0,000 5,000 10,000 15,000 20,000 25,000 30,000
Degre
e o
f specia
lization in t
urn
over
Degree of specialization in employment
Albania - Industries with current strengths
Marine fishing
Manufacture of concrete, cement and
plaster products
Other specific construction works
Wholesale of information-
communication equipment
Non-specialized wholesale trade
Retail in non-specialized stores
Monetary intermediation
Management of real estate on a fee or
contract basis
0,000
0,500
1,000
1,500
2,000
2,500
3,000
3,500
4,000
0,000 1,000 2,000 3,000 4,000
Degre
e o
f specia
lization in t
urn
over
Degree of specialization in employment
Bosnia and Herzegovina - Industries with current strengths
Silviculture and other forestry activities
Mining of lignite
Sawmilling and planing of wood
Manufacture of metal structures
Wholesale for a commission
Retail of food, beverages and tobacco
in specialised stores
Other telecommunication activities
Size of the bubble measures the relative size of the industry in the national economy

Evidence for policy-making – economic specialisations of Western Balkan economies
Industry name AL BA KV MK ME RS
Wholesale for a commission
Non-specialized wholesale trade
Retail in other household articles in specialised stores
Retail in other goods in specialised stores
Restaurants and mobile food service activities
Wired telecommunication activities
Other telecommunication activities
Other financial service activities, except insurance and pension funding
Common economic specialisations
Industries with current strengths

Evidence for policy-making – scientific cooperation network in the Western Balkans
North Macedonia
*

Evidence for policy-making Scientific and technological specialisations
Top specialisations per source
Sources of science and technology inputs

Evidence for policy-making Scientific and technological specialisations
Top specialisations per economy

Evidence for policy-making Scientific and technological specialisations
Subspecialisations in science and technology

Evidence for policy-making Scientific and technological specialisations
Scientific vs technological specialisations

Evidence for policy-making Scientific and technological collaboration
Collaboration network of WB economies by domain

Evidence for policy-making – exports and FDI
Revealed comparative advantage in exports
19Part 2. The economic, scientific and innovation landscape of the Western Balkans
Additional information on economic specialisation can be derived from data on international com-
petitiveness at sectoral level. In relation to relative advantage based on export trends, there are
several sectors that appear to be of similar significance in all Western Balkan economies, such as
footwear and minerals. The relative advantage in specific sectors is shown by the revealed com-
parative advantage indicator measured by trade flows. Figure 4 provides a closer look at the main
sectors with revealed comparative advantage in the WB in 2016, putting them in relation to the
export share for all products in the same year. The size of the bubble is determined by the value of
exports in USD for a given sector per 100,000 inhabitants.
Figure 4. Top three sectors in the WB by revealed comparat ive advantage
Source: JRC calculations based on WITS data26. No data are available for Kosovo.
Another important indicator of emerging economic specialisations is the popularity of different
sectors among foreign investors. The 2017 fDi Markets database (Financial Times Limited) can be
26. The World Integrated Trade Solution (WITS) so ware provides access to international merchandise trade, tariff and non-tariff measures (NTM) data; https://wits.worldbank.org/Default.aspx?lang=en.
Current st rengths Emerging strengths
Serbia
011 Growing of one-year and two-year plants091 Support activities for petroleum and
natural gas extraction221 Manufacture of rubber products611 Wired telecommunication activities702 Management consultancy activities
141 Manufacture of clothes, except fur161 Sawmilling and planing of wood257 Manufacture of cutlery, tools and general purpose
goods of metal275 Manufacture of electric domestic appliances301 Building of ships and floating structures351 Production, transmission and distribution of electricity461 Wholesale for a commission474 Retail sale of information-communication equipment in
specialised stores492 Freight rail transport522 Service activities incidental to transportation563 Beverage preparing and serving activities620 Computer programming, consultancy and
related activities
Source: UNU-MERIT calculations based on Orbis data. The industry names are those used in the NACE clas-
sification. The 3-digit numbers show the corresponding NACE code.
Greenfield FDI per sector

Evidence for policy-making – global value chains
GVC participation rate for 1990, 2000 and 2018)
45%
43%
35%
52%
49%
55%
50%
56%
52%
61%
58%
61%
55%
57%
66%
73%
65%
65%
0% 10% 20% 30% 40% 50% 60% 70% 80%
Albania
Bosnia and Herzegovina
Montenegro
North Macedonia
WB
EU28
2018 2000 1990

Evidence for policy-making – global value chains
28%
21%
52%
36%
31%
38%
72%
79%
48%
64%
69%
62%
Albania
Bosnia and Herzegovina
Montenegro
North Macedonia
WB
EU28
DVA FVA
Gross-Exports broken down into domestic (DVA) and foreign (FVA) value added content for the year 2018