JOINT IMPLEMENTATION PROJECT DESIGN DOCUMENT FORM Version
67
JOINT IMPLEMENTATION PROJECT DESIGN DOCUMENT FORM - Version 01 Joint Implementation Supervisory Committee page 1 This template shall not be altered. It shall be completed without modifying/adding headings or logo, format or font. JOINT IMPLEMENTATION PROJECT DESIGN DOCUMENT FORM Version 01 - in effect as of: 15 June 2006 CONTENTS A. General description of the project B. Baseline C. Duration of the project / crediting period D. Monitoring plan E. Estimation of greenhouse gas emission reductions F. Environmental impacts G. Stakeholders ’ comments Annexes Annex 1: Contact information on project participants Annex 2: Baseline information Annex 3: Monitoring plan
Transcript of JOINT IMPLEMENTATION PROJECT DESIGN DOCUMENT FORM Version

JOINT IMPLEMENTATION PROJECT DESIGN DOCUMENT FORM - Version 01
Joint Implementation Supervisory Committee page 1
This template shall not be altered. It shall be completed without modifying/adding headings or logo, format or font.
JOINT IMPLEMENTATION PROJECT DESIGN DOCUMENT FORM
Version 01 - in effect as of: 15 June 2006
CONTENTS
A. General description of the project
B. Baseline
C. Duration of the project / crediting period
D. Monitoring plan
E. Estimation of greenhouse gas emission reductions
F. Environmental impacts
G. Stakeholders’ comments
Annexes
Annex 1: Contact information on project participants
Annex 2: Baseline information
Annex 3: Monitoring plan

JOINT IMPLEMENTATION PROJECT DESIGN DOCUMENT FORM - Version 01
Joint Implementation Supervisory Committee page 2
This template shall not be altered. It shall be completed without modifying/adding headings or logo, format or font.
SECTION A. General description of the project
A.1. Title of the project:
“Implementation of energy efficiency projects at OJSC “Novolipetsk Steel”, Lipetsk area, Russia”.
Sectoral scope 1, 4, 9: Energy industries, Manufacturing industries, Metal production.
PDD version 3.1.
14 March 2011.
A.2. Description of the project:
Open Joint-Stock Company “Novolipetsk Steel” (http://www.nlmksteel.com/) is one of the world’s largest
steel producers and it produces about 15% of Russia’s steel (total steelmaking capacity is about 9.4
million tonnes of crude steel per annum). Novolipetsk Steel is a vertically integrated steel company and
owns Novolipetsky Metallurgical Plant (hereinafter NLMK) and other facilities in Russia and abroad,
for example: Stoilensky GOK, Altai-koks, Viz-Stal, Maxi-Group, DanSteel A/S and others
1.
NLMK is a facility of OJSC “Novolipetsk Steel”. NLMK is located in the town of Lipetsk in the
European part of the Russian Federation. It is a big integrated steel-making facility with all the stages of
steel production: mining, coke and by-product, blast furnace, steelmaking and rolling process. The total
capacities of main products are presented in Table A.2.1.
Table A.2.1: The total capacities of main products (as by 01 January 2008)
Production area Structure Capacity, mln. tonnes/year
Sinter plant Four agglomerators 14,6
Coke batteries Four coke batteries 4,5
Pig iron Two shops with five blast furnaces 9,6
Steel Two basic oxygen furnace shops and
nine continuous casting machines 9,5
Rolling Hot-rolling and three cold-rolling mills 9,1
Including Hot Rolling Plant Hot-rolling mill 2000 5,4
Source: Official NLMK website: http://www.nlmksteel.com/StandardPage____15.aspx
Also NLMK has auxiliary shops: Gas Shop (hydrogen, oxygen, nitrogen and other gases production),
Fireproof Shop and etc. NLMK supplies over 40% of its main facility's energy needs through an own
combined heat and power plant with 332 MW of total electricity capacity.
The project activity consists of the improvement of the energy efficiency by the implementation of two subprojects. All the proposed subprojects are implemented at NLMK. The names of subprojects are presented below: 1. Reconstruction of heating furnaces No 4 and 5 at the Hot Sheet-Rolling Shop (Hot-rolling mill 2000);
1 Please see group structure: http://www.nlmksteel.com/StandardPage____13.aspx

JOINT IMPLEMENTATION PROJECT DESIGN DOCUMENT FORM - Version 01
Joint Implementation Supervisory Committee page 3
This template shall not be altered. It shall be completed without modifying/adding headings or logo, format or font.
2. Commissioning the hydrogen production installations based on steam reforming of natural gas technology (Gas Shop).
Situation existing prior to the project
Subproject 1. Reconstruction of heating furnaces No 4 and 5 at the Hot Sheet-Rolling Shop There are five heating furnaces operating at the Hot Sheet-Rolling Shop (further in the text – HSRS) of NLMK. The steel (slabs) is heated in these furnaces before the rolling process. The heating furnaces No 1-5 were commissioned in the period from 1970-1979. The furnaces are maintained with routine and capital repairs and they can be operated further without any constraints. The fuel of the furnaces is a mixture of natural, blast furnace and coke oven gases (only natural and blast furnace gases are used as fuel at the furnaces from 2006). Some heat of exhaust gases after the furnaces is utilized in heat-recovery boilers. Also the metal structure of the furnaces is cooled using the cooling evaporation system with useful heat output into the heating system of NLMK. The steam from the heat-recovery boilers and the cooling evaporation system is saturated and has 1.3 MPa of pressure. However the consumption of the steam is less than generation, especially in a period from the spring to the autumn and the some amount of steam is released into the atmosphere. Before the project implementation all of the furnaces had obsolete burners without a burning automatic regulation system and no effective construction of a gate system. Besides, the existing slab loading/unloading system of furnaces does not enable to use progressive technology of hot slab-delivery system in full. Therefore these furnaces have higher specific fuel consumption per tonne of steel and higher waste of steel during heating process in comparison with modern heating furnaces. The technical parameters of the furnaces at the shop before the project implementation are presented in Annex 2. Subproject 2. Commissioning the hydrogen plant based on steam reforming of natural gas technology Hydrogen is used in some processes of cold-rolled steel production. It is produced at the installations of two hydrogen stations by electrolysis of water. Hydrogen station No 1 consists of twelve electrolysers (type FV-500M) and hydrogen station No 2 is a sectioned installation with twelve cells (BEU-250). In this technology the electricity and heat (steam) are consumed for hydrogen production. The technical parameters of the hydrogen stations before the project implementation are presented in Annex 2.
Baseline scenario Baseline scenarios for all of subprojects are the continuation of a situation existing prior to the project. It means an equipment of existing installations will be maintained with routine and capital repairs and operated until 2013 at least.
NLMK is implementing an energy saving program from 2000 onwards. As result, heat consumption
(including steam with 1.3 MPa of pressure) decreases. Therefore the amount of this steam released into the
atmosphere is increased.
A JI specific approach was used for the baseline setting. Please see Section B for more detailed
information.
Project scenario
Subproject 1. Reconstruction of heating furnaces No 4 and 5 at the Hot Sheet-Rolling Shop For the reconstruction of furnaces No 4 and 5 the new modern energy-saving measures were realized at the furnaces. As a result, the fuel consumption per tonne of steel and the slab residence time were decreased. Each of reconstructed furnaces can heat steel with less fuel consumption. Also waste of steel is decreased after the subproject implementation. It means that the steel output (steel volume after heating) is required less blast oxygen furnace (BOF) steel volume and, respectively, less expenditure of energy in comparison with baseline. However the heat output from heat-recovery boilers was reduced with the reduction of fuel

JOINT IMPLEMENTATION PROJECT DESIGN DOCUMENT FORM - Version 01
Joint Implementation Supervisory Committee page 4
This template shall not be altered. It shall be completed without modifying/adding headings or logo, format or font.
consumption. Also the cooling evaporation systems of furnaces No 4 and 5 were dismantled and heat generation was stopped. Heat amount necessary for customers supply
2 is generated at NLMK’s combined
heat and power plant (NLMK CHPP). Furnace No 5 was commissioned in June 2004 and Furnace No 4 – in May 2008. They be used in the first place and therefore they replaced the steel output volume of old furnaces No 4 and 5 and furnaces No 1-3 partly in comparison with baseline scenario. Subproject 2. Commissioning the hydrogen plant based on steam reforming of natural gas technology The new plant of hydrogen production was commissioned in December 2004. It is using the steam reforming of natural gas technology for hydrogen production. The new installations partly replace the hydrogen production at the two old hydrogen stations which use method of water electrolysis. It means that significant less electricity consumption is required for hydrogen production. However the old hydrogen stations are operated and they produce some hydrogen if the amount of hydrogen from new installations is not enough.
Brief history of the project
Subproject 1. Reconstruction of heating furnaces No 4 and 5 at the Hot Sheet-Rolling Shop NLMK prepared the feasibility study of the reconstruction of heating furnace No 5 in 2001 and heating furnace No 4 in 2003. Technical project documentation of the reconstruction was prepared by “Heurbel” company (Belgium). “Novokramatorsky Machine Building plant” (Ukraine) and HLMK’s Repair plant implemented the reconstruction of heating furnaces No 5 (for 2002-2003) and 4 (for 2003-2007). Subproject 2. Commissioning the hydrogen plant based on steam reforming of natural gas technology In 2004 NLMK commissioned new hydrogen plant (three lines of hydrogen production) based on steam reforming of natural gas technology. This plant is developed Haldor Topsoe A/S (Denmark). Construction works were implemented by CJSC “Kislorodmash” (Russia) for 2003-2004.
A.3. Project participants:
Party involved Legal entity project participant
(as applicable)
Please, indicate if
the Party involved
wishes to be
considered as
project participant
(Yes/No)
Party A: The Russian
Federation (Host party) OJSC “Novolipetsk Steel” No
Party B: The Netherlands Global Carbon BV No
Role of the Project Participants:
OJSC “Novolipetsk Steel” is one of the world’s largest steel producers. It is a vertically integrated
steel company and owns Novolipetsky metallurgical plant and other facilities in Russia and abroad, for
example: Stoilensky GOK, Altai-koks, Viz-Stal, Maxi-Group, DanSteel A/S and others. Company will
manage and fund JI project implementation at NLMK. It will own ERUs generated. OJSC
“Novolipetsk Steel” is a project participant;
Global Carbon BV is a leading expert on environmental consultancy and financial brokerage services
in international greenhouse emissions trading market under Kyoto Protocol. Global Carbon BV is a
2 This amount is not equal to the amount of heat generating at the heat-recovery boilers and the cooling evaporation
systems of furnaces No 4 and 5 in the baseline because some amount of steam is released into the atmosphere. Please
see above the description of baseline scenario.

JOINT IMPLEMENTATION PROJECT DESIGN DOCUMENT FORM - Version 01
Joint Implementation Supervisory Committee page 5
This template shall not be altered. It shall be completed without modifying/adding headings or logo, format or font.
project design document (PDD) developer including monitoring plan and baseline setting. Global
Carbon BV has developed the first JI project that has been registered at United Nations Framework
Convention on Climate Change (UNFCCC). The first verification under JI mechanism was also
completed for Global Carbon BV project. The company focuses on Joint Implementation (JI) project
development in Bulgaria, Ukraine, Russia. Global Carbon BV is responsible for the preparation of the
investment project as a JI project including PDD preparation, obtaining Party approvals, monitoring
and transfer of ERUs. Global Carbon BV is a Project Participant.
A.4. Technical description of the project:
A.4.1. Location of the project:
The project is located at NLMK in Lipetsk town in the Lipetsk area of the Russian Federation. The
geographical location of the project is presented in Figure A.4.1.1 below.
Figure A.4.1.1: Location of the project on the Russian Federation map
A.4.1.1. Host Party(ies):
The Russian Federation.
A.4.1.2. Region/State/Province etc.:
Lipetsk Area is located in the European part of Russian Federation. The population of area is
approximately 1.2 mln. (45th place in Russia) and the surface area is approximately 24 thous.km
2 (71
th
place in Russia).
A.4.1.3. City/Town/Community etc.:

JOINT IMPLEMENTATION PROJECT DESIGN DOCUMENT FORM - Version 01
Joint Implementation Supervisory Committee page 6
This template shall not be altered. It shall be completed without modifying/adding headings or logo, format or font.
Lipetsk is located within Lipetsk area and it is the capital of this area. The coordinates of the town are
52°37'N, 39°36'E.
Lipetsk was founded in thirteenth century. It is the biggest town of Lipetsk area with a population of
approximately 500 thousand people. Besides NLMK the big enterprise “Lipetskcement” and other
facilities of consumer equipment producers (Indesit, Ariston) are located in Lipetsk.
A.4.1.4. Detail of physical location, including information allowing the unique
identification of the project (maximum one page):
The project is located at NLMK in Lipetsk town boundaries in its south-east part and has an area of
approximately 25 square kilometres. NLMK business address is Lipetsk town, Metallurgists square,
building 1. The coordinates of NLMK are 52°57'N, 39°62'E and coordinates of:
Subproject 1 are 52°55'N, 39°63'E;
Subproject 2 are 52°57'N, 39°64'E.
A.4.2. Technology(ies) to be employed, or measures, operations or actions to be
implemented by the project:
Subproject 1. Reconstruction of heating furnaces No 4 and 5 at the Hot Sheet-Rolling Shop The main goals of this subproject are the increase of thermal efficiency of the furnaces and the reduction of the waste of steel. The reconstruction of the furnaces includes: Installation of recuperative heaters enables to utilize the heat from the exhaust gases for the input air
heating. – The temperature of input air is higher than before the project implementation and, respectively, the fuel consumption is reduced because some energy is not spent for heating of inflowing air;
Implementation of new foundations, a new thermal insulation, metal structure of the furnaces and installation of the sole hydraulic movement system. – It reduces the heat loses of furnaces through the walls, doors and roofs and decreases fuel consumption for steel heating;
Installation of the unstressed system of the load/unload slabs to the furnaces enables to use new modern energy-saving hot load/unload of slabs technology. – The temperature of the loading slabs is higher when using hot load/unload of slabs technology and the less energy is spent for heating of slabs. However the hot slabs have less strength and the using of the previous system does not allow loading such slabs to the furnaces without any damages. Therefore slabs had less temperature and more fuel is spent for its heating;
Replacement of burners and installation of complete automation system of fuel burning process. – The application of new burners and burning automatic system allow to use the heat of fuel more efficiently. It provides the effective heating slabs and heating process regulation with the maintenance of the slab surface temperature is not above 1290 C (a minimum of steel waste).
The actions from the second to the fourth are reduced the residence time of slabs in the furnaces. In addition it decreases the waste of steel. The new cooling system of furnace metal structure by chemically refined water (closed cycle) was installed instead of the cooling evaporation system. The cooling evaporation systems at furnaces No 4 and 5 were demolished.
The scheme of the interaction of processes in the heating furnaces is presented in Figure A.4.2.1.
JOINT IMPLEMENTATION PROJECT DESIGN DOCUMENT FORM - Version 01
Joint Implementation Supervisory Committee page 7
This template shall not be altered. It shall be completed without modifying/adding headings or logo, format or font.
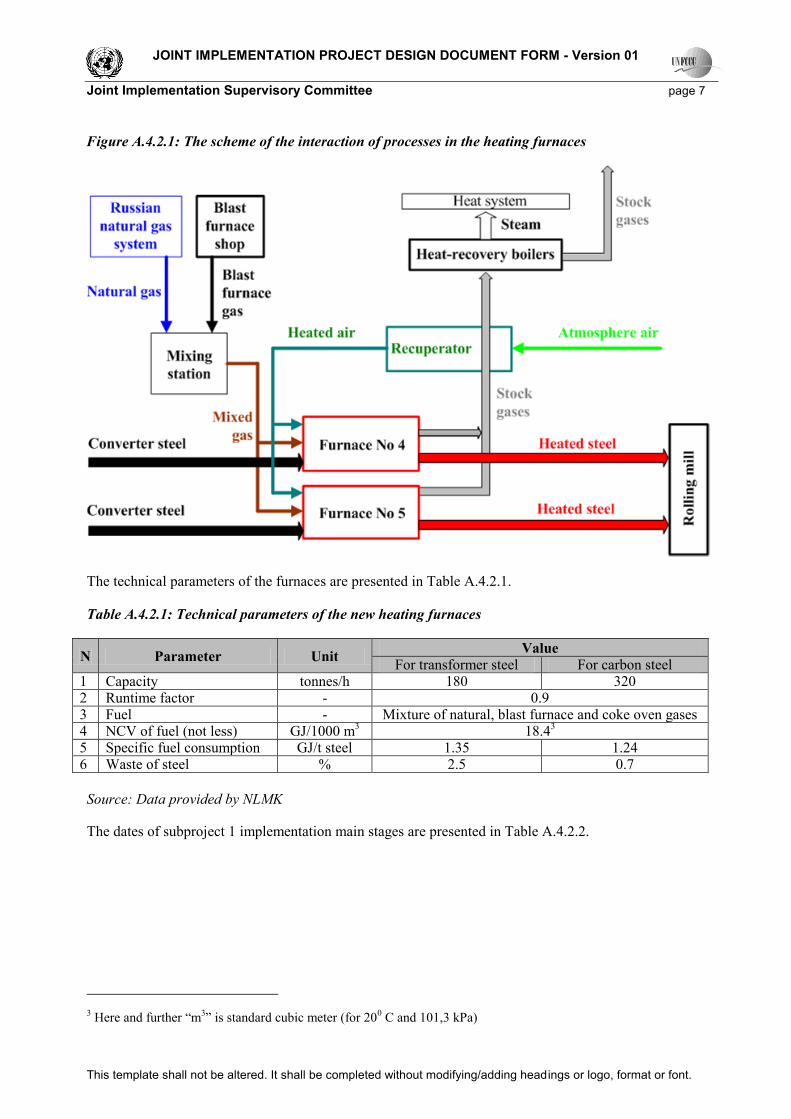
Figure A.4.2.1: The scheme of the interaction of processes in the heating furnaces
The technical parameters of the furnaces are presented in Table A.4.2.1.
Table A.4.2.1: Technical parameters of the new heating furnaces
N Parameter Unit Value
For transformer steel For carbon steel 1 Capacity tonnes/h 180 320 2 Runtime factor - 0.9 3 Fuel - Mixture of natural, blast furnace and coke oven gases 4 NCV of fuel (not less) GJ/1000 m
3 18.4
3
5 Specific fuel consumption GJ/t steel 1.35 1.24 6 Waste of steel % 2.5 0.7
Source: Data provided by NLMK The dates of subproject 1 implementation main stages are presented in Table A.4.2.2.
3 Here and further “m
3” is standard cubic meter (for 20
0 C and 101,3 kPa)

JOINT IMPLEMENTATION PROJECT DESIGN DOCUMENT FORM - Version 01
Joint Implementation Supervisory Committee page 8
This template shall not be altered. It shall be completed without modifying/adding headings or logo, format or font.
Table A.4.2.2: The dates of subproject 1 implementation main stages
N Stage Furnace No5 Furnace No4
1 Furnace stop August 2000 September 2003 2 Construction works June 2002 – November 2003 September 2003 – September 2007 3 Starting-up works November 2003 – June 2004 September 2007 – May 2008 4 Commission June 2004 May 2008
Source: Data provided by NLMK Subproject 2. Commissioning the hydrogen plant based on steam reforming of natural gas technology The new hydrogen plant by «Haldor Topsoe» company production was commissioned in 2005. It includes the installation of: four natural gas compressors; one air (a Combustion Air Blower) compressor; water system to demineralise process water, desulphurization block; three steam reforming lines of natural gas (Saturator, HTCR (Haldor Topsoe Convection Reformer)
Reformer, Shift Reactor), absorption block (PSA – Pressure Swing Adsorption); hydrogen recipients; control equipment.
Sulphur is recovered from natural gas in the Desulphurization Block. After that natural gas is preheated up
to 450 C and mixed with steam in Saturator. Obtained mixture is moved into HTCR Reformer. HTCR
Reformer is a kiln with special tubes for the reforming process over a special catalyst. The main reactions
are presented below:
2243HCOOHCH
222HCOOHCO
Then reaction products are cooled (steam condensation) and separated Hydrogen is submitted to
consumers and other products (off-gas) are burned with natural gas in the HTCR Reformer. In this
technology the process gas and steam (from demineralised water) are heated mainly by flue gas. Therefore
the thermal efficiency for reforming is increased to 80% and the export of steam is eliminated.
Hydrogen station scheme is presented in Figure A.4.2.2.

JOINT IMPLEMENTATION PROJECT DESIGN DOCUMENT FORM - Version 01
Joint Implementation Supervisory Committee page 9
This template shall not be altered. It shall be completed without modifying/adding headings or logo, format or font.
Figure A.4.2.2: Hydrogen station scheme
Source: Data provided by NLMK
The technical parameters of the hydrogen plant are presented in Table A.4.2.3.
Table A.4.2.3: Technical parameters of the hydrogen plant
N Parameter Unit Value
1 Capacity (total) m3/h 6,000
2 Specific natural gas consumption per 1000 m3 of hydrogen production m
3/ 1000 m
3 407.5
Source: Data provided by NLMK
The dates of subproject 2 implementation main stages are presented in Table A.4.2.4.
Table A.4.2.4: The dates of subproject 2 implementation main stages
N Stage Furnace No5 1 Construction works October 2002 – November 2004 2 Starting-up works November 2004 – December 2004 3 Commission December 2004
Source: Data provided by NLMK

JOINT IMPLEMENTATION PROJECT DESIGN DOCUMENT FORM - Version 01
Joint Implementation Supervisory Committee page 10
This template shall not be altered. It shall be completed without modifying/adding headings or logo, format or font.
The specialists of new equipment suppliers conducted the NLMK personnel (engineers, operations and
maintenance personnel) trainings during starting-up works at project site. The necessary trainings
concerning monitoring process (including the personnel certification by Roctechnadzor – Russian
reviewing authority) are prescribed in the existing quality management systems at NLMK. NLMK has ISO
9001:2000 certificate. Also Global Carbon BV will provide a staff training on monitoring procedures,
ERU calculation and preparation of annual monitoring report.
A.4.3. Brief explanation of how the anthropogenic emissions of greenhouse gases by sources
are to be reduced by the proposed JI project, including why the emission reductions would not
occur in the absence of the proposed project, taking into account national and/or sectoral policies
and circumstances:
There are not any national and/or sectoral legislative acts and circumstances which require NLMK to
implement the project. The proposed project was implemented for the fuel and electricity consumption
reduction and associated with them the CO2 emission reduction. It means that the operating costs are
decreased. However the project does not look financially attractive as it is proved in Section B.2 through
the application of the appropriate investment analysis as per the approved CDM “Tool for demonstration
and assessment of additionality” (version 05.2). The project implementation was begun during non good
financial and marketing situation for metallurgical industry and the IRR of each subproject is less than
appropriate IRR benchmark. For more detailed information on baseline setting and additionality, please
refer to Section B.
Therefore if the project is not implemented, more greenhouse gases (GHG) will be emitted. The briefly
explanation how GHG emission reductions are to be achieved and the estimation of anticipated total
reductions for each of subproject are presented below.
Subproject 1. Reconstruction of heating furnaces No 4 and 5 at the Hot Sheet-Rolling Shop
After subproject implementation the specific fuel consumption was reduced from 2.83 GJ/tonne of steel to
2.02 GJ/tonne of steel (actual data for furnaces No 1-5). For burned fuel mixture (natural, blast furnaces
gases) and approximately 4.8 mln. tonnes of steel output at the furnaces No 1-5 per year it means
approximately 306 thous. tonnes of CO2 emission reduction per year.
Also the waste of steel was decreased from 2.2% to 1.4% (actual data for furnaces No 1-5). It means that
in project scenario about 39 thous. tonnes of BOF steel are produced less than in baseline. Thereby
emission reduction is more than 55 thous. tonnes of CO2 per year (IPCC default emission factor for basic
oxygen furnace steel production is 1.46 tCO2 per tonne of steel).
However after the demounting of the cooling evaporation systems which were at the old furnaces the heat
generation was stopped by approximately 500 thous. GJ per year (for 2011). It means that this heat will be
generated at NLMK’s CHPP. Emission factor of heat generation at the CHPP is 0.184 tCO2/GJ. Therefore
the additional GHG emission will be about 91 thous. tonnes of CO2 per year.
Therefore total emission reduction of subproject 1 is about 270 thous. tonnes of CO2 per year.
Subproject 2. Commissioning the hydrogen plant based on steam reforming of natural gas technology
The natural gas and electricity are used for hydrogen production at new plant. The specific natural gas
consumption and the specific electricity consumption are 15.66 GJ and 0.13 MWh per 1000 m3 of
hydrogen, respectively. The emission factor of new hydrogen plant is 1.03 CO2 per1000 m3 of hydrogen
(for average electricity emission factor is 1.146 CO2/MWh, please see Section E for more detail
information).

JOINT IMPLEMENTATION PROJECT DESIGN DOCUMENT FORM - Version 01
Joint Implementation Supervisory Committee page 11
This template shall not be altered. It shall be completed without modifying/adding headings or logo, format or font.
This hydrogen replaces hydrogen of old electrolysis stations. The electricity and steam are used for
hydrogen production at new plant The emission factor of old hydrogen stations is 10.84 CO2 per 1000 m3
of hydrogen (the specific electricity consumption and the specific steam consumption are 5.48 MWh and
3.93 GJ per1000 Nm3 of hydrogen, respectively and emission factor for heat generation is 0.184 tCO2/GJ).
For the hydrogen production is about 41.4 thous. m3 of hydrogen per year the emission reduction of
subproject 2 is approximately 282 thous. tonnes of CO2 per year.
A.4.3.1. Estimated amount of emission reductions over the crediting period:
Years
Length of the crediting period 5
Year Estimate of annual emission reductions
in tonnes of CO2 equivalent
2008 496,440
2009 309,700
2010 538,132
2011 552,686
2012 567,240
Total estimated emission reductions over the
crediting period
(tonnes of CO2 equivalent)
2,464,199
Annual average of estimated emission reductions
over the crediting period
(tonnes of CO2 equivalent)
492,840
Years
Period after 2012, for which emission reductions are
estimated
8
Year Estimate of annual emission reductions in
tonnes of CO2 equivalent
2013 567,240 2014 567,240 2015 567,240 2016 567,240 2017 567,240 2018 567,240 2019 567,240 2020 567,240
Total estimated emission reductions over the
period indicated
(tonnes of CO2 equivalent)
4,537,924
Detailed calculation of project emission reductions is presented in Section E.
A.5. Project approval by the Parties involved:
The project was approved by the Parties involved:
Russia (Host party) – the Letter of approval from the Ministry of Economic Development is dated 17
January 2011 No D07-15.
The Netherlands (Sponsor party) – the Letter of approval from the NL Agency of Ministry of Economic
Affairs is dated 08 September 2010.

JOINT IMPLEMENTATION PROJECT DESIGN DOCUMENT FORM - Version 01
Joint Implementation Supervisory Committee page 12
This template shall not be altered. It shall be completed without modifying/adding headings or logo, format or font.
SECTION B. Baseline
B.1. Description and justification of the baseline chosen:
A baseline for the JI project has to be set in accordance with Appendix B to decision 9/CMP.1 (JI
guidelines)4, and with further guidance on baseline setting and monitoring developed by the Joint
Implementation Supervisory Committee (JISC). In accordance with the Guidance on Criteria for Baseline
Setting and Monitoring (version 2)5 (hereinafter referred to as Guidance ), the baseline for a JI project is
the scenario that reasonably represents the anthropogenic emissions by sources or anthropogenic removals
by sinks of GHGs that would occur in the absence of the proposed project. In accordance with the
Paragraph 9 of the Guidance the project participants may select either: an approach for baseline setting
and monitoring developed in accordance with appendix B of the JI guidelines (JI specific approach); or a
methodology for baseline setting and monitoring approved by the Executive Board of the clean
development mechanism (CDM), including methodologies for small-scale project activities, as
appropriate, in accordance with paragraph 4(a) of decision 10/CMP.1, as well as methodologies for
afforestation/reforestation project activities. Paragraph 11 of the Guidance allows project participants that
select a JI specific approach to use selected elements or combinations of approved CDM baseline and
monitoring methodologies or approved CDM methodological tools, as appropriate.
Description and justification of the baseline chosen is provided below in accordance with the "Guidelines
for users of the Joint Implementation Project Design Document Form", version 046, using the following
step-wise approach:
Step 1: Indication and description of the approach chosen regarding baseline setting
Project participants have chosen the following approach regarding baseline setting, defined in the
Guidance (Paragraph 9):
a) An approach for baseline setting and monitoring developed in accordance with appendix B of the JI
guidelines (JI specific approach).
The Guidance applies to this project as the above indicated approach is selected as mentioned in the
Paragraph 12 of the Guidance. The detailed theoretical description of the baseline in a complete and
transparent manner, as well as a justification in accordance with Paragraph 23 through 29 of the Guidance
should be provided by the project participants.
The baseline for this project shall be established in accordance with appendix B of the JI guidelines.
Furthermore, the baseline shall be identified by listing and describing plausible future scenarios on the
basis of conservative assumptions and selecting the most plausible one. The project consists of the two
subprojects. The baseline for each of subprojects was established separately.
The project was considered for 2001 (subproject 1 – October 2001 and subproject 2 – October 2002). The
following key factors that affect the baseline are taken into account:
a) Sectoral reform policies and legislation. The Russian metal market is free market and the internal
and foreign demands of metal develop requires for a quality and sort of metal. Therefore there is not
special legislation for the metal industry in Russia. However any project must be approved by a local
4 http://unfccc.int/resource/docs/2005/cmp1/eng/08a02.pdf#page=2
5 http://ji.unfccc.int/Ref/Documents/Baseline_setting_and_monitoring.pdf
6 http://ji.unfccc.int/Ref/Documents/Guidelines.pdf

JOINT IMPLEMENTATION PROJECT DESIGN DOCUMENT FORM - Version 01
Joint Implementation Supervisory Committee page 13
This template shall not be altered. It shall be completed without modifying/adding headings or logo, format or font.
administration (permission for construction) and by a local conservancy. Also the most of
metallurgical plants in Russia are the big enterprises. Therefore they are important for region, area or
town where they are located, especially, in a social aspect: workplaces, working conditions,
environmental impact and etc;
b) Economic situation/growth and socio-demographic factors in the relevant sector as well as
resulting predicted demand. Suppressed and/or increasing demand that will be met by the
project can be considered in the baseline as appropriate (e.g. by assuming that the same level of
service as in the project scenario would be offered in the baseline scenario). In the beginning of
2002 in Russia the metal production decreased. It was related to the reduction of the metal demand
within Russia and in the world (more 50% of metal production at the Russian metallurgical plants is
supplied to other countries). Financial indicators of metallurgical plants decreased as a result7. Then
the USA, European Union and other countries introduced the restrictive measures against the metal
import from the Russian metallurgical companies8. The situation was changed at the end of 2002 only
and in the beginning of 2003 the metal demand was beginning to grow;
c) Availability of capital (including investment barriers). After default which was in Russia in 1998
there was the high level of inflation. It was 18.6% in 2001 and 15.1% in 2002 (Bank of Russia data9).
As result a capital is available but high bank rate (the interbank offered rate was more than 20%10
),
high country investment risk and other risks make unprofitable of new equipment introduction in
Russia;
d) Local availability of technologies/techniques, skills and know-how and availability of best
available technologies/techniques in the future. All technologies applied in proposed project were
well known and available. Some local and foreign companies could provide technology and
equipment and implement project and construction works for the project implementation;
e) Fuel prices and availability. The natural gas and electricity prices were regulated by Russian
Government in 2001-2002. In Russia they were lower than world market price. In 2002 the tariff of
natural gas price was approximately 26 EUR/1000 m3 and the tariff of electricity was approximately
16 EUR/MWh. However the Government planned to increase the tariffs. The growth of tariffs should
have been approximately 15-25% a year (it also includes inflation). Electricity and natural gas are
widely used and available in the Centre part of Russia and they are produced domestically. Blast
furnace and coke oven gases are produced and utilized at the different shops of NLMK
The baseline is established in a transparent manner with regard to the choice of approaches, assumptions,
methodologies, parameters, data sources and key factors. Uncertainties are taken into account and
conservative assumptions are used. ERUs cannot be earned for decreases in activity levels outside the
project activity or due to force majeure as emission factors based on specific production are used (e.g.
GJ/t steel).
The baselines for each of subproject will be the most plausible future scenario on the basis of conservative
assumptions and key factors described above. The basic principle applied is that the saleable steel output
(subproject 1), and hydrogen production (subproject 2) are identical in the project and the baseline
scenario.
Step 2. Application of the approach chosen
7 Magazine "Eurasian Metals", "Activities for the Metallurgy Industry Development until 2010", Chapter 2
8 Magazine "Eurasian Metals", "Activities for the Metallurgy Industry Development until 2010", Chapter 4
9 Bank of Russia, Quarterly Inflation Review, 2004, Quarter 4, page 3
10 Bank of Russia website, Moscow InterBank Offered Rate, October 2001

JOINT IMPLEMENTATION PROJECT DESIGN DOCUMENT FORM - Version 01
Joint Implementation Supervisory Committee page 14
This template shall not be altered. It shall be completed without modifying/adding headings or logo, format or font.
Subproject 1. Reconstruction of heating furnaces No 4 and 5 at the Hot Sheet-Rolling Shop
The reconstruction of the furnaces provides to use the existing foundations and some metal structure. The
new furnaces construction was not considered before the project implementation (base year of this
subproject is 2001) because it increase the investment cost (new foundations and metal structure)
significantly in comparison with reconstruction. Therefore the two future plausible scenarios were only at
that time:
Continuation of a situation existing prior to the project;
Reconstruction of furnaces No 4 and 5.
Reconstruction of furnaces No 4 and 5 consists of some measures (please see Section A.4.2). Theoretically
a partly reconstruction (e.g. without the automation system of fuel burning process) could be considered as
a future scenario. However it is not plausible because the efficiency of other measures is reduced as a
result. Therefore the completed reconstruction of furnaces No 4 and 5 as described in Section A.4.2 is
considered as plausible future scenario.
The plausible future scenarios of subproject 1 are presented below:
Scenario 1: Continuation of a situation existing prior to the project;
Scenario 2: Reconstruction of heating furnaces No 4 and 5.
These scenarios are described below in more detail.
1) Continuation of a situation existing prior to the project
The heating furnaces No 1-5 are maintained at regular intervals and larger repairs. The fuel of the furnaces
is a mixture of natural and blast furnace gases. Some heat of exhaust gases from the furnaces was utilized
in heat-recovery boilers. Also the metal structure of furnaces is cooled by the use of the cooling
evaporation system with useful heat output (steam with 1.3 MPa of pressure) into the heating system of
NLMK. However the consumption of this steam is less than generation, especially in a period from the
spring to the autumn and the some amount of steam is deflated into the atmosphere. NLMK is
implementing energy saving program from 2000. As result, heat consumption (including steam with 1.3
MPa of pressure) decrease. Therefore the amount of this steam is deflated into the atmosphere more and
more. There are no legal or other requirements that enforce NLMK to stop or to reconstruct furnaces. In
the non-stable situation at the metal market the additional investment is not required for this scenario.
Thus, scenario 1 is feasible and plausible.
2) Reconstruction of heating furnaces No 4 and 5
The completed reconstruction of furnaces No 4 and 5 as described in Section A.4.2 is realized. It has no
any technical barriers and the applied technologies are well-known. Each of reconstructed furnaces can
heat steel with less fuel consumption. Also waste of steel is decreased after the reconstruction. It means
that for the steel output (steel volume after heating) is required less BOF steel volume and, respectively,
less expenditure of energy in comparison with situation before the reconstruction. The heat output from
heat-recovery boilers was reduced with the reduction fuel consumption. Also the cooling evaporation
systems of furnaces No 4 and 5 were dismantled and heat generation was stopped. Heat amount necessary
for customers supply is generated at NLMK CHPP. However, as is shown in Section B.2 this scenario is
not economically attractive. Therefore it is a not the most plausible scenario.
Conclusions
Scenario 1 is the only remaining plausible scenario and is therefore identified as the baseline.

JOINT IMPLEMENTATION PROJECT DESIGN DOCUMENT FORM - Version 01
Joint Implementation Supervisory Committee page 15
This template shall not be altered. It shall be completed without modifying/adding headings or logo, format or font.
Baseline emissions are elaborated in Sections D and E, as well as Annex 2 below.
The key data used to establish the baseline in tabular form is presented below.
Data/Parameter yi,sp1,
FC
Data unit 1000 m3
Description Amount of fossil fuel i (natural gas, blast furnace gas and coke even gas)
consumed in the heating furnaces
Time of
determination/monitoring
Monitored during the crediting period
Source of data (to be) use NLMK data
Value of data applied (for ex ante calculations/determinations)
-
Justification of the choice of
data or description of
measurement methods and
procedures (to be) applied
It is measured by standardized flow meters
OA/QC procedures (to be)
applied
It is ordinary procedure of NLMK. Please see Table D.2 for more detail
information
Any comment -
Data/Parameter yi,
NCV
Data unit GJ/1000 m3
Description Net calorific value of fossil fuel type i in year y
Time of
determination/monitoring
Monitored during the crediting period
Source of data (to be) use NLMK data (for blast furnace gas and coke even gas) and Fuel supplier
data (for natural gas)
Value of data applied (for ex ante calculations/determinations)
-
Justification of the choice of
data or description of
measurement methods and
procedures (to be) applied
Natural gas: Official natural gas certificate of fuel supplier
Blast furnace gas and coke even gas: It is calculated based on the gas
composition which is measured by gas analyzer
OA/QC procedures (to be)
applied
It is ordinary procedure of NLMK. Please see Table D.2 for more detail
information
Any comment -
Data/Parameter yfuel_i,
EF
Data unit tCO2/GJ
Description CO2 emission factor of fossil fuel type i in year y
Time of
determination/monitoring
Fixed ex-ante during determination
Source of data (to be) use Guidelines for National Greenhouse Gas Inventories, Volume 2:
Energy, Chapter 2: Stationary Combustion (corrected chapter as of
April 2007), IPCC, 2006
Value of data applied (for ex ante calculations/determinations)
Please see Table Anx.2.4 in Annex 2
Justification of the choice of
data or description of
-

JOINT IMPLEMENTATION PROJECT DESIGN DOCUMENT FORM - Version 01
Joint Implementation Supervisory Committee page 16
This template shall not be altered. It shall be completed without modifying/adding headings or logo, format or font.
measurement methods and
procedures (to be) applied
OA/QC procedures (to be)
applied
-
Any comment It includes the emission factor for natural gas (NG,y
EF )
Data/Parameter yPJ,sp1,
PS
Data unit Tonnes
Description Volume of steel is heated (steel output) in the furnaces at the HSRS in
year y;
Time of
determination/monitoring
Monitored during the crediting period
Source of data (to be) use NLMK data
Value of data applied (for ex ante calculations/determinations)
-
Justification of the choice of
data or description of
measurement methods and
procedures (to be) applied
It is measured by volume-to-mass conversion method.
OA/QC procedures (to be)
applied
It is ordinary procedure of NLMK. Please see Table D.2 for more detail
information
Any comment -
Data/Parameter sp1,BL
SFC
Data unit GJ/tonne of steel
Description Specific fuel consumption
Time of
determination/monitoring
Fixed ex-ante during determination
Source of data (to be) use NLMK records
Value of data applied (for ex ante calculations/determinations)
2.83
Justification of the choice of
data or description of
measurement methods and
procedures (to be) applied
This parameter is used for definition of the fuel consumption in
baseline and it was calculated based on historical data as average value
for 1997-l999.
OA/QC procedures (to be)
applied
-
Any comment
Data/Parameter yBOF,
EF
Data unit tCO2/tonne of steel
Description The default IPCC CO2 emission factor for Basic Oxygen Furnace in year
y
Time of
determination/monitoring
Fixed ex-ante during determination
Source of data (to be) use Guidelines for National Greenhouse Gas Inventories, Volume 3:
Industrial Processes and Product Use, Chapter 4: Metal Industry
Emissions, IPCC, 2006
Value of data applied (for ex ante calculations/determinations)
1.46

JOINT IMPLEMENTATION PROJECT DESIGN DOCUMENT FORM - Version 01
Joint Implementation Supervisory Committee page 17
This template shall not be altered. It shall be completed without modifying/adding headings or logo, format or font.
Justification of the choice of
data or description of
measurement methods and
procedures (to be) applied
OA/QC procedures (to be)
applied
It is ordinary procedure of NLMK. Please see Table D.2 for more detail
information
Any comment -
Data/Parameter sp1,BL
SWM
Data unit Tonne/tonne of steel
Description Specific waste of steel of the furnaces per tonne of steel is heated in the
furnaces at the HSGJ
Time of
determination/monitoring
Fixed ex-ante during determination
Source of data (to be) use NLMK records
Value of data applied (for ex ante calculations/determinations)
0.022
Justification of the choice of
data or description of
measurement methods and
procedures (to be) applied
This parameter is used for definition of the steel waste in baseline and
it was calculated based on historical data as average value for 1997-
l999.
OA/QC procedures (to be)
applied
-
Any comment
Data/Parameter sp1,PJ
WM
Data unit Tonnes
Description Volume of steel waste at the furnaces of HSRS in project in year y
Time of
determination/monitoring
Monitored during the crediting period
Source of data (to be) use NLMK data
Value of data applied (for ex ante calculations/determinations)
-
Justification of the choice of
data or description of
measurement methods and
procedures (to be) applied
It is measured by weight method
OA/QC procedures (to be)
applied
It is ordinary procedure of NLMK. Please see Table D.2 for more detail
information
Any comment -
Subproject 2. Commissioning the hydrogen plant based on steam reforming of natural gas technology There are two well-known technologies for hydrogen production commercially: Electrolysis of water; Steam reforming of natural gas.
Other technologies are used for hydrogen production in a small value or do not have any working installations and such installations can not consider as a plausible scenario.
Therefore the plausible future scenarios of subproject 2 are presented below:
Scenario 1: Continuation of a situation existing prior to the project;

JOINT IMPLEMENTATION PROJECT DESIGN DOCUMENT FORM - Version 01
Joint Implementation Supervisory Committee page 18
This template shall not be altered. It shall be completed without modifying/adding headings or logo, format or font.
Scenario 2: Commissioning the hydrogen plant based on steam reforming of natural gas technology.
These scenarios are described below in more detail.
1) Continuation of a situation existing prior to the project
Hydrogen is produced at the installations of two hydrogen stations by electrolysis of water. The electricity and heat (steam) are consumed for hydrogen production. This technology is very simple in operation, does not require big costs for routine and capital repairs and enables to produce hydrogen with a small amount of admixtures. Also in the non-stable situation at the metal market no additional investment is required for this scenario. Thus, scenario 1 is feasible and plausible.
2) Commissioning the hydrogen plant based on steam reforming of natural gas technology
The new plant of hydrogen production was commissioned in 2004. It is using the steam reforming of
natural gas technology for hydrogen production. The new installations of new plant partly replace the
hydrogen production at the two old hydrogen stations by electrolysis of water. It means that significant
less electricity is required for hydrogen production. However the old hydrogen stations are operated and
they produce some hydrogen if the amount of hydrogen from new installations is not enough. However, as
is shown in Section B.2 this scenario is not economically attractive. Therefore it is a not the most plausible
scenario.
Conclusions
Scenario 1 is the only remaining plausible scenario and is therefore identified as the baseline.
Baseline emissions are elaborated in Sections D and E, as well as Annex 2 below.
The key data used to establish the baseline in tabular form is presented below.
Data/Parameter y
PH
Data unit 1000 m3
Description Annual volume of hydrogen is generated at new hydrogen plant in the
year y
Time of
determination/monitoring
Monitored during the crediting period
Source of data (to be) use NLMK data
Value of data applied (for ex ante calculations/determinations)
-
Justification of the choice of
data or description of
measurement methods and
procedures (to be) applied
It is measured by standardized flow meters
OA/QC procedures (to be)
applied
It is ordinary procedure of NLMK. Please see Table D.2 for more detail
information
Any comment -
Data/Parameter yELEC,aver,
EF
Data unit tCO2/MWh
Description Average CO2 emission factor for electricity consumption

JOINT IMPLEMENTATION PROJECT DESIGN DOCUMENT FORM - Version 01
Joint Implementation Supervisory Committee page 19
This template shall not be altered. It shall be completed without modifying/adding headings or logo, format or font.
Time of
determination/monitoring
Monitored during the crediting period
Source of data (to be) use Calculation according to formulae 12
Value of data applied (for ex ante calculations/determinations)
-
Justification of the choice of
data or description of
measurement methods and
procedures (to be) applied
-
OA/QC procedures (to be)
applied
-
Any comment -
Data/Parameter ygrid
EF,
Data unit tCO2/MWh
Description CO2 emission factor for electricity consumption
Time of
determination/monitoring
Fixed ex-ante during determination
Source of data (to be) use Development of Grid GHG Emission Factors for Power Systems of
Russia (2008). This report was prepared by Carbon Investments Ltd. by
order of Carbon Trade & Finance SICAR S.A., and approved by
Accredited Independent Entity (AIE) Bureau Veritas Value of data applied (for ex ante calculations/determinations)
0.526
Justification of the choice of
data or description of
measurement methods and
procedures (to be) applied
-
OA/QC procedures (to be)
applied
-
Any comment -
Data/Parameter yCHPel
EF,_
Data unit tCO2/MWh
Description CO2 emission factor for electricity generation at NLMK CHPP in project
for the year y
Time of
determination/monitoring
Monitored during the crediting period
Source of data (to be) use Calculation according to formulae 13
Value of data applied (for ex ante calculations/determinations)
-
Justification of the choice of
data or description of
measurement methods and
procedures (to be) applied
-
OA/QC procedures (to be)
applied
-
Any comment -
Data/Parameter ,BLsp
SEC2

JOINT IMPLEMENTATION PROJECT DESIGN DOCUMENT FORM - Version 01
Joint Implementation Supervisory Committee page 20
This template shall not be altered. It shall be completed without modifying/adding headings or logo, format or font.
Data unit MWh/1000 m3
Description Specific electricity consumption per 1000 m3 of hydrogen for electrolysis
installations
Time of
determination/monitoring
Fixed ex-ante during determination
Source of data (to be) use NLMK records
Value of data applied (for ex ante calculations/determinations)
5.48
Justification of the choice of
data or description of
measurement methods and
procedures (to be) applied
This parameter is used for definition of the electricity consumption in
baseline and it was calculated based on historical data as average value
for 2001-2003.
OA/QC procedures (to be)
applied
-
Any comment Please see Table Anx.2.2 in Annex 2
Data/Parameter hg,y
EF
Data unit tCO2/GJ
Description Average CO2 emission factor of heat generation at NLMK CHPP in year
y
Time of
determination/monitoring
Monitored during the crediting period
Source of data (to be) use Calculation according to formulae 6
Value of data applied (for ex ante calculations/determinations)
-
Justification of the choice of
data or description of
measurement methods and
procedures (to be) applied
-
OA/QC procedures (to be)
applied
-
Any comment -
Data/Parameter ,BLsp
SSC2
Data unit GJ/1000 m3
Description Specific steam consumption per 1000 m3 of hydrogen for electrolysis
installations
Time of
determination/monitoring
Fixed ex-ante during determination
Source of data (to be) use NLMK records
Value of data applied (for ex ante calculations/determinations)
3.93
Justification of the choice of
data or description of
measurement methods and
procedures (to be) applied
This parameter is used for definition of the steam consumption in
baseline and it was calculated based on historical data as average value
for 2001-2003.
OA/QC procedures (to be)
applied
-
Any comment Please see Table Anx.2.2 in Annex 2

JOINT IMPLEMENTATION PROJECT DESIGN DOCUMENT FORM - Version 01
Joint Implementation Supervisory Committee page 21
This template shall not be altered. It shall be completed without modifying/adding headings or logo, format or font.
B.2. Description of how the anthropogenic emissions of greenhouse gases by sources are reduced
below those that would have occurred in the absence of the JI project:
The following step-wise approach is used to demonstrate that the project provides reductions in emissions
by sources that are additional to any that would otherwise occur:
Step 1. Indication and description of the approach applied
As suggested by Paragraph 2 (c) of the Annex 1 of the Guidance the most recent version of the "Tool for
the demonstration and assessment of additionality" approved by the CDM Executive Board is used to
demonstrate additionality. At the time of this document completion the most recent version of the "Tool
for the demonstration and assessment of additionality" approved by the CDM Executive Board is version
05.211
and it is used to demonstrate additionality of the project activity.
Step 2. Application of the approach chosen
The following steps are taken as per "Tool for the demonstration and assessment of additionality" version
05.2 (hereinafter referred to as Tool) for each of subprojects.
Step 1: Identification of alternatives to the project activity consistent with current laws and regulations
The realistic and credible alternatives to the project activity are defined through the following Sub-steps:
Sub-step 1a: Define alternatives to the project activity
The following alternatives to the subproject 1 and 2 were considered before project implementation:
Subproject 1. Reconstruction of heating furnaces No 4 and 5 at the Hot Sheet-Rolling Shop
Alternative 1: Continuation of a situation existing prior to the project. The heating furnaces No 1-5 are
maintained with routine and capital repairs. The fuel of the furnaces is a mixture of natural, blast furnace
and coke oven gases. Some heat of exhaust gases after the furnaces was utilized in heat-recovery boilers.
Also the metal structure of furnaces is cooled by the use of the cooling evaporation system with useful
heat output (steam with 1.3 MPa of pressure) into the heating system of NLMK. However the
consumption of this steam is less than generation, especially in a period from the spring to the autumn and
the some amount of steam is deflated into the atmosphere. NLMK is implementing energy saving program
from 2000. As result, heat consumption (including steam with 1.3 MPa of pressure) decrease. Therefore
the amount of this steam is deflated into the atmosphere more and more.
Alternative 2: The proposed project activity undertaken without being registered as a JI project activity.
The completed reconstruction of furnaces No 4 and 5 as described in Section A.4.2 is realized. Each of
reconstructed furnaces can heat steel with less fuel consumption. Also waste of steel is decreased after the
reconstruction. It means that for the steel output (steel volume after heating) is required less BOF steel
volume and, respectively, less expenditure of energy in comparison with situation before the
reconstruction. The fuel of the furnaces is a mixture of natural, blast furnace and coke oven gases. Some
heat of exhaust gases after the furnaces was utilized in heat-recovery boilers. The heat output from heat-
recovery boilers was reduced with the reduction fuel consumption. Also the cooling evaporation systems
of furnaces No 4 and 5 were dismantled and heat generation was stopped. Heat amount necessary for
customers supply is generated at NLMK CHPP.
11 http://cdm.unfccc.int/methodologies/PAmethodologies/tools/am-tool-01-v5.2.pdf

JOINT IMPLEMENTATION PROJECT DESIGN DOCUMENT FORM - Version 01
Joint Implementation Supervisory Committee page 22
This template shall not be altered. It shall be completed without modifying/adding headings or logo, format or font.
Subproject 2. Commissioning the hydrogen plant based on steam reforming of natural gas technology
Alternative 1: Continuation of a situation existing prior to the project. Hydrogen is produced at the installations of two hydrogen stations by electrolysis of water. These installations will be maintained with routine and capital repairs and operated until 2013 at least. The electricity and heat (steam) are consumed for hydrogen production;
Alternative 2: The proposed project activity undertaken without being registered as a JI project activity.
The new plant of hydrogen production was commissioned in 2005. It is produced by «Haldor Topsoe»
company and is using the steam reforming of natural gas technology for hydrogen production. However
the old hydrogen stations are operated and they produce some hydrogen if the amount of hydrogen from
new installations is not enough.
Outcome of Step 1a: The realistic and credible alternatives to the project (subprojects) activity were
identified.
Sub-step 1b: Consistency with mandatory laws and regulations
All of the alternatives identified above are consistent with mandatory laws and regulations of the Russian
Federation.
Outcome of Step 1b: The realistic and credible alternatives to the project (subprojects) activities are
identified in compliance with mandatory legislation and regulations taking into account the enforcement in
the Russian Federation.
Step 2. Investment Analysis
The purpose of the investment analysis in the context of additionality is to determine whether the proposed
project activity is not:
a) The most economically or financially attractive; or
b) Economically or financially feasible, without the revenue from the sale of emission reductions.
Sub-step 2a: Determine appropriate analysis method
In principle, there are three methods applicable for an investment analysis: simple cost analysis,
investment comparison analysis and benchmark analysis.
A simple cost analysis (Option I) shall be applied if the proposed JI project and the alternatives identified
in step 1 generate no financial or economic benefits other than JI related income. The proposed JI project
results in additional sales revenues due to saleable steel volume increase and in costs reduction. Thus, this
analysis method is not applicable.
An investment comparison analysis (Option II) compares suitable financial indicators for realistic and
credible investment alternatives. As only plausible alternative represents the continuation of existing
situation, a benchmark analysis (Option III) is applied.
Sub-step 2b: Option III. Apply benchmark analysis
For proposed project the option of substep 2b 6a of the Tool was used for benchmark definition.
From investor’s point of view the expected return will consist of the risk-free rate increased by the suitable
risk premiums. The risk-free rate taken for this assessment is the German T-bills (governmental bonds)

JOINT IMPLEMENTATION PROJECT DESIGN DOCUMENT FORM - Version 01
Joint Implementation Supervisory Committee page 23
This template shall not be altered. It shall be completed without modifying/adding headings or logo, format or font.
rate12
cleared inflation13
.at the time of investment decision being made. And the suitable risk premiums
will include:
Systematic market risk. This portion of risk relates to the variability in returns from the equity
investments and uncertainty associated with that14. The rate used in the assessment reflects investment
into a portfolio of steel companies15
. This risk premium is the minimum possible expected return for
the investor that holds a portfolio of existing steel businesses in a developed economy. This risk
component can be seen as the basic risk-free rate for the investor in to equity market. Also this risk
component can be interpreted as the “risks connected with project participants” as it addresses the
issues of being involved into the project realization with different parties etc. while on the other hand
there is an option of investing into considerably less risky environment of US stock market. It is
conservative assumption for proposed project.
Country risk16
. This portion of the risk reflects unique risks of investment being made in Russia. The
additional return (premium) is required to cover political uncertainty, ownership risks, profit
repatriation risk etc.
Project specific risk. This risk component can be interpreted as the risk of uncertainty in getting
projected cash inflows from the project. The data from the “Methodological recommendations on
evaluation of investment projects efficiency” approved by Ministry of Economy of the RF, Ministry of
Finance of the RF, State Committee of the RF on Construction, Architecture and Housing Policy of
the RF 21.06.1999 N ВК 477” were taken. Value of this risk is 4%. It is average value of the risk for
investment to the production development based on well-known technology (Table 11.1 of the
Methodological recommendations).
The result of IRR benchmark estimation is present in Table B.2.1.
Table B.2.1. Result of IRR benchmark estimation
Indicator Value for 2002
German interest rate 4,46%
Inflation 1,40%
Risk-free rate 3,10%
Systematic market risk 4,07%
Country risk Russia 6,00%
Project specific risk 4,00%
IRR benchmark 17,18%
If the proposed project (not being implemented as a JI project) has a less favourable indicator, i.e. a lower
IRR, than this benchmark, then the project cannot be considered as financially attractive.
Sub-step 2c: Calculation and comparison of financial indicators
The financial analysis refers to the time of investment decision-making.
12 European Central Bank website, Long-Term Interest Rate of Germany, October 2002
13 European Commission website, Eurostat , Average Inflation Rate of Germany in 2002
14 Principles of Corporate Finance 7th edition, Richard A. Brealey, Stewart C. Myers, McGraw-Hill Higher Education,
2003 – p. 168
15 New York University, Leonard N. Sterm School of Business, Costs of Capital by Industry Sector in 2002
16 New York University, Leonard N. Sterm School of Business, Risk Premiums for Other Markets in 2002

JOINT IMPLEMENTATION PROJECT DESIGN DOCUMENT FORM - Version 01
Joint Implementation Supervisory Committee page 24
This template shall not be altered. It shall be completed without modifying/adding headings or logo, format or font.
Subproject 1. Reconstruction of heating furnaces No 4 and 5 at the Hot Sheet-Rolling Shop
The following assumptions have been used based on the information provided by the enterprise and from
other sources:
1. Investment decision: June 2002, commissioning date: June 2004 for furnace No 5 and May 2008 for
furnace No 4;
2. Bank of Russia exchange rate is 26.61 RUR/EUR;
3. The project investment cost accounts for of approximately EUR 30.8 million and 51.0 million
(excluding VAT) for furnaces No 5 and 4, respectively;
4. The project lifetime is around 20 years (lifetime of the main equipment);
5. Steel output, waste of steel, fuel consumption and etc. at the HSRS are defined in line with the actual
parameters of shop (for situation before reconstruction) and NLMK plans (for situation after
reconstruction);
6. Total fuel consumption is natural gas consumption;
7. Cost of BOF steel production is equal to NLMK internal cost;
8. The additional volume of steam (heat) is generated at NLMK CHPP;
9. Heat tariff is equal to NLMK internal cost.
The subproject 1 cash flow focuses on revenue flows generated by fuel savings and BOF steel production
reduction and on cost flows generated by steam generation reduction in comparison with baseline of
subproject 1.
The project’s financial indicators are presented in the Table B.2.2 below.
Table B.2.2. Financial indicators of the subproject 1
Scenario IRR (%)
Base case 2.50%
Cash flow analysis shows IRR of 2.50%. It is less than the benchmark determined of 17.18%. Hence, the
project cannot be considered as a financially attractive course of action.
Subproject 2. Commissioning the hydrogen plant based on steam reforming of natural gas technology
The following assumptions have been used based on the information provided by the enterprise and from
other sources:
1. Investment decision: October 2002, commissioning date: December 2004;
2. Bank of Russia exchange rate is 31.30 RUR/EUR;
3. The project investment cost accounts for of approximately EUR 16.7 million (excluding VAT);
4. The project lifetime is around 20 years (lifetime of the main equipment);
5. Production of hydrogen, natural gas, electricity consumption and etc. are defined in line with the
actual parameters and NLMK plans;
6. The steam consumed by old hydrogen station is generated at NLMK CHPP;
7. Heat tariff is equal to NLMK internal cost;
8. The electricity tariff is defined as weighted average tariff which takes into tariff of OJSC
“Lipetskenergo” (energy company) and NLMK internal cost of electricity generation NLMK CHPP.
The subproject 1 cash flow focuses on revenue flows generated by electricity and steam savings and on
cost flows generated by natural gas buying in comparison with baseline of subproject 2.
The project’s financial indicators are presented in the Table B.2.3 below.

JOINT IMPLEMENTATION PROJECT DESIGN DOCUMENT FORM - Version 01
Joint Implementation Supervisory Committee page 25
This template shall not be altered. It shall be completed without modifying/adding headings or logo, format or font.
Table B.2.3. Financial indicators of the subproject 2
Scenario IRR (%)
Base case 13.35%
Cash flow analysis shows IRR of 13.35%. It is less than the benchmark determined of 17.18%. Hence, the
project cannot be considered as a financially attractive course of action.
Sub-step 2d: Sensitivity analysis
A sensitivity analysis should be made to show whether the conclusion regarding the financial/economic
attractiveness is robust to reasonable variations in the critical assumptions, as it can be seen by application
of the Methodological Tool “Tool for the demonstration and assessment of additionality” (Version 05.2).
The following some key indicators were considered in the sensitivity analysis: investment cost, steel prices
natural gas and electricity and etc. The other cost components account for less than 20 % of total or
operation cost and therefore are not considered in the sensitivity analysis. In line with the Additionality
Tool the sensitivity analysis should be undertaken within the corridor of ±10 % for the key indicators.
Sensitivity analysis was made for each of subprojects.
Subproject 1. Reconstruction of heating furnaces No 4 and 5 at the Hot Sheet-Rolling Shop
Cost from steam generation are less 20% of total revenues and in line with the Additionality Tool the
sensitivity analysis is not made for this component. Conditions of scenarios are presented below.
Scenario 1 considers a 10% investment cost growth. Scenario 1 shows that this assumption worsened the
cash flow performance due to significant cost increase.
Scenario 2 is based on the assumption of a 10% investment cost decrease that improves cash flow.
Scenario 3 and 4 implies natural gas price raise/reduce by 10%.
Scenario 5 and 6 implies BOF steel production cost raise/reduce by 10%.
A summary of the results is presented in the Table B.2.4 below.
Table B.2.4: Sensitivity analysis (summary)
Scenario IRR
(%)
Scenario 1 1.32%
Scenario 2 3.88%
Scenario 3 3.18%
Scenario 4 1.81%
Scenario 5 3.28%
Scenario 6 1.70%

JOINT IMPLEMENTATION PROJECT DESIGN DOCUMENT FORM - Version 01
Joint Implementation Supervisory Committee page 26
This template shall not be altered. It shall be completed without modifying/adding headings or logo, format or font.
Hence, the sensitivity analysis consistently supports (for a realistic range of assumptions) the conclusion
that the project is unlikely to be financially/economically attractive.
Subproject 2. Commissioning the hydrogen plant based on steam reforming of natural gas technology
Revenues from steam cost savings and cost from natural gas buying are less 20% of total revenues and in
line with the Additionality Tool the sensitivity analysis is not made for this component. Conditions of
scenarios for sensitivity analysis are presented below.
Scenario 1 and 2 implies investment cost changes ± 10, respectively.
Scenario 3 considers a 10% electricity tariff growth.
Scenario 4 is based on the assumption of a 10% electricity tariff decrease
A summary of the results is presented in the Table B.2.5 below.
Table B.2.5: Sensitivity analysis (summary)
Scenario IRR
(%)
Scenario 1 11.80%
Scenario 2 15.20%
Scenario 3 15.11%
Scenario 4 11.54%
Hence, the sensitivity analysis consistently supports (for a realistic range of assumptions) the conclusion
that the project is unlikely to be financially/economically attractive.
Outcome of Step 2: After the sensitivity analysis it is concluded that the proposed JI project activity,
including subprojects, is unlikely to be financially/economically attractive.
Step 3: Barrier analysis
In line with the Additionality Tool no barrier analysis is needed when investment analysis is applied.
Step 4: Common practice analysis
Sub-step 4a: Analyze other activities similar to the proposed project activity:
Subproject 1. Reconstruction of heating furnaces No 4 and 5 at the Hot Sheet-Rolling Shop
In 2004-2005 Russian metallurgical company “Seversteel” reconstructed two heating furnaces. However
these furnaces have less capacity (120 tonnes of steel per hour) than the heating furnaces at NLMK (320
tonnes of steel per hour). Also the proposed subproject takes into account the individual feature of heating
furnaces at NLMK: reconstructed furnaces use new modern energy-saving hot load/unload of slabs
technology.
Therefore this subproject can not represent a widely observed practice in the area considered.
Subproject 2. Commissioning the hydrogen plant based on steam reforming of natural gas technology
Usually in Russia hydrogen at metallurgical plants is produced at hydrogen stations by electrolysis of
water. Proposed subproject is first which was implemented at a metallurgical plant. Therefore this
subproject can not represent a widely observed practice in the area considered.
JOINT IMPLEMENTATION PROJECT DESIGN DOCUMENT FORM - Version 01
Joint Implementation Supervisory Committee page 27
This template shall not be altered. It shall be completed without modifying/adding headings or logo, format or font.
Sub-step 4b: Discuss any similar Options that are occurring:
It is required to follow Sub-step 4b according to of the Tool when this project is widely observed and
commonly carried out. The proposed JI project does not represent a widely observed practice in the area
considered (see Sub-step 4a). So, this sub-step is not applied.
Sub-steps 4a and 4b are satisfied, i.e. similar activities cannot be widely observed. Thus proposed project
activity, including subprojects is not a common practice.
Conclusion: Thus the additionality analysis demonstrates that project emission reductions are additional
to any that would otherwise occur.
Step 3. Provision of additionality proofs
Supporting documents including the calculation spreadsheets and other proofs will be made available to
the accredited independent entity.
B.3. Description of how the definition of the project boundary is applied to the project:
The subproject boundary shall encompass all anthropogenic emissions by sources of GHGs which are:
Under the control of the project participants;
Reasonably attributable to the project;
Significant, i.e., as a rule of thumb, would by each source account on average per year over the
crediting period for more than 1 per cent of the annual average anthropogenic emissions by sources of
GHGs, or exceed an amount of 2,000 tonnes of CO2 equivalent, whichever is lower.
N2O and CH4 emissions
GHG emissions of the proposed subprojects are associated with fuels consumption during the steel
heating, additional heat generation, additional BOF steel production (for subproject 1) and electricity
consumption, natural gas consumption and fuels consumption for heat generation (for subproject 2). All of
these processes are related to fuels combustion. For stationary fuel combustion the CO2 emission is more
than 99.9% and, respectively, N2O and CH4 emissions are less than 0.1%. For example, in accordance with
the IPCC Guidelines for National Greenhouse Gas Inventories17
for natural gas the default CO2 emission
factor is 56,100 kgCO2/TJ, the default N2O emission factor is 0.1 kgN2O/TJ and the default CH4 emission
factor is 1.0 kgCH4/TJ. Global Warming Potential of N2O is 310 and CH4 is 21. Then the share of total
N2O and CH4 emissions is: 100%×(21×1.0+310×0.1)/(56,100+21×1.0+310×0.1) = 0.093%. Therefore
N2O and CH4 emissions are not taken into account for baseline and project emissions calculation.
Leakages
The potential leakages are associated with:
Fugitive CH4 emissions associated with fuel extraction, processing, transportation and distribution of
natural gas;
Transmission and distribution of blast furnace gas at NLMK;
Technical transmission and distribution losses of electricity.
Subproject 1
For subproject 1 fuel consumption (including amount of fuel for additional heat generation) in the project
scenario is reduced by 25% in comparison with the baseline scenario. Therefore the fugitive CH4 emission
17 Guidelines for National Greenhouse Gas Inventories, Volume 2: Energy, Chapter 2: Stationary Combustion, Table
2.2, IPCC, 2006

JOINT IMPLEMENTATION PROJECT DESIGN DOCUMENT FORM - Version 01
Joint Implementation Supervisory Committee page 28
This template shall not be altered. It shall be completed without modifying/adding headings or logo, format or font.
(for natural gas extraction, processing, transportation and distribution) and the losses of blast furnace gas
at NLMK are decreased and therefore leakages are not taken into account. This is conservative.
Subproject 2
For subproject 2, most part of leakages in project scenario is associated with fugitive CH4 emission (for
natural gas consumption) and losses of electricity.
Annual natural gas consumption is approximately 690,000 GJ. Default emission factors for fugitive CH4
emission is 961 tCH4/PJ (for Eastern Europe and former USSR)18
and the Global Warming Potential of
CH4 is 2119
. And volume of emission is 21×650,000×961/106 = 13,924 tCO2-eq.
Annual electricity consumption in project scenario is approximately 5,300 MWh. In Russian Federation
the electricity losses are 11-13%20
. The emission factor for electricity consumption is
0.526 tCO2/MWh (please see Annex 2 of the PDD). And volume of emission is 0.526×5,300×11/100 =
307 tCO2.
In project scenario the total leakages are 14,231 tCO2-eq.
The most part of leakages in baseline scenario is associated with losses of electricity. Annual electricity
consumption in baseline scenario is approximately 243,000 MWh. And leakages amount to
0.526×243,000×11/100 = 14,059 tCO2.
Other leakages are fugitive CH4 emission (natural gas consumption for heat generation). Annual steam
(heat) consumption in baseline at electrolysis installations is about 170,000 GJ. And natural gas
consumption for heat generation is 170,000×0.9 (heat generation efficiency)×0,22 (part of natural gas in
fuel balance at NLMK CHPP) = 42,558 GJ. Leakages are associated with fugitive CH4 emission is
21×42,558×961/106 = 858 tCO2-eq.
Therefore the leakages in project scenario are less than in baseline scenario for both subprojects 1 and 2
and these emissions have not been taken into account for simplicity and conservatism.
Project boundary
Subproject 1. Reconstruction of heating furnaces No 4 and 5 at the Hot Sheet-Rolling Shop
An overview of all emission sources in the steel rolling process of subproject 1 is given in Table B.3.1
below.
18 Approved baseline methodology AM0029 “Baseline Methodology for Grid Connected Electricity Generation Plants
using Natural Gas”, Version 03, CDM – Executive Board, 2008
19 IPCC AR4. 2007a. The Physical Science Basis. Working Group I Report of the intergovernmental Panel on Climate
Change..Editors: Solomon, S., D. Qin, M. Manning, Z. Chen, M. Marquis, K.B. Averyt, M. Tignor and H.L. Miller .
Cambridg University Press, Cambridge, United Kingdom and New York, NY, USA.
20 http://www.abok.ru/for_spec/articles/14/2833/tb.htm

JOINT IMPLEMENTATION PROJECT DESIGN DOCUMENT FORM - Version 01
Joint Implementation Supervisory Committee page 29
This template shall not be altered. It shall be completed without modifying/adding headings or logo, format or font.
Table B.3.1: Sources of emissions
№ Source Gas Included/
excluded Justification/Explanation
1 Fuel consumption during
the steel heating CO2 Included The fossil fuel combustion will decrease.
2
Fuel consumption
associated with additional
heat generation
CO2 Included
There is not in baseline;
In project it is generated by NLMK
CHPP
3
Emission associated with
additional BOF steel
production
CO2 Included
There is not in project;
In baseline it is produced at NLMK
additionally.
The emission sources within the project boundary are also shown in Figure B.3.1 below.
Figure B.3.1: Sources of emissions and project boundary
Source: Data provided by NLMK
Subproject 2. Commissioning the hydrogen plant based on steam reforming of natural gas technology
An overview of all emission sources of subproject 2 is given in Table B.3.2 below.

JOINT IMPLEMENTATION PROJECT DESIGN DOCUMENT FORM - Version 01
Joint Implementation Supervisory Committee page 30
This template shall not be altered. It shall be completed without modifying/adding headings or logo, format or font.
Table B.3.2: Sources of emissions
№ Source Gas Included/
excluded Justification/Explanation
1 Electricity consumption CO2 Included The electricity consumption will
decrease.
2
Fuel consumption
associated with heat
generation
CO2 Included
There is not in project;
In baseline it is generated by NLMK
CHPP.
3 Natural gas consumption CO2 Included There is in project only, not in baseline.
The emission sources within the project boundary are also shown in Figure B.3.2 below.
Figure B.3.2: Sources of emissions and project boundary
Source: Data provided by NLMK
Please see Sections D. and E. for detailed data on the emissions within the project boundary.
B.4. Further baseline information, including the date of baseline setting and the name(s) of the
person(s)/entity(ies) setting the baseline:
Date of completion of the baseline study: 09/07/2010
Global Carbon BV.
Global Carbon BV is a project participant. The contact information is presented in Annex 1.

JOINT IMPLEMENTATION PROJECT DESIGN DOCUMENT FORM - Version 01
Joint Implementation Supervisory Committee page 31
This template shall not be altered. It shall be completed without modifying/adding headings or logo, format or font.
SECTION C. Duration of the project / crediting period
C.1. Starting date of the project:
The proposed JI project consists of two subprojects. Equipment for these subprojects will be installed and
commissioned in the following order:
Subproject 1: From June 2002 to May 2008;
Subproject 2: From October 2002 to December 2004;
Therefore the starting date of the project is June 2002.
C.2. Expected operational lifetime of the project:
For all proposed measures the lifetime of equipment will be at least 20 years. Thus operational lifetime of
the project will be 20 years or 240 months.
C.3. Length of the crediting period:
Start of crediting period: 01/01/2008.
Length of crediting period: 5 years or 60 months.
Emission reductions generated after the crediting period may be used in accordance with an appropriate
mechanism under the UNFCCC.
JOINT IMPLEMENTATION PROJECT DESIGN DOCUMENT FORM - Version 01
Joint Implementation Supervisory Committee page 32
This template shall not be altered. It shall be completed without modifying/adding headings or logo, format or font.
SECTION D. Monitoring plan
D.1. Description of monitoring plan chosen:
In this project a JI specific approach regarding monitoring is used. As elaborated in Section B.3, the project activity affects the emissions related to the fuel
combustion, electricity consumption and heat generation and consumption. To establish the baseline emissions and to monitor the project emissions, these
emissions will be monitored.
The following assumptions for calculation of both baseline and project emissions for each of subprojects were used:
Identical for all of subprojects:
The lifetime of equipment extends to 2020;
Amounts of fuel consumption for electricity and heat generation at NLMK CHPP are calculated in accordance with national rules and based on the
measured total fuel consumption at NLMK CHPP.
Individual for each of subprojects: Subproject 1. Reconstruction of heating furnaces No 4 and 5 at the Hot Sheet-Rolling Shop
Steel demand in the market is not influenced by the project (i.e. baseline steel output = project steel output);
The baseline specific fuel consumption, specific heat generation and specific waste of steel are set ex-ante for the length of the crediting period;
The default IPCC CO2 emission factor for Basic Oxygen Furnace is used because the emissions associated with additional BOF steel production is 5% of total
baseline emission only and this emission factor is less than the emission factor for Basic Oxygen Furnace at NLMK. It is conservative.
Subproject 2. Commissioning the hydrogen plant based on steam reforming of natural gas technology
Hydrogen demand at NLMK is not influenced by the project (i.e. baseline hydrogen production = project hydrogen production);
The baseline specific electricity consumption for electrolysis installations is set ex-ante for the length of the crediting period.
General remarks:
Social indicators such as number of people employed, safety records, training records, etc, will be available to the Verifier if required;
Environmental indicators such as NOx and other will be available to the Verifier if required;
Monitored data required for verification and issuance will be kept for two years after the end of the crediting period or the last issuance of ERUs.
For the greenhouse gas emissions only the CO2 emissions are taken into account. See section B.3.

JOINT IMPLEMENTATION PROJECT DESIGN DOCUMENT FORM - Version 01
Joint Implementation Supervisory Committee page 33
This template shall not be altered. It shall be completed without modifying/adding headings or logo, format or font.
D.1.1. Option 1 – Monitoring of the emissions in the project scenario and the baseline scenario:
D.1.1.1. Data to be collected in order to monitor emissions from the project, and how these data will be archived: ID number
(Please use
numbers to ease
cross-
referencing to
D.2.)
Data variable Source of data Data unit Measured (m),
calculated (c),
estimated (e)
Recording
frequency
Proportion of
data to be
monitored
How will the
data be
archived?
(electronic/
paper)
Comment
P1 yPE Calculated under
project activity tCO2 C Annually 100% Electronic -
P2 ysp1,PE Calculated under
project activity tCO2 C Annually 100% Electronic -
P3 ysp2,PE Calculated under
project activity tCO2 C Annually 100% Electronic -
P4 y sp1_f,PE Calculated under
project activity tCO2 C Annually 100% Electronic -
P5 yi,sp1,FC Gas flow meter
reading m
3 M Continuously 100% Electronic -
P6 yi,NCV Local estimated
or fuel supplier GJ/1000 m
3 M Monthly 100% Electronic
NCV of fuel is
estimated
continuously (it
is calculated
based on fuel
composition) at
NLMK but NCV
of natural gas is
provided by
supplier every
month
P7 yfuel_i,EF IPCC tCO2/GJ E Fixed ex ante 100% Electronic
Guidelines for
National
Greenhouse Gas
Inventories,
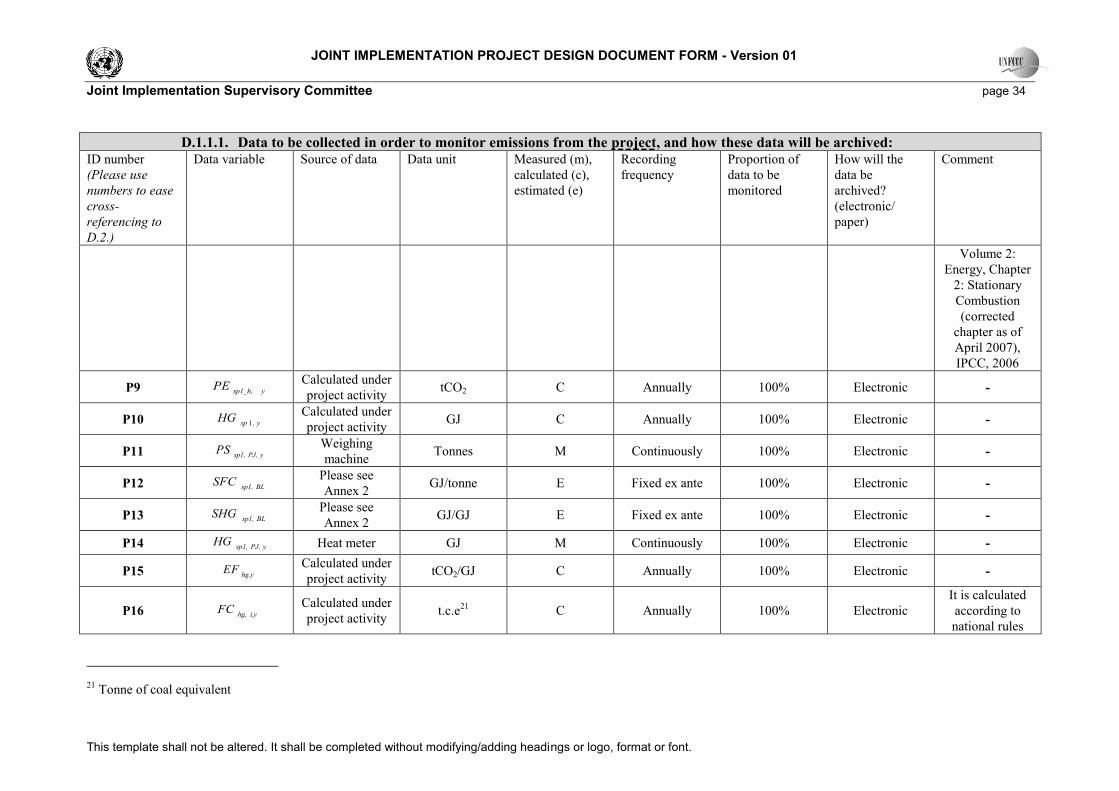
JOINT IMPLEMENTATION PROJECT DESIGN DOCUMENT FORM - Version 01
Joint Implementation Supervisory Committee page 34
This template shall not be altered. It shall be completed without modifying/adding headings or logo, format or font.
D.1.1.1. Data to be collected in order to monitor emissions from the project, and how these data will be archived: ID number
(Please use
numbers to ease
cross-
referencing to
D.2.)
Data variable Source of data Data unit Measured (m),
calculated (c),
estimated (e)
Recording
frequency
Proportion of
data to be
monitored
How will the
data be
archived?
(electronic/
paper)
Comment
Volume 2:
Energy, Chapter
2: Stationary
Combustion
(corrected
chapter as of
April 2007),
IPCC, 2006
P9 y sp1_h,PE Calculated under
project activity tCO2 C Annually 100% Electronic -
P10 , yspHG
1 Calculated under
project activity GJ C Annually 100% Electronic -
P11 yPJ,sp1,PS Weighing
machine Tonnes M Continuously 100% Electronic -
P12 BLsp1,SFC Please see
Annex 2 GJ/tonne E Fixed ex ante 100% Electronic -
P13 BLsp1,SHG Please see
Annex 2 GJ/GJ E Fixed ex ante 100% Electronic -
P14 yPJ,sp1,HG Heat meter GJ M Continuously 100% Electronic -
P15 hg,yEF
Calculated under
project activity tCO2/GJ C Annually 100% Electronic -
P16 hg, i,yFC
Calculated under
project activity t.c.e
21 C Annually 100% Electronic
It is calculated
according to
national rules
21 Tonne of coal equivalent
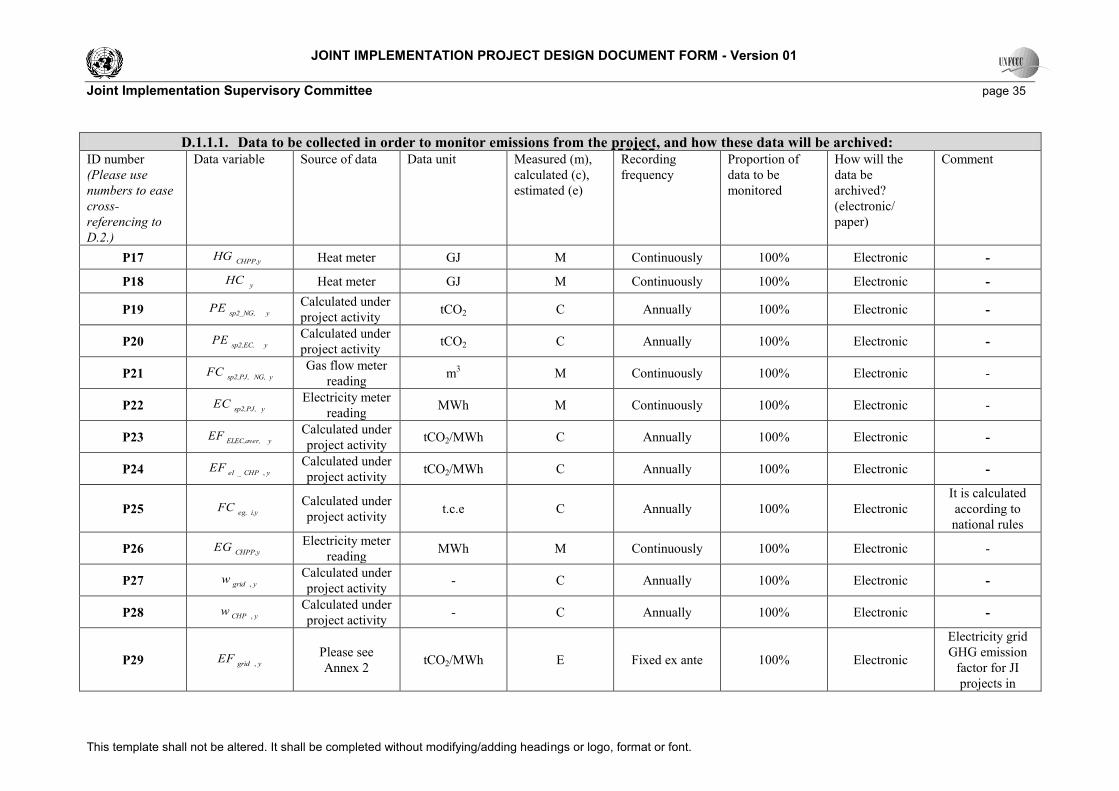
JOINT IMPLEMENTATION PROJECT DESIGN DOCUMENT FORM - Version 01
Joint Implementation Supervisory Committee page 35
This template shall not be altered. It shall be completed without modifying/adding headings or logo, format or font.
D.1.1.1. Data to be collected in order to monitor emissions from the project, and how these data will be archived: ID number
(Please use
numbers to ease
cross-
referencing to
D.2.)
Data variable Source of data Data unit Measured (m),
calculated (c),
estimated (e)
Recording
frequency
Proportion of
data to be
monitored
How will the
data be
archived?
(electronic/
paper)
Comment
P17 CHPP,yHG
Heat meter GJ M Continuously 100% Electronic -
P18 yHC
Heat meter GJ M Continuously 100% Electronic -
P19 y sp2_NG,PE Calculated under
project activity tCO2 C Annually 100% Electronic -
P20 y sp2,EC,PE Calculated under
project activity tCO2 C Annually 100% Electronic -
P21 yNG,sp2,PJ,FC
Gas flow meter
reading m
3 M Continuously 100% Electronic -
P22 ysp2,PJ,EC
Electricity meter
reading MWh M Continuously 100% Electronic -
P23 yELEC,aver,EF
Calculated under
project activity tCO2/MWh C Annually 100% Electronic -
P24 yCHPelEF
,_ Calculated under
project activity tCO2/MWh C Annually 100% Electronic -
P25 eg, i,yFC
Calculated under
project activity t.c.e C Annually 100% Electronic
It is calculated
according to
national rules
P26 CHPP,yEG
Electricity meter
reading MWh M Continuously 100% Electronic -
P27 ygridw
, Calculated under
project activity - C Annually 100% Electronic -
P28 yCHPw
, Calculated under
project activity - C Annually 100% Electronic -
P29 ygridEF
, Please see
Annex 2 tCO2/MWh E Fixed ex ante 100% Electronic
Electricity grid
GHG emission
factor for JI
projects in

JOINT IMPLEMENTATION PROJECT DESIGN DOCUMENT FORM - Version 01
Joint Implementation Supervisory Committee page 36
This template shall not be altered. It shall be completed without modifying/adding headings or logo, format or font.
D.1.1.1. Data to be collected in order to monitor emissions from the project, and how these data will be archived: ID number
(Please use
numbers to ease
cross-
referencing to
D.2.)
Data variable Source of data Data unit Measured (m),
calculated (c),
estimated (e)
Recording
frequency
Proportion of
data to be
monitored
How will the
data be
archived?
(electronic/
paper)
Comment
Russian
Regional Energy
System “Centre”.
D.1.1.2. Description of formulae used to estimate project emissions (for each gas, source etc.; emissions in units of CO2 equivalent):
The annual project emissions (y
PE ) are calculated as follows:
2
i
spi,yyPEPE
(1)
Where:
yPE - are the annual project emissions in the year y, (tCO2);
yspi,PE - are the annual project emissions from subprojects 1 and 2 in the year y, (tCO2);
The annual project emissions from subproject 1 are:
y sp1_h,y sp1_f,ysp1,PEPEPE
(2)
Where:
y sp1_f,PE - are the annual subproject 1 emissions associated with fuel combustion in the furnaces in the year y, (tCO2);
y sp1_h,PE - are the annual subproject 1 emissions associated with additional heat generated at the NLMK CHPP in project scenario in the year y,
(tCO2);
y sp1_f,PE is calculated as follows:
i
fuel_i,yi,y, i,ysp_f, yspEFNCVFCPE
11 (3)

JOINT IMPLEMENTATION PROJECT DESIGN DOCUMENT FORM - Version 01
Joint Implementation Supervisory Committee page 37
This template shall not be altered. It shall be completed without modifying/adding headings or logo, format or font.
Where:
yi,sp1,FC - is the total volume of fuel type i combusted in the furnaces at the HSRS in year y (m
3);
yi,NCV - is the average net calorific value per volume unit of fuel type i in the year y (GJ/1000 m
3);
yfuel_i,EF - is the default IPCC CO2 emission factor per unit of energy of fuel i in year y (tCO2/GJ).
yi,NCV is obtained as:
i
yi, sp1,
m
ym,i, sp1,mi,yi,FC)/FC(NCVNCV
(4)
Where:
i,mNCV
- is the net calorific value per volume unit of fuel type i in the month m in year y (GJ/m
3);
ym,i,sp1,FC - is the total volume of fuel type i combusted in the furnaces at the HSRS in month m in year y (m
3);
m - is the month m in year y.
y sp1_h,PE is calculated as follows:
hg,y,ysp_h, yspEFHGPE
11 (5)
Where:
hg,yEF
- is the CO2 emission factor of heat generation at the NLMK CHPP in year y, (tCO2/GJ);
, yspHG
1
- is the heat energy which is generated at the NLMK CHPP additionally in project scenario in comparison with the baseline in year y, (GJ).
hg,yEF is obtained as:
yCHPP,
i
yfuel_i,yi, hg,
yhg,HG
EFFC29,308
EF
(6)

JOINT IMPLEMENTATION PROJECT DESIGN DOCUMENT FORM - Version 01
Joint Implementation Supervisory Committee page 38
This template shall not be altered. It shall be completed without modifying/adding headings or logo, format or font.
Where:
hg, i,yFC
- is the total volume of fuel type i combusted at the NLMK CHPP for heat generation in year y (t.c.e);
CHPP,yHG
- is the heat energy which is generated at the NLMK CHPP in year y, (GJ);
29,308 - is the conversion factor from tonne of coal equivalent to GJ (GJ/t.c.e).
, yspHG
1 is obtained as:
,PJ,yspyhg,BLsp,BLsp,PJ, ysp, yspHGKOEFSHGSFCPSHG
1,1111 (7)
Where:
yPJ,sp1,PS
- is the steel volume is heated (steel output) in the furnaces at the HSRS in year y (tonnes);
BLsp1,SFC
- is the specific fuel consumption per tonne of steel in the baseline (GJ/tonne). It is an ex-ante fixed value, see Annex 2;
BLsp1,SHG
- is the specific heat generation (utilization) per GJ of burned fuel in baseline (GJ/GJ). It is an ex-ante fixed value, see Annex 2;
yPJ,sp1,HG
- is the heat generation (utilization) at the furnaces of the HSRS in year y (tonnes);
hg,yKOEF
- is the level of the reduction of steam (1.3 MPa) consumption at NLLMK in comparison with 2002 in year y (-);
hg,yKOEF is obtained as:
2002
,HC
HCKOEF
y
yhg (8)
Where:
yHC
- is the steam (1.3 MPa) consumption at NLLMK in year y (GJ);
2002HC
- is the steam (1.3 MPa) consumption at NLLMK in 2002 (it is equal to 1,127,339 GJ).
The annual project emissions from subproject 2 are:
y sp2,EC,y sp2_NG,ysp2,PEPEPE
(9)

JOINT IMPLEMENTATION PROJECT DESIGN DOCUMENT FORM - Version 01
Joint Implementation Supervisory Committee page 39
This template shall not be altered. It shall be completed without modifying/adding headings or logo, format or font.
Where:
y sp2_NG,PE - is the annual subproject 2 emissions associated with natural gas consumption for the year y, (tCO2);
y sp2,EC,PE
- is the annual subproject 2 emissions associated with electricity consumption for the year y, (tCO2).
y sp2_NG,PE is obtained as:
NG,yNG,y,PJ, NG,ysp,NG, yspEFNCVFCPE
22 (10)
Where:
yNG,sp2,PJ,FC
- is the annual natural gas consumption in project for the year y, (1000 Nm3);
yNG,NCV - is the average net calorific value per volume unit of natural gas in the year y (GJ/1000 Nm
3). It is calculated according to formulae 4;
NG,yEF
- is the default IPCC CO2 emission factor of natural gas in year y, (tCO2/GJ).
y sp2,EC,PE is obtained as:
yELEC,aver,,PJ, ysp,EC, yspEFECPE
22 (11)
Where:
ysp2,PJ,EC
- is the annual electricity consumption in project for the year y, (MWh);
yELEC,aver,EF
- is the weighted average CO2 emission factor for electricity consumption, (tCO2/MWh).
yELEC,aver,EF is obtained as:
yCHPelyCHPygridygridyELEC,aver,EFwEFwEF
,_,,, (12)
Where:
ygridw
,
- is part of electricity consumption from the grid at NLMK for the year y, (MWh);
ygridEF
,
- is the CO2 emission factor for electricity consumption, (tCO2/MWh). It is an ex-ante fixed value, see Annex 2;
yCHPw
,
- is part of electricity consumption from the CHPP at NLMK for the year y, (MWh);

JOINT IMPLEMENTATION PROJECT DESIGN DOCUMENT FORM - Version 01
Joint Implementation Supervisory Committee page 40
This template shall not be altered. It shall be completed without modifying/adding headings or logo, format or font.
yCHPelEF
,_
- is the CO2 emission factor for electricity generation at NLMK CHPP in project for the year y, (tCO2/MWh).
yCHPelEF
,_ is obtained as:
yCHPP,
i
yfuel_i,yi, eg,
yel_CHP,EG
EFFC29,308
EF
(13)
Where:
eg, i,yFC
- is the total volume of fuel type i combusted the NLMK CHPP for electricity generation in year y (t.c.e);
CHPP,yEG
- is the electricity which is generated at NLMK CHPP in project scenario in comparison with the baseline in year y, (MWh).
D.1.1.3. Relevant data necessary for determining the baseline of anthropogenic emissions of greenhouse gases by sources within the
project boundary, and how such data will be collected and archived: ID number
(Please use
numbers to ease
cross-
referencing to
D.2.)
Data variable Source of data Data unit Measured (m),
calculated (c),
estimated (e)
Recording
frequency
Proportion of
data to be
monitored
How will the
data be
archived?
(electronic/
paper)
Comment
B1 yBE Calculated under
project activity tCO2 C Annually 100% Electronic -
B2 ysp1,BE Calculated under
project activity tCO2 C Annually 100% Electronic -
B3 ,yspBE
2 Calculated under
project activity tCO2 C Annually 100% Electronic -
B4 y sp1_f,BE Calculated under
project activity tCO2 C Annually 100% Electronic -
B5 y sp1_s,BE Calculated under
project activity tCO2 C Annually 100% Electronic -
B6 yi,sp1,FC Fuel flow meter
reading m
3 M Continuously 100% Electronic -
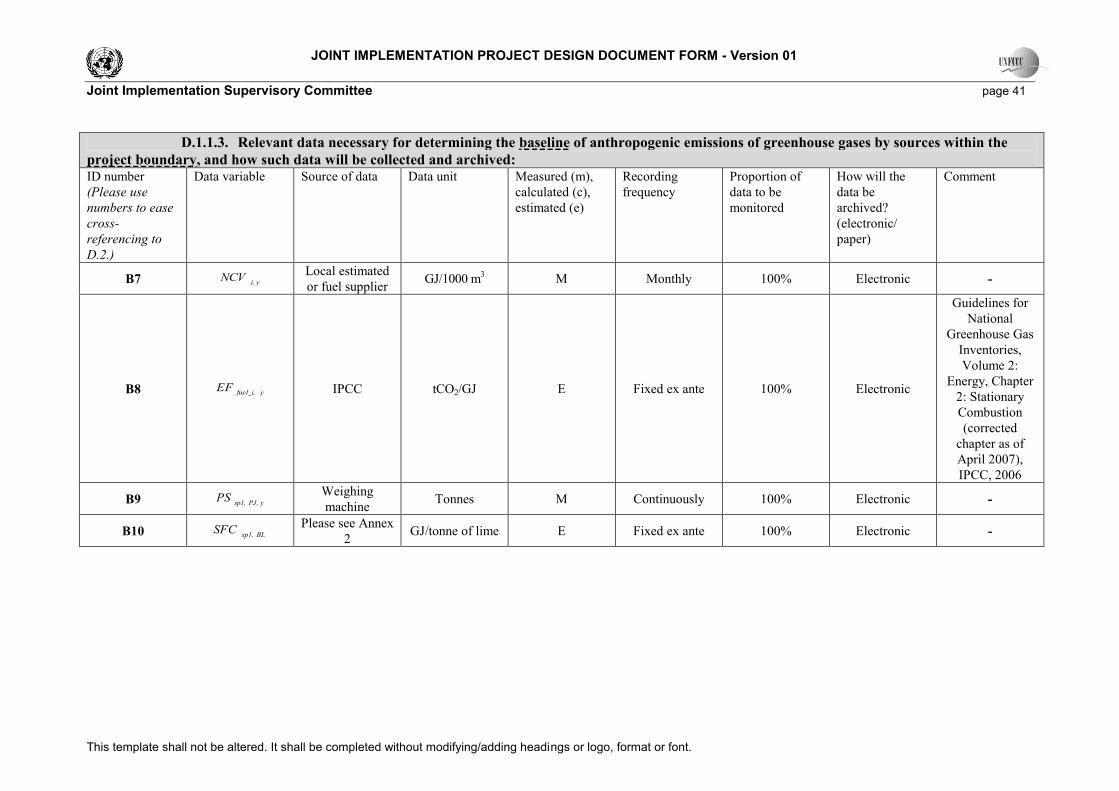
JOINT IMPLEMENTATION PROJECT DESIGN DOCUMENT FORM - Version 01
Joint Implementation Supervisory Committee page 41
This template shall not be altered. It shall be completed without modifying/adding headings or logo, format or font.
D.1.1.3. Relevant data necessary for determining the baseline of anthropogenic emissions of greenhouse gases by sources within the
project boundary, and how such data will be collected and archived: ID number
(Please use
numbers to ease
cross-
referencing to
D.2.)
Data variable Source of data Data unit Measured (m),
calculated (c),
estimated (e)
Recording
frequency
Proportion of
data to be
monitored
How will the
data be
archived?
(electronic/
paper)
Comment
B7 yi,NCV Local estimated
or fuel supplier GJ/1000 m
3 M Monthly 100% Electronic -
B8 yfuel_i,EF IPCC tCO2/GJ E Fixed ex ante 100% Electronic
Guidelines for
National
Greenhouse Gas
Inventories,
Volume 2:
Energy, Chapter
2: Stationary
Combustion
(corrected
chapter as of
April 2007),
IPCC, 2006
B9 yPJ,sp1,PS Weighing
machine Tonnes M Continuously 100% Electronic -
B10 BLsp1,SFC Please see Annex
2 GJ/tonne of lime E Fixed ex ante 100% Electronic -
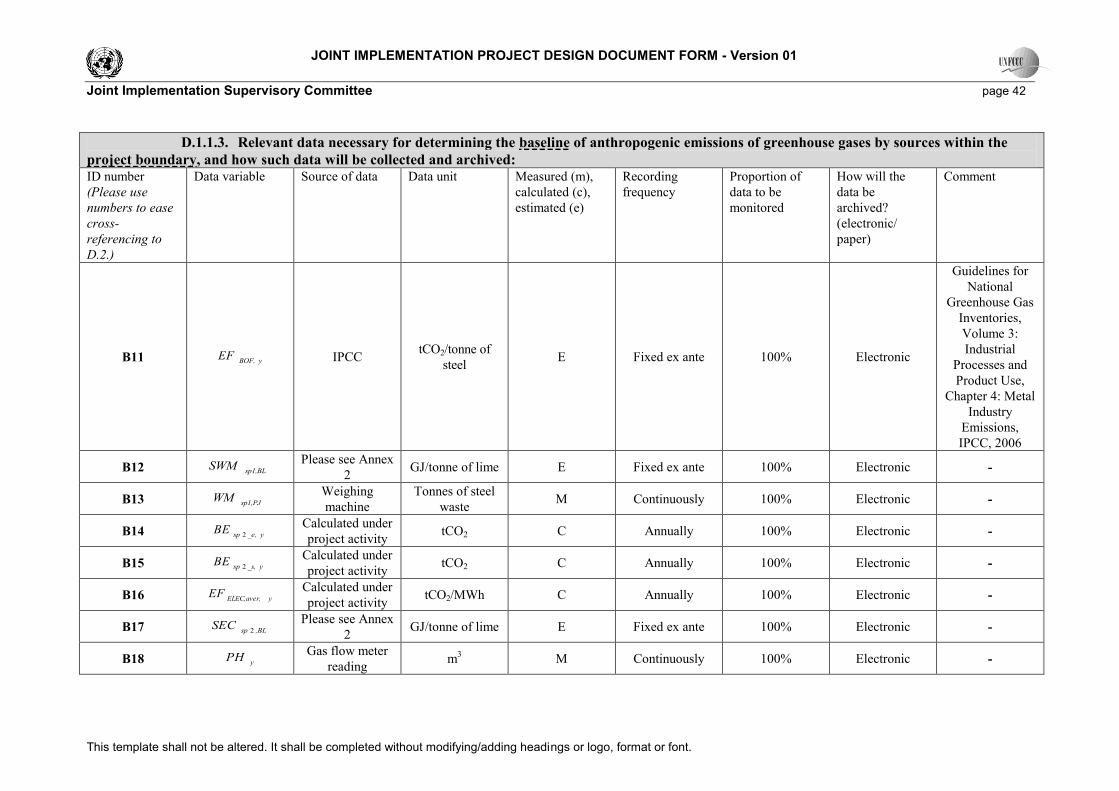
JOINT IMPLEMENTATION PROJECT DESIGN DOCUMENT FORM - Version 01
Joint Implementation Supervisory Committee page 42
This template shall not be altered. It shall be completed without modifying/adding headings or logo, format or font.
D.1.1.3. Relevant data necessary for determining the baseline of anthropogenic emissions of greenhouse gases by sources within the
project boundary, and how such data will be collected and archived: ID number
(Please use
numbers to ease
cross-
referencing to
D.2.)
Data variable Source of data Data unit Measured (m),
calculated (c),
estimated (e)
Recording
frequency
Proportion of
data to be
monitored
How will the
data be
archived?
(electronic/
paper)
Comment
B11 yBOF,EF IPCC
tCO2/tonne of
steel E Fixed ex ante 100% Electronic
Guidelines for
National
Greenhouse Gas
Inventories,
Volume 3:
Industrial
Processes and
Product Use,
Chapter 4: Metal
Industry
Emissions,
IPCC, 2006
B12 sp1,BLSWM Please see Annex
2 GJ/tonne of lime E Fixed ex ante 100% Electronic -
B13 sp1,PJWM Weighing
machine
Tonnes of steel
waste M Continuously 100% Electronic -
B14 _e, yspBE
2 Calculated under
project activity tCO2 C Annually 100% Electronic -
B15 _s, yspBE
2 Calculated under
project activity tCO2 C Annually 100% Electronic -
B16 yELEC,aver,EF
Calculated under
project activity tCO2/MWh C Annually 100% Electronic -
B17 ,BLspSEC
2 Please see Annex
2 GJ/tonne of lime E Fixed ex ante 100% Electronic -
B18 yPH Gas flow meter
reading m
3 M Continuously 100% Electronic -

JOINT IMPLEMENTATION PROJECT DESIGN DOCUMENT FORM - Version 01
Joint Implementation Supervisory Committee page 43
This template shall not be altered. It shall be completed without modifying/adding headings or logo, format or font.
D.1.1.3. Relevant data necessary for determining the baseline of anthropogenic emissions of greenhouse gases by sources within the
project boundary, and how such data will be collected and archived: ID number
(Please use
numbers to ease
cross-
referencing to
D.2.)
Data variable Source of data Data unit Measured (m),
calculated (c),
estimated (e)
Recording
frequency
Proportion of
data to be
monitored
How will the
data be
archived?
(electronic/
paper)
Comment
B19 ,BLspSSC
2 Please see Annex
2 GJ/tonne of lime E Fixed ex ante 100% Electronic -
B20 hg,yEF Calculated under
project activity tCO2/GJ C Annually 100% Electronic -
D.1.1.4. Description of formulae used to estimate baseline emissions (for each gas, source etc.; emissions in units of CO2 equivalent):
The annual baseline emissions (y
BE ) are calculated as follows:
2
i
spi,yyBEBE
(14)
Where:
yBE - are the annual baseline emissions for the year y, (tCO2);
yspi,BE - are the annual baseline emissions from subproject 1 and 2 for the year y, (tCO2);
The annual baseline emissions from subproject 1 are:
y sp1_s,y sp1_f,ysp1,BEBEBE
(15)
Where:
y sp1_f,BE - are the annual subproject 1 baseline emissions associated with fuel combustion in the furnaces for the year y, (tCO2);
y sp1_s,BE - are the annual subproject 1 baseline emissions associated with additional BOF steel production in baseline scenario for the year y, (tCO2);
y sp1_f,BE is calculated as follows:

JOINT IMPLEMENTATION PROJECT DESIGN DOCUMENT FORM - Version 01
Joint Implementation Supervisory Committee page 44
This template shall not be altered. It shall be completed without modifying/adding headings or logo, format or font.
)sp1,BLysp1,PJ,
i
i
yi, sp1,yi,
yi, sp1,yi,
yfuel_i,ysp1_f,SFCP
)FC(NCV
FCNCV(EFBE
(16)
Where:
yi,sp1,FC - is the total volume of fuel type i combusted in the furnaces of HSRS in project in year y (m
3);
yi,NCV - is the average net calorific value per volume unit of fuel type i in the year y (GJ/1000 m
3). It is defined according to Formulae 4;
yfuel_i,EF - is the default IPCC CO2 emission factor per unit of energy of fuel i in year y (tCO2/GJ);
yPJ,sp1,PS
- is the steel volume is heated (steel output) in the furnaces at the HSRS in year y (tonnes);
BLsp1,SFC
- is the specific fuel consumption per tonne of steel in the baseline (GJ/tonne). It is an ex-ante fixed value, see Annex 2.
y sp1_s,BE is calculated as follows:
)WMPS(SWMEFBEsp1,PJysp1,PJ,sp1,BLyBOF,ysp1_s,
(17)
Where:
yBOF,EF - is the default IPCC CO2 emission factor for Basic Oxygen Furnace in year y (tCO2/tonne of steel).
sp1,BLSWM - is the specific waste of steel of the furnaces per tonne of steel is heated in the furnaces at the HSGJ (tonne/tonne of steel). It is an ex-ante fixed
value, see Annex 2;
sp1,PJWM - is the volume of steel waste at the furnaces of HSRS in project in year y (tonnes).
The annual baseline emissions from subproject 2 are:
_s, ysp_e, ysp,yspBEBEBE
222 (18)
Where:
_e, yspBE
2 - are the annual subproject 2 baseline emissions associated with electricity consumption in the year y, (tCO2);
_s, yspBE
2 - are the annual subproject 2 baseline emissions associated with steam consumption in the year y, (tCO2);

JOINT IMPLEMENTATION PROJECT DESIGN DOCUMENT FORM - Version 01
Joint Implementation Supervisory Committee page 45
This template shall not be altered. It shall be completed without modifying/adding headings or logo, format or font.
_e, yspBE
2 is calculated as follows:
y,BLspyELEC,aver,_e, yspPHSECEFBE
22 (19)
Where:
yELEC,aver,EF
- is the weighted average CO2 emission factor for electricity consumption, (tCO2/MWh). It is calculated according to formulae 12.
,BLspSEC
2 - is the specific electricity consumption per 1000 m
3 of hydrogen for electrolysis installations, (MWh/1000 m
3). It is an ex-ante fixed value, see
Annex 2.
yPH - is the annual volume of hydrogen is generated at new hydrogen plant in the year y, (1000 m
3)
_s, yspBE
2 is calculated as follows:
y,BLsphg,y_s, yspPHSSCEFBE
22 (20)
Where:
hg,yEF
- is the CO2 emission factor of heat generation at NLMK CHPP in year y, (tCO2/GJ). It is calculated according to formulae 6;
,BLspSSC
2 - is the specific steam consumption per 1000 m
3 of hydrogen for electrolysis installations (GJ/1000 m
3). It is an ex-ante fixed value, see Annex 2.
D. 1.2. Option 2 – Direct monitoring of emission reductions from the project (values should be consistent with those in section E.):
D.1.2.1. Data to be collected in order to monitor emission reductions from the project, and how these data will be archived: ID number
(Please use
numbers to ease
cross-
referencing to
D.2.)
Data variable Source of data Data unit Measured (m),
calculated (c),
estimated (e)
Recording
frequency
Proportion of
data to be
monitored
How will the
data be
archived?
(electronic/
paper)
Comment
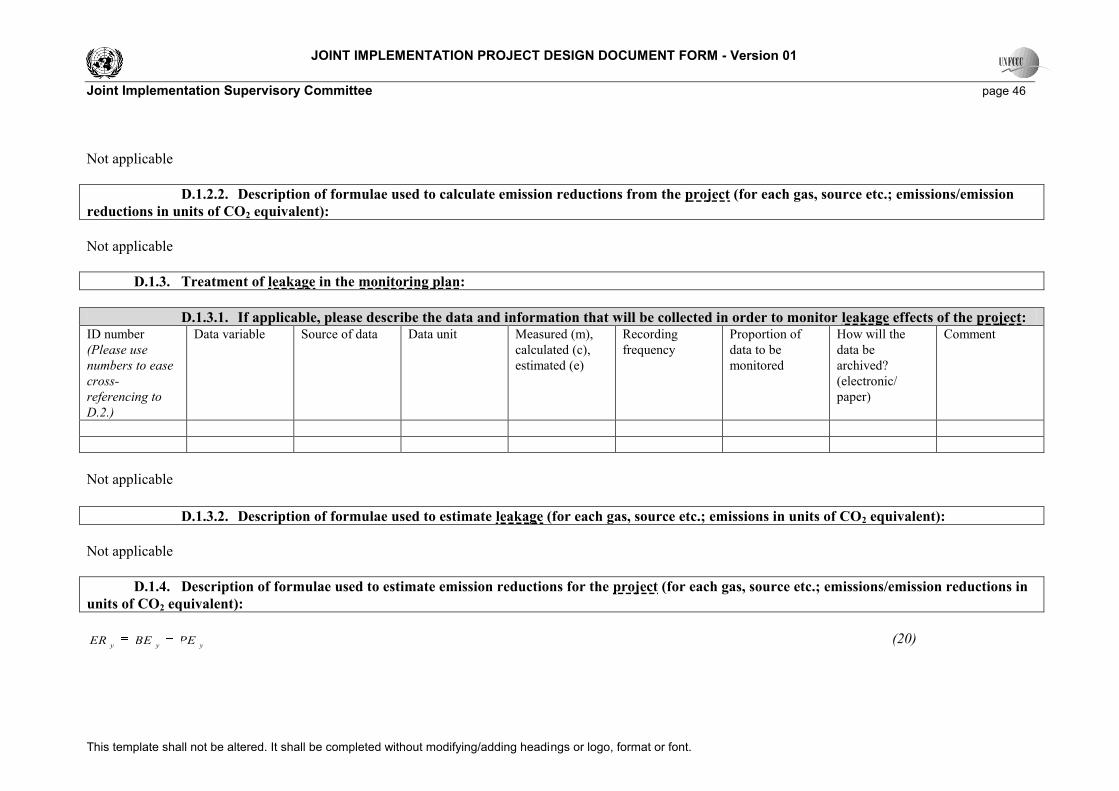
JOINT IMPLEMENTATION PROJECT DESIGN DOCUMENT FORM - Version 01
Joint Implementation Supervisory Committee page 46
This template shall not be altered. It shall be completed without modifying/adding headings or logo, format or font.
Not applicable
D.1.2.2. Description of formulae used to calculate emission reductions from the project (for each gas, source etc.; emissions/emission
reductions in units of CO2 equivalent):
Not applicable
D.1.3. Treatment of leakage in the monitoring plan:
D.1.3.1. If applicable, please describe the data and information that will be collected in order to monitor leakage effects of the project: ID number
(Please use
numbers to ease
cross-
referencing to
D.2.)
Data variable Source of data Data unit Measured (m),
calculated (c),
estimated (e)
Recording
frequency
Proportion of
data to be
monitored
How will the
data be
archived?
(electronic/
paper)
Comment
Not applicable
D.1.3.2. Description of formulae used to estimate leakage (for each gas, source etc.; emissions in units of CO2 equivalent):
Not applicable
D.1.4. Description of formulae used to estimate emission reductions for the project (for each gas, source etc.; emissions/emission reductions in
units of CO2 equivalent):
yyyPEBEER (20)

JOINT IMPLEMENTATION PROJECT DESIGN DOCUMENT FORM - Version 01
Joint Implementation Supervisory Committee page 47
This template shall not be altered. It shall be completed without modifying/adding headings or logo, format or font.
Where:
yER Emission reductions due to the proposed JI project in year y (tCO2);
yBE Baseline emissions in year y (tCO2);
yPE Project emissions in year y (tCO2).
D.1.5. Where applicable, in accordance with procedures as required by the host Party, information on the collection and archiving of
information on the environmental impacts of the project:
The main relevant Russian Federation environmental regulations:
Federal law of Russian Federation “On Environment Protection” (10 January 2002, N 7-FZ);
Federal law of Russian Federation “On Air Protection” (04 May 1999, N 96-FZ).
According to national requirements, emissions connected with the subproject operation have to be measured once a year or once every three years. Frequency of
measuring is described in the Volume of Maximum Allowable Emissions approved by Rostekhnadzor RF (Russian Federal Service for Ecological, Technical
and Atomic Supervision) and Rospotrebnadzor (Federal Service on Surveillance for Consumer rights protection and human well-being). The Control of
emission sources schedule is approved by Rostekhnadzor annually. NLMK will systematically collect pollution data that may have negative impact on the local
environment. The accredited physical-chemical laboratory of NLMK and a special licensed entity measure emission from sources at NLMK. Data collection
and archiving is done by Environmental Protection department. Collected and archived data will be stored for more than five years in hardcopy and
electronically.
NLMK has ISO 14000:2004 certificate.

JOINT IMPLEMENTATION PROJECT DESIGN DOCUMENT FORM - Version 01
Joint Implementation Supervisory Committee page 48
This template shall not be altered. It shall be completed without modifying/adding headings or logo, format or font.
D.2. Quality control (QC) and quality assurance (QA) procedures undertaken for data monitored: Data
(Indicate table and
ID number)
Uncertainty level of data
(high/medium/low)
Explain QA/QC procedures planned for these data, or why such procedures are not necessary.
P22, P26 low
The electricity consumption and generation are determined by standardized electricity meters. The data
from meters are automatically and regularly transferred to the automatic system of the supervisory control
“Energo” and achieved. Energy Saving Centre will extract them from this system, treat and achieve them
for monitoring purposes.
P5, P25, B6, B18 medium
In accordance with State Standard the allowed inaccuracy of gas consumption metering is ±0.3-4% (GOST
R 8.618-2006). The flow gas meter to be installed will provide necessary inaccuracy. This type of meter is
based on the method of variable differential pressure on restriction according to GOST R 8.586-2005.
The data from meters are automatically and regularly transferred to the automatic system of the
supervisory control “Energo” and achieved. Energy Saving Centre will extract them from this system, treat
and achieve them for monitoring purposes.
P6, P16, P21, B7 medium
Natural gas:
The natural gas supplier’s laboratory will carry out the measurement of NCV of gas supplied and issue a
certificate. The Power Production Shop will store these certificates and will calculate the weighted average
value of the Net Calorific Value at the end of each year and transfer to the automatic system of the
supervisory control “Energo”.
Blast furnace gas:
NCV of BFG is calculated based on a gas composition. The Blast Furnace Shop carries out the
measurement of gas composition by a gas-analysis system and calculates the weighted average value of the
Net Calorific Value and will be transferred to the automatic system of the supervisory control “Energo”
Coke oven gas:
NCV of COG is calculated based on a gas composition. The Coke Shop carries out the measurement of gas
composition by a gas-analysis system and calculates the weighted average value of the Net Calorific Value
and will transfer to the automatic system of the supervisory control “Energo”.
Energy Saving Centre will extract them from this system, treat and achieve them for monitoring purposes.
P11, B9 medium
The produced steel is measured by volume-to-mass conversion method. Information will be calculated by
the HSRS and will transfer to the automatic system of the supervisory control “Energo”.
Energy Saving Centre will extract them from this system, treat and achieve them for monitoring purposes.

JOINT IMPLEMENTATION PROJECT DESIGN DOCUMENT FORM - Version 01
Joint Implementation Supervisory Committee page 49
This template shall not be altered. It shall be completed without modifying/adding headings or logo, format or font.
P14, P17, P18 medium
Heat generation is measured by standardized heat meters. This method based on the measuring of
temperature, pressure of steam and steam flow then they are recalculated to heat generation. The data from
meters are automatically and regularly transferred to the computer system and achieved. Energy Saving
Centre will extract them from this system, treat and achieve them for monitoring purposes.
B13 medium
The waste of steel is measured by weight method once a year. HSRS will transfer this information to the
automatic system of the supervisory control “Energo”.
Energy Saving Centre will extract them from this system, treat and achieve them for monitoring purposes.
Calibration of the metering devices is made in accordance with the calibration schedule. Supervision of calibration is performed by the Department of heat
automatic and measurement. The metering devices are calibrated by an independent entity which has a state licence.
D.3. Please describe the operational and management structure that the project operator will apply in implementing the monitoring plan:
Division of responsibilities for Monitoring Plan implementation and Monitoring Report preparation is presented in the Table D.3.1.
Table D.3.1: Division of responsibilities for Monitoring Plan implementation and Monitoring Report preparation
N Responsible Task
1 NLMK:
Department of heat automatic and measurement;
Hot Sheet-Rolling Shop;
Gas Shop
NLMK CHPP, Blast Furnace Shop, Coke Shop,
Power Production Shop
Energy Saving Centre
Quality control of measuring devices;
Subproject 1 daily recorded data;
Subproject 2 daily recorded data;
Recorded other data;
Collection, data processing, archiving, and preparation of Monitoring report
3 Global Carbon BV Staff training on monitoring procedures and reporting;
ERU calculation and preparation of annual monitoring report
The scheme of the operational and management structure in implementing the monitoring plan is presented in Figure D.3.1.

JOINT IMPLEMENTATION PROJECT DESIGN DOCUMENT FORM - Version 01
Joint Implementation Supervisory Committee page 50
This template shall not be altered. It shall be completed without modifying/adding headings or logo, format or font.
Figure D.3.1: The organisational structure of the Monitoring plan implementation
D.4. Name of person(s)/entity(ies) establishing the monitoring plan:
Name of person/entity determining the monitoring plan:
OJSC “NLMK”,
OJSC “NLMK” is a project participant. The contact information is presented in Annex 1.
Global Carbon BV,
Global Carbon BV is a project participant. The contact information is presented in Annex 1.

JOINT IMPLEMENTATION PROJECT DESIGN DOCUMENT FORM - Version 01
Joint Implementation Supervisory Committee page 51
This template shall not be altered. It shall be completed without modifying/adding headings or logo, format or font.
SECTION E. Estimation of greenhouse gas emission reductions
E.1. Estimated project emissions:
Subproject 1: Reconstruction of heating furnaces No 4 and 5 at the Hot Sheet-Rolling Shop
The actual data after subproject 1 implementation for 2008-2009 are presented in Table E.1.1.
Table E.1.1: Actual data of subproject 1
Indictor Unit 2008 2009 Average
Energy efficiency
Steel (slabs) output tonnes of steel 4,786,139 4,760,291 4,773,215
Total fuel consumption t.c.e
22 327,553 328,900 328,226
GJ 9,607,122 9,646,625 9,626,874
Natural gas consumption
t.c.e 292,415 290,805 291,610
GJ 8,576,530 8,529,305 8,552,918
% 89.3 88.4 88.8
Blast furnace gas
consumption
t.c.e 35,138 38,095 36,616
GJ 1,030,592 1,117,320 1,073,956
% 10.7 11.6 11.2
Specific fuel consumption GJ/t steel 2.007 2.026 2.017
Heat output
Heat output Gcal 251,246 152,320 201,783
GJ 1,051,968 637,762 844,865
Specific heat generation GJ/GJ fuel 0.109 0.066 0.088
Waste of steel
Waste of steel tonnes 65,658 68,124 66,891
tonne/tonne of steel 0.0137 0.0143 0.0140
Source: Data provided by NLMK
For project emission estimation of subproject 1 the actual data were used for 2008-2009, respectively, and
average volume of them – for 2010-2012.
The actual data of steam (1.3 MPa) consumption at NLMK is presented in Table E.1.2.
Table E.1.2: Actual data of steam (1.3 MPa) consumption at NLMK
Steam (1.3 MPa) Unit 2002 2007 2008 2009
Steam (heat) consumption Gcal 1,127,339 946,602 896,553 793,302
- 1.00 0.84 0.80 0.70
And the forecast of steam (1.3 MPa) consumption at NLMK in 2010-2012 is presented in Table E.1.3.
22 t.c.e – tonne of coal equivalent

JOINT IMPLEMENTATION PROJECT DESIGN DOCUMENT FORM - Version 01
Joint Implementation Supervisory Committee page 52
This template shall not be altered. It shall be completed without modifying/adding headings or logo, format or font.
Table E.1.3: Forecast of steam (1.3 MPa) consumption at NLMK
Steam (1.3 MPa) Unit 2010 2011 2012
Steam (heat) consumption Gcal 751,547 709,792 668,038
- 0,67 0,63 0,59
The used data and results of calculation of emissions within the crediting period are presented in Table
E.1.4.
Table E.1.4: Estimated project emissions of subproject 1 within the crediting period
Indicator Unit 2008 2009 2010 2011 2012
Emission from fuel burning
Annual natural gas consumption GJ 8,576,530 8,529,305 8,552,918 8,552,918 8,552,918
Emission factor of natural gas tCO2/GJ 0.0561 0.0561 0.0561 0.0561 0.0561
Subproject 1 emission from
natural gas burning tCO2 481,143 478,494 479,819 479,819 479,819
Annual blast furnace gas
consumption GJ 1,030,592 1,117,320 1,073,956 1,073,956 1,073,956
Emission factor of blast furnace
gas tCO2/GJ 0.2600 0.2600 0.2600 0.2600 0.2600
Subproject 1 emission from blast
furnace gas burning tCO2 267,954 290,503 279,229 279,229 279,229
Emission associated with additional heat generation
Steel (slabs) output t steel 4,786,139 4,760,291 4,773,215 4,773,215 4,773,215
Specific fuel consumption in
baseline GJ/t steel 2.83 2.83 2.83 2.83 2.83
Specific heat output in baseline GJ heat/GJ fuel 0.158 0.158 0.158 0.158 0.158
Heat generation in baseline GJ 1,698,771 1,495,014 1,420,171 1,341,269 1,262,367
Heat generation in project
scenario GJ 1,051,968 637,762 844,865 844,865 844,865
Additional heat generation in
project scenario GJ 646,803 857,252 575,306 496,404 417,501
Emission factor for heat
generation at NLMK CHPP23
tCO2/GJ 0.178 0.194 0.184 0.184 0.184
Emission associated with
additional heat generation tCO2 114,973 166,514 106,120 91,566 77,012
Total project emission tCO2 864,070 935,511 865,167 850,613 836,059
Total 2008 - 2012 tCO2 4,351,421
Project emissions of subproject 1 for the time frame after the crediting period are similar for 2010-2012.
They are presented in Table E.1.5.
Table E.1.5: Estimated project emissions of subproject 1 after the crediting period
Indicator Unit 2013 2014 2015 2016 2017 2018 2019 2020
Project emission tCO2 836,059 836,059 836,059 836,059 836,059 836,059 836,059 836,059
Total 2013 - 2020 tCO2 6,688,472
23 Please see Annex 2

JOINT IMPLEMENTATION PROJECT DESIGN DOCUMENT FORM - Version 01
Joint Implementation Supervisory Committee page 53
This template shall not be altered. It shall be completed without modifying/adding headings or logo, format or font.
Subproject 2: Commissioning the hydrogen plant based on steam reforming of natural gas technology
The actual data of new hydrogen plant (after subproject 2 implementation) for 2008-2009 are presented in
Table E.1.6.
Table E.1.6: Actual data of subproject 2 for 2008-2009
Indictor Unit 2008 2009
H2 output 1000 m3 42,458 18,553
Electricity consumption MWh 4,752 3,353
Natural gas consumption 1000 m3 18,336 8,702
Net calorific value of natural gas GJ/1000 m3 35,59 35,59
Natural gas consumption GJ 652 571 309 717
Source: Data provided by NLMK
This data was used for project emission estimation of subproject 2 for 2008-2009.
However the data of 2009 is not representative therefore the average values of new hydrogen plant
parameters for 2005-2007 were used for project emission estimation of subproject 2 for 2010-2012. They
are presented in Table E.1.7.
Table E.1.7: Estimation of average values of new hydrogen plant parameters for 2005-2007
Indictor Unit 2005 2006 2007 Average
H2 output 1000 m3 38,282 42,375 43,413 41,357
Electricity consumption MWh 5,489 5,700 4,728 5,306
Natural gas consumption 1000 m3 17,771 18,224 18,584 18,193
Net calorific value of natural gas GJ/1000 m3 35.59 35.59 35.59 35.59
Natural gas consumption GJ 632,493 648,604 661,429 647,509
Source: Data provided by NLMK
The used data and results of calculation of emissions within the crediting period are presented in Table
E.1.8.
Table E.1.8: Estimated project emissions of subproject 2 within the crediting period
Indictor Unit 2008 2009 2010 2011 2012
H2 production 1000 m3 42,458 18,553 44,300 44,300 44,300
Natural gas consumption GJ 652,571 309,717 693,593 693,593 693,593
Emission factor of natural gas tCO2/GJ 0.0561 0.0561 0.0561 0.0561 0.0561
NG emission tCO2 36,609 17,375 38,911 38,911 38,911
Electricity consumption MWh 4,752 2,380 5,683 5,683 5,683
Average electricity emission factor tCO2/MWh 1.112 1.221 1.221 1.221 1.221
Emission from electricity tCO2 5,285 2,905 6,937 6,937 6,937
Total project emission tCO2 41,894 20,280 45,847 45,847 45,847
Total project emission for 2008-2012 tCO2 199,716

JOINT IMPLEMENTATION PROJECT DESIGN DOCUMENT FORM - Version 01
Joint Implementation Supervisory Committee page 54
This template shall not be altered. It shall be completed without modifying/adding headings or logo, format or font.
Project emissions of subproject 1 for the time frame after the crediting period are similar for 2010-2012.
They are presented in Table E.1.9.
Table E.1.9: Estimated project emissions of subproject 2 after the crediting period
Indicator Unit 2013 2014 2015 2016 2017 2018 2019 2020
Project emission tCO2 45,847 45,847 45,847 45,847 45,847 45,847 45,847 45,847
Total 2013 - 2020 tCO2 366,776
The estimations of total project emissions within and after crediting period are presented in Table E.1.10
and E.1.11, respectively. This is sum of subproject 1 and 2 emissions.
Table E.1.10: Estimated total project emission within the crediting period
Indicator Unit 2008 2009 2010 2011 2012
Project emissions tCO2 905,964 955,792 911,015 896,460 881,906
Total 2008 - 2012 tCO2 4,551,136
Table E.1.11: Estimated total project emission after the crediting period
Indicator Unit 2013 2014 2015 2016 2017 2018 2019 2020
Project emission tCO2 881,906 881,906 881,906 881,906 881,906 881,906 881,906 881,906
Total 2013 - 2020 tCO2 7,055,249
E.2. Estimated leakage:
Not applicable.
E.3. The sum of E.1. and E.2.:
Table E.3.1: Estimated total project emission within the crediting period
Indicator Unit 2008 2009 2010 2011 2012
Project emissions tCO2 905,964 955,792 911,015 896,460 881,906
Total 2008 - 2012 tCO2 4,551,136
Table E.3.2: Estimated total project emission after the crediting period
Indicator Unit 2013 2014 2015 2016 2017 2018 2019 2020
Project emission tCO2 881,906 881,906 881,906 881,906 881,906 881,906 881,906 881,906
Total 2013 - 2020 tCO2 7,055,249
E.4. Estimated baseline emissions:
Subproject 1: Reconstruction of heating furnaces No 4 and 5 at the Hot Sheet-Rolling Shop
Table E.4.1: Estimated baseline emissions of subproject 1 within the crediting period

JOINT IMPLEMENTATION PROJECT DESIGN DOCUMENT FORM - Version 01
Joint Implementation Supervisory Committee page 55
This template shall not be altered. It shall be completed without modifying/adding headings or logo, format or font.
Indictor Unit 2008 2009 2010 2011 2012
Emission from fuel burning
Steel (slabs) output t steel 4,786,139 4,760,291 4,773,215 4,773,215 4,773,215
Specific fuel consumption GJ/t steel 2.83 2.83 2.83 2.83 2.83
Total fuel consumption GJ 13,545,293 13,472,140 13,508,717 13,508,717 13,508,717
Share of natural gas consumption - 0.893 0.884 0.888 0.888 0.888
Share of BFG consumption - 0.107 0.116 0.112 0.112 0.112
Natural gas consumption GJ 12,092,238 11,911,731 12,001,710 12,001,710 12,001,710
Emission factor of natural gas tCO2/GJ 0.0561 0.0561 0.0561 0.0561 0.0561
NG emission tCO2 678,375 668,248 673,296 673,296 673,296
Blast furnace gas consumption GJ 1,453,055 1,560,410 1,507,007 1,507,007 1,507,007
Emission factor of blast furnace gas tCO2/GJ 0.2600 0.2600 0.2600 0.2600 0.2600
BFG emission tCO2 377,794 405,707 391,822 391,822 391,822
Emission associated with additional BOF steel production
Specific steel waste in baseline
tonne/
tonne of steel 0.022 0.022 0.022 0.022 0.022
Waste of steel in baseline tonnes 105,132 104,564 104,848 104,848 104,848
Waste of steel in project tonnes 65,658 68,124 66,891 66,891 66,891
Additional BOF steel production GJ 39,474 36,440 37,957 37,957 37,957
Emission factor for BOF steel
production tCO2/t steel 1.46 1.46 1.46 1.46 1.46
Emission associated with additional
BOF steel production tCO2 57,632 53,203 55,418 55,418 55,418
Total baseline emission tCO2 1,113,801 1,127,157 1,120,535 1,120,535 1,120,535
Total baseline emission for 2008-2012 tCO2 5,602,564
Baseline emissions of subproject 1 for the time frame after the crediting period are similar for 2010-2012.
They are presented in Table E.4.2.
Table E.4.2: Estimated baseline emissions of subproject 1 after the crediting period
Indicator Unit 2013 2014 2015 2016 2017 2018 2019 2020
Baseline emission tCO2 1,120,535 1,120,535 1,120,535 1,120,535 1,120,535 1,120,535 1,120,535 1,120,535
Total 2013 - 2020 tCO2 8,964,282
Subproject 2: Commissioning the hydrogen plant based on steam reforming of natural gas technology
Table E.4.3: Estimated baseline emissions of subproject 2 within the crediting period
Indictor Unit 2008 2009 2010 2011 2012
H2 production 1000 m3 42,458 18,553 44,300 44,300 44,300
Specific electricity consumption MWh/1000 m3 5.48 5.48 5.48 5.48 5.48
Total electricity consumption MWh 232,819 101,734 226,781 226,781 226,781
Average electricity emission factor24
t CO2/MWh 1.112 1.221 1.146 1.146 1.146
Emission from electricity tCO2 258,942 124,171 259,975 259,975 259,975
Specific steam consumption GJ/1000 m3 3.93 3.93 3.93 3.93 3.93
Total steam consumption GJ 166,861 72,913 174,101 174,101 174,101
Emission factor for heat generation at GJ 0.178 0.194 0.184 0.184 0.184
24 Please see Annex 2

JOINT IMPLEMENTATION PROJECT DESIGN DOCUMENT FORM - Version 01
Joint Implementation Supervisory Committee page 56
This template shall not be altered. It shall be completed without modifying/adding headings or logo, format or font.
Indictor Unit 2008 2009 2010 2011 2012
NLMK's CHPP
Emission from fuel tCO2 29,660 14,163 32,114 32,114 32,114
Total project emission tCO2 288,603 138,334 328,611 328,611 328,611
Total project emission for 2008-2012 tCO2 1,412,771
Baseline emissions of subproject 2 for the time frame after the crediting period are similar for 2010-2012.
They are presented in Table E.4.4.
Table E.4.4: Estimated baseline emissions of subproject 2 after the crediting period
Indicator Unit 2013 2014 2015 2016 2017 2018 2019 2020
Baseline emission tCO2 328,611 328,611 328,611 328,611 328,611 328,611 328,611 328,611
Total 2013 - 2020 tCO2 2,628,888
The estimations of total project emissions within and after crediting period are presented in Table E.4.5 and
E.4.6, respectively.
Table E.4.5: Estimated total baseline emission within the crediting period
Indicator Unit 2008 2009 2010 2011 2012
Baseline emission tCO2 1,402,404 1,265,491 1,449,147 1,449,147 1,449,147
Total 2008 - 2012 tCO2 7,015,335
Table E.4.6: Estimated total baseline emission after the crediting period
Indicator Unit 2013 2014 2015 2016 2017 2018 2019 2020
Baseline emission tCO2 1,449,147 1,449,147 1,449,147 1,449,147 1,449,147 1,449,147 1,449,147 1,449,147
Total 2013 - 2020 tCO2 11,593,173
E.5. Difference between E.4. and E.3. representing the emission reductions of the project:
Table E.5.1: Difference representing the emission reductions within the crediting period
Reductions Unit 2008 2009 2010 2011 2012
Annual reductions tCO2 496,440 309,700 538,132 552,686 567,240
Total 2008 - 2012 tCO2 2,464,199
Table E.5.2: Difference representing the emission reductions after the crediting period
Reductions Unit 2013 2014 2015 2016 2017 2018 2019 2020
Annual reductions tCO2 567,240 567,240 567,240 567,240 567,240 567,240 567,240 567,240
Total 2008 - 2012 tCO2 4,537,924

JOINT IMPLEMENTATION PROJECT DESIGN DOCUMENT FORM - Version 01
Joint Implementation Supervisory Committee page 57
This template shall not be altered. It shall be completed without modifying/adding headings or logo, format or font.
E.6. Table providing values obtained when applying formulae above:
Table E.6.1: Project, baseline, and emission reductions within the crediting period
Year
Estimated
project
emissions
(tonnes of
CO2
equivalent)
Estimated
leakage
(tonnes of
CO2
equivalent)
Estimated
baseline
emissions
(tonnes of
CO2
equivalent)
Estimated
emission
reductions
(tonnes of
CO2
equivalent)
Year 2008 905,964 0 1,402,404 496,440
Year 2009 955,792 0 1,265,491 309,700
Year 2010 911,015 0 1,449,147 538,132
Year 2011 896,460 0 1,449,147 552,686
Year 2012 881,906 0 1,449,147 567,240
Total
(tonnes of
CO2
equivalent)
4,551,136 0 7,015,335 2,464,199
Table E.6.2: Project, baseline, and emission reductions after the crediting period
Year
Estimated
project
emissions
(tonnes of
CO2
equivalent)
Estimated
leakage
(tonnes of
CO2
equivalent)
Estimated
baseline
emissions
(tonnes of
CO2
equivalent)
Estimated
emission
reductions
(tonnes of
CO2
equivalent)
Year 2013 881,906 0 1,449,147 567,240
Year 2014 881,906 0 1,449,147 567,240
Year 2015 881,906 0 1,449,147 567,240
Year 2016 881,906 0 1,449,147 567,240
Year 2017 881,906 0 1,449,147 567,240
Year 2018 881,906 0 1,449,147 567,240
Year 2019 881,906 0 1,449,147 567,240
Year 2020 881,906 0 1,449,147 567,240
Total
(tonnes of
CO2
equivalent)
7,055,249 0 11,593,173 4,537,924

JOINT IMPLEMENTATION PROJECT DESIGN DOCUMENT FORM - Version 01
Joint Implementation Supervisory Committee page 58
This template shall not be altered. It shall be completed without modifying/adding headings or logo, format or font.
SECTION F. Environmental impacts
F.1. Documentation on the analysis of the environmental impacts of the project, including
transboundary impacts, in accordance with procedures as determined by the host Party:
The necessity of an Environmental Impact Assessment (EIA) in Russia is regulated by the Federal Law “On
the Environmental Expertise” and consists of two stages: EIA (OVOS –in Russian abbreviation) and state
environmental expertise (SEE).
According to this law the EIA was prepared and SEE was made for each of subprojects.
Subproject 1
The EIA of heating furnace No 5 was prepared in 2001. Positive conclusion No 49 of the Expert Committee
of SEE was approved by Natural Resources Committee across the Lipetsk area of Ministry of Natural
Resources of the Russian Federation on 26 March 2002.
The EIA of heating furnace No 4 was prepared in 2005. Positive conclusion No 191 of the Expert
Committee of SEE was approved by Russian Federal Service for Ecological, Technical and Atomic
Supervision across the Lipetsk area of Federal Service on Environmental, Technical and Atomic
Supervision on 22 June 2006.
The main conclusion of Expert Committee is “…Expert Committee considers that the project can be
implemented and project environmental impact is permissible”.
These conclusions are obligatory according to Federal Law “On the Environmental Expertise”.
Subproject 2
The EIA of the subproject “Commissioning the hydrogen plant based on steam reforming of natural gas
technology” was prepared in 2003. Positive conclusion No 149 of the Expert Committee of SEE was
approved by Natural Resources Committee across the Lipetsk area of Ministry of Natural Resources of the
Russian Federation on 01 October 2004.
The main conclusion of Expert Committee is “…Expert Committee considers that the project can be
implemented and project environmental impact is permissible”.
These conclusions are obligatory according to Federal Law “On the Environmental Expertise”.
F.2. If environmental impacts are considered significant by the project participants or the
host Party, please provide conclusions and all references to supporting documentation of an
environmental impact assessment undertaken in accordance with the procedures as required by
the host Party:
Not applicable

JOINT IMPLEMENTATION PROJECT DESIGN DOCUMENT FORM - Version 01
Joint Implementation Supervisory Committee page 59
This template shall not be altered. It shall be completed without modifying/adding headings or logo, format or font.
SECTION G. Stakeholders’ comments
G.1. Information on stakeholders’ comments on the project, as appropriate:
Proposed projects were submitted and approved by Administration of Lipetsk and other local stakeholders.
For example, these projects have got positive conclusions from Lipetsk Center of Hygiene and
Epidemiology of Federal Supervision Service on Consumer Rights Protection and Human Wellbeing.
The series of public hearings are not obligatory for these types of project. Nevertheless NLMK published
the project information on the NLMK website: http://www.nlmk.ru/media_centre/press_releases/. Also
NLMK prepared annual reports “Corporative Stability and Social Responsibility” in 2006, 2007 and 2008
(http://www.nlmk.ru/social/srep/).
No comments were received on the proposed projects.

JOINT IMPLEMENTATION PROJECT DESIGN DOCUMENT FORM - Version 01
Joint Implementation Supervisory Committee page 60
This template shall not be altered. It shall be completed without modifying/adding headings or logo, format or font.
Annex 1
CONTACT INFORMATION ON PROJECT PARTICIPANTS
Organisation: OJSC “Novolipetsk Steel”
Street/P.O.Box:
Building:
City: Lipetsk town
State/Region: Russian Federation, Lipetsk area
Postal code: 398040
Country: Russian Federation
Phone: +7 4742 445 010
Fax: +7 4742 441 111
E-mail: [email protected]
URL: www.nlmk.ru
Represented by:
Title: Head of Environmental Protection
Salutation:
Last name: Chizhikova
Middle name: Maximovna
First name: Valentina
Department:
Phone (direct): +7 4742 440 941
Fax (direct):
Mobile: +7 909 219 00 87
Personal e-mail: [email protected]
Organisation: Global Carbon BV
Street/P.O.Box: Niasstraat 1
Building:
City: Utrecht
State/Region:
Postal code: 3531 WR
Country: The Netherlands
Phone: +31 30 850 6724
Fax: +31 70 891 0791
E-mail: [email protected]
URL: www.global-carbon.com
Represented by:
Title: Director
Salutation:
Last name: de Klerk
Middle name:
First name: Lennard
Department:
Phone (direct): +31 30 850 6724
Fax (direct): +31 70 891 0791
Mobile:
Personal e-mail: [email protected]

JOINT IMPLEMENTATION PROJECT DESIGN DOCUMENT FORM - Version 01
Joint Implementation Supervisory Committee page 61
This template shall not be altered. It shall be completed without modifying/adding headings or logo, format or font.
Annex 2
BASELINE INFORMATION
Subproject 1. Reconstruction of heating furnaces No 4 and 5 at the Hot Sheet-Rolling Shop
The subproject started in 2002 but furnace No 5 was stopped in August 2000. Therefore the data for 1997-
1999 was used for calculation average baseline parameters. The main parameters of the Hot Sheet-Rolling
Shop before the subproject 1 implementation for 1997-1999 and its average values are presented in Table
Anx.2.1.
Table Anx.2.1: The main parameters of the Hot Sheet-Rolling Shop and its average values
Parameter Unit 1997 1998 1999 Average
Energy efficiency
Steel (slabs) output t steel 4,849,244 4,237,778 4,131,773 4,406,265
Total fuel consumption t.c.e 483,490 398,233 393,784 425,169
GJ 14,180,762 11,680,179 11,549,685 12,470,208
Specific fuel consumption GJ/t steel 2.92 2.76 2.80 2.83
Heat output
Heat output Gcal n/a 147,950 125,657 140,519
GJ n/a 619,465 526,125 588,352
Specific heat generation per 1
GJ of fuel consumption GJ/GJ n/a 0.066 0.056 0.061
Waste of steel
Waste of steel tonne/tonne
of steel
119,211 85,444 85,708 96,788
0.025 0.020 0.021 0.022
The average values of the specific fuel consumption (,BLsp
SFC1
), the specific heat generation (sp1,BL
SHG )
and the specific waste of steel of the furnaces (sp1,BL
SWM ) are used for calculation of the baseline and the
project emissions in the formulas in Section D. They are ex-ante for period 2008-2012.
Subproject 2. Commissioning the hydrogen plant based on steam reforming of natural gas technology
The main parameters of the two electrolysis installations before implementation of subproject 2 for 2001-
2003 and its average values are presented in Table Anx.2.2.
Table Anx.2.2: The main parameters of the two electrolysis installation and its average values
Indictor Unit 2001 2002 2003 Average
Electrolysis installation No 1
Electricity consumption MWh 72,988 75,838 80,316 76,381
Steam consumption GJ 80,683 80,420 76,354 79,152
H2 output 1000 m3 13,515 14,305 15,230 14,350
Electrolysis installation No 2
Electricity consumption MWh 76,126 79,120 84,905 80,050

JOINT IMPLEMENTATION PROJECT DESIGN DOCUMENT FORM - Version 01
Joint Implementation Supervisory Committee page 62
This template shall not be altered. It shall be completed without modifying/adding headings or logo, format or font.
Steam consumption GJ 31,796 32,428 34,660 32,961
H2 output 1000 m3 13,359 13,919 15,255 14,177
Specific electricity consumption MWh/1000 m3 5.55 5.49 5.42 5.48
Specific steam consumption GJ/1000 m3 4.19 4.00 3.64 3.93
The average values of the specific electricity consumption (,BLsp
SEC2
) and the specific steam consumption
(,BLsp
SSC2
) are used for calculation of the baseline of subproject 2 emissions in the formulas in Section D.
They are ex-ante for period 2008-2012.
Default fuel emission factors
The default fuel emission factors are presented in the Table Anx.2.4.
Table Anx.2.4: The default fuel emission factors
Fuel type Default emission factor
25
tCO2/GJ
Natural gas 0.0561
Coke oven gas 0.0444
Blast furnace gas 0.2596
Standardized electricity grid emission factor
In this PDD, a standardized CO2 emission factor is used to calculate emissions related to electricity
consumption in the project and baseline scenarios.
Standardized CO2 emission factors were elaborated for Russian power systems in the Study commissioned
by “Carbon Trade and Finance SICAR S.A.” 26. This Study was based on the latest approved CDM “Tool to
calculate the emission factor for an electricity system” available at the time of the Study development
(version 01.1). The Study was verified by Bureau Veritas Certification (BVC) in 2008. BVC confirmed an
applicability of the Tool and the emission factor calculation accuracy.
According to the Tool, operating, build and combined margin emission factors were calculated for seven
regional Russian electricity systems (RESs). Within these RESs no major transmission constraints exist,
while they operate at the same time relatively “independently” from each other (i.e. electricity exchange
between regional systems is rather insignificant).
For the PDD at hand, emission related characteristics of the relevant regional electricity system,
RES “Center”, the largest unified power system of the national energy system of Russia, were taken into
account.
25 Guidelines for National Greenhouse Gas Inventories, Volume 2: Energy, Chapter 2: Stationary Combustion
(corrected chapter as of April 2007), IPCC, 2006
26 The study “Development of grid GHG emission factors for power systems of Russia” commissioned by “Carbon
Trade and Finance” in 2008.

JOINT IMPLEMENTATION PROJECT DESIGN DOCUMENT FORM - Version 01
Joint Implementation Supervisory Committee page 63
This template shall not be altered. It shall be completed without modifying/adding headings or logo, format or font.
The Study recommends using of the Operating Margin Emission Factor for the case of reduction of power
consumption from the electricity grid. The Operating Margin Emission Factor of RES “Centre” was defined
using Simple OM method. The value of this factor is used as the CO2 emission factor for electricity
consumption for calculation project and baseline emissions and is presented below:
,ELECCOEF
2 = 0.526 tCO2/MWh.
This is ex-ante for period 2008-2012.
Calculation emission factors for electricity and heat consumption
These emission factors were calculated according to formulas 6 and 13 (please Section D). The initial data
and results of calculation are presented in Table Anx.2.5.
Table Anx.2.5: The initial data and results of emission factors calculation
Indicator Unit 2007 2008 2009 Total/
Average
Emission factor for electricity
Electricity grid
Electricity consumption from grid MWh 3,111,349 2,966,975 2,344,462 8,422,786
Grid electricity emission factor tCO2/MWh 0.526 0.526 0.526 0.526
Emission associated with electricity
consumption from grid tCO2 1,636,570 1,560,629 1,233,187 4,430,386
NLMK CHPP
Total fuel consumption t.c.e 1,778,230 1,712,998 1,619,027 5,110,255
Natural gas t.c.e 317,287 349,254 467,908 1,134,450
% 17.8 20.4 28.9 22.2
Heavy fuel oil t.c.e 89 4,251 9,652 13,993
% 0.01 0.2 0.6 0.3
Coke oven gas t.c.e 588,077 545,330 284,739 1,418,146
% 33.1 31.8 17.6 27.8
Blast furnace gas t.c.e 872,776 814,163 856,727 2,543,667
% 49.1 47.5 52.9 49.8
Electricity output MWh 2,027,097 2,001,374 1,870,000 5,898,472
Specific fuel consumption per 1 MWh kg.c.e./MWh 454.32 452.65 440.28 449.30
GJ/MWh 13.3 13.3 12.9 13.2
Total fuel consumption for electricity generation GJ 26,992,148 26,551,666 24,130,796 77,674,609
Natural gas consumption for electricity
generation GJ 4,816,176 5,413,474 6,973,944 17,203,594
Natural gas emission factor tCO2/GJ 0.0561 0.0561 0.0561 0.0561
Emission from natural gas burning tCO2 270,187 303,696 391,238 965,122
Heavy fuel oil consumption for electricity
generation GJ 1,352 65,893 143,864 211,108
Heavy fuel oil emission factor tCO2/GJ 0.0774 0.0774 0.0774 0.0774
Emission from heavy fuel oil burning tCO2 105 5,100 11,135 16,340
Coke oven gas consumption for electricity GJ 8,926,557 8,452,675 4,243,893 21,623,125

JOINT IMPLEMENTATION PROJECT DESIGN DOCUMENT FORM - Version 01
Joint Implementation Supervisory Committee page 64
This template shall not be altered. It shall be completed without modifying/adding headings or logo, format or font.
Indicator Unit 2007 2008 2009 Total/
Average
generation
Coke oven gas emission factor tCO2/GJ 0.0444 0.0444 0.0444 0.0444
Emission from coke oven gas burning tCO2 396,339 375,299 188,429 960,067
Blast furnace gas consumption for electricity
generation GJ 13,248,063 12,619,624 12,769,095 38,636,782
Blast furnace gas emission factor tCO2/GJ 0.2600 0.2600 0.2600 0.2600
Emission from blast furnace gas burning tCO2 3,444,496 3,281,102 3,319,965 10,045,563
Emission factor for electricity
Total electricity consumption at NLMK MWh 5,138,446 4,968,349 4,214,463 14,321,258
Total emission associated with electricity tCO2 5,747,697 5,525,826 5,143,954 16,417,477
Average emission factor for electricity tCO2/MWh 1.119 1.112 1.221 1.146
Emission factor for heat
NLMK CHPP heat output Gcal 3,531,324 3,407,723 3,301,895 10,240,941
GJ 14,785,652 14,268,135 13,825,032 42,878,819
Specific fuel consumption per 1 Gcal kg.c.e/Gcal 170.50 170.04 171.22 170.58
GJ/Gcal 5.0 5.0 5.0 5.0
Total fuel consumption for electricity generation GJ 17,646,676 16,983,075 16,569,854 51,199,605
Natural gas consumption for electricity
generation GJ 3,148,675 3,462,586 4,788,787 11,400,048
Natural gas emission factor tCO2/GJ 0.0561 0.0561 0.0561 0.0561
Emission from natural gas burning tCO2 176,641 194,251 268,651 639,543
Heavy fuel oil consumption for electricity
generation GJ 884 42,147 98,787 141,817
Heavy fuel oil emission factor tCO2/GJ 0.0774 0.0774 0.0774 0.0774
Emission from heavy fuel oil burning tCO2 68 3,262 7,646 10,977
Coke oven gas consumption for electricity
generation GJ 5,835,921 5,406,531 2,914,147 14,156,600
Coke oven gas emission factor tCO2/GJ 0.0444 0.0444 0.0444 0.0444
Emission from coke oven gas burning tCO2 259,115 240,050 129,388 628,553
Blast furnace gas consumption for electricity
generation GJ 8,661,196 8,071,811 8,768,133 25,501,140
Blast furnace gas emission factor tCO2/GJ 0.2600 0.2600 0.2600 0.2600
Emission from blast furnace gas burning tCO2 2,251,911 2,098,671 2,279,715 6,630,296
Emission factor for heat
Total emission associated with heat generation tCO2 2,687,735 2,536,234 2,685,400 7,909,369
Emission factor for heat generation tCO2/GJ 0.182 0.178 0.194 0.184
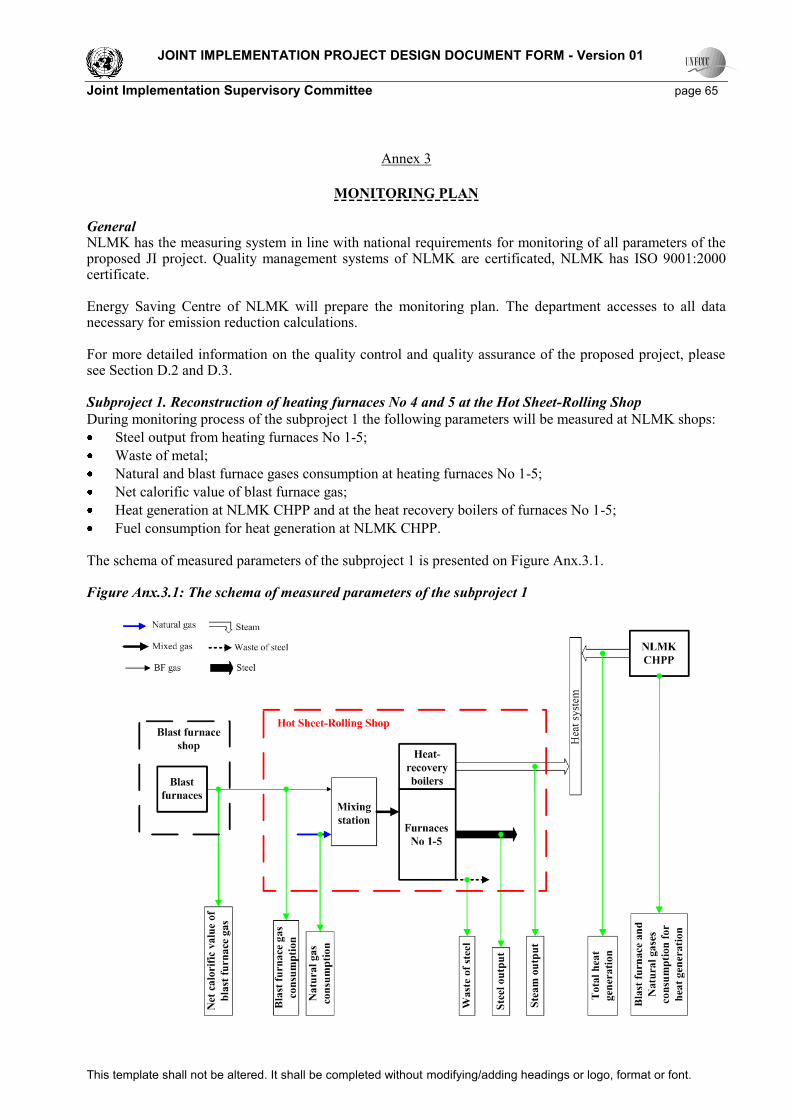
JOINT IMPLEMENTATION PROJECT DESIGN DOCUMENT FORM - Version 01
Joint Implementation Supervisory Committee page 65
This template shall not be altered. It shall be completed without modifying/adding headings or logo, format or font.
Annex 3
MONITORING PLAN
General NLMK has the measuring system in line with national requirements for monitoring of all parameters of the proposed JI project. Quality management systems of NLMK are certificated, NLMK has ISO 9001:2000 certificate. Energy Saving Centre of NLMK will prepare the monitoring plan. The department accesses to all data necessary for emission reduction calculations. For more detailed information on the quality control and quality assurance of the proposed project, please see Section D.2 and D.3. Subproject 1. Reconstruction of heating furnaces No 4 and 5 at the Hot Sheet-Rolling Shop
During monitoring process of the subproject 1 the following parameters will be measured at NLMK shops:
Steel output from heating furnaces No 1-5;
Waste of metal;
Natural and blast furnace gases consumption at heating furnaces No 1-5;
Net calorific value of blast furnace gas;
Heat generation at NLMK CHPP and at the heat recovery boilers of furnaces No 1-5;
Fuel consumption for heat generation at NLMK CHPP. The schema of measured parameters of the subproject 1 is presented on Figure Anx.3.1. Figure Anx.3.1: The schema of measured parameters of the subproject 1

JOINT IMPLEMENTATION PROJECT DESIGN DOCUMENT FORM - Version 01
Joint Implementation Supervisory Committee page 66
This template shall not be altered. It shall be completed without modifying/adding headings or logo, format or font.
The net calorific value of natural gas will be provided by supplier every month. For more detail information of the measured parameters for project and baseline scenario, please see Sections D.1.1.1 and D.1.1.3, respectively. The following fixed parameters will be used for estimation of emissions in project or baseline scenarios:
The default IPCC CO2 emission factors of natural, blast furnace gases and heavy fuel oil;
Specific fuel consumption of furnaces No 1-5 before the reconstruction of the furnaces No 4 and 5;
The default IPCC CO2 emission factor for Basic Oxygen Furnace;
Specific waste of steel of the furnaces No 1-5 before the reconstruction of the furnaces No 4 and 5.
Description, sources of data and values of these fixed parameters are presented in Section B.1 in tabular
form.
The project, baseline emissions and emission reduction of the subproject 1 are calculated according to the
formulae are presented in Sections D.1.1.2, D.1.1.3 and D.1.4, respectively.
Subproject 2. Commissioning the hydrogen plant based on steam reforming of natural gas technology
During monitoring process of the subproject 2 the following parameters will be measured at NLMK shops:
Generated volume of hydrogen at new hydrogen plant;
Natural gas consumption at new hydrogen plant;
Electricity consumption at new hydrogen plant;
Total electricity consumption at NLMK from grid;
Electricity generation at NLMK CHPP;
Fuel consumption for electricity generation at NLMK CHPP;
Heat generation at NLMK CHPP;
Fuel consumption for heat generation at NLMK CHPP. The schema of measured parameters of the subproject 2 is presented on Figure Anx.3.2. Figure Anx.3.2: The schema of measured parameters of the subproject 2
The net calorific value of natural gas will be provided by supplier every month.

JOINT IMPLEMENTATION PROJECT DESIGN DOCUMENT FORM - Version 01
Joint Implementation Supervisory Committee page 67
This template shall not be altered. It shall be completed without modifying/adding headings or logo, format or font.
For more detail information of the measured parameters for project and baseline scenario, please see Sections D.1.1.1 and D.1.1.3, respectively. The following fixed parameters will be used for estimation of emissions in project or baseline scenarios:
The default IPCC CO2 emission factors of natural, blast furnace gases and heavy fuel oil;
The CO2 emission factor for electricity consumption from grid;
Specific electricity consumption per 1000 m3 of hydrogen for electrolysis installations;
Specific steam consumption per 1000 m3 of hydrogen for electrolysis installations;
The CO2 emission factor for electricity consumption from grid.
Description, sources of data and values of these fixed parameters are presented in Section B.1 in tabular
form and in Annex 2 (CO2 emission factor for electricity consumption from grid).
The project, baseline emissions and emission reduction of the subproject 2 are calculated according to the
formulae are presented in Sections D.1.1.2, D.1.1.3 and D.1.4, respectively.