Joint Committee on TRS Health Benefit Plans: TRS … Documents/joint_committee...Joint Committee on...
66
Teacher Retirement System of Texas Teacher Retirement System of Texas Joint Committee on TRS Health Benefit Plans: TRS-ActiveCare April 13, 2016
Transcript of Joint Committee on TRS Health Benefit Plans: TRS … Documents/joint_committee...Joint Committee on...

Teacher Retirement System of TexasTeacher Retirement System of Texas
Joint Committee on TRS Health Benefit Plans: TRS-ActiveCare
April 13, 2016

Coverage varied significantly from district to district.
Many districts found it difficult to provide stable health care coverage.
Most districts were unable to provide coverage comparable to ERS HealthSelect as required by law.
In 1996, TRS administered elective district-participation health plan for public school employees:
Minimal district participation (peak of 3 districts participating, 327 covered lives)
No district participation after FY1999
History of TRS-ActiveCare
Prior to 2001
2001-2002
The Texas School Employees Uniform Group Health Coverage program (H.B. 3343) was passed by the 77th Texas Legislature.
TRS was given the authority to begin plan management of TRS-ActiveCare.
The bill required districts with less than 500 employees to participate in the health plan with coverage to be effective September 1, 2002. If on January 1, 2001 the school district was individually self-funded, it could elect not to participate in the program.
The State’s annual contribution was set at $900 per employee per year, or $75 per employee per month.
The school district’s annual contribution was set at $1,800 per employee per year, or $150 per employee per month.
2
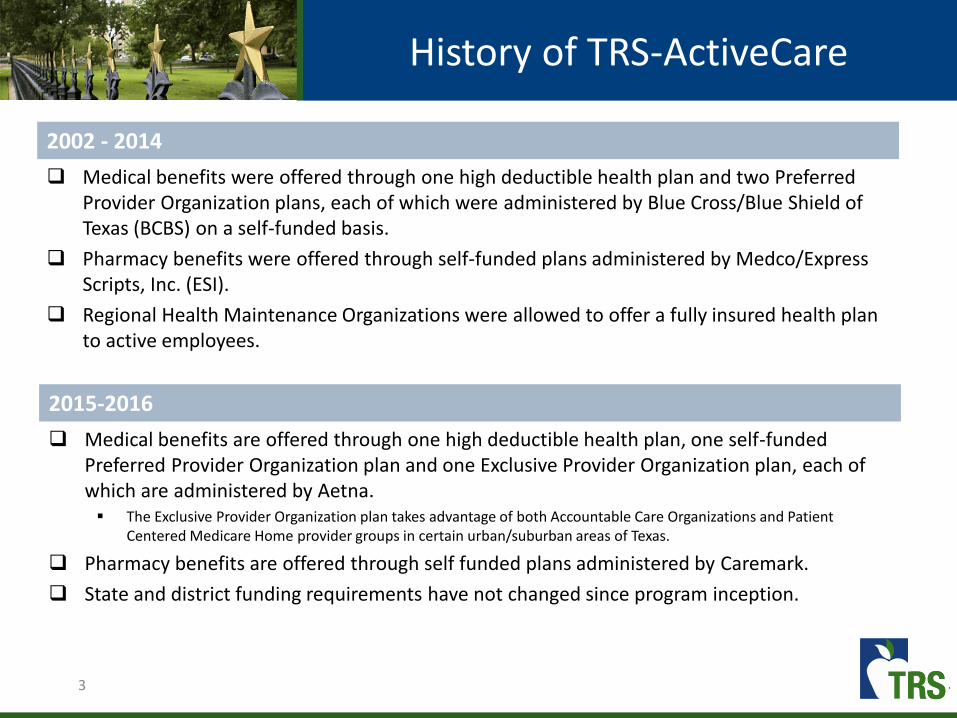
Medical benefits were offered through one high deductible health plan and two Preferred Provider Organization plans, each of which were administered by Blue Cross/Blue Shield of Texas (BCBS) on a self-funded basis.
Pharmacy benefits were offered through self-funded plans administered by Medco/Express Scripts, Inc. (ESI).
Regional Health Maintenance Organizations were allowed to offer a fully insured health plan to active employees.
History of TRS-ActiveCare
2002 - 2014
Medical benefits are offered through one high deductible health plan, one self-funded Preferred Provider Organization plan and one Exclusive Provider Organization plan, each of which are administered by Aetna. The Exclusive Provider Organization plan takes advantage of both Accountable Care Organizations and Patient
Centered Medicare Home provider groups in certain urban/suburban areas of Texas.
Pharmacy benefits are offered through self funded plans administered by Caremark.
State and district funding requirements have not changed since program inception.
2015-2016
3

History of TRS-ActiveCare
4

TRS-ActiveCare Participation
Entity Type # Eligible #Participating % Participation
Less than 500 816 801 98.2%
500-1,000 102 90 88.2%
More than 1,000 106 56 52.8%
Charter Schools 173 130 75.1%
Education Service Centers 20 20 100%
Other Ed 5 5 100%
Total 1,222 1,102 90.2%
5
The largest school districts participating in TRS-ActiveCare are Dallas ISD, Cypress Fairbanks ISD, and Fort Worth ISD.
The largest school districts that are not in the plan are Houston ISD, Austin ISD and San Antonio districts.

TRS-ActiveCare 1-HD TRS-ActiveCare Select TRS-ActiveCare-2
Deductible $2,500/$5,000 $1,200/$3,600 $1,000/$3,000
Maximum Out-of-Pocket1 $6,450/$12,900 $6,600/$13,200 $6,600/$13,200
Preventive Services Plan pays 100% Plan pays 100% Plan pays 100%
Coinsurance 80%/20% 80%/20% 80%/20%
Hospital Facility 80%/20%$150 copay per day,
plus 20% ($750 max copay)$150 copay per day,
plus 20% ($750 max copay)
Physician Office Visits 80%/20%$30 Primary Care Physician
copay$60 Specialist copay
$30 Primary Care Physiciancopay
$50 Specialist copay
Urgent Care Center 80%/20% $50 copay $50 copay
Teledoc $40 consult fee Plan pays 100% Plan pays 100%
Bariatric Surgery$5,000 copay plus 20%
after deductibleNot covered
$5,000 copay plus 20% after deductible
Prescription Drug 80%/20% See Slide 9 See Slide 9
FY2016 Benefit Structure
1 Maximum Out-of-Pocket includes deductible, coinsurance and copayments for both medical and pharmacy benefits, excluding Bariatric surgery cost share.
In-Network Benefits
6

FY2016 Benefit Structure
TRS-ActiveCare 1-HD TRS-ActiveCare Select TRS-ActiveCare-2
Deductible $2,500/$5,000
No out-of-network benefits
$1,000/$3,000
Maximum Out-of-Pocket1 $6,450/$12,900 $6,600/$13,200
Preventive Services 60%/40% 60%/40%
Coinsurance 60%/40% 60%/40%
Hospital Facility 60%/40%$150 copay per day,
plus 40%
Physician Office Visits 60%/40% 60%/40%
Urgent Care Center 60%/40% 60%/40%
Bariatric Surgery Not covered Not covered
1 Maximum Out-of-Pocket includes deductible, coinsurance and copayments for medical benefits.
Out-of-Network Benefits
7

FY2016 Benefit Structure
Pharmacy Benefits
TRS-ActiveCare Select TRS-ActiveCare 2
Deductible for Brand Name Drugs $200 per individual $200 per individual
Retail Short Term (1-31 days supply)1
Generic $20 copay $20 copay
Preferred Brand $40 copay $40 copay
Non-Preferred Brand 50% coinsurance $65 copay
Retail Plus (60-90 days supply)
Generic $45 copay $45 copay
Preferred Brand $105 copay $105 copay
Non-Preferred Brand 50% coinsurance $180 copay
Mail Order
Generic $45 copay $45 copay
Preferred Brand $105 copay $105 copay
Non-Preferred Brand $50% coinsurance $180 copay
Specialty Drugs 20% coinsurance per fill$200 per fill (1-31 days supply)
$450 per fill (32-90 days supply)1 Retail Maintenance drugs copays are an additional $5, $10 or $15 if the member continues to have the script filled at a retail pharmacy.8
FY2016 ActiveCare Gross Premiums
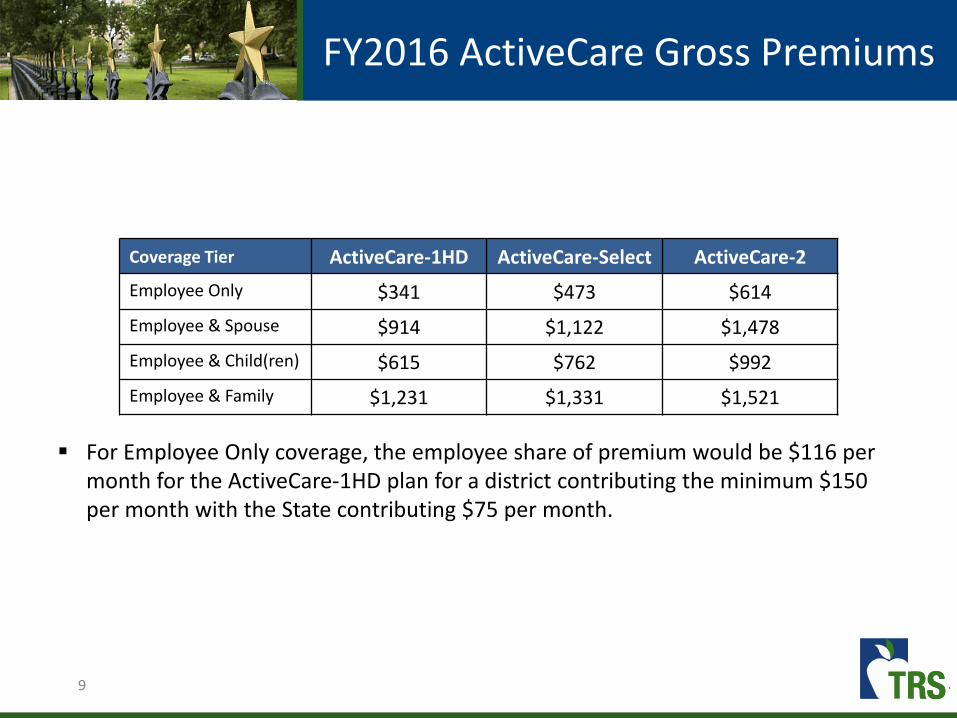
For Employee Only coverage, the employee share of premium would be $116 per month for the ActiveCare-1HD plan for a district contributing the minimum $150 per month with the State contributing $75 per month.
Coverage Tier ActiveCare-1HD ActiveCare-Select ActiveCare-2
Employee Only $341 $473 $614
Employee & Spouse $914 $1,122 $1,478
Employee & Child(ren) $615 $762 $992
Employee & Family $1,231 $1,331 $1,521
9

History of Participation by Plan
10

Current ParticipationCoverage Tier
Participant Count as of December 2015
11
Coverage Tier ActiveCare 1-HD ActiveCare 2ActiveCare Select
(Open Access)ActiveCare Select
(ACO Area)Total
Employee Only 110,547 45,989 22,271 17,614 196,421Employee & Spouse 8,570 4,206 2,230 1,276 16,282Employee & Child 66,172 38,415 24,131 17,077 145,795Employee & Family 17,001 39,472 9,027 5,407 70,907Total 202,290 128,082 57,659 41,374 429,405

TRS-ActiveCareFunding Sources FY2015
State Contributions:$75 per employee per month
District Contributions:Minimum of $150 per employee per month
Active Employees:Active employees share of premium is equal to the balance of project costs.
Other Income:Includes administrative income and investment income.
Notes: (1) State and District funding is based on a fixed dollar amount per employee rather than actual health care costs. (2) Minimum District contribution is $150 per employee per month, however based on an informal survey, 67 percent of districts contribute more, estimated to be between $474 and $680 million.(4) In addition to employee premiums, members paid a total of $516 million in out-of-pocket expenses (deductibles, copayments and coinsurance).
12
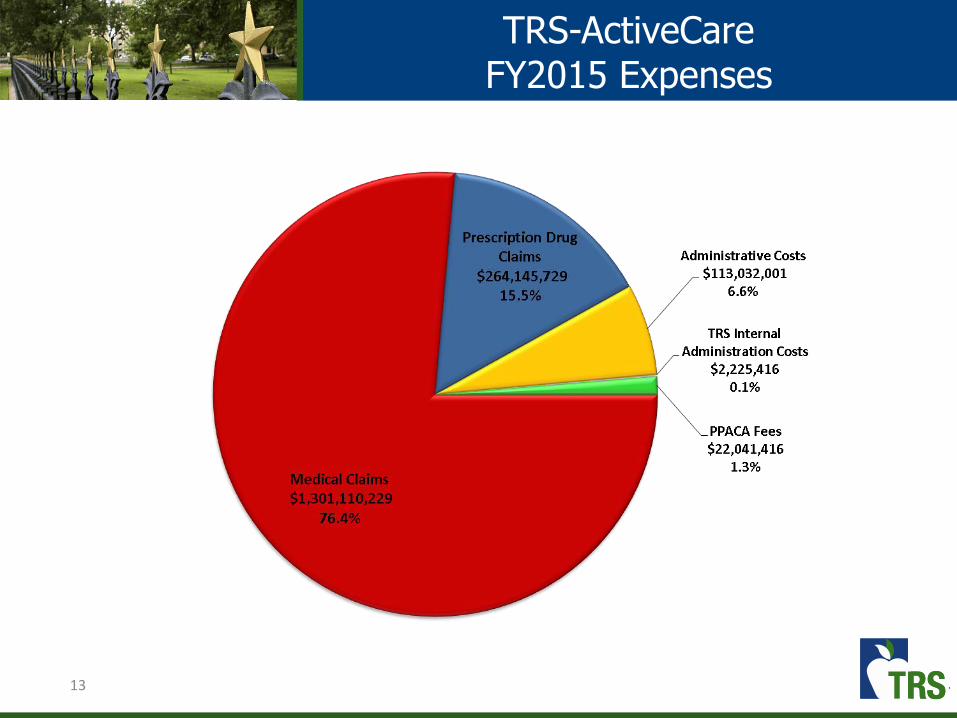
TRS-ActiveCareFY2015 Expenses
13

TRS-ActiveCareAverage Per Member Per Year Plan Cost
14
For FY2015, the plan has paid about $3,648 per member per year in claims.
In addition, members paid about $1,195 per member per year in out-of-pocket costs (deductible, copay and coinsurance).

15
TRS-ActiveCare FundingFinancial History Through FY 2015
• Because State and District minimum contributions have not changed since the inception of TRS-ActiveCare, active employee contributions are raised each year to cover the projected expenses.
Fiscal
Year
State
Contributions
Employee &
District
Contributions
HMO PremiumsInvestment
IncomeTotal Revenue Medical Incurred
Drug Incurred ( includes
R ebates)
HMO Premium
Payments
Administrative
CostsTotal Expenses
Ending Balance
(Incurred Basis)
FY 2003 $210,234,158 $374,338,694 $0 $2,456,654 $587,029,506 $473,450,544 $44,140,954 $517,591,498 $136,293,600
FY 2004 $121,389,184 $596,462,829 $0 ($38,041,707) $679,810,306 $520,998,423 $54,734,179 $575,732,602 $240,371,304
FY 2005 $133,958,840 $647,192,860 $0 $8,949,525 $790,101,225 $663,361,138 $55,264,847 $718,625,985 $311,846,543
FY 2006 $140,306,296 $671,691,759 $0 $18,650,516 $830,648,571 $708,972,484 $54,587,233 $763,559,716 $379,198,205
FY 2007 $152,715,758 $727,581,192 $59,397,078 $26,016,380 $965,710,409 $659,478,760 $141,670,202 $58,742,363 $49,722,225 $909,613,550 $435,295,063
FY 2008 $167,969,604 $859,647,820 $68,919,598 $21,164,640 $1,117,701,662 $788,240,087 $163,916,252 $68,204,743 $56,165,020 $1,076,526,102 $476,470,624
FY 2009 $180,685,094 $926,046,048 $65,450,125 $11,597,992 $1,183,779,259 $934,733,927 $187,913,031 $64,820,440 $62,543,593 $1,250,010,991 $410,238,892
FY 2010 $199,429,983 $1,065,796,644 $65,169,943 $6,421,269 $1,336,817,839 $1,092,107,916 $221,006,281 $64,532,253 $69,600,153 $1,447,246,603 $299,810,127
FY 2011 $219,054,635 $1,250,884,807 $77,011,976 $3,387,062 $1,550,338,480 $1,242,673,156 $267,417,825 $76,270,706 $75,717,493 $1,662,079,180 $188,069,427
FY 2012 $231,988,092 $1,427,352,724 $90,594,006 $1,697,553 $1,751,632,375 $1,450,574,875 $268,328,770 $89,706,406 $85,314,414 $1,893,924,465 $45,777,337
FY 2013 $232,288,848 $1,474,353,638 $101,879,198 $746,936 $1,809,268,619 $1,512,262,090 $272,807,678 $100,905,703 $87,041,609 $1,973,017,079 ($117,971,123)
FY 2014 $230,047,826 $1,542,510,549 $156,337,090 $940,021 $1,929,835,486 $1,242,335,376 $279,499,612 $154,913,860 $112,276,403 $1,789,025,250 $22,839,113
FY 2015 $237,112,075 $1,526,254,615 $180,582,576 $1,537,408 $1,945,486,674 $1,301,110,229 $264,145,730 $178,192,468 $137,062,084 $1,880,510,511 $87,815,276
Revenue Expenses

TRS-ActiveCare-2Premium Increase History
16
Employee contributions for TRS-ActiveCare-2 have increased 332% since the inception of the plan.
Increase in Gross Premiums
Fiscal Year ActiveCare-1 ActiveCare-1HDActiveCare -
SelectActiveCare-2 ActiveCare-3
FY2004 5.0% - - 5.0% 5.0%
FY2006 0.0% - - 0.0% 6.5%
FY2008 7.0% - - 7.0% 7.0%
FY2010 4.5% Initial Rates - 4.5% 4.5%
FY2011 7.0% 7.0% - 7.0% 7.0%
FY2012 9.5% 9.5% - 9.5% 9.5%
FY2013 4.0% 4.0% - 6.0% 9.0%
FY2014 Discontinued 9.1 - 22.7% - 15.0% 25.0%(Closed to new enrollees)
FY2015 - 0 - 8.0% Initial Rates 0 - 7.0% Discontinued
FY2016 - 4.9 - 7.5% 5.1 - 7.5% 10.6 - 15.0% -

Assuming current benefit and funding levels, the table below shows the necessary rate increase, based on experience through December 2015, in order to remain solvent through the end of each fiscal year.
17
Fiscal YearGross Premium
Increase
Increase to Employee
Contributions
2017 6% − 14% 17%
2018 2% − 5% 5%
2019 5% − 11% 12%
2020 5% − 10% 11%
2021 5% − 10% 11%
TRS-ActiveCare Funding

2014 Affordability Study
Key Findings
During the 2014 interim, TRS conducted a study on the affordability of TRS-ActiveCare.
TRS-ActiveCare has an affordability issue.
State and minimum district contributions have not changed since the inception of the program in 2002.
The employee’s share of the total premium cost has increased significantly. As premiums have increased, employees are selecting lower benefit plans.
Districts that do not participate in TRS-ActiveCare and administer their own plans may feel more accountable for the affordability of coverage.
There is a disparity between TRS-ActiveCare benefits and premiums in comparison to what is available to Texas state employees (under ERS).
18

Funding is based on a fixed dollar amount per employee per month rather than actual health care costs.
Minimum State ($75 per employee per month) and district contributions ($150 per employee per month) have not changed since plan inception in FY2002.
The employee share of premiums have increased from 30% to more than 60% over the last 12 years.
TRS-ActiveCare Contribution Rates
19

Source: Kaiser / Health Research and Educational Trust (HRET) Survey of Employer-Sponsored Health Benefits, 1999-2015.20
TRS-ActiveCare Contribution Rates
21
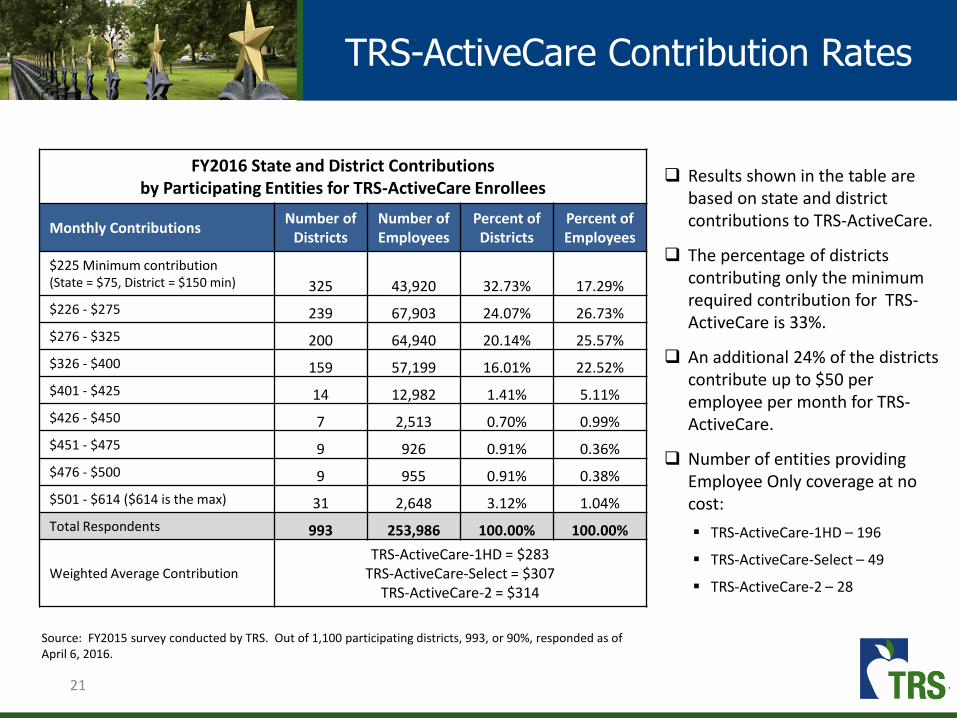
TRS-ActiveCare Contribution Rates
Results shown in the table are based on state and district contributions to TRS-ActiveCare.
The percentage of districts contributing only the minimum required contribution for TRS-ActiveCare is 33%.
An additional 24% of the districts contribute up to $50 per employee per month for TRS-ActiveCare.
Number of entities providing Employee Only coverage at no cost:
TRS-ActiveCare-1HD – 196
TRS-ActiveCare-Select – 49
TRS-ActiveCare-2 – 28
FY2016 State and District Contributionsby Participating Entities for TRS-ActiveCare Enrollees
Monthly Contributions Number of
DistrictsNumber of Employees
Percent of Districts
Percent of Employees
$225 Minimum contribution(State = $75, District = $150 min) 325 43,920 32.73% 17.29%
$226 - $275 239 67,903 24.07% 26.73%
$276 - $325 200 64,940 20.14% 25.57%
$326 - $400 159 57,199 16.01% 22.52%
$401 - $425 14 12,982 1.41% 5.11%
$426 - $450 7 2,513 0.70% 0.99%
$451 - $475 9 926 0.91% 0.36%
$476 - $500 9 955 0.91% 0.38%
$501 - $614 ($614 is the max) 31 2,648 3.12% 1.04%
Total Respondents 993 253,986 100.00% 100.00%
Weighted Average Contribution
TRS-ActiveCare-1HD = $283TRS-ActiveCare-Select = $307
TRS-ActiveCare-2 = $314
Source: FY2015 survey conducted by TRS. Out of 1,100 participating districts, 993, or 90%, responded as of April 6, 2016.

Option Description
Option 1 Increase funding1(a) Increase State and District funding to achieve a 70% contribution rate1(b) Increase actuarial value (AV) to achieve FY2003 AV level
Option 2 Offer a single plan: High Deductible Health Plan with an Health Savings Account
Option 3 Offer a single plan: Exclusive Provider Organization plan with high performance networks
Option 4 Establish premiums based on age and/or geographic area
Option 5 Eliminate coverage for spouses
Committee Charge Allow districts to opt-out of TRS-ActiveCare
2016 Affordability Study
22

Option 1(a)Restore funding ratios to FY2003 level
Option 1(a) Restore funding ratios to FY2003 level
Assumptions:
In FY2003, employees paid 28.6% of the cost of ActiveCare 2 Employee Only premium. The combined State and minimum District contribution was 71.4%.
In FY2016, that ratio is 63.4% for employees and 36.6% for the State and District.
*Responses to an informal survey of districts indicate that 325 districts contribute the minimum of $150 while 668 districts contribute more towards the cost of coverage.
The average district contribution is approximately $221 per month.
23
TRS-ActiveCare-2Employee Only Coverage
Funding Source FY2003 FY2016
State Contribution $75 23.8% $75 12.2%
Minimum District Contribution $150 47.6% $150* 24.4%
Employee Contribution $90 28.6% $389 63.4%
Total Gross Premium $315 100.0% $614 100.0%

24
Projected Additional Cost over Current Funding Levels
Fiscal Year Contribution Assumptions State District Active Employees
FY2017 $75 State + $150 District = $225 $0 $0 $0
FY2018 $158 State + $318 District = $476 $272,506,224 $546,226,392 ($506,839,980)
FY2019 $171 State + $343 District = $514 $314,349,636 $627,885,000 ($455,649,900)
FY2020 $185 State + $370 District = $555 $359,033,688 $716,721,204 ($400,721,556)
FY2021 $200 State + $400 District = $600 $407,559,792 $813,526,500 ($341,983,788)
Option 1(a)Return funding ratios to FY2003 level
Total Funding Projection
Fiscal Year State District Active Employees
FY2017 $244,190,700 $488,381,400 $1,139,974,812
FY2018 $516,696,924 $1,034,607,792 $633,134,832
FY2019 $558,540,336 $1,116,266,400 $684,324,912
FY2020 $603,224,388 $1,205,102,604 $739,253,256
FY2021 $651,750,492 $1,301,907,900 $797,991,024
The tables below show the impact of restoring the FY2003 funding ratios each plan year based on the following assumptions:
Annual increase in gross premiums of 8.0%; State and District contribution of 71% (or 23.7% and 47.3% of gross premium, respectively); Employee contribution of 29.0% of gross premium.

Option 1(b)Restore benefits to FY2003 level
Option 1(b) Restore benefits to FY2003 level
In FY2003, districts with 500 or less active employees were required to participate in the TRS-ActiveCare program in which three benefit plans were offered.
TRS-ActiveCare 3 was originally designed to be comparable to the ERS plan offered to State employees.
25
FY2003 In-Network Benefits
Benefit Provision TRS-ActiveCare 1 TRS-ActiveCare 2 TRS-ActiveCare 3
Individual/FamilyDeductible
$1,000/$3,000 $500/$1,500 $0
Coinsurance 80%/20% 80%/20% 90%/10%
Maximum Out-of-Pocket $2,000/$6,000 $2,000/$6,000 $500
Inpatient Hospital Admit 80%/20% Deductible & Coinsurance $0
Emergency Room Visit 80%/20% Deductible & Coinsurance $50 copay
Physician Office Visit 80%/20% $25 copay $15 copay
Prescription DrugIntegrated with medical benefit
Retail $5/$25/$45Mail $10/$50/$90
Retail $5/$25/$45Mail $10/$50/$90
1 Generic/Preferred Brand/Non-Preferred Brand

Option 1(b)Restore benefits to FY2003 level
Both the original TRS-ActiveCare 1 and TRS-ActiveCare 3 plans were discontinued effective 8/31/2013 and 8/31/2014 respectively.
Benefits have decreased for TRS-ActiveCare 2, the only original plan still offered to public education employees.
26
FY2016 In-Network Benefits
Benefit Provision TRS-ActiveCare 1-HD TRS-ActiveCare Select TRS-ActiveCare 2
Individual/FamilyDeductible
$2,500/$5,000 $1,200/$3,600 $1,000/$3,000
Coinsurance 80%/20% 80%/20% 80%/20%
Maximum Out-of-Pocket$6,450/$12,900
$6,600/$13,200(includes medical and pharmacy
benefits)
$6,600/$13,200(includes medical and pharmacy
benefits
Inpatient Hospital Admit80%/20%
$150 copay per day plus 20% after deductible ($750 max copay)
$150 copay per day plus 20% after deductible ($750 max copay)
Emergency Room Visit80%/20%
$150 copay plus 20% after deductible
$150 copay plus 20% after deductible
Physician Office Visit80%/20%
$30 Primary Care Physician copay$60 Specialist copay
$30 Primary Care Physician copay$50 Specialist copay
Prescription Drug1
Integrated with medical benefit
$200 brand drug deductible $200 brand drug deductible
Retail (1-31) $20/$40/50%/20%Mail (32-90) $45/$105/50%/20%
Retail (1-31) $20/$40/$65/$200Mail (32-90) $45/$105/$180/$450
1 Generic/Preferred Brand/Non-Preferred Brand/Specialty

TRS-ActiveCare-2
Benefit Provision FY2003 Benefits FY2016 Benefits
Individual/FamilyDeductible
$500/$1,000 $1,000/$3,000
Coinsurance 80%/20% 80%/20%
Maximum Out-of-Pocket
$2,000/$6,000(includes medical benefits
only)
$6,600/$13,200(includes medical and
pharmacy benefits
Inpatient Hospital Admit 80%/20% after deductible
$150 copay per day plus 20% after deductible ($750
max copay)
Emergency Room Visit
80%/20% after deductible$150 copay plus 20% after
deductible
Physician Office Visit$25 copay
$30 Primary Care Physician copay
$50 Specialist copay
Prescription Drug1 N/A $200 brand drug deductible
Retail $5/$25/$45Mail $10/$50/$90
Retail (1-31) $20/$40/$65/$200
Mail (32-90) $45/$105/$180/$450
Gross PremiumEmployee OnlyEmployee & SpouseEmployee & ChildEmployee & Family
$315$717$502$789
$614$1,478$992
$1,521
Option 1(b)Restore benefits to FY2003 level
If TRS had continued to offer the original FY2003 benefits, the current premium would increase from $614 to $711 for Employee Only coverage, or 15.8%.
If the State and District contributed 71% of the $711 premium, the employer share would increase to $505 per employee month.
27
1 Generic/Preferred Brand/Non-Preferred Brand/Specialty

28
Annual Cost Impact for Restoring Benefits to FY2003 Level
State District Active Employees
Current Funding Levels($75 State + $150 District = $225)1 $244,190,700 $488,381,400 $1,139,974,812
Funding Level Assumptions($75 State + $150 District = $225)1 $244,190,700 $488,381,400 $1,258,189,680
Change $0 $0 $118,241,8681 Assumes a minimum District contribution of $150 per employee per month.
Option 1(b)Restore benefits to FY2003 level
Assumptions:
TRS-ActiveCare-1HD enrollees are moved to original TRS-ActiveCare-1; TRS-ActiveCare-2 enrollees remain in original TRS-ActiveCare-2; TRS-ActiveCare-Select enrollees are moved to original TRS-ActiveCare-1; Because TRS-ActiveCare-3 was discontinued, it has not been included in this
option; Original plan designs have been modified to maintain compliance with the
Affordable Care Act (preventive benefits covered at 100%, integrated maximum out-of-pocket limit).
Results:
With no change in the minimum State and District contribution levels, gross premiums would increase by about 6.3%.

Preface to Options 2 & 3Offer a Single Health Plan
By offering multiple health plan options for employees, along with an annual open enrollment opportunity, the opportunity for adverse selection exists.
Adverse selection is the case in which employees/families with the most complex medical conditions enroll in the plan offering the richest benefits. Each year as the premiums increase for that plan, the healthier participants migrate back to a less expensive plan causing the premium for the richest benefits to increase significantly.
TRS-ActiveCare 3 experienced this increase and was discontinued effective 8/31/2014 as a result.
Options 2 & 3 are based on single plan offering to all employees of districts participating in TRS-ActiveCare.
Assumes that the fully insured HMO’s are discontinued as well.
In the areas in which these plans are offered alongside the TRS-ActiveCareplans, the HMO’s attract the healthier employees. The premiums paid to the HMOs for coverage leave the TRS-ActiveCare fund and are, therefore, not part of the pool to pay claims for the less healthy remaining population.
29

Option 2High Deductible Health Plan with a Health Savings Account
Option 2 Offer a single plan: High Deductible Health Plan with Health Savings Account
Assumes that TRS-ActiveCare 1-HD is the only plan option available.
This plan meets the IRS requirements for an HSA qualified High Deductible Health plan.
Assumes employer contribution of $400 per month ($350 for the premium and $50 for the Health Savings Account).
The employer may contribute more to the Health Savings Account.
Employees may contribute to the Health Savings Account up to a maximum total
contribution of $3,350 for individual or $6,750 for family coverage.1
Eliminates adverse selection between plan options.
Retains premiums that would have been paid to HMOs.
30 1 Calendar year 2016 IRS limits for the combined employee and employer combined contribution.

Option 2High Deductible Health Plan with a Health Savings Account
If this single plan had been offered for FY2016, the average gross premium would have been $562 per employee per month, which is 5.2% less than the projected average of $593.
If the State and District contribution increased to $350 per month toward the premiums shown above, then employees would contribute between $85 and $874 per month depending on the coverage tier selected.
If the State and District contributed $50 per month to the Health Savings Account, then employees could contribute up to $2,750 per year for individual coverage or $6,150 per year for family coverage.1 These funds can be used to pay for medical and pharmacy out-of-pocket costs.
While for some plans the single option premium would represent a decrease from the current premiums, the money that would have been paid in premiums will now go to pay out of pocket expenses due to increased member cost share requirements.
31
Coverage Tier
Current FY2016 Gross PremiumsSingle Plan Option in
FY2016
TRS-ActiveCare 1-HDTRS-ActiveCare
SelectTRS-ActiveCare 2 TRS-ActiveCare 1-HD
Employee Only $341 $473 $614 $435
Employee & Spouse $914 $1,122 $1,478 $1,106
Employee & Child(ren) $615 $762 $992 $739
Employee & Family $1,231 $1,331 $1,521 $1,224
1 Calendar year 2016 IRS limits for the combined employee and employer combined contribution.

Option 2High Deductible Health Plan with a Health Savings Account
32
Annual Cost Impact for TRS-ActiveCare 1-HD1
State District Active Employees
Current Funding LevelsPremium ($75 State + $150 District = $225)2
Health Savings Account ($0 State + $0 District = $0)Total
$270,853,200$0
$270,853,200
$541,706,400$0
$541,706,400
$1,314,424,295$0
$1,314,424,295
Funding Level AssumptionsPremium ($117 State + $233 District = $350)
Health Savings Account ($17 State + $33 District = $50)3
Total
$422,530,992$61,393,392
$483,924,384
$841,450,608$119,175,408$960,626,016
$790,092,948Determined by each employee
$790,092,948
Change $213,071,184 $418,919,616 ($524,331,347)1 Estimates are based on 300,948 currently enrolled TRS-ActiveCare and HMO employees.2 Assumes a minimum District contribution of $150 per employee per month.3 Assumes a minimum District contribution of $33 per employee per month.
With this option, employee contributions to the plan would decrease due to the transition to TRS-ActiveCare-1HD and an increase in State and District funding.
Employees will be able to use their premium contribution savings to pay for the corresponding increase in out-of-pockets costs. Employees could make contributions to their Health Savings Account, subject to the maximum permitted by law.

Option 3 Offer a single plan: Exclusive Provider Organization Plan with high performance networks
Assumes that TRS-ActiveCare Select is the only plan option available.
This plan has been offered since 9/1/2014 to active employees.
This plan includes limited networks in the areas where Accountable Care Organizations are available, broad network remainder of the state. There are no out-of-network benefits.
33
Option 3TRS-ActiveCare Select with High Performance Networks
TRS-ActiveCare Select Plan
Individual/Family Deductible $1,200/$3,600
Coinsurance 80%/20%
Maximum Out-of-Pocket $6,600/$13,200(includes medical and pharmacy benefits)
Inpatient Hospital Admit $150 copay per day plus 20% after deductible ($750 max copay)
Emergency Room Visit $150 copay plus 20% after deductible
Physician Office Visit $30 Primary Care Physician copay$60 Specialist copay
Prescription Drug1 $200 brand drug deductible
Retail (1-31) $20/$40/50%/20%Mail (32-90) $45/$105/50%/20%
Eliminates adverse selection between plan options.
Retains premiums that would have been paid to HMOs.

If this single plan had been offered for FY2016, the average gross premium would have been $606 per employee per month, which is 2.2% more than the projected average of $593).
If the State and District minimum contribution remained at $225 per employee per month, then the employee contribution would range from $244 to $1,095 based on coverage tier.
If the FY2003 contribution rates were reinstated, then the State and District contribution would be $141 and $283, respectively; the employee contribution would range from $45 to $896 based on coverage tier.
34
Option 3TRS-ActiveCare Select with High Performance Networks
Coverage Tier
Current FY2016 Gross Premiums Single Plan Option
TRS-ActiveCare 1-HDTRS-ActiveCare
SelectTRS-ActiveCare 2
TRS-ActiveCareSelect
Employee Only $341 $473 $614 $469
Employee & Spouse $914 $1,122 $1,478 $1,193
Employee & Child(ren) $615 $762 $992 $797
Employee & Family $1,231 $1,331 $1,521 $1,320

Option 3TRS-ActiveCare Select with High Performance Networks
35
Annual Cost Impact for TRS-ActiveCare Select1
State District Active Employees
Current Funding Levels($75 State + $150 District = $225)2 $270,853,200 $541,706,400 $1,314,424,295
Funding Level Assumptions($75 State + $150 District = $225) 2 $270,853,200 $541,706,400 $1,402,363,368
Change $0 $0 $87,939,0731 Estimates are based on 300,948 currently enrolled TRS-ActiveCare and HMO employees.2 Assumes a minimum District contribution of $150 per employee per month.
Annual Cost Impact for TRS-ActiveCare Select1
State District Active Employees
Current Funding Levels($75 State + $150 District = $225)2 $270,853,200 $541,706,400 $1,314,424,295
Funding Level Assumptions($141 State + $283 District = $424)3 $509,204,016 $1,022,019,408 $683,706,708
Change $238,350,816 $480,313,008 ($630,717,587)
If FY2003 funding ratios are restored, then the State and District contributions would increase by 88%.
1 Estimates are based on 300,948 currently enrolled TRS-ActiveCare and HMO employees.2 Assumes a minimum District contribution of $150 per employee per month.3 Assumes a minimum District contribution of $283 per employee per month.

Option 4Establish Premiums Based on Age and/or Geographic Area
Option 4 Establish premiums based on age and/or geographic area
Under current law, TRS-ActiveCare is required to offer uniform statewide coverage. Premium contributions do not vary by age or geographic area.
Because of the statewide uniform rating, employees who reside in lower cost geographic areas are subsidizing those in the higher cost areas. Additionally, lower cost employees (younger and/or healthier) are subsidizing the higher cost employees.
In 2014, carriers began marketing health care plans to individuals on the federal public exchange. In addition to the benefits, premiums for these plans vary by age and geographic area.
Younger, healthier employees and those in areas where medical costs are lower than the statewide average may find coverage comparable to TRS-ActiveCare plans on the federal public exchange at a lower cost.
As more lower cost employees exit the plan, TRS-ActiveCare is left with a larger concentration of enrollees with higher claim costs and fewer low cost enrollees to offset those costs.
36

Age Rating
The age rating factors used by health plans on the public exchange in Texas include a 3:1 slope, which is similar to the FY2015 TRS-ActiveCare experience.
Normalizing the factors to an individual age 40, younger, healthier employees and spouses may look to the federal public exchange to try and find a comparable plan at a lower cost based on their geographic area.
37
Option 4Establish Premiums Based on Age and/or Geographic Area

Rating by geographic area could be performed a number of ways:
County
Texas has 254 counties and would be administratively burdensome.
Districts can span multiple counties.
Metropolitan Statistical Area (MSA)
Groups counties with large population densities. Rating area used for the public exchange. Districts can span multiple Metropolitan Statistical Areas. Non-metropolitan counties span a large geographical area
with varying costs.
Education Service Center
School districts are divided into twenty regions. One-to-one correlation between district and Education
Service Center. May be easier to administer than a more granular approach.
38
Option 4Establish Premiums Based on Age and/or Geographic Area
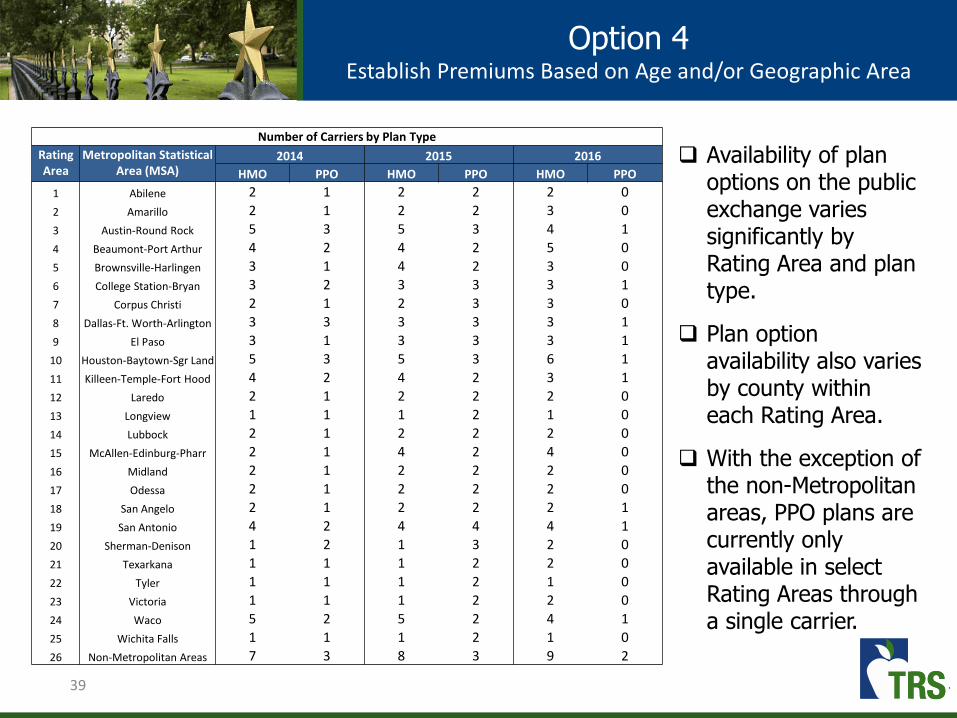
Availability of plan options on the public exchange varies significantly by Rating Area and plan type.
Plan option availability also varies by county within each Rating Area.
With the exception of the non-Metropolitan areas, PPO plans are currently only available in select Rating Areas through a single carrier.
39
Option 4Establish Premiums Based on Age and/or Geographic Area
Number of Carriers by Plan Type
Rating Area
Metropolitan Statistical Area (MSA)
2014 2015 2016
HMO PPO HMO PPO HMO PPO
1 Abilene 2 1 2 2 2 0
2 Amarillo 2 1 2 2 3 0
3 Austin-Round Rock 5 3 5 3 4 1
4 Beaumont-Port Arthur 4 2 4 2 5 0
5 Brownsville-Harlingen 3 1 4 2 3 0
6 College Station-Bryan 3 2 3 3 3 1
7 Corpus Christi 2 1 2 3 3 0
8 Dallas-Ft. Worth-Arlington 3 3 3 3 3 1
9 El Paso 3 1 3 3 3 1
10 Houston-Baytown-Sgr Land 5 3 5 3 6 1
11 Killeen-Temple-Fort Hood 4 2 4 2 3 1
12 Laredo 2 1 2 2 2 0
13 Longview 1 1 1 2 1 0
14 Lubbock 2 1 2 2 2 0
15 McAllen-Edinburg-Pharr 2 1 4 2 4 0
16 Midland 2 1 2 2 2 0
17 Odessa 2 1 2 2 2 0
18 San Angelo 2 1 2 2 2 1
19 San Antonio 4 2 4 4 4 1
20 Sherman-Denison 1 2 1 3 2 0
21 Texarkana 1 1 1 2 2 0
22 Tyler 1 1 1 2 1 0
23 Victoria 1 1 1 2 2 0
24 Waco 5 2 5 2 4 1
25 Wichita Falls 1 1 1 2 1 0
26 Non-Metropolitan Areas 7 3 8 3 9 2

CY2016 Blue Cross Blue Shield of Texas Blue Advantage HMO Individual Rates
Rating Area
Metropolitan Statistical Area (MSA)
Bronze Silver Gold
Age 25 Age 40 Age 55 Age 25 Age 40 Age 55 Age 25 Age 40 Age 55
1 Abilene $176 $244 $283 $224 $311 $360 $391 $543 $629
2 Amarillo $174 $242 $280 $222 $308 $357 $387 $538 $623
3 Austin-Round Rock $185 $257 $297 $235 $327 $379 $410 $570 $661
4 Beaumont-Port Arthur $195 $271 $314 $248 $345 $399 $433 $601 $697
5 Brownsville-Harlingen $141 $196 $227 $179 $249 $288 $313 $434 $503
6 College Station-Bryan $170 $237 $274 $217 $302 $349 $379 $526 $609
7 Corpus Christi $161 $224 $259 $205 $285 $330 $358 $498 $576
8 Dallas-Ft. Worth-Arlington $200 $277 $321 $254 $353 $409 $443 $616 $713
9 El Paso $152 $212 $245 $194 $269 $312 $338 $470 $545
10 Houston-Baytown-Sgr Land $174 $242 $281 $222 $309 $358 $388 $539 $624
11 Killeen-Temple-Fort Hood $166 $231 $267 $211 $294 $340 $369 $513 $594
12 Laredo $148 $205 $238 $188 $261 $303 $328 $456 $528
13 Longview $172 $239 $277 $219 $304 $352 $382 $530 $614
14 Lubbock $171 $238 $276 $218 $303 $351 $381 $529 $613
15 McAllen-Edinburg-Pharr $142 $198 $229 $181 $252 $292 $316 $440 $509
16 Midland $165 $229 $266 $210 $292 $338 $367 $510 $590
17 Odessa $167 $232 $269 $213 $296 $342 $371 $516 $597
18 San Angelo $183 $255 $295 $234 $325 $376 $407 $566 $656
19 San Antonio $180 $250 $289 $229 $318 $368 $399 $555 $643
20 Sherman-Denison $206 $286 $331 $262 $364 $422 $457 $636 $736
21 Texarkana $164 $228 $265 $209 $291 $337 $365 $507 $588
22 Tyler $174 $242 $280 $221 $308 $356 $386 $537 $622
23 Victoria $170 $236 $274 $216 $301 $348 $378 $525 $608
24 Waco $169 $234 $271 $215 $298 $345 $374 $520 $603
25 Wichita Falls $211 $293 $340 $269 $373 $432 $469 $651 $754
26 Non-Metropolitan Areas $169 $235 $272 $215 $299 $347 $376 $522 $605
Deductible (Individual / Family) $6,750 / $13,700 $2,000 / $6,000 $500 / $1,500
Office Visit (Primary Care / Specialist) $40 copay / 30% coinsurance $40 copay / $60 copay $20 copay / $40 copay
Prescription Drug (Generics / Preferred Brand / Non-
Preferred Brand / Specialty)
20% / 30% / 40% / 50%coinsurance after deductible
$0 copay / $50 copay / $100 copay / 30% coinsurance after deductible
$0 copay / $50 copay/ $100 copay/ 30% coinsurance after deductible
Option 4Sample CY2016 Exchange Rates – HMO Plans
40

41
Education Service CenterGeographic Area Factor
Area Adjusted TRS-ActiveCare 2 Employee Only
Premium
Difference in Current
Gross Premium
Region 1 – Edinburg 0.89 $549 ($65)
Region 2 – Corpus Christi 0.77 $474 ($140)
Region 3 – Victoria 0.93 $573 ($41)
Region 4 – Houston 0.91 $557 ($57)
Region 5 – Beaumont 1.06 $650 $36
Region 6 – Huntsville 1.00 $614 $0
Region 7 – Kilgore 1.10 $673 $59
Region 8 – Mount Pleasant 0.95 $584 ($30)
Region 9 – Wichita Falls 0.97 $594 ($20)
Region 10 – Richardson 1.04 $638 $24
Region 11 – Fort Worth 1.07 $655 $41
Region 12 – Waco 1.09 $672 $58
Region 13 – Austin 0.89 $546 ($68)
Region 14 – Abilene 1.38 $846 $232
Region 15 – San Angelo 1.07 $655 $41
Region 16 – Amarillo 1.36 $838 $224
Region 17 – Lubbock 1.45 $892 $278
Region 18 – Midland 0.99 $608 ($6)
Region 19 – El Paso 0.88 $538 ($76)
Region 20 – San Antonio 0.76 $464 ($150)
Option 4Establish Premiums Based on Age and/or Geographic Area
The average rating area is represented by Region 6 –Huntsville, whose adjusted premium is equal to the current TRS-ActiveCare 2 premium for Employee Only coverage.
There is an 92% cost differential between the highest cost area (Region 17 –Lubbock) and the lowest cost area (Region 20 – San Antonio).
Premium differentials will vary by plan and coverage tier.

42
Annual Cost Impact for Geographic Rating
State District Active Employees
Uniform Statewide Premium($75 State + $150 District = $225)1 $244,190,700 $488,381,400 $1,139,974,812
Geographic Premiums($75 State + $150 District = $225)1 $244,190,700 $488,381,400 $1,139,974,812
Change $0 $0 $0
1 Assumes a minimum District contribution of $150 per employee per month.
Option 4Establish Premiums Based on Age and/or Geographic Area
Assuming that there is no change to the State or District funding ratio requirements, this option does not increase the employer costs.
By moving to a premium schedule that varies by geographic area, the Active Employee contributions will decrease in some areas and increase in others; however, the aggregate employee contributions will stay the same as well.
For example, based on slide 43, employees in the Corpus Christi, Austin and El Paso areas would be among those who receive a reduction in premiums while employees in higher cost areas such as Abilene, Fort Worth and Lubbock would receive an increase in premiums.

Option 5
Eliminate Coverage for Spouses
Option 5 Eliminate Coverage for Spouses
Based on a February 2016 survey of districts, 6.2% of all districts provide a contribution towards dependent coverage. Therefore, it does not appear to be an important recruitment or retention consideration.
While the Affordable Care Act does require employers to offer coverage to dependent children up to age 26, it does not require that employers offer spousal coverage.
Spouses can obtain coverage either through his/her own employer or through the federal public exchange.
Low income spouses may qualify for a federal subsidy on the exchange only if the employer does not offer spousal coverage.
TRS-ActiveCare spousal coverage is subsidized by other tiers. As healthier spouses leave the program for less expensive options, the Employee Only tier takes on more of the costs for the spouses remaining in the program.
43

Elimination of spousal coverage for the FY2016 plan year, premiums for the following tiers would have been reduced by 2.7%.
If the State and District minimum contribution remained at $225 per employee per month, then the employee contribution would range from $107 to $740 based on plan and coverage tier election.
If the FY2003 contribution rates were reinstated, then the State and District contribution would be $123 and $245 respectively for Employee Only coverage in TRS-ActiveCare-2.
44
Option 5Eliminate Coverage for Spouses
Gross Premiums
Coverage Tier
Current FY2016 Adjusted FY2016 Premiums
TRS-ActiveCare1-HD
TRS-ActiveCareSelect
TRS-ActiveCare2
TRS-ActiveCare1-HD
TRS-ActiveCareSelect
TRS-ActiveCare2
Employee Only $341 $473 $614 $332 $460 $598
Employee & Spouse $914 $1,122 $1,478 -- -- --
Employee & Child(ren) $615 $762 $992 $599 $742 $965
Employee & Family $1,231 $1,331 $1,521 -- -- --

45
Annual Cost Impact for Elimination of Spousal Coverage
State District Active Employees
Including Spousal Coverage($75 State + $150 District = $225)1 $244,190,700 $488,381,400 $1,139,974,812
Excluding Spousal Coverage($75 State + $150 District = $225)1 $244,190,700 $488,381,400 $911,463,732
Change $0 $0 ($228,511,080)1 Assumes a minimum District contribution of $150 per employee per month.
Option 5Eliminate Coverage for Spouses
Committee ChargeAllow School Districts to Opt Out of TRS-ActiveCare
Allow School Districts to Opt Out of TRS-ActiveCare
Cautions:
If districts were allowed to opt out of TRS-ActiveCare, the restrictions such as the following would be necessary for the sustainability and affordability of the plan.
Deadline for notification
A district must notify TRS in writing no later than March 1st that it will not be participating in TRS-ActiveCare for the upcoming plan year. This will ensure that the premiums for the upcoming plan year can be set appropriately for the remaining districts. (If districts were allowed to opt out after premium rates have been announced at the June TRS Board meeting, the premiums would not be adequate to cover the costs.)
10-Year Lock-in period
Districts opting into TRS-ActiveCare must commit to a minimum number of years of participation in the plan in order to minimize the impact of adverse selection.
10-Year Lock-out period
Districts opting out of TRS-ActiveCare are restricted from opting back into the plan for a period of time in order to minimize the impact of adverse selection.46

Committee ChargeAllow School Districts to Opt Out of TRS-ActiveCare
47
The chart illustrates in aggregate dollars the impact of low cost groups opting out of the plan.
With all groups participating, premium rates are set such than claim expenses are covered.
As groups with low costs opt out of the plan, the aggregate premium dollars are reduced to levels below aggregate claims.
Low cost groups currently enrolled in TRS-ActiveCare generate more premium revenue than claims expense. This excess revenue subsidizes the high cost populations.
If low cost employees/families opt-out of TRS-ActiveCare at each open enrollment period, the average cost of the remaining population increases. This is a result of anti-selection on an individual level.
If low cost districts were permitted to opt-out of TRS-ActiveCare, the impact of anti-selection would magnify.
1 Premiums collected in excess of claims expenses are used to pay administrative expenses.
1

Committee ChargeAllow School Districts to Opt Out of TRS-ActiveCare
48
Example: 10-Year Lock-out
Assumptions
In FY2016, it is announced that any participating entity – regardless of employee size – may opt out of the TRS-ActiveCare health plan beginning with FY2017.
Assume that each entity’s FY2016 experience was similar to its FY2015 experience.o Medical and pharmacy annual trend rates are 7.5% and 13.0% respectively;
ando Employees and covered dependents remain in the plan as long as the district
remains in the plan. Assuming a worse case scenario in which 100% of healthiest participating
entities elect to opt out of the plan based on finding less expensive coverage.
Results
In the first year, almost half of the 1,106 participating entities opted-out of the plan causing gross premiums to increase by 20.1%.
After five years, only 116 of the sickest participating entities covering 12,000 individuals remained in the plan. Premiums had increased 20-30% each year.
By the end of the 10-year period, only four districts remained in the plan covering less than 100 individuals.

Committee ChargeAllow School Districts to Opt Out of TRS-ActiveCare
49
Example: No Lock-out Period
Without a lock-out period, anti-selection against the plan would speed up the deterioration of the program.
Districts that had once left TRS-ActiveCare due to their better than average experience would return to the plan when they are no longer able to get lower premiums on their own.
Districts that had once opted-in to TRS-ActiveCare due to their poor experience would opt back out of the plan when they are able to get lower premiums on their own.
50
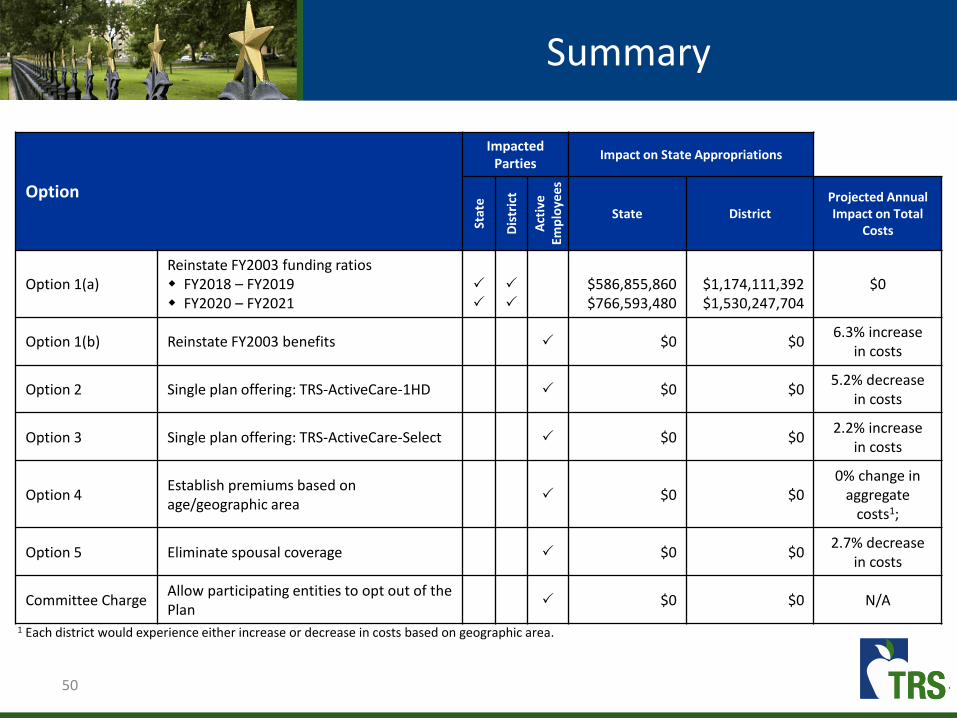
Summary
Option
Impacted Parties
Impact on State Appropriations
Stat
e
Dis
tric
t
Act
ive
Emp
loye
es
State DistrictProjected Annual Impact on Total
Costs
Option 1(a)Reinstate FY2003 funding ratiosw FY2018 – FY2019w FY2020 – FY2021
$586,855,860$766,593,480
$1,174,111,392$1,530,247,704
$0
Option 1(b) Reinstate FY2003 benefits $0 $06.3% increase
in costs
Option 2 Single plan offering: TRS-ActiveCare-1HD $0 $05.2% decrease
in costs
Option 3 Single plan offering: TRS-ActiveCare-Select $0 $02.2% increase
in costs
Option 4Establish premiums based on age/geographic area
$0 $00% change in
aggregate costs1;
Option 5 Eliminate spousal coverage $0 $02.7% decrease
in costs
Committee ChargeAllow participating entities to opt out of the Plan
$0 $0 N/A
1 Each district would experience either increase or decrease in costs based on geographic area.

Combine TRS-Care & TRS-ActiveCare
51

52
Offer a single plan to active and retired education employees
Eliminates both the TRS-Care and TRS-ActiveCare programs in place today and replaces them with a single fund providing coverage for both active and retired education employees in Texas.
A combined program includes many decision points that affect overall funding needs.
Offering a single plan option to all active and retired education employees with benefits similar to ERS’ Health Select plan would offer a richer benefit than currently offered at a cost of approximately $10 billion in new funds for the FY18-FY19 biennium.
1 ERS Health Select 2016 Premium trended to FY2018.2 The State pays 100% of employee/retiree and 50% of dependent coverage in ERS.3 Based on 1% State and 0.55% District contributions as a percent of active employee payroll.4 Assumes $75 State and $150 District contributions. Some districts contribute more.5 Average per employee/retiree contributions shown. Actual premiums vary by plan, coverage tier, Medicare status and years of service.
Current Funding Levels
State/District Contributions Employee/Retiree Contributions5
Entity Monthly Annual Monthly Annual
ERS1 $657.542 $7,8902 $0 $0
TRS-Care $190.503 $2,2863 $152 $1,824
TRS-ActiveCare $225.004 $2,7004 $352 $4,224
Combine TRS-Care and TRS-ActiveCare

53
Combine TRS-Care and TRS-ActiveCare
Decision points:
Should plan design and contributions mirror ERS Health Select?
Should funding reflect a fixed contribution or coverage for a certain benefit level? Should funding include health care cost trend consideration?
How should costs be allocated across funding entities? State? Districts? Active and retired members?
Should all districts participate?
What plan design should be implemented?
Mandatory Medicare Advantage and Part D for Medicare eligible retirees?
Should early retirees, pre-Medicare age, have a different plan design than active employees?
Consumer-driven and high-value plan designs?
Health Savings Accounts or Health Reimbursement Accounts?
Should the plans consider age and/or geography in pricing?
Would need changes to the Texas Insurance Code and other statutes, including school finance contributions to ActiveCare.

54
Combine TRS-Care and TRS-ActiveCare
Implementation Issues:
Need a minimum of two years for program design and procurement
Implementation timeline would necessitate two-year funding for current structure of both programs
Communication strategy to membership for significant plan changes
Design plans based on legislative direction
Establish premium levels and member cost-sharing based on state and district contributions

TRS-ActiveCare
Appendices
55

TRS-ActiveCare
Affordable Care Act Provisions
Category TRS-ActiveCare Plans Grandfathered PlansNon-Grandfathered
Plans
PREMIUM CONTRIBUTIONS
Premium Contributions
No restrictions
The ratio of the retiree’s
premium contribution rate -
as a percent of total cost
PEPM - cannot increase by
more than 5 percentage
points as compared to the
rate in place in March 2010.
No restrictions
ELIGIBILITY RULES
Coverage of Dependent
Children
Coverage of dependent
children up to age 26
Coverage of dependent
children up to age 26
Coverage of dependent
children up to age 26
Pre-Existing ConditionsTRS-ActiveCare does not
deny enrollment based on
pre-existing conditions.
A plan may not deny
enrollment or limit coverage
based on a pre-existing
condition.
A plan may not deny
enrollment or limit coverage
based on a pre-existing
condition.
Health Status TRS-ActiveCare does not
discriminate based on the
health status of the retiree
or dependent.
Exempt
No discrimination based on
the health status of the
employee/retiree or
dependent.
56

TRS-ActiveCare
Affordable Care Act Provisions
Category TRS-ActiveCare Plans Grandfathered PlansNon-Grandfathered
Plans
Benefit Design Features
Preventive Care Services Covered at 100% Exempt Covered at 100%
Annual Limits
No annual limits
An annual limit in place as of
3/23/2010 cannot be
reduced.
Prohibits annual caps on
benefits
Lifetime Maximum LimitsNo lifetime maximum
benefit
A lifetime limit in place as of
3/23/2010 cannot be
reduced.
Prohibits lifetime benefit
limits
Out-of-Pocket Maximum Out-of-pocket maximum
limits are integrated for
medical and pharmacy
benefits and include
deductible, copays, and
coinsurance.
Not required
Out-of-pocket maximum
limits are integrated for
medical and pharmacy
benefits and include
deductible, copays, and
coinsurance.
Fixed Dollar Deductibles
For TRs-ActiveCare-1HD, the
deductibles are currently
$2,500 for self-only and
$5,000 for family coverage.
Increases in fixed dollar cost
sharing benefits are limited
to medical inflation plus
15%.
Grandfathered plans are not
subject to the maximum
deductible limit prescribed
by Affordable Care Act.
For High Deductible Health
plans, the deductibles
cannot be less than $1,300
for self-only or $2,600 for
family coverage in CY2016.
For all other plans,
deductibles cannot be
greater than the out-of-
pocket maximum.
57

TRS-ActiveCare
Affordable Care Act Provisions
Category TRS-ActiveCare Plans Grandfathered PlansNon-Grandfathered
Plans
Benefit Design Features (continued)
Fixed Dollar Copays
No restrictions
Increases in fixed dollar cost
sharing benefits are limited
to medical inflation plus
15%.
No restrictions
Coinsurance
No restrictions
Increases to coinsurance
percentages are not
allowed.
No restrictions
Covered Services
Waiting Period Restrictions
No waiting period.
Any waiting period
limitation shall not be in
excess of 90 days.
Any waiting period
limitation shall not be in
excess of 90 days.
Clinical Trials
Certain trials covered. Exempt
A plan may not deny
coverage for routine costs in
connection with clinical
trials.
58

TRS-ActiveCare
Affordable Care Act Provisions
Category TRS-ActiveCare Plans Grandfathered PlansNon-Grandfathered
Plans
Fees & Taxes
Reinsurance Assessment Fee
(eff. CY2014 – CY2016)Fee is applicable to all
participants.
Fee is applicable to both
Medicare and non-Medicare
participants.
Fee is applicable to both
Medicare and non-Medicare
participants.
Patient Centered Outreach
Research Institute Fee
(eff. FY2013 – FY2019)
Fee is applicable to all
participants.
Fee is applicable to non-
Medicare participants only.
Fee is applicable to non-
Medicare participants only.
Excise Tax on High-cost plans
(eff. 1/1/2020)
40% tax assessed on the
value of the plan in excess
of pre-determined
thresholds.
40% tax assessed on the
value of the plan in excess
of pre-determined
thresholds.
40% tax assessed on the
value of the plan in excess
of pre-determined
thresholds.
59

Market Comparison
Premium and Contribution Benchmarking for Active Employees
MetricEmployee Only Total Premium1
EmployeeContribution2 to Employee Only
Premium
Employee & Family TotalPremium1
Employee Contribution2 to
Employee & Family Premium
TRS-ActiveCare 1-HD $341.00 34.0% $1,231.00 81.7%
TRS-ActiveCare Select $473.00 52.4% $1,331.00 83.1%
TRS-ActiveCare 2 $614.00 63.4% $1,521.00 85.2%
Employee Retirement System of Texas 3
(HealthSelect)$537.66 0% $1,565.70 32.8%
Texas A&M University (A&M Care) $553.48 1.8% $1,312.89 29.7%
University of Texas (UT Select) $566.96 0% $1,536.81 31.3%
ARBenefits (Arkansas Public School Employees)4
$665.40$345.02$240.48
38.2%34.8%35.8%
$1,870.58$835.74$498.98
47.6%50.9%69.0%
Louisiana Office of Group Benefits5 $653.38 25.0% $1,463.74 38.8%
State Health Plan of South Carolina (PEBA) $457.78 21.3% $1,199.60 25.6%1 Premium and contribution amounts are based on the health plan offered to active employees for the 2016 plan year, if available.2 For TRS-ActiveCare, employee contributions are based on the minimum employer contribution of $225 PEPM.2 Premiums include coverage for Basic Term Life Insurance.4 School districts in Arkansas contribute $154.48 PEPM for all plans and coverage tiers; the State and plan contribution to coverage varies between $0 - $826.18 by plan and coverage tier.5 Premiums shown are based on the Magnolia Open Access Plan.
60

Market Comparison
Actuarial Value of 2016 Active Employee Plans
The Actuarial Value of a plan represents the average benefit amount paid by the plan as a percentage of total costs.
61

62
Glossary

Glossary
63
Accountable Care Organization – a network of doctors and hospitals that share responsibility for providing care to patients. Provider reimbursements are a function of both quality, appropriateness and efficiency of care.
Ambulatory Surgical Center – an outpatient surgical center that has the professional staff to perform minor operations that do not require prolonged confinement in a hospital.
Brand Drug – a medication sold by a single pharmaceutical company under a trademark protected name.
Broad Network - a large group of facilities and physicians from which plan participants may obtain in-network health care services.
Coinsurance - the percentage of costs paid by the member for covered expenses and services.
Compound Drug - a medication made by combining, mixing or altering ingredients of drugs to create a medication tailored to meet the needs of a patient.
Copayment - the fixed dollar costs paid by the member for covered expenses and services.
Covered Expense - An event or procedure that will be paid for either in full or in part by the health plan.
Deductible - The dollar amount required to be paid by the member before health plan begins to pay for covered expenses and services.
Dependent - A spouse or eligible child who meets the eligibility requirements set forth by the health plan.
Emergency Room – a facility that provides immediate, emergent care in a setting usually physically attached to a hospital.
Employee/Retiree Contribution - the amount paid to the health plan by an employee/retiree on a monthly basis in order to be covered under the health plan.
Employer Contribution - the amount paid to the health plan by the employer(s) on a monthly basis to fund the health plan.
Employer Group Waiver Plan (EGWP) - an employment based group plan which provides prescription drug benefits to Medicare eligible individuals. An EGWP plan replaces a Part D plan sponsored by Medicare.
Exclusive Provider Organization Plan (EPO) - A managed care health plan in which all covered services are rendered by in-network providers. A PCP is not required and referrals are not needed to see other providers for covered services.
Formulary - the list of brand and generic drugs covered by the prescription drug or health plan.
Fully Insured Plan - a health care plan in which the plan sponsor pays a per employee/retiree premium to an insurance company and the insurance company assumes all risk of providing the coverage for insured events

Glossary
64
Generic Drug - a medication that is comparable to a brand drug in dosage form, strength, route of administration, quality, performance characteristics and intended use but is not protected by a trademark name.
Grandfathered Plan - a health care plan that was created before March 23, 2010; has not undergone such changes that reduce benefits to plan participants; and has not undergone such changes that significantly increase costs to plan participants.
Health Maintenance Organization Plan (HMO) - A managed care health plan in which all covered expenses are rendered by in-network providers, except in an emergency situation. A PCP is required under an HMO plan.
Health Savings Account (HSA) – a savings account used by individuals covered by a High Deductible Health plan to pay for current and future eligible medical expenses on a tax free basis.
High Deductible Health Plan (HDHP) - A health plan with an annual deductible of at least $1,300 for individuals and $2,600 for family coverage, and annual out-of-pocket expenses do not exceed $6,600 for individuals and $13,200 for family coverage.
Hospital – facilities that provide diagnosis, treatment and/or care for patients suffering from acute illness or injury.
Imaging Center – a freestanding facility with the equipment to produce various types of radiologic and electromagnetic images and the professional staff to interpret those images.
In-Network Benefit – a benefit for services performed by physicians, hospitals and other medical service providers who contract with the health plan to provide healthcare services at a discounted rate.
Inpatient – a patient who is admitted to a hospital for medical treatment that requires at least one overnight stay.
Limited Network - a small group of facilities and physicians from which plan participants may obtain in-network health care services.
Maximum Out-of-Pocket (MOOP) - the total dollar amount of paid by the member for covered expenses and services, including amounts paid toward a deductible, coinsurance and copayments.
Member - The individuals who are enrolled in the health plan (e.g. employees, retirees and eligible dependents).
Medicare Eligible - An individual who is eligible to participate in the Medicare program based upon either attainment of age 65 or disability status.
Medicare Advantage Plan - A private health plan that is approved by Medicare to provide medical benefits in place of Medicare Part A and Part B to Medicare eligible individuals who are enrolled in both Medicare Part A and Part B. (Also called Part C.)

Glossary
65
Medicare Part A - the national health plan administered by the United States government covering inpatient hospital stays.
Medicare Part B - the national health plan administered by the United States government covering outpatient hospital services.
Medicare Part D - the national health plan administered by the United States government covering prescription drug benefits.
Non-grandfathered plan - a health care plan that does not qualify as a grandfathered plan, including any health care plan that was created on or after March 23, 2010.
Non-Preferred Brand – a brand drug that is not included on the PBM formulary
Out-of-Network Benefit – a benefit for services not performed by a network provider.
Outpatient – a patient who is receiving medical treatment without being admitted to the hospital.
Patient Centered Medical Home (PCMH) –a system of comprehensive coordinated healthcare for individuals facilitated by a PCP who is responsible for leading a team of professionals in providing both preventive and chronic care management.
Patient Protection and Affordable Care Act (PPACA or ACA) –federal health reform law of 2010
Pharmaceutical Rebates - the amount reimbursed to PBM by pharmaceutical manufacturers based on member utilization of certain brand drugs
Pharmacy Benefits Manager (PBM) - a company that administers drug benefit programs for individuals and/or groups.
Point of Service Plan (POS) - a managed care health plan that provides both in-network and out-of-network benefits. A PCP is required; however, the member may choose an out-of-network provider for an additional out-of-pocket cost.
Preferred Brand – a brand drug that is included on the PBM formulary
Preferred Provider Organization (PPO) - a managed care health plan provides both in-network and out-of-network benefits. A PCP is not required and referrals are not needed to see other providers for covered services.
Primary Care Physician (PCP) – a physician who is a patient’s first point of contact for an undiagnosed condition. This physician is usually a Pediatrician, General Practitioner, Family Practitioner, OB/GYN, or Internist.
Retiree Drug Subsidy (RDS) - a federally sponsored program which reimburses plan sponsors for a portion of paid prescription drug expenses for Medicare eligible individuals.
Self-insured Plan - a health care plan in which the plan sponsor pays a per employee/retiree administration fee to an insurance company to provide claims administration services; the plan sponsor assumes all risk of providing the coverage for insured events.

Glossary
66
Specialist – a doctor who specializes in a certain type of medical care (e.g. cardiologist, podiatrist, eye doctor).
Specialty Drug - Generally, a high cost drug that is used to treat complex chronic or life-threatening conditions; require special storage, handling and administration; and require patient monitoring and management.
Submitted Charge - the dollar amount submitted to an insurance company or TPA by a provider for covered and uncovered services rendered.
Subscriber - the employee/retiree who is eligible to receive benefits through the health plan.
Third Party Administrator (TPA) - an organization that processes claims, maintains a provider network, utilization review and/or membership functions on behalf of the health plan.
Tier - the method by which drugs are grouped within the formulary to indicate the applicable copay (e.g. Tier 1 = generic – lowest cost alternative; Tier 2 = brand – higher cost alternative; Tier 3 = brand – highest cost alternative; etc.).
Urgent Care Facility – a facility that provides immediate, non-emergent primary health care.