Regulatory oversight of genetic testing in Canada: Health Canada perspective

2
Catalogue no. 82M0022XIE
Joint Canada/United StatesSurvey of Health, 2002-03
by:
Claudia Sanmartin and Edward Ng Health Analysis and Measurement Group Statistics Canada
and
Debra Blackwell, Jane Gentleman, Michael Martinez and Catherine Simile National Center for Health Statistics Centers for Disease Control and Prevention United States
Joint Canada-US Survey of Health, 2002-03 Statistics Canada, Catalogue 82M0022-XIE

1
Joint Canada/United States Survey of Health, 2002-03 Acknowledgements
This report was prepared under the direction of Gary Catlin, François Gendron and Jean-Marie Berthelot from Statistics Canada as well as Jennifer Madans and Jane Gentleman from the National Center for Health Statistics of the U.S. Centers for Disease Control and Prevention.
The cooperation of many other individuals from both agencies in the data collection, coding, documentation, analysis and publication phases of this project is also gratefully acknowledged.
The following organisations have provided financial support for this project: Statistics Canada, National Center for Health Statistics, the Canadian Institutes of Health Research and the Robert Wood Johnson Foundation.
Joint Canada/United States Survey of Health, 2002-03 Statistics Canada, Catalogue 82M0022-XIE

Joint Canada/United States Survey of Health, 2002-03 Statistics Canada, Catalogue 82M0022-XIE
2

3
Table of Contents
List of Tables .......................................................... 4
List of Charts .......................................................... 5
Key Findings .......................................................... 6
INTRODUCTION ...................................................... 7
METHODS ............................................................... 8Definitions ............................................................................ 8Methodological Notes ......................................................... 9Limitations ........................................................................... 9
RESULTS ............................................................... 10Health Status ..................................................................... 10
Self-Reported Health ....................................................... 10Mobility Limitation ............................................................ 11Depression ...................................................................... 11
Risk Factors ....................................................................... 11Income Differences and Health ........................................ 12Access to Health Care Services ....................................... 13
Access to doctors ............................................................ 14Mammograms .................................................................. 14Prescription medicines ..................................................... 16Dentist visits .................................................................... 17Unmet health care needs ................................................. 17
Quality and Satisfaction with Health Care Services ....... 18Quality ............................................................................. 18Satisfaction ...................................................................... 19
CONCLUSIONS ..................................................... 19
References ........................................................... 22
APPENDIX A: Additional tables .......................... 23
Joint Canada/United States Survey of Health, 2002-03 Statistics Canada, Catalogue 82M0022-XIE

4
List of Tables
Table 1 General health status by age group, Canada and United States, 2002/03
Table 2 Individuals who contacted a medical doctor one or more times in the past 12 months, Canada and United States, 2002/03
Table 3 Use of mammograms among women aged 50-69, Canada and United States, 2002/03
Table 4 Prescription medication use in the past month by gender and age group, Canada and United States, 2002/03
Table 5 Dental visits by insurance status, Canada and United States, 2002/03
Table 6 Quality of health care and physician services received, Canada and United States, 2002/03
Table 7 Satisfaction with health care and physician services, Canada and United States, 2002/03
Table A-1 General health status by age group, Canada and United States, 2002/03
Table A-2 General health status by gender, Canada and United States, 2002/03
Table A-3 Mobility limitation by gender, Canada and United States, 2002/03
Table A-4 Individuals experiencing a major depressive episode in the past year by gender and age group, Canada and United States, 2002/03
Table A-5 Current daily smokers by gender and age group, Canada and United States, 2002/03
Table A-6 Body Mass Index (BMI) by gender, Canada and United States, 2002/03
Table A-7 Fair/poor general health by household income quintile, Canada and United States, 2002/03
Table A-8 Severe mobility limitation by household income quintile, Canada and United States, 2002/03
Table A-9 Obesity by household income quintile, Canada and United States, 2002/03
Table A-10 Current daily smokers by household income quintile, Canada and United States, 2002/03
Table A-11 Individuals with a regular medical doctor, Canada and United States, 2002/03
Table A-12 Individuals with a regular medical doctor by gender and age group, Canada and United States, 2002/03
Table A-13 Individuals who contacted a doctor in the past 12 months by general health status, Canada and United States, 2002/03
Table A-14 Individuals reporting an unmet health care need, Canada and United States, 2002/03
Table A-15 Individuals reporting an unmet health care need by gender and age group, Canada and United States, 2002/03
Table A-16 Individuals reporting an unmet health care need by household income quintile, Canada and United States, 2002/03
Table A-17 Individuals with various types of insurance, Canada and United States, 2002/03
Joint Canada/United States Survey of Health, 2002-03 Statistics Canada, Catalogue 82M0022-XIE

5
List of Charts
Chart 1 General health status by age group, Canada and United States, 2002/03
Chart 2 General health status by gender, Canada and United States, 2002/03
Chart 3 Mobility limitation by gender, Canada and United States, 2002/03
Chart 4 Individuals experiencing a major depressive episode in the past year by gender and age group, Canada and United States,2002/03
Chart 5 Current daily smokers by age group, Canada and United States, 2002/03
Chart 6 Body Mass Index (BMI) by gender, Canada and United States, 2002/03
Chart 7 Fair/poor general health by household income quintile, Canada and United States, 2002/03
Chart 8 Severe mobility limitation by household income quintile, Canada and United States, 2002/03
Chart 9 Obesity by household income quintile, Canada and United States, 2002/03
Chart 10 Current daily smokers by household income quintile, Canada and United States, 2002/03
Chart 11 Individuals with a regular medical doctor, Canada and United States, 2002/03
Chart 12 Individuals who contacted any doctor in the past 12 months by general health status, Canada and United States, 2002/03
Chart 13 Individuals reporting an unmet health care need, Canada and United States, 2002/03
Chart 14 Individuals reporting an unmet health care need by household income quintile, Canada and United States, 2002/03
Joint Canada/United States Survey of Health, 2002-03 Statistics Canada, Catalogue 82M0022-XIE

6
Key Findings
• Overall, most Canadians (88%) and Americans (85%) reported being in good, very good or excellent health. However, the range of health status was more polarized in the United States. More Americans reported being at either end of the health status spectrum — in excellent health (26%) and in fair and poor health (15%) — compared with Canadians (24% and 12%, respectively).
• The primary difference in health status between the two countries appeared to occur among women. While more women in the U.S. reported that they were in excellent health (25% vs. 23%), there were also more reporting fair health (11%) compared with Canadian women (8%). This may reflect the higher rate of highly severe mobility limitation (7% vs. 4%) and obesity (21% vs. 13%) among American women compared with Canadian women.
• Canada had a slightly higher percentage of current daily smokers compared with the U.S., (19% vs. 17%). The U.S., however, had a much higher rate of obesity compared with Canada (21% vs. 15%).
• While in both countries, those in the poorest income quintile reported poorer health, more low income Americans did so compared with low income Canadians (31% vs. 23%). The same pattern prevailed regarding the distribution of severe mobility limitation, obesity and unmet health care needs. There were no systematic differences in the reporting of fair or poor health or mobility impairment among the most affluent households on either side of the border.
• Overall, more Canadians reported having a regular medical doctor compared with Americans (85% vs. 80%) - Canadians were similar to insured Americans in terms of having a regular medical doctor.
• American women aged 50-69 were more likely to have had a mammogram within the last 2 years compared with Canadian women of the same age (82% vs. 74%). There were, however, no differences between the two countries regarding the proportion of women 50-69 who had never had a mammogram.
• The use of dental services was similar between the two countries with a higher rate of use among those with dental insurance.
• Overall, more Americans reported that they had experienced an unmet health care need in the previous year compared with Canadians (13% vs. 11%). There was no difference in the proportion who reported unmet health care needs between Canadians and insured Americans.
• The top reasons for unmet health care needs differed between the two countries: waiting time was most often reported in Canada and cost was most often reported in the U.S.
• Americans were more likely to be "very satisfied" with their health care services (both all services and doctor services) while Canadians were more likely to be "somewhat satisfied" (for all services) even when compared with insured Americans.
Joint Canada/United States Survey of Health, 2002-03 Statistics Canada, Catalogue 82M0022-XIE

7
Joint Canada/United States Survey of Health
INTRODUCTION
In an era of globalization, comparisons of health status and health systems across nations are of increasing interest.1,2 This is certainly true for Canada and the United States (U.S.) – two nations who share an open border and who are similar in many ways yet very different on several policy fronts including the way health care services are organized, managed, and delivered. Accordingly, the Joint Canada/U.S. Survey of Health (JCUSH) was designed and conducted to collect the same information in the same manner from both Canadian and U.S. residents so that accurate comparisons between the two populations can be made regarding health status and access to health care services. As a result, the JCUSH is a unique and timely population health survey, conducted jointly by Statistics Canada and the National Center for Health Statistics (NCHS) of the U.S. Centers for Disease Control and Prevention.
Multi-country comparisons to date
Canada and the U.S. have been part of various existing efforts to compare countries on health related issues. The Organization for Economic Cooperation and Development (OECD), for example, regularly conducts multi-country comparisons among member countries. The OECD gathers existing administrative and survey data within each country to create a core set of key indicators to compare the health status and health care system performance across countries.3
While this approach provides valuable information, the comparability of the data is limited since different instruments and methods have been used within each country.
In an effort to overcome some of these limitations, multi-country surveys have been conducted using a standard questionnaire and methodology in an effort to produce more comparable data. For example, the Commonwealth Fund has collected data from its member countries including Canada and the U.S. since 1990. The Commonwealth Fund survey focuses primarily on the views, satisfaction and health care experiences of citizens accessing health care services
in each country.4,5,6 While these data are highly comparable, the information provided is somewhat limited in scope since the survey does not capture broader information on health status, lifestyle habits, health care use and other determinants of health.
Given the limitations of current multi-country comparisons to date, international organizations such as the World Health Organization (WHO) and the OECD have called for more comparable data at the international level. Comparable statistics are required to assess and compare the performance of national health care systems and to provide a more in-depth understanding of the determinants that drive good and bad health in various countries.
The JCUSH represents the first attempt to collect comprehensive information regarding health status and access to health care services using a single survey and a standard approach across countries. The survey was designed to collect comparable information on a broad range of topics including
• self-reported health, chronic conditions, functional status and depression;
• life-style factors such as smoking, obesity, and activity levels;
• use of health care services such as visits to physicians and hospitals, use of dental services and prescription drugs, insurance status and unmet health care needs; and
• demographic and socio-economic information.
Because the JCUSH was conducted in the same manner in both countries, it provides a degree of comparability never before possible. As a result, direct comparisons can be made between Canada and the U.S. regarding health status, the extent of mobility limitations, and access to health care services.7
The objective of this report is to provide a first look at the results from the JCUSH survey. The findings focus primarily on the overall similarities and differences between the two countries. The report also provides an overview of the methods and processes used to conduct the survey.
Joint Canada/United States Survey of Health, 2002-03 Statistics Canada, Catalogue 82M0022-XIE

8
METHODS
The JCUSH was conducted as a one-time telephone survey in both Canada and the United States. The survey content was drawn from the Canadian Community Health Survey (CCHS) and the National Health Interview Survey (NHIS) in the U.S. This was done so that the JCUSH could provide information that can support possible harmonization of the two surveys.
The target population of JCUSH includes residents of Canada and the United States aged 18 or older living in private dwellings. The target population excludes the institutionalized population and those living in either the Canadian or U.S. territories. The JCUSH sample
was designed to produce reliable national estimates for three age groups (18-44, 45-64 and 65 and over) by gender. Households were selected through a Random Digit Dialling (RDD) process. The number of persons responding to the survey was 3,505 in Canada and 5,183 in the U.S. All interviews were conducted from Statistics Canada’s regional offices. Response rates were 66% and 50% in Canada and the U.S., respectively.8 (see Methodological Notes Data Collection and Estimation)
Comparisons between Canada and the U.S. were conducted for all respondents and by age and gender and for some indicators by income and health insurance status. Analyses including all respondents were age-adjusted to control for any differences in the
Definitions
Body mass index (BMI) Obesity: BMI score for an individual is obtained by dividing weight in kilograms by the square of height in metres. Individuals with a BMI
(overweight), and 30 <= BMI (obese).
Current daily smoker:
Depression:a subset of questions from the Composite International Diagnostic Interview
Diagnostic and Statistical Manual of Mental Disorders (DSM-III-R).11 Responses to these questions were scored and transformed into a probability estimate of a diagnosis of major depressive episode. If the estimate was 0.9 or more (that is, 90% certainty of a positive diagnosis), the respondent was classified as having had a
Income quintile:country as follows. First, the household income of each respondent was adjusted for household size by dividing the income by the square root of the number of persons residing in the household. Then, respondents were ranked according to the adjusted household income and were assigned a quintile group such that the weighted count of each quintile group contained approximately one-fifth of the population reporting household income. Respondents with missing household income were
Mobility limitation: Individuals have mobility limitation if they report that they "cannot do",
climbing ten steps without resting). severe if the respondent said he/she either could not do It is considered highly severe if the respondent said he/she could not do any of the
activities.
Unmet health care need: Individuals are considered to have an unmet health care need if over the previous 12 months they felt that they needed a health care service, but did not receive it when they needed it.
The measure excludes pregnant women and those less than 3 feet in height or 7 feet and over. of 30 or more were classified as obese, a definition of obesity that is endorsed by the World Health Organization (WHO). In this study, the WHO categories used are as follows: BMI < 18.5 (underweight), 18.5 <= BMI <25 (normal weight), 25 <= BMI <30
In this study, current daily smokers are individuals who report having smoked at least one whole cigarette and now smoke cigarettes every day.
In this study, depression is represented as the likelihood of a major depressive episode (MDE) based on responses to . These questions cover a cluster of symptoms for
depressive disorder, which are listed in the
depressive episode in the past year.
For Canada and the U.S. separately, respondents who reported household income were divided into quintiles by
excluded from the construction of quintiles and are reported separately.
or find it "very difficult", "somewhat difficult" or "a little difficult" to do any of three activities related to mobility (walking a quarter of a mile, standing for two hours and
A mobility limitation is considered any of the activities or found it very difficult.
Joint Canada/United States Survey of Health, 2002-03 Statistics Canada, Catalogue 82M0022-XIE

9
The target population of JCUSH includes Canadian and U.S.adults aged 18 or older residing in households with a telephone(i.e. a land line). The following were excluded from the sample:
homes;
Commonwealth of the Northern Mariana Islands.
The JCUSH sample was stratified by province in Canada andby four geographic regions in the United States (Northeast,
proportionally allocated within each stratum based on their
Random Digit Dialling (RDD). Statistics Canada and NCHS wereresponsible for drawing their own sample but equivalent designswere used to ensure comparability of the resulting data.
The objective of the JCUSH was to obtain reliable estimates atthe national level for six domains: three age groups (18-44, 45
With the RDD method, it is
gender of the respondents are unknown beforehand. Since males 65 and over represent only about 7% of thesepopulations, and only about 13% of households contain at least
aged 65 and over was increased to avoid the need for an overlylarge sample. Post-stratification was done to ensure that the final weights sum to the population estimates, for some auxiliaryvariables. In Canada, population estimates were based on the1996 Census of Population, and in the United States, estimates
The auxiliary variables used to create the post-strataadjustments are age, sex and region for Canada and age, sexand race/ethnicity for the U.S.
The JCUSH was administered by Statistics Canada in both
questionnaire, designed by both countries, was administeredin three languages: French and English for Canadian interviews
Collection took place between November 4th, 2002 and March
participation from selected U.S. respondents who had previously
Methodological Notes - Data Collectionand Estimation
• institutionalized population including those in prison or nursing
• full time members of the Canadian or American Armed Forces; • residents of the three Canadian northern territories (Yukon,
Northwest Territories and Nunavut); • residents of the U.S. territories including Puerto Rico, the U.S.
Virgin Islands, American Samoa, Guam and the
Midwest, West and South). In each country, the sample was
population sizes. The sample selection method chosen was
64 and 65 and over) by gender. difficult to control the sample composition since the age and
one male 65 and over, the probability of selection for persons
were based on the October 2002 Current Population Survey.
countries using the Computer-Assisted Telephone Interview (CATI) method. Both the Canadian and American interviews were conducted from Statistics Canada’s regional offices usingthe same questionnaire and the same interviewing team. The
and Spanish and English for American interviews.
31st, 2003. Additional collection took place during several weeks in April and June 2003, and focused on encouraging
declined to participate in the survey.
Missing data,including responses of “don’t know”, “not stated”, or “refusal”, wereexcluded from the analysis except for analyses by income. Ageadjusted percents were calculated for both countries using the directstandardization method and using weights from the projected 2000Standard U.S. population: 18-44: 0.530535; 45-65: 0.299194; and 65+:
Projected U.S. Population. Statistical Notes Number 20 (CDC/NCHS)
sample design in estimating variances of percents in this report.9,10
Statistical significance tests were conducted at the 0.05 level and 95%confidence intervals were produced.
There are limitations with the JCUSH data.
First, the survey response rates were relatively low compared withother health surveys in both Canada and the U.S. Even though non-response is taken into account when calculating the estimates for theentire population, no information is available on the characteristics ofnon-respondents.
Second, the use of the Random Digit Dialling process excludes
telephone is relatively small (1.8% in Canada and 4.4% in the U.S.).Because the survey estimates are post-stratified based on the countsof all persons in the target population, regardless of whether thehousehold has telephone service or not, the estimates allow inferencesto be made for the entire population. The exclusion of a small portionof the population may result in a slight bias if that portion of the
a whole. Data from the U.S. indicate that households without a land line telephone generally have lower income levels.
Third, since the sample was collected at the national level, provincialand state level analyses are not possible in Canada and the U.S.,
Fourth, the data used for this analysis were self- or proxy-reported;the information was not verified by direct measures or independentsources and may therefore be inaccurate. Recall errors could also
respondents may have provided what they considered sociallydesirable answers to questions on issues such as smoking and bodyweight. Data from the JCUSH are cross-sectional and refer to one
described, causality and temporal associations cannot be inferred.
errors may have occurred during the survey operations. Interviewersmay have misunderstood instructions, respondents may have
incorrectly recorded and errors may have been introduced in the
measures were implemented at each step of the data collection and
included the use of highly skilled interviewers, training of interviewerswith respect to the survey procedures and questionnaire, observationof interviewers to detect problems of questionnaire design ormisunderstanding of instructions, procedures to ensure that datacapture errors were minimized and coding and edit quality checks toverify the processing logic. Furthermore, comparisons were madebetween JCUSH estimates and the respective national health surveys,where appropriate, to ensure that JCUSH estimates were in line withtheir corresponding national surveys.
Limitations
Methodological Notes - Analytical Techniques
Weighted distributions and percents were produced.
0.170271. (Klein RJ, Schoenborn CA. Age Adjustment Using the 2000
January 2001). The bootstrap technique was used to account for the
households with no telephone. The percentage of households with no
population has characteristics that are different from the population as
respectively.
have affected reported levels for some variables. It is possible that
point in time. As a result, while relationships between variables can be
Finally, in addition to the errors inherent to any sampling method, other
answered the questions incorrectly, the answers may have been
processing and tabulation of the data. Considerable effort was made to reduce such non-sampling errors in the survey. Quality assurance
processing steps to monitor the quality of the data. These measures
Joint Canada/United States Survey of Health, 2002-03 Statistics Canada, Catalogue 82M0022-XIE

10
age distribution of the two countries. Missing data including responses of “don’t know”, “not stated”, or “refusal” were excluded from the analysis except for analyses by income.1 Pairwise differences between the two countries were deemed statistically significant based on a two-tailed test with p<0.05. (see Methodological Notes – Analytic Techniques)
RESULTS
Comparative analyses between Canada and the U.S. were conducted in five main areas: health status, risk factors, income differences and health, access to health care services and quality and satisfaction with health care services.
Health Status
Health status is compared between Canada and the U.S. using a range of measures including self-reportedhealth, mobility limitation and depression.
Self-Reported Health
• Overall, most Canadians and Americans reported being in good, very good or excellenthealth, with the percentage being slightlyhigher among Canadians.
1 In the case of income, about 24% in the U.S. and 16% in Canada were missing responses.
Table 1
• More Americans reported being at either endof the health status spectrum — in excellenthealth and in fair and poor health — comparedwith Canadians. This was particularly true among women.
Self-reported health provides a good indication of individuals’ overall health status which encompasses a range of dimensions including both physical and mental health. Individuals were asked to assess their general health status as either “excellent”, “very good”, “good”, “fair” or “poor”. The majority of respondents in both countries reported that they were in good, very good or excellent health with somewhat more Canadians (88%) than Americans (85%) classifying themselves in these categories. (Table 1) The results were consistent for all age groups, except for those 65 years of age and over.
Americans, however, were more likely to report “excellent” health than Canadians (26% vs. 24%). This was related to the larger proportion of Americans 65 years of age and over reporting “excellent” health compared with Canadians in the same age group (15% vs. 8%). (Chart 1 – Table A.1)
There were some small differences between Canadian and American women. More American women were at either end of the health status spectrum. A greater proportion of American women reported being in “excellent” health (25%) than Canadian women (23%). American women were also more likely to report fair health (11% vs. 8%). (Chart 2 – Table A.2) There were no differences between males in the two countries.
General health status by age group, Canada and United States, 2002/03
Canada United States
95% 95% confidence confidence
% interval % interval
18-44 Excellent/Very good/Good Fair/Poor
94.0 * 6.0 *
92.7, 95.2 4.8, 7.3
91.5* 90.3, 92.8 8.5* 7.2, 9.7
45-64 Excellent/Very good/Good Fair/Poor
87.1 * 12.9 *
84.8, 89.3 10.7, 15.2
82.8* 80.9, 84.7 17.2* 15.3, 19.1
65+ Excellent/Very good/Good Fair/Poor
72.7 27.3
69.2, 76.1 23.9, 30.8
71.1 68.2, 73.9 28.9 26.1, 31.8
All‡
Excellent/Very good/Good Fair/Poor
88.3 * 11.7 *
87.3, 89.3 10.7, 12.7
85.4* 84.8, 86.1 14.6* 13.9, 15.2
Data source: Joint Canada/United States Survey of Health, 2002/03Notes: Household population aged 18 and over.Missing data ("I don't know", "not stated", "refusal") have been excluded from the analysis.‡ Age-adjusted percents calculated using the projected 2000 U.S. standard population. * Statistically significant difference between Canada and U.S. (p < 0.05).
Joint Canada/United States Survey of Health, 2002-03 Statistics Canada, Catalogue 82M0022-XIE

*
Chart 1 General health status by age group, Canada and United States,2002/03 % 100
90
80
70Poor
60
* * * *
* *
* *
* * *
*
* * .. E
* * * *
Fair
Good50 Very Good
40 Excellent
30
20
10
0 Canada U.S. Canada U.S. Canada U.S. Canada U.S.
All‡ 18-44 45-64 65+
Data source: Joint Canada/United States Survey of Health, 2002/03.Notes: Household population aged 18 and over.Missing data (“I don’t know”, “not stated”, “refusal”) have been excluded fromthe analysis.‡ Age-adjusted percents calculated using the projected 2000 U.S. standardpopulation.* Statistically significant difference between Canada and U.S. (p <0.05).E Interpret with caution (high sampling variability)... Data not provided due to extreme sampling variability or small sample size.
Chart 2 General health status by gender, Canada and United States, 2002/03‡
% 100
90
80
70
* *
*
*** *
* *
Poor60 Fair
50 Good
Very Good40Excellent
30
20
10
0Canada U.S. Canada U.S.
Males Females
Data source: Joint Canada/United States Survey of Health, 2002/03.Notes: Household population aged 18 and over.Missing data (“I don’t know”, “not stated”, “refusal”) have been excluded fromthe analysis.‡ Age-adjusted percents calculated using the projected 2000 U.S. standard population. * Statistically significant difference between Canada and U.S. (p <0.05).
11
Mobility Limitation
• Overall, Americans and Canadians reportedsimilar rates of mobility limitation withAmericans having a slightly higher ratecompared with Canadians.
• The overall higher rate of mobility limitationfound in the U.S. was due to the higher rateof highly severe limitations among American women.
Mobility limitations are an important aspect of health status since they can affect an individual’s ability to participate in society. Individuals were asked if they had any difficulties with a range of activities including walking, standing or climbing. Overall, Americans and Canadians had similar rates of mobility limitation, slightly more Americans reporting some level of difficulty with mobility (25%) than Canadians (24%). This is likely due to the somewhat higher rate of Americans who reported highly severe limitations: 6% of Americans reported that they “could not” walk, stand or climb compared with 4% of Canadians. In turn, this difference is mainly accounted for by the higher percentage of women with highly severe mobility limitations (i.e. cannot walk, stand or climb) in the U.S. (7%) versus Canada (4%); rates for men were similar. (Chart 3 – Table A.3)
Depression
• Overall, the proportion of individuals whohad experienced a major depressiveepisode in the past 12 months was thesame in Canada and the U.S.
Mental health is an important population health issue in both countries. A series of mental health related questions were used to determine whether or not an individual had experienced a major depressive episode in the previous 12 months. (see Definitions) Approximately 8% of respondents in both countries had likely experienced a major depressive episode in the previous year. In both countries, the rates were higher among females than among males. Approximately 7% of males in each country had experienced a major depressive episode compared with approximately 10% among women in both countries. (Chart 4 – Table A.4) There were no significant differences in rates of major depressive episodes between the two countries for any age group or gender.
Risk Factors
• Canada had a slightly higher percentage ofcurrent daily smokers.
Joint Canada/United States Survey of Health, 2002-03 Statistics Canada, Catalogue 82M0022-XIE

***
*
12
Chart 3Mobility limitationa by gender, Canada and United States,2002/03‡
• Canadian women aged 65 and over weremore likely to be a daily smoker thanAmerican women of the same age.
%
* *
* ** *
• U.S. had a higher overall rate of obesity thanCanada — American women were more likely to be obese than Canadian women.
40
30
Risk factors such as smoking and obesity are important determinants of health status. Smoking is
20 a major risk factor for cancer, circulatory and respiratory disease. Overall, 19% of Canadians were considered current daily smokers compared with 17% of Americans. The difference is partly due to the higher rate of daily smokers among women aged 65 and older
10
0 in Canada (10%) compared with those aged 65 and Canada U.S. Canada U.S. Canada U.S.
older in the US (6%). (Chart 5 – Table A.5). All Males Females
Cannot do Very difficult Obesity is a major risk factor for several diseasesSomewhat difficult A little difficult including diabetes, hypertension and cardiovascular
Data source: Joint Canada/United States Survey of Health, 2002/03.disease. Individuals with a Body Mass Index (BMI) of
Notes: Household population aged 18 and over. 30 or greater are considered obese by international
Missing data (“I don’t know”, “not stated”, “refusal”) have been excluded from standards (see Definitions). A significantly higher the analysis. proportion of Americans were obese compared with ‡ Age-adjusted percents calculated using the projected 2000 U.S. standard Canadians (21% vs 15%). The differences between population. the two countries are primarily a result of the * Statistically significant difference between Canada and U.S. (p <0.05). differences between American and Canadian women. a See definitions for list of activities. One in five American women were obese compared
with approximately one in eight Canadian women (21% vs. 13%). (Chart 6 – Table A.6) There were no
Chart 4 Individuals experiencing a major depressive episode in the
significant differences in the BMI distribution among males in the two countries.
past year by gender and age group, Canada and United States,2002/03‡
Income Differences and Health %
• In both countries, those with the lowest14
incomes reported poorer health and higherrates of severe mobility limitation as wellas higher levels of smoking and obesity.
12
10
• Low income Americans were more likely8 to be in fair or poor health and to have
* severe mobility limitation than low incomeCanadians.
6
4
• The health disparities between those with2 EE E E E high and low incomes were greater in the
U.S. compared with Canada.0 Canada U.S. Canada* U.S. Canada U.S.
All Males Females Health status tends to be patterned by social position 18-44 65+ (measured by income or education levels) in most45-64
Data source: Joint Canada/United States Survey of Health, 2002/03. industrialized countries. This patterning tends to follow
Notes: Household population aged 18 and over. what has been called a “social gradient” such that Missing data (“I don’t know”, “not stated”, “refusal”) have been excluded from health status deteriorates in a step-like fashion from the analysis. higher to lower income or education category. As such, ‡ Age-adjusted percents calculated using the projected 2000 U.S. standardpopulation.E Interpret with caution (high sampling variability).
health status information from the JCUSH is analysed by income level to identify differences in the social disparities related to health between the two countries.
Joint Canada/United States Survey of Health, 2002-03 Statistics Canada, Catalogue 82M0022-XIE

* *
Chart 5 Current daily smokers by age group, Canada and UnitedStates, 2002/03
%
30
20
10
0All ‡ 18-44 45-64 65+
*
*
*
*
Canada U.S.
Data source: Joint Canada/United States Survey of Health, 2002/03.Notes: Household population aged 18 and over.Missing data (“I don’t know”, “not stated”, “refusal”) have been excluded fromthe analysis.‡ Age-adjusted percents calculated using the projected 2000 U.S. standard population. * Statistically significant difference between Canada and U.S. (p <0.05).
Chart 6 Body Mass Index (BMI) by gender, Canada and United States, 2002/03‡
% 100
Obese 90 * *
** *
*
* *
.. ..
Overweight
Insufficient weight
70
80
Normal weight60
50
40
30
20
10
0Canada U.S. Canada U.S. Canada U.S.
All Males Females
Data source: Joint Canada/United States Survey of Health, 2002/03.Notes: Household population aged 18 and over.Missing data (“I don’t know”, “not stated”, “refusal”) have been excluded fromthe analysis.‡ Age-adjusted percents calculated using the projected 2000 U.S. standard population. * Statistically significant difference between Canada and U.S. (p <0.05). .. Data not provided due to extreme sampling variability or small sample size.
13
In both countries, those in the lower income groups were more likely to be in fair or poor health, to have severe mobility limitation, to smoke and to be obese. A higher proportion of those in the lower income groups reported poorer health in the U.S. than in Canada but there were no significant differences in the middle and high income groups between the two countries. For example, 31% of low income Americans reported that their health was fair or poor compared with 23% of low income Canadians. The gap between the lowest and highest income groups in the proportion of those with fair/poor health was 19 percentage points in Canada and 24 percentage points in the U.S. (Chart 7 – Table A.7)
In addition, the disparity in severe mobility limitation between high and low income individuals was greater in the U.S. than Canada. The difference between the lowest and highest income groups in the proportions of individuals with severe mobility limitation was 19 percentage points in the U.S. and 13 percentage points in Canada. (Chart 8 – Table A.8)
For three of the five income groups, the obesity rate was higher among Americans than Canadians. Differences were most notable in the lowest income group where the obesity rate was 9 percentage points higher for the U.S. than Canada (27% vs. 18%). The gradient between income groups was also steeper in the U.S. The differential in obesity rate between the lowest and highest income groups was more than double for the U.S. compared with Canada. (Chart 9 – Table A.9)
Differences between the two countries related to income were not found for current daily smoking behavior. In both countries, the levels of such smoking behavior were higher among those with lower incomes but there were no statistically significant differences in levels between the two countries by income group. In both Canada and the U.S., the difference in current daily smoking rates between the lowest and highest income groups was approximately 13 percentage points. (Chart 10 – Table A.10)
Access to Health Care Services
A comparison of access to health care services between Canada and the U.S. is of particular interest given the health system differences between the two countries, most notably the role of public and private insurance. Canadians have universal access to publicly funded health care services, primarily physician and hospital services. In the U.S., the majority of citizens require private insurance to cover the cost of medical care services; public insurance is provided for the poor (Medicaid) and for those over 65 years of age (Medicare). Given these differences,
Joint Canada/United States Survey of Health, 2002-03 Statistics Canada, Catalogue 82M0022-XIE

14
Chart 7 information on insurance status is included in theFair/poor general health by household income quintile, Canada analyses of health care use.and United States, 2002/03‡
Based on the results of JCUSH, approximately 11% % of Americans do not have health insurance. Sixteen 40
30
20
10
0 1st 2nd 3rd 4th 5th Missing
(Poorest) (Richest)
*
*
*
*
E E
Income quintile (adjusted for household size)
Canada U.S.
Data source: Joint Canada/United States Survey of Health, 2002/03.Notes: Household population aged 18 and over.Missing data (“I don’t know”, “not stated”, “refusal”) have been excluded fromthe analysis.‡ Age-adjusted percents calculated using the projected 2000 U.S. standard population. * Statistically significant difference between Canada and U.S. (p <0.05). E Interpret with caution (high sampling variability).
Chart 8 Severe mobility limitation by household income quintile,Canada and United States, 2002/03‡
%
30
20
10
0 1st 2nd 3rd* 4th 5th Missing
(Poorest) (Richest)
*
* * *
*
* E E EE
Income quintile (adjusted for household size)
Canada U.S.
Data source: Joint Canada/United States Survey of Health, 2002/03.Notes: Household population aged 18 and over.Missing data (“I don’t know”, “not stated”, “refusal”) have been excluded fromthe analysis.‡ Age-adjusted percents calculated using the projected 2000 U.S. standard population. * Statistically significant difference between Canada and U.S. (p <0.05). E Interpret with caution (high sampling variability).
percent of Americans between 18 and 44 years of age were uninsured compared with 9% of Americans 45 to 64 years of age and 1% of those 65 years of age and older. One in four Americans (26%) in the lowest income quintile are uninsured, representing 36% of all uninsured individuals.
Access to doctors
• While the majority of both Canadians andAmericans reported having a regular medicaldoctor, overall, a higher percentage ofCanadians reported having a regular medicaldoctor compared with Americans - The percentage of Canadians having a regularmedical doctor was similar to the rate amonginsured Americans.
• Canadians were similar to Americans regarding the proportion contacting anymedical doctor in the previous 12 months.Uninsured Americans were less likely tocontact any medical doctor.
While the majority of individuals in both Canada and the U.S. reported having a regular medical doctor, the rate for Canada was 5 percentage points higher (85% vs. 80%). The difference is mainly due to the significantly lower proportion of uninsured Americans with a regular medical doctor (43%). (Chart 11 – Table A.11). There was no difference between Canadians and insured Americans regarding access to a regular medical doctor.
The majority of Canadians and Americans had at least one contact with any medical doctor in the previous 12 months (83% vs. 82%). Insured Americans were slightly more likely than Canadians to have contacted any doctor compared with Canadians (86% vs. 83%). However, significantly fewer uninsured Americans contacted a doctor in the previous 12 months (61%). (Table 2)
Overall, patterns of contact with any doctor by self-reported health status were the same for Canada and the U.S. As expected, individuals in poorer health status were more likely to have contacted a medical doctor. (Chart 12 – Table A.13)
Mammograms
• Overall, American women aged 50-69 weremore likely than Canadian women of the
Joint Canada/United States Survey of Health, 2002-03 Statistics Canada, Catalogue 82M0022-XIE

*
15
Table 2 Individuals who contacted a medical doctor one or more times in the past 12 months, Canada and United States, 2002/03‡
Canada United States
All Insured Uninsured
95% 95% 95% 95% confidence confidence confidence confidence
% interval % interval % interval % interval
83.4~# 82.1, 84.7 82.4 81.2, 83.5 85.6~ 84.5, 86.8 61.4# 56.9, 65.9
Data source: Joint Canada/United States Survey of Health, 2002/03Notes: Household population aged 18 and over.Missing data ("I don't know", "not stated", "refusal") have been excluded from the analysis.‡ Age-adjusted percents calculated using the projected 2000 U.S. standard population. ~Statistically significant difference between Canada and U.S. Insured (p<0.05). # Statistically significant difference between Canada and U.S. Uninsured (p<0.05).
same age to have had a mammogram inthe last 2 years.
• There were no differences between the two countries regarding the proportion ofwomen 50-69 who had never had a mammogram.
Chart 9 Obesity by household income quintile, Canada and UnitedStates, 2002/03‡
%
Mammograms are considered important for the early detection and treatment of breast cancer. There are two types of mammograms – diagnostic and screening. Diagnostic mammograms are requested by a physician when there is a suspicion of cancer. Screening mammograms are conducted to look for evidence of cancer when there are no other symptoms. The guidelines for the use of screening mammograms vary between the two countries. In Canada, screening
Chart 10 Current daily smokers by household income quintile, Canadaand United States, 2002/03‡
%
30
20
10
0
* *
*
** *
*
*
1st 2nd 3rd 4th 5th Missing (Poorest) (Richest)
Income quintile (adjusted for household size)
Canada U.S.
Data source: Joint Canada/United States Survey of Health, 2002/03.Notes: Household population aged 18 and over.Missing data (“I don’t know”, “not stated”, “refusal”) have been excluded fromthe analysis.‡ Age-adjusted percents calculated using the projected 2000 U.S. standard population. * Statistically significant difference between Canada and U.S. (p <0.05).
30
20
10
0 1st 2nd 3rd 4th 5th Missing
(Poorest) (Richest)
*
*
Income quintile (adjusted for household size)
Canada U.S.
Data source: Joint Canada/United States Survey of Health, 2002/03.Notes: Household population aged 18 and over.Missing data (“I don’t know”, “not stated”, “refusal”) have been excluded fromthe analysis.‡ Age-adjusted percents calculated using the projected 2000 U.S. standard population. * Statistically significant difference between Canada and U.S. (p <0.05).
Joint Canada/United States Survey of Health, 2002-03 Statistics Canada, Catalogue 82M0022-XIE

*
16
Chart 11 Individuals with a regular medical doctor, Canada and United States, 2002/03‡
% 100
90
80
70
60
50
40
30
20
10
0 Canada* # All* Insured Uninsured #
U.S.
Data source: Joint Canada/United States Survey of Health, 2002/03.Notes: Household population aged 18 and over.Missing data (“I don’t know”, “not stated”, “refusal”) have been excluded fromthe analysis.‡ Age-adjusted percents calculated using the projected 2000 U.S. standard population. * Statistically significant difference between Canada and U.S. All (p <0.05). # Statistically significant difference between Canada and U.S. Uninsured (p <0.05).
mammograms are recommended for most women between the ages of 50 and 69 every two years.12 In the United States, The National Center for Chronic Disease Prevention and Health Promotion recommends that women between 40 and 74 years of age have a mammogram every one to two years.13
To ensure comparability, women aged 50 to 69 were selected to compare mammography use in the two countries.
Overall, the proportion of women who had a mammogram within the last 2 years was 82% in the U.S. and 74% in Canada. Over 60% of women aged 50-69 in the U.S. had a mammogram in the last 12 months compared with less than half (48%) in Canada. Conversely, one in four women aged 50-69 in Canada had a mammogram one to two years ago compared with 17% in the U.S. There was no difference between the two countries regarding the proportion of women aged 50-69 years who had never had a mammogram. (Table 3)
Prescription medicines
• The overall pattern of use of prescriptionmedicines was similar in the two countries.
Chart 12 Individuals who contacted any doctor in the past 12 monthsby general health status, Canada and United States, 2002/03‡
%
100
90
80
70
60
50
40
30
20
10
0 Excellent Very good Good Fair Poor
Canada U.S.
* * * *
*
* *
Data source: Joint Canada/United States Survey of Health, 2002/03.Notes: Household population aged 18 and over.Missing data (“I don’t know”, “not stated”, “refusal”) have been excluded fromthe analysis.‡ Age-adjusted percents calculated using the projected 2000 U.S. standard population. * Statistically significant difference between Canada and U.S. (p <0.05).
• Americans aged 45-64 were more likely toreport that they had used prescriptionmedication in the past month comparedwith Canadians in the same age group. This was true for both men and women.
Pharmaceuticals represent a significant portion of overall health care expenditures in both countries. In both Canada and the United States, most individuals depend on private insurance to cover the costs of prescribed medicines or they pay out of pocket. In Canada, the costs of prescribed medications for those aged 65 and over are partially covered by public insurance. Based on results from the JCUSH, most individuals aged 18 and over had private insurance for prescription medications in Canada (77%) and the U.S. (79%). (Table A.17)
Overall, over half of respondents in both countries reported that they had taken a prescription medication in the past month. The reported use was higher among those 65 years of age and older than among younger respondents and higher among women than men regardless of age. (Table 4)
The only significant difference between the two countries was among those 45-64 years of age. Overall, 68% of Americans in this age group reported
Joint Canada/United States Survey of Health, 2002-03 Statistics Canada, Catalogue 82M0022-XIE

17
prescription medication use compared with 61% of Unmet health care needs Canadians. The difference was true for both men (63% vs. 55%) and women (74% vs. 66%). (Table 4)
Dentist visits
• The majority of respondents in both countriesindicated that they had visited a dentist in the past year.
• The patterns of use were similar between thetwo countries, with a higher rate of dentalvisits among those with dental insurance.
Dental services are another example where individuals in both countries depend on private insurance. Results from the JCUSH indicate that 62% of individuals in both Canada and the U.S. have private dental insurance. (Table A.17)
Overall, the majority of respondents in both countries indicated that they had visited a dentist in the past year (63% in both countries). Less than 3% indicated that they had never been to the dentist. (Table 5)
The use of dental services by insurance status was similar in the two countries. In both countries, over 70% of individuals with dental insurance visited the dentist in the past 12 months compared with 47% among those without insurance. A slightly higher proportion of uninsured Canadians had not visited a dentist in the last 5 years (17%) compared with uninsured Americans (14%). (Table 5)
Table 3
• Overall, a higher proportion of Americans than Canadians reported that they hadexperienced an unmet health care need in theprevious year.
• A higher proportion of Americans in the lowest income quintile reported an unmethealth care need compared with low incomeCanadians - There was no significantdifference in unmet health care needs amongthose with higher incomes.
• The top reasons for unmet health care needsdiffered between the two countries: “waitingtoo long for care” in Canada and “cost” inthe U.S.
Unmet health care needs provide a measure of access to health care services that focuses on individuals’ experiences accessing care. Individuals were asked whether there was a time in the previous 12 months that they felt they needed health care services but did not receive them.
Overall, slightly more Americans than Canadians reported an unmet health care need (13% vs. 11%). The difference was much higher when Canadians were compared with uninsured Americans (11% vs. 40%). There was no significant difference in unmet health care needs between Canadians and insured Americans (11% vs. 10%). (Chart 13 – Table A.14)
Use of mammograms among women aged 50-69, Canada and United States, 2002/03
<1 year ago1 year to 2 years ago2 years to 5 years ago5+ years agoNever
Canada United States
95% 95% confidence confidence
% interval % interval
48.1 * 25.5 * 11.9 *
.. 10.2
43.4, 52.9 21.2, 29.9 8.7, 15.0
.., .. 7.4, 13.0
64.4* 17.2* 6.7* 3.3E
8.4
60.9, 67.9 14.4, 20.1
4.8, 8.6 2.0, 4.6 6.2, 10.6
Data source: Joint Canada/United States Survey of Health, 2002/03Notes: Based on female population aged 50-69.Missing data ("I don't know", "not stated", "refusal") have been excluded from the analysis.* Statistically significant difference between Canada and U.S. (p<0.05).E Interpret with caution (high sampling variability)... Data not provided due to extreme sampling variability or small sample size.
Joint Canada/United States Survey of Health, 2002-03 Statistics Canada, Catalogue 82M0022-XIE

18
Table 4 Prescription medication use in the past month by gender and age group, Canada and United States, 2002/03
Canada United States
95% 95% confidence confidence
% interval % interval
Males 18-44 45-64 65+ All‡
32.4 55.0 * 85.0 48.1
28.7, 36.1 50.3, 59.7 80.8, 89.1 45.6, 50.6
30.6 63.0* 81.9 49.0
27.6, 33.659.4, 66.578.1, 85.8 46.9, 51.1
Females 18-44 45-64 65+ All‡
52.1 66.4 * 90.1 62.9
48.7, 55.6 62.2, 70.6 87.2, 93.1 60.6, 65.1
54.3 73.6* 88.0 65.8
51.2, 57.370.4, 76.785.6, 90.5 63.9, 67.7
All 18-44 45-64 65+ All‡
42.2 60.8 * 87.9 55.5
39.7, 44.7 57.5, 64.0 85.5, 90.3 53.8, 57.2
42.6 68.4* 85.4 57.6
40.4, 44.866.1, 70.883.3, 87.6 56.2, 59.0
Data source: Joint Canada/United States Survey of Health, 2002/03Notes: Household population aged 18 and over.Missing data ("I don't know", "not stated", "refusal") have been excluded from the analysis.‡ Age-adjusted percents calculated using the projected 2000 U.S. standard population. * Statistically significant difference between Canada and U.S. (p<0.05).
When asked about the reasons for having an unmet health care need, most Canadians who experienced an unmet health care need reported that long waiting times for care was the primary barrier (32%) while most Americans cited cost (53%). Cost was the primary barrier cited in the U.S. regardless of insurance status.
In both countries, those with lower incomes experienced higher levels of unmet needs compared with those with higher incomes. However, significantly more Americans in the lowest income quintile reported an unmet health care need than low income Canadians (27% vs. 17%). There was no difference in the rate of unmet health care needs among those with higher incomes. The gap in unmet health care needs between the highest and lowest income group was significantly higher in the U.S. (17 percentage points compared with Canada (8 percentage points). (Chart 14 – Table A.16)
Quality and Satisfaction with Health CareServices
• Overall, Canadians and Americans differed in their assessment of the quality of health care services in general but were similar whenasked specifically about doctor services.
• Americans were more likely to be "verysatisfied" with their health care services, including physician services, while Canadians were more likely to be "somewhatsatisfied" with their health care services.
Quality
Respondents were asked to rate the quality of their health care services during the past 12 months as well as the quality of care they received during their most recent visit to their family doctor or other medical doctor (response categories were “excellent”, “good”, “fair” or “poor”). Americans were more likely than Canadians to report that the quality of their health care services in general was “excellent” (42% vs. 39%). Canadians were more likely to report that the quality was “fair” (12% vs. 10%). These differences remained when Canadians were compared with insured Americans. Uninsured Americans, however, were less likely than Canadians to report that the quality of their health care services was “excellent” (28%) and more likely to report that it was “fair” (20%) or “poor” (8%). (Table 6)
Canadians and Americans were similar regarding their more specific assessment of the quality of care they had received during their last doctor visit. Nearly 60% of Canadians and insured Americans indicated that the quality was “excellent”. (Table 6)
Joint Canada/United States Survey of Health, 2002-03 Statistics Canada, Catalogue 82M0022-XIE

19
Table 5 Dental visits by insurance status, Canada and United States, 2002/03‡
Canada United States
95% 95% confidence confidence
% interval % interval
Insured <1 year ago1 year to 2 years ago2 years to <3 years ago3 years to <5 years ago5+ years agoNever Been
71.9 11.6 4.1 3.6 7.3
..
69.9, 74.0 10.2, 13.0
3.2, 5.1 2.7, 4.6 6.1, 8.5
.., ..
72.4 11.6 4.4 3.9 6.4
..
70.7, 74.2 10.3, 12.8
3.6, 5.3 3.1, 4.8 5.4, 7.4
.., ..
Uninsured <1 year ago1 year to 2 years ago2 years to <3 years ago3 years to <5 years ago5+ years agoNever Been
47.0 16.5
9.5 7.0
16.7 * 3.3 E
44.0, 49.9 14.2, 18.9
7.6, 11.4 5.5, 8.6
14.6, 18.7 2.0, 4.7
47.2 17.1 9.2 8.4
13.7* 4.3
44.7, 49.7 15.2, 19.1
7.7, 10.8 6.8, 9.9
12.1, 15.4 3.2, 5.4
All <1 year ago1 year to 2 years ago2 years to <3 years ago3 years to <5 years ago5+ years agoNever Been
62.8 13.2
5.8 4.7
11.5 * 2.0
61.2, 64.4 12.0, 14.5
5.0, 6.7 4.0, 5.5
10.4, 12.5 1.4, 2.5
63.1 13.6 6.0 5.5 9.3* 2.4
61.7, 64.5 12.6, 14.6
5.3, 6.8 4.8, 6.3 8.5, 10.1 1.9, 2.9
Data source: Joint Canada/United States Survey of Health, 2002/03Notes: Household population aged 18 and over.Missing data ("I don't know", "not stated", "refusal") have been excluded from the analysis.‡ Age-adjusted percents calculated using the projected 2000 U.S. standard population. * Statistically significant difference between Canada and U.S. (p<0.05).E Interpret with caution (high sampling variability)... Data not provided due to extreme sampling variability or small sample size.
Satisfaction
Respondents were also asked to rate their satisfaction with their health care services during the past 12 months as well as their satisfaction with physician services during their most recent visit (response categories were “very satisfied”, “somewhat satisfied”, “neither satisfied nor dissatisfied”, “somewhat dissatisfied”, or “very dissatisfied”).
When asked about their satisfaction with health care services in general, more Americans than Canadians reported that they were “very satisfied” (53% vs. 44%). Canadians were more likely to indicate that they were “somewhat satisfied” (43% vs. 37%). These differences remained when Canadians were compared with insured Americans.
Canadians were in fact more similar to uninsured Americans regarding satisfaction with care. The only significant difference between Canadians and uninsured Americans was the proportion reporting that they were “very dissatisfied” with their health care
services: 9% of uninsured Americans and 3% of Canadians said they were very dissatisfied. (Table 7)
When asked specifically about satisfaction with physician services, insured Americans were more likely than Canadians to report that they were “very satisfied” (68% vs. 64%). (Table 7)
CONCLUSIONS
The JCUSH represents a unique population health survey conducted jointly by two national statistical agencies, Statistics Canada and the U.S. National Center for Health Statistics. The use of a common questionnaire and identical data collection and processing methods provides highly comparable data. As a result, the findings from JCUSH provide valuable insights regarding similarities and differences between Canada and the U.S. in a manner not previously possible.
Joint Canada/United States Survey of Health, 2002-03 Statistics Canada, Catalogue 82M0022-XIE

**
20
Chart 13 Individuals reporting an unmet health care need, Canada andUnited States, 2002/03‡
Overall, the health status of Canadians and Americans is generally similar with most individuals in both countries reporting that they are in good, very good
% 50
40
30
20
10
0 Canada*# All* Insured Uninsured#
U.S.
Data source: Joint Canada/United States Survey of Health, 2002/03.Notes: Household population aged 18 and over.Missing data (“I don’t know”, “not stated”, “refusal”) have been excluded fromthe analysis.‡ Age-adjusted percents calculated using the projected 2000 U.S. standard population. * Statistically significant difference between Canada and U.S. All (p <0.05). # Statistically significant difference between Canada and U.S. Uninsured (p <0.05).
Chart 14 Individuals reporting an unmet health care need by householdincome quintile, Canada and United States, 2002/03‡
%
30
20
10
0 1st 2nd 3rd 4th 5th Missing
(Poorest) (Richest)
*
*
Income quintile (adjusted for household size)
Canada U.S.
Data source: Joint Canada/United States Survey of Health, 2002/03.Notes: Household population aged 18 and over.Missing data (“I don’t know”, “not stated”, “refusal”) have been excluded fromthe analysis.‡ Age-adjusted percents calculated using the projected 2000 U.S. standard population. * Statistically significant difference between Canada and U.S. All (p <0.05).
or excellent health. More Americans, however, reported being at either end of the health status spectrum - in excellent health and in fair and poor health - compared with Canadians. This was particularly true among women. This may be associated with the higher rate of highly severe mobility limitation and obesity among American women. There were relatively few differences between men.
Canadians and Americans were similar regarding access to health care services provided under similar funding models. In the case of dental services, for example, where most depend on private insurance, access was similar in the two countries.
Canadians and Americans differed overall, however, regarding access to health care services provided under different insurance models such as those covering physician services. While Canadians are similar to insured Americans regarding access to a regular medical doctor and regarding unmet health care needs, they face significantly fewer barriers to care when compared with uninsured Americans.
The greatest differences between the two countries are related to differentials by income in health. While there has been solid evidence for some time of the social gradient in health status in both Canada and the United States,14 this is the first time that we have been able to examine the question of whether there are systematic differences in health status by social position in the two countries. One of the important findings of this survey is that Americans in the poorest income quintile report fair or poor health, obesity and severe mobility impairment more frequently than their Canadian counterparts. At the other end of the income spectrum, there are no systematic differences in the reporting of fair or poor health or mobility impairment among the most affluent households on either side of the border.
This report represents a first look at the results from the JCUSH. While it highlights a range of similarities and differences between the two countries, additional in-depth analyses are required to better understand these results, particularly in those areas where Canadians and Americans differ. Researchers from both Statistics Canada and the U.S. National Center for Health Statistics will be using the JCUSH data to conduct further analyses in key areas over the coming months.
Joint Canada/United States Survey of Health, 2002-03 Statistics Canada, Catalogue 82M0022-XIE

21
Table 6 Quality of health care and physician services received, Canada and United States, 2002/03‡
Canada United States
All Insured Uninsured
95% confidence
% interval %
95% 95% 95% confidence confidence confidence
interval % interval % interval
Any health care serviceExcellent 38.8*~# 37.0, 40.7 Good 46.4 44.4, 48.2 Fair 12.1*~# 10.8, 13.4
41.8* 40.4, 43.4 43.1~ 41.5, 44.8 28.3# 20.9, 36.1 46.6 45.0, 48.2 46.9 45.2, 48.6 43.8 35.4, 51.3 9.5* 8.5, 10.4 8.5~ 7.5, 9.4 20.2E# 13.5, 27.7
#Poor 2.7~# 2.1, 3.3 2.1 1.6, 2.5 1.5~ 1.1, 1.8 .. ., ..
Physician servicesExcellent 58.9 56.8, 61.0 Good 34.0 31.9, 36.0 Fair 5.7 4.6, 6.6 Poor 1.4E 0.9, 1.9
58.7 56.9, 60.6 59.3 57.4, 61.2 48.1 38.2, 57.9 34.1 32.3, 35.8 33.8 31.9, 35.6 39.7 29.8, 49.6
5.8 4.7, 6.7 5.6 4.5, 6.6 .. .., .. 1.5 1.0, 1.8 1.3 0.9, 1.7 .. .., ..
Data source: Joint Canada/United States Survey of Health, 2002/03Notes: Household population aged 18 and over.Missing data ("I don't know", "not stated", "refusal") have been excluded from the analysis.‡ Age-adjusted percents calculated using the projected 2000 U.S. standard population.* Statistically significant difference between Canada and U.S. All (p<0.05).~ Statistically significant difference between Canada and U.S. Insured (p.<0.05).# Statistically significant difference between Canada and U.S. Uninsured (p.<0.05).E Interpret with caution (high sampling variability)... Data not provided due to extreme sampling variability or small sample size.
Table 7 Satisfaction with health care and physician services, Canada and United States, 2002/03‡
Canada United States
All Insured Uninsured
95% confidence
% interval %
95% 95% 95% confidence confidence confidence
interval % interval % interval
Any health care serviceVery satisfied 43.7*~ 41.8, 45.6 Somewhat satisfied 43.3*~ 41.4, 45.2 Neither satisfied nor dissatisfied 4.9*~ 4.1, 5.8 Somewhat dissatisfied 5.5~ 4.7, 6.4 Very dissatisfied 2.6~# 2.0, 3.1
53.3* 51.8, 54.9 54.7~ 53.1, 56.4 38.9 31.0, 47.2 36.7* 35.1, 38.2 36.5~ 34.8, 38.1 40.4 32.6, 48.6 3.5* 2.9, 4.1 3.4~ 2.7, 4.0 .. .., .. 4.7 3.9, 5.4 4.2~ 3.5, 4.9 7.3E 4.4, 9.5 1.9 1.5, 2.3 1.3~ 1.0, 1.6 9.1E# 4.2, 14.4
Physician servicesVery satisfied 64.2~# 62.1, 66.3 Somewhat satisfied 27.3 25.4, 29.3 Neither satisfied nor dissatisfied 2.7*~ 1.9, 3.3 Somewhat dissatisfied 2.3 1.6, 2.9 Very dissatisfied 3.6*~# 2.8, 4.4
66.9 65.2, 68.7 67.8~ 65.9, 69.6 51.5# 41.5, 61.5 26.7 25.0, 28.3 26.7 25.0, 28.5 27.4E 18.1, 36.6 1.6* 1.1, 2.0 1.6~ 1.1, 2.0 .. .., .. 2.2 1.6, 2.8 2.2 1.6, 2.8 .. .., .. 2.6* 2.1, 3.2 1.7~ 1.3, 2.2 18.2E# 9.2, 27.2
Data source: Joint Canada/United States Survey of Health, 2002/03Notes: Household population aged 18 and over.Missing data ("I don't know", "not stated", "refusal") have been excluded from the analysis.‡ Age-adjusted percents calculated using the projected 2000 U.S. standard population.* Significant difference between Canada and U.S. All (p<0.05).~ Statistically significant difference between Canada and U.S. Insured (p.<0.05).# Statistically significant difference between Canada and U.S. Uninsured (p.<0.05).E Interpret with caution (high sampling variability)... Data not provided due to extreme sampling variability or small sample size.
Joint Canada/United States Survey of Health, 2002-03 Statistics Canada, Catalogue 82M0022-XIE

22
References
1 Hussey PS, Anderson GF, Osborn R, Feek C et al. How does the quality of care compare in five countries? Health Affairs 2004;23:89-99.
2 Stoop I, Jowell R, Mohler P. The European Social Survey: One Survey in Two Dozen Countries. Paper presented at the International Conference on Improving Surveys, Copenhagen, 25-28 August 2002.
3 Organization for Economic Cooperation and Development (OECD). Health at a Glance: OECD Indicators 2003. OECD, 2003.
4 Blendon RJ, Leitman R, Morrison I, Donelan K. Satisfaction with health systems in ten nations. Health Affairs 1990; 185192.
5 Blendon RJ, Schoen C, DesRoches C et al. Inequities in Health Care: A Five-Country Survey. Health Affairs 2002; 21:182-191.
6 Davis K, Schoen C, Schoenbaum S, Audet AMJ et al. Mirrror, mirror on the wall: Looking at the quality of American health care through the patient’s lens. The Commonwealth Fund, January 2004.
7 Gentleman J, Simile C, Miller K, Bailie L et al. Examining Comparability : A Joint Bi-national Population Health Survey in the United States and Canada. Proceedings of theInter national Conference on Improving Sur veys, Copenhagen, 2002.
8 Statistics Canada and U.S. National Center for Health Statistics. Joint Canada/United Status Survey of Health: Public Use Microdata File User Guide. 2004.
9 Rust KF, Rao JNK. Variance estimation for complex surveys using replication techniques. Statistical Methods in Medical Research 1996;5:281-310.
10 Yeo D, Mantel H, Liu TP. Bootstrap variance estimation for the National Population Health Survey. American Statistical Association: Proceedings of the Survey Research Methods Section Conference. Baltimore, Maryland, August 1999.
11 American Psychiatric Association. Diagnostic and StatisticalManual of Mental Disorders. Third rev. ed. Washington, DC: American Psychiatric Association, 1987.
12 Health Canada. Mammography and Women’s Health. Women’s Health Bureau. www.hc-sc.gc.ca/english/women/facts_issues/facts_mammo.htm (Accessed May 10, 2004)
13 Centers for Disease Control and Prevention. Breast Cancer and Mammography Information. National Centers for Chronic Disease Prevention and Health Promotion. www.cdc.gov/cancer/nbccedp/info-bc.htm. (Accessed May 10, 2004)
14 Ross NA, Wolfson MC, Dunn JR et al. Relation between income inequality and mortality in Canada and in the UnitedStates: cross-sectional assessment using census data and vitalstatistics. BMJ 2000:320;898-902.
Joint Canada/United States Survey of Health, 2002-03 Statistics Canada, Catalogue 82M0022-XIE

23
APPENDIX A: Additional tables
Table A-1 General health status by age group, Canada and United States, 2002/03
Canada United States
95% 95%confidence confidence
% interval % interval
18-44 Excellent 29.8 Very Good 40.3 * Good 23.9 Fair 4.7 * Poor ..
27.4, 32.1 32.0 29.9, 34.2 37.7, 42.9 34.2* 32.1, 36.3 21.6, 26.1 25.3 23.4, 27.2 3.6, 5.7 6.9* 5.7, 8.1
.., .. 1.6E 1.0, 2.1
45-64 Excellent 22.5 Very Good 34.6 Good 30.0 Fair 8.3 * Poor 4.6
19.7, 25.3 22.9 20.8, 25.0 31.4, 37.8 33.1 30.5, 35.6 27.0, 33.0 26.8 24.4, 29.2 6.4, 10.1 11.3* 9.7, 12.9 3.3, 6.0 5.9 4.7, 7.1
65+ Excellent 8.0 * Very Good 27.0 Good 37.6 * Fair 19.4 Poor 7.9
6.0, 10.0 15.0* 12.8, 17.2 23.5, 30.5 25.8 23.0, 28.6 33.8, 41.4 30.3* 27.5, 33.1 16.4, 22.4 19.4 16.9, 21.9 5.9, 10.0 9.5 7.8, 11.3
All‡
Excellent 23.9 * Very Good 36.3 * Good 28.1 Fair 8.3 * Poor 3.5 *
22.3, 25.4 26.4* 25.1, 27.7 34.6, 38.1 32.4* 31.0, 33.9 26.4, 29.7 26.6 25.2, 28.0 7.3, 9.2 10.3* 9.4, 11.3 2.9, 4.1 4.2* 3.6, 4.8
Data source: Joint Canada/United States Survey of Health, 2002/03Notes: Household population aged 18 and over.Missing data ("I don't know", "not stated", "refusal") have been excluded from the analysis.‡ Age-adjusted percents calculated using the projected 2000 U.S. standard population.* Significant difference between Canada and U.S. (p<0.05).E Interpret with caution (high sampling variability)... Data not provided due to extreme sampling variability or small sample size.
Joint Canada/United States Survey of Health, 2002-03 Statistics Canada, Catalogue 82M0022-XIE

24
Table A-2 General health status by gender, Canada and United States, 2002/03‡
Canada United States
95% 95%confidence confidence
% interval % interval
Males Excellent 25.1 Very Good 35.4 * Good 27.1 Fair 8.7 Poor 3.7
22.8, 27.4 27.5 25.4, 29.6 32.9, 37.9 32.1* 29.8, 34.3 24.7, 29.5 27.1 25.0, 29.1 7.3, 10.1 9.3 8.0, 10.6 2.8, 4.6 4.1 3.3, 4.9
Females Excellent 22.7 * Very Good 37.3 * Good 28.9 Fair 7.8 * Poor 3.3
20.7, 24.8 25.4* 23.7, 27.1 34.9, 39.7 32.7* 30.9, 34.6 26.6, 31.1 26.2 24.4, 28.0 6.6, 9.0 11.3* 10.0, 12.5 2.5, 4.1 4.4 3.6, 5.2
Data source: Joint Canada/United States Survey of Health, 2002/03Notes: Household population aged 18 and over.Missing data ("I don't know", "not stated", "refusal") have been excluded from the analysis.‡ Age-adjusted percents calculated using the projected 2000 U.S. standard population. * Statistically significant difference between Canada and U.S. (p<0.05).
Table A-3 Mobility limitationa by gender, Canada and United States, 2002/03‡
Canada United States
95% 95%confidence confidence
% interval % interval
Males Cannot do 3.6 Very difficult 3.8 Somewhat difficult 4.3 A little difficult 8.1 All 19.8
2.7, 4.5 4.1 3.3, 4.9 2.8, 4.7 3.9 3.1, 4.7 3.3, 5.4 5.1 4.2, 6.0 6.6, 9.6 7.2 6.0, 8.4
17.8, 21.7 20.3 18.8, 21.8
Females Cannot do 4.4 * Very difficult 4.3 Somewhat difficult 7.7 A little difficult 10.9 All 27.3
3.4, 5.3 7.2* 6.3, 8.1 3.4, 5.2 5.3 4.4, 6.2 6.4, 9.0 7.6 6.6, 8.6 9.4, 12.5 9.7 8.5, 10.9
25.1, 29.4 29.8 28.0, 31.5
All Cannot do 4.0 * Very difficult 4.0 Somewhat difficult 6.1 A little difficult 9.5 * All 23.7 *
3.1, 4.9 5.7* 5.2, 6.3 3.6, 4.4 4.6 3.8, 5.4 5.6, 6.6 6.5 5.9, 7.0 8.9, 10.2 8.4* 7.2, 9.6
22.1, 25.2 25.2* 24.2, 26.2
Data source: Joint Canada/United States Survey of Health, 2002/03Notes: Household population aged 18 and over.Missing data ("I don't know", "not stated", "refusal") have been excluded from the analysis.‡ Age-adjusted percents calculated using the projected 2000 U.S. standard population. * Statistically significant difference between Canada and U.S. (p<0.05). a See definition box for the list of activities.
Joint Canada/United States Survey of Health, 2002-03 Statistics Canada, Catalogue 82M0022-XIE

25
Table A-4 Individuals experiencing a major depressive episode in the past year by gender and age group, Canada and United States, 2002/03
Canada United States
95% 95% confidence confidence
% interval % interval
Males 18-44 45-64 65+ All‡
6.6 8.0 2.4 E
6.3
4.7, 8.5 5.4, 10.5 0.9, 4.0 5.0, 7.6
6.6 8.5 3.1E
6.6
4.8, 8.4 6.3, 10.8 1.4, 4.7 5.4, 7.8
Females 18-44 45-64 65+ All‡
12.2 9.0 4.5 E
9.9
10.0, 14.4 6.6, 11.5 2.5, 6.5 8.5, 11.4
12.6 10.9 4.1E
10.6
10.6, 14.6 8.7, 13.0 2.6, 5.6 9.4, 11.9
All 18-44 45-64 65+ All‡
9.4 8.5 3.6 E
8.1
7.9, 10.8 6.7, 10.3 2.3, 4.9 7.2, 9.1
9.6 9.7 3.7 8.6
8.3, 11.0 8.2, 11.2 2.5, 4.8 7.8, 9.5
Data source: Joint Canada/United States Survey of Health, 2002/03Notes: Household population aged 18 and over.Missing data ("I don't know", "not stated", "refusal") have been excluded from the analysis.‡Age-adjusted percents calculated using the projected 2000 U.S. standard population.E Interpret with caution (high sampling variability).
Table A-5 Current daily smokers by gender and age group, Canada and United States, 2002/03
Canada United States
95% 95%confidence confidence
% interval % interval
Males 18-44 22.5 45-64 21.2 65+ 11.4 All‡ 20.2
19.3, 25.7 20.7 18.1, 23.4 17.4, 25.0 19.3 16.1, 22.5 7.8, 14.9 8.6 5.9, 11.3
18.1, 22.3 18.2 16.5, 20.0
Females 18-44 19.5 45-64 18.3 65+ 9.6 * All‡ 17.5
16.7, 22.3 17.0 14.8, 19.1 14.8, 21.8 17.5 14.8, 20.2 6.6, 12.5 6.0* 4.3, 7.8
15.5, 19.4 15.3 13.8, 16.7
All 18-44 21.0 45-64 19.7 65+ 10.4 * All‡ 18.8 *
18.9, 23.1 18.8 17.1, 20.5 17.2, 22.3 18.4 16.3, 20.4 8.1, 12.6 7.1* 5.6, 8.6
17.4, 20.2 16.7* 15.6, 17.8
Data source: Joint Canada/United States Survey of Health, 2002/03Notes: Household population aged 18 and over.Missing data ("I don't know", "not stated", "refusal") have been excluded from the analysis.‡ Age-adjusted percents calculated using the projected 2000 U.S. standard population. * Statistically significant difference between Canada and U.S. (p<0.05).
Joint Canada/United States Survey of Health, 2002-03 Statistics Canada, Catalogue 82M0022-XIE

26
Table A-6 Body Mass Index (BMI) by gender, Canada and United States, 2002/03‡
Canada United States
95% 95%confidence confidence
% interval % interval
Males Normal weight 39.7 Insufficient weight .. Overweight 41.4 Obese 17.9
37.1, 42.1 37.5 35.3, 39.7 .., .. .. .., ..
38.8, 44.1 41.9 39.6, 44.2 15.8, 20.0 19.7 17.9, 21.5
Females Normal weight 56.7 * Insufficient weight 4.7 Overweight 26.1 Obese 12.5 *
54.2, 59.0 49.2* 47.1, 51.1 3.6, 5.8 3.6 2.8, 4.4
24.0, 28.3 25.8 24.1, 27.7 11.0, 14.1 21.4* 19.7, 23.0
All Normal weight 48.1 * Insufficient weight 2.9 Overweight 33.8 Obese 15.3 *
46.3, 49.7 43.3* 41.8, 44.8 2.2, 3.4 2.3 1.8, 2.7
32.2, 35.6 33.9 32.4, 35.3 14.0, 16.6 20.6* 19.4, 21.8
Data source: Joint Canada/United States Survey of Health, 2002/03Notes: Household population aged 18 and over.Missing data ("I don't know", "not stated", "refusal") have been excluded from the analysis.‡ Age-adjusted percents calculated using the projected 2000 U.S. standard population. * Statistically significant difference between Canada and U.S. (p<0.05). .. Data not provided due to extreme sampling variability or small sample size.
Table A-7 Fair/poor general health by household incomea quintile, Canada and United States, 2002/03‡
Canada United States
95% 95%confidence confidence
Income quintile % interval % interval
1st (Poorest) 23.3 * 2nd 13.2 3rd 7.9 4th 8.6 5th (Richest) 4.4 E
Missing 11.9 * Difference of Q1 and Q5 18.8
19.8, 26.8 31.0* 27.4, 34.4 10.5, 15.8 15.8 13.0, 18.5 5.4, 10.4 9.3 6.9, 11.6 6.0, 11.2 6.4 4.6, 8.2 2.2, 6.7 7.0E 4.7, 9.3 9.0, 14.8 16.2* 14.0, 18.5
14.7, 23.0 24.0 19.8, 28.1
Data source: Joint Canada/United States Survey of Health, 2002/03Notes: Household population aged 18 and over.Missing data ("I don't know", "not stated", "refusal") have been excluded from the analysis (except for income due to the high level of missing cases).a Household income adjusted for household size.‡ Age-adjusted percents calculated using the projected 2000 U.S. standard population. * Statistically significant difference between Canada and U.S. (p<0.05). E Interpret with caution (high sampling variability).
Joint Canada/United States Survey of Health, 2002-03 Statistics Canada, Catalogue 82M0022-XIE

27
Table A-8 Severe mobility limitation by household incomea quintile, Canada and United States, 2002/03‡
Canada United States
95% 95% confidence confidence
Income quintile % interval % interval
1st (Poorest)2nd 3rd 4th 5th (Richest)MissingDifference of Q1 and Q5
17.0 * 9.2 3.7E* 4.9 E
4.0 E
8.5 * 13.0 *
14.1, 20.0 6.8, 11.5 2.1, 5.3 3.0, 6.8 1.8, 6.2 6.1, 10.8 9.3, 16.7
22.1* 11.3 6.5* 5.2 3.3E
11.5* 18.8*
19.1, 25.0 9.1, 13.5 4.6, 8.3 3.5, 6.8 1.7, 4.9 9.6, 13.4
15.5, 22.1
Data source: Joint Canada/United States Survey of Health, 2002/03Notes: Household population aged 18 and over.Missing data ("I don't know", "not stated", "refusal") have been excluded from the analysis (except for income due to the high level of missing cases).a Household income adjusted for household size.‡ Age-adjusted percents calculated using the projected 2000 U.S. standard population. * Significant difference between Canada and U.S. (p<0.05). E Interpret with caution (high sampling variability).
Table A-9 Obesity by household incomea quintile, Canada and United States, 2002/03‡
Canada United States
95% 95% confidence confidence
Income quintile % interval % interval
1st (Poorest)2nd 3rd 4th 5th (Richest)MissingDifference of Q1 and Q5
17.6 * 16.6 * 16.2 14.4 * 12.7 13.0 *
.. *
14.3, 21.0 13.4, 19.7 12.7, 19.6 11.2, 17.5 9.4, 16.0 9.4, 16.6
.., ..
27.3* 23.4* 19.4 19.5* 14.8 17.7* 12.4*E
23.6, 31.0 20.0, 26.8 16.2, 22.7 16.5, 22.7 12.1, 17.7 15.4, 20.1
7.7, 17.1
Data source: Joint Canada/United States Survey of Health, 2002/03Notes: Household population aged 18 and over.Missing data ("I don't know", "not stated", "refusal") have been excluded from the analysis (except for income due to the high level of missing cases).a Household income adjusted for household size.‡Age-adjusted percents calculated using the projected 2000 U.S. standard population.* Significant difference between Canada and U.S. (p<0.05).E Interpret with caution (high sampling variability)... Data not provided due to extreme sampling variability or small sample size.
Joint Canada/United States Survey of Health, 2002-03 Statistics Canada, Catalogue 82M0022-XIE

28
Table A-10 Current daily smokers by household incomea quintile, Canada and United States, 2002/03‡
Canada United States
95% 95% confidence confidence
Income quintile % interval % interval
1st (Poorest)2nd 3rd 4th 5th (Richest)MissingDifference of Q1 and Q5
26.8 23.4 16.9 13.2 13.3 20.3 * 13.5 E
23.1, 30.5 19.7, 27.2 13.5, 20.4 10.3, 16.2 9.9, 16.7
16.3, 24.4 8.5, 18.6
22.3 23.7 16.6 14.1 9.2
15.3* 13.1
18.9, 25.7 20.2, 27.2 13.8, 19.4 11.5, 16.7 7.0, 11.5
12.9, 17.7 9.1, 17.1
Data source: Joint Canada/United States Survey of Health, 2002/03Notes: Household population aged 18 and over.Missing data ("I don't know", "not stated", "refusal") have been excluded from the analysis (except for income due to the high level of missing cases).a Household income adjusted for household size.‡ Age-adjusted percents calculated using the projected 2000 U.S. standard population. * Statistically significant difference between Canada and U.S. (p<0.05). E Interpret with caution (high sampling variability).
Table A-11 Individuals with a regular medical doctor, Canada and United States, 2002/03‡
Canada United States
All Insured Uninsured
95% confidence
% interval %
95% 95% 95% confidence confidence confidence
interval % interval % interval
No 15.1*# 13.9, 16.4 20.4* 19.2, 21.6 15.7 14.5, 17.0 57.5# 50.7, 64.4 Yes 84.9*# 83.6, 86.1 79.6* 78.4, 80.8 84.3 83.1, 85.5 42.5# 35.6, 49.3
Data source: Joint Canada/United States Survey of Health, 2002/03Notes: Household population aged 18 and over.Missing data ("I don't know", "not stated", "refusal") have been excluded from the analysis.‡ Age-adjusted percents calculated using the projected 2000 U.S. standard population. * Statistically significant difference between Canada and U.S. All (p<0.05). # Statistically significant difference between Canada and U.S. Uninsured (p<0.05).
Joint Canada/United States Survey of Health, 2002-03 Statistics Canada, Catalogue 82M0022-XIE

29
Table A-12 Individuals with a regular medical doctor by gender and age group, Canada and United States†, 2002/03
Canada United States
95% 95% confidence confidence
% interval % interval
Males 18-44 45-64 65+ All‡
71.1 86.1 96.5 * 79.9
67.8, 74.4 82.8, 89.4 94.6, 98.5 77.9, 82.0
71.7 88.4 91.8* 80.1
68.4, 75.1 85.8, 91.0 89.1, 94.5 78.2, 82.1
Females 18-44 45-64 65+ All‡
85.8 93.1 96.6 89.8
83.4, 88.2 90.9, 95.3 95.0, 98.3 88.4, 91.2
84.9 90.4 94.3 88.2
82.6, 87.1 88.2, 92.7 92.5, 96.1 86.8, 89.6
All 18-44 45-64 65+ All‡
78.4 89.6 96.6 * 84.9
76.4, 80.4 87.6, 91.6 95.3, 97.9 83.6, 86.1
78.5 89.4 93.2* 84.3
76.5, 80.5 87.7, 91.2 91.7, 94.8 83.1, 85.5
Data source: Joint Canada/United States Survey of Health, 2002/03Notes: Household population aged 18 and over.Missing data ("I don't know", "not stated", "refusal") have been excluded from the analysis.† Insured only. ‡Age-adjusted percents calculated using the projected 2000 U.S. standard population.* Statistically significant difference between Canada and U.S. (p<0.05).
Joint Canada/United States Survey of Health, 2002-03 Statistics Canada, Catalogue 82M0022-XIE

30
Table A-13 Individuals who contacted a doctor in the past 12 months by general health status, Canada and United States, 2002/03‡
Canada United States
95% 95% confidence confidence
% interval % interval
Excellent Very Good Good Fair Poor
74.7 * 85.5 84.7 * 90.0 * 94.5
73.0, 76.4 83.9, 87.0 81.8, 87.5 85.7, 94.4 91.7, 97.2
77.3* 85.0 81.5* 85.4* 97.5
75.4, 79.2 83.6, 86.4 80.1, 83.0 83.0, 87.9 94.5,100.5
Data source: Joint Canada/United States Survey of Health, 2002/03Notes: Household population aged 18 and over.Missing data ("I don't know", "not stated", "refusal") have been excluded from the analysis.‡ Age-adjusted percents calculated using the projected 2000 U.S. standard population. * Statistically significant difference between Canada and U.S. (p<0.05).
Table A-14 Individuals reporting an unmet health care need, Canada and United States, 2002/03‡
Canada United States
All Insured Uninsured
95% confidence
% interval %
95% 95% 95% confidence confidence confidence
interval % interval % interval
Yes 10.7*# 9.6, 11.8 13.1* 12.1, 14.2 10.3 9.3, 11.3 40.0# 33.2, 46.7
Data source: Joint Canada/United States Survey of Health, 2002/03Notes: Household population aged 18 and over.Missing data ("I don't know", "not stated", "refusal") have been excluded from the analysis.‡Age-adjusted percents calculated using the 2000 U.S. standard population.*Statistically significant difference between Canada and U.S. All (p<0.05). # Statistically significant difference between Canada and U.S. Uninsured (p<0.05).
Joint Canada/United States Survey of Health, 2002-03 Statistics Canada, Catalogue 82M0022-XIE

31
Table A-15 Individuals reporting an unmet health care need by gender and age group, Canada and United States, 2002/03
Canada United States
95% 95% confidence confidence
% interval % interval
Males 18-44 45-64 65+
11.1 * 8.9
..
8.8, 13.3 6.0, 11.7
.., ..
15.3* 11.0
..
12.7, 17.8 8.6, 13.4
.., ..
Females 18-44 45-64 65+
13.2 11.1 7.7 E
10.9, 15.6 8.4, 13.9 5.3, 10.1
16.3 13.4 6.7
14.1, 18.5 11.1, 15.8 4.8, 8.6
All 18-44 45-64 65+
12.2 * 10.0 7.4
10.5, 13.8 8.0, 12.0 5.6, 9.1
15.8* 12.2 6.5
14.1, 17.5 10.6, 13.9
5.0, 8.0
Data source: Joint Canada/United States Survey of Health, 2002/03Notes: Household population aged 18 and over.Missing data ("I don't know", "not stated", "refusal") have been excluded from the analysis.* Statistically significant difference between Canada and U.S. (p<0.05).E Interpret with caution (high sampling variability)... Data not provided due to extreme sampling variability or small sample size.
Table A-16 Individuals reporting an unmet health care need by householda income quintile, Canada and United States, 2002/03‡
Canada United States
95% 95% confidence confidence
Income quintile % interval % interval
1st (Poorest)2nd 3rd 4th 5th (Richest)MissingDifference of Q1 and Q5
17.4 * 11.3 7.9
10.1 9.5 9.8 7.9*E
14.0, 20.8 8.7, 14.0 5.7, 10.1 7.2, 13.0 6.7, 12.4 6.9, 12.8 3.4, 12.4
26.6* 14.1 9.3 9.0 9.3
11.3 17.3*
23.0, 30.2 11.3, 16.9 7.0, 11.5 6.6, 11.3 6.9, 11.7 9.1, 13.4
12.8, 21.7
Data source: Joint Canada/United States Survey of Health, 2002/03Notes: Household population aged 18 and over.Missing data ("I don't know", "not stated", "refusal") have been excluded from the analysis.a Household income adjusted for household size.‡ Age-adjusted percents calculated using the 2000 U.S. standard population. * Statistically significant difference between Canada and U.S. (p<0.05).
Joint Canada/United States Survey of Health, 2002-03 Statistics Canada, Catalogue 82M0022-XIE
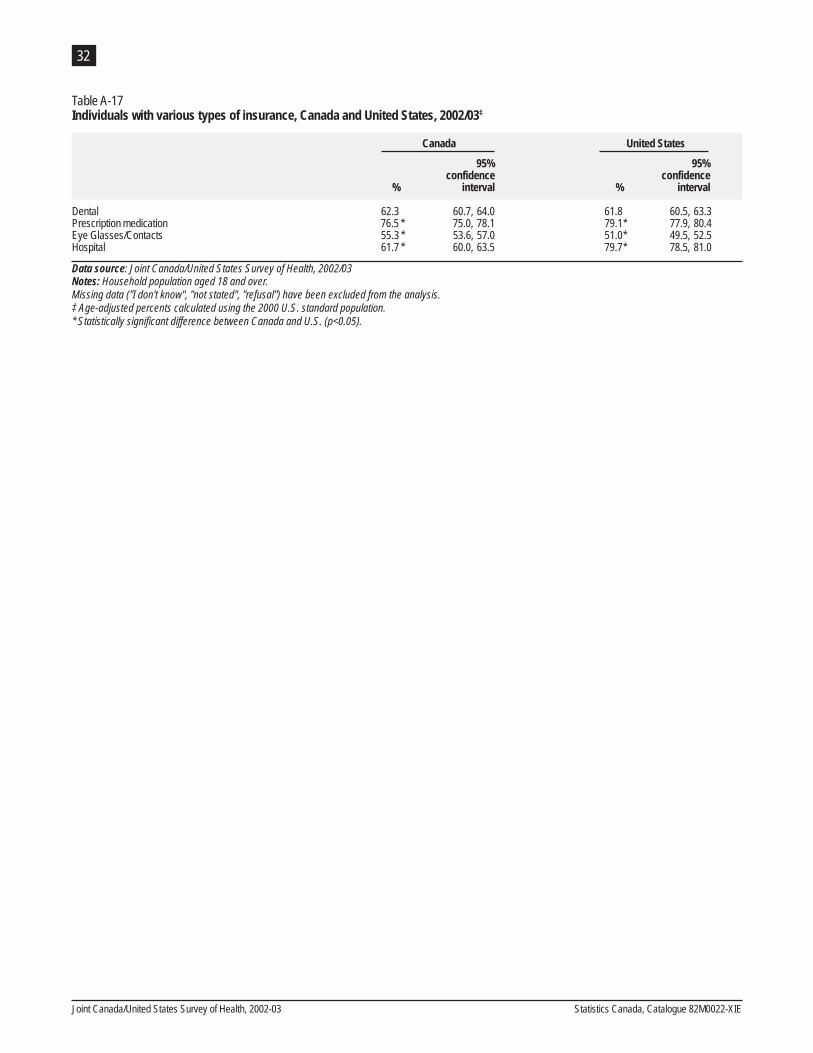
32
Table A-17 Individuals with various types of insurance, Canada and United States, 2002/03‡
Canada United States
95% 95%confidence confidence
% interval % interval
Dental 62.3 Prescription medication 76.5 * Eye Glasses/Contacts 55.3 * Hospital 61.7 *
60.7, 64.0 61.8 60.5, 63.3 75.0, 78.1 79.1* 77.9, 80.4 53.6, 57.0 51.0* 49.5, 52.5 60.0, 63.5 79.7* 78.5, 81.0
Data source: Joint Canada/United States Survey of Health, 2002/03Notes: Household population aged 18 and over.Missing data ("I don't know", "not stated", "refusal") have been excluded from the analysis.‡ Age-adjusted percents calculated using the 2000 U.S. standard population. * Statistically significant difference between Canada and U.S. (p<0.05).
Joint Canada/United States Survey of Health, 2002-03 Statistics Canada, Catalogue 82M0022-XIE