JOHNE’S DISEASE - Cattle Health Certification Standards ...€¦ · Johne’s disease is a...
28
A GUIDE TO SURVEILLANCE JOHNE’S DISEASE
Transcript of JOHNE’S DISEASE - Cattle Health Certification Standards ...€¦ · Johne’s disease is a...

A GUIDE TO SURVEILLANCE
JOHNE’S DISEASE

2

3
Contents Title Page number
An Introduction to Johne’s 4
Technical Impacts of Johne’s 5
Logical approaches to dealing with Johne’s 6
Developing a plan for surveillance and control 8
A guide to report availability 12
Herdwise reports - summary report 13
Herdwise reports - High and low risk reports 14
Herdwise reports - Historic report 15
Herdwise reports - Cohort Monitor reports 17
HerdTracker report 18
Johne’s analysis in InterHerd + software 19
Outlook 20
Cattle purchasing checklist 21
References 22
4
An Introduction to Johne’s
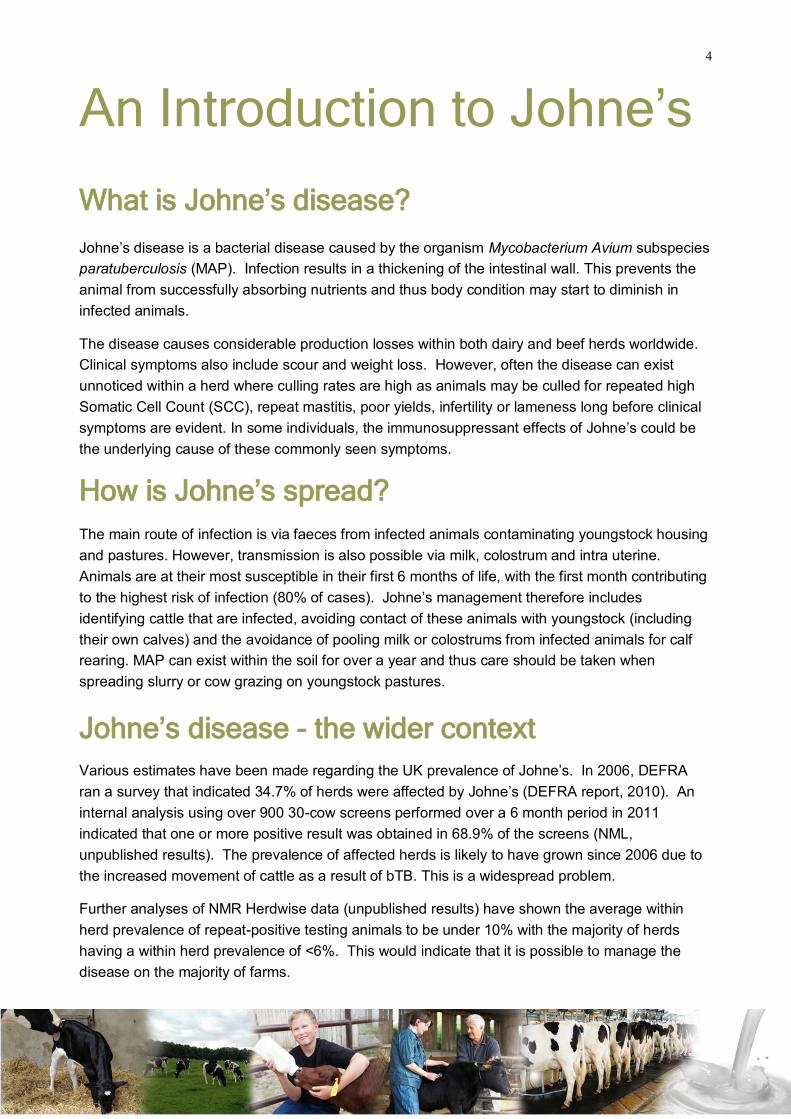
Johne’s disease is a bacterial disease caused by the organism Mycobacterium Avium subspecies
paratuberculosis (MAP). Infection results in a thickening of the intestinal wall. This prevents the
animal from successfully absorbing nutrients and thus body condition may start to diminish in
infected animals.
The disease causes considerable production losses within both dairy and beef herds worldwide.
Clinical symptoms also include scour and weight loss. However, often the disease can exist
unnoticed within a herd where culling rates are high as animals may be culled for repeated high
Somatic Cell Count (SCC), repeat mastitis, poor yields, infertility or lameness long before clinical
symptoms are evident. In some individuals, the immunosuppressant effects of Johne’s could be
the underlying cause of these commonly seen symptoms.
The main route of infection is via faeces from infected animals contaminating youngstock housing
and pastures. However, transmission is also possible via milk, colostrum and intra uterine.
Animals are at their most susceptible in their first 6 months of life, with the first month contributing
to the highest risk of infection (80% of cases). Johne’s management therefore includes
identifying cattle that are infected, avoiding contact of these animals with youngstock (including
their own calves) and the avoidance of pooling milk or colostrums from infected animals for calf
rearing. MAP can exist within the soil for over a year and thus care should be taken when
spreading slurry or cow grazing on youngstock pastures.
Various estimates have been made regarding the UK prevalence of Johne’s. In 2006, DEFRA
ran a survey that indicated 34.7% of herds were affected by Johne’s (DEFRA report, 2010). An
internal analysis using over 900 30-cow screens performed over a 6 month period in 2011
indicated that one or more positive result was obtained in 68.9% of the screens (NML,
unpublished results). The prevalence of affected herds is likely to have grown since 2006 due to
the increased movement of cattle as a result of bTB. This is a widespread problem.
Further analyses of NMR Herdwise data (unpublished results) have shown the average within
herd prevalence of repeat-positive testing animals to be under 10% with the majority of herds
having a within herd prevalence of <6%. This would indicate that it is possible to manage the
disease on the majority of farms.
What is Johne’s disease?
How is Johne’s spread?
Johne’s disease - the wider context

5
For farms to be motivated to tackle infectious disease issues on farm there must be a tangible
benefit in doing so.
The control and prevention of Johne’s disease will:
Reduce or prevent the loss of production and income that results in disease.
Reduce the animal welfare implications of Johne’s infection.
Reduce the levels of forced culls and maximise the value of infected animals in the cull
market by allowing farmers to predict when condition and welfare may suffer and control
when animals can be removed from the herd.
Increase the value of breeding stock for farms which can demonstrate the herd disease
status or show that they are taking a proactive approach to disease control.
Reduce the level of MAP in milk and the environment, in line with the Food Standards
Agency recommendations.
Technical impacts of Johne’s
A US study (Villarano et al, 2005) found that Johne’s infected animals:
Gave on average 4000kg less milk in their lifetime
Were 5 x more likely to be lame
Were 2 x more likely to develop mastitis/SCC problems
Were 1.8 x more likely to develop digestive problems
Further preliminary studies have been performed on Herdwise and NMR data to establish if the
same trends are followed in the UK. This is available at www.nationalmilklabs.co.uk.

6
Logical approaches to dealing with Johne’s
Figure 1. This schematic illustrates a logical approach to tackling Johne’s in a dairy farm
for NMR recorded herds
It is important to establish a base status of the herd. This includes three strands:
A herd-level test to provide an indication of prevalence
An assessment of the risk of entry of the disease (Biosecurity)
An assessment of the risk of spread of the disease (Bio containment)
A useful risk assessment tool can be found at MyHealthyHerd (www.myhealthyherd.com).
Bulk milk antibody ELISA testing is not recommended as a suitable tool for indicating prevalence
of Johne’s within a herd. A low result is misleading. A bulk milk result can be low even if 9-12%
of the animals contributing to the tank are testing ‘high’ for the disease (NMR analysis,
unpublished results).
Establishing a start point

7
30-cow screens are recommended as a start point to assess status. The screen must be
targeted at the animals most likely to be affected by the disease. NMR can automatically select
30 cows based on the last 6 herd recordings for an NMR herd. A study by the University of
Reading found that lactation number (between 3 and 6) and SCC were the parameters with the
highest association with positive Johne’s status. This automatic selection is available both as an
ad hoc screen or as the HerdTracker service (automatic selection of 30 cows quarterly).
If cows are selected by the vet/farmer, it is best to consider animals (in order of priority):
Between 3 to 7 years old
Repeat high SCC or mastitis cows
Cows affected by lameness
Cows demonstrating a drop in milk yield
Generally depressed individuals.
This method is useful not only as an indication of herd status but as a tool to demonstrate to the
farmer that Johne’s is present. Culling decisions should not be based on a single milk test. The
30-cow screen is simply a herd-level indicator. If individual cows return a ‘high’ result, they
should be treated as a risk to the herd. These animals can be marked using Nordic Star’s ankle
straps (www.nordicstar.co.uk or 0800 7319465) or other practical means. Confirmatory testing
can be carried out by blood or milk sampling through NML but care must be taken when
comparing blood and milk test results (presentations are available within the vet section of
www.nationalmilklabs.co.uk).
If the 30-cow screen indicates that Johne’s is present on the farm, the risk assessment should be
consulted to establish if the risk of spread is likely. If this is the case, a degree of improved calf
management must be considered along with a veterinary control plan and ongoing quarterly
individual cow monitoring (Herdwise).
When the 30-cow screen indicates that herd-level prevalence is extremely low or negative, it is
important to consider the farm’s risk of disease entry. If this is high, the farm should monitor
regularly which may involve Herdwise (as a thorough solution) or HerdTracker (as a base level of
surveillance involving an automatic selection of 30 cows from NMR records quarterly).
Next steps

8
NMLs milk and blood ELISA tests for MAP have very similar test sensitivities. Performing a single
milk or blood test could be seen as comparable. However, it is difficult to compare milk and blood
results directly as much depends on the timing of sampling. IgGs are transferred from blood to
milk in the early stage of lactation meaning that blood samples are more likely to yield a lower
result, however, the reduced yield toward the end of the lactation may infer a greater likelihood of
a positive result in milk at this stage. Work from a Danish study by Prof. Soren Nielsen shows that
milk test sensitivity is relatively high for high shedding animals compared to low or intermittent
shedding animals. This highlights the importance of repeat testing to detect MAP. Repeat testing
using blood is time consuming and costly. The ability to use milk samples for dairy herds is
advantageous as it is quick and easy, making it a cost effective way of testing when combined
with milk recording.
Figure 2 - The predictive ability of the milk ELISA to highlight infected animals with
different shedding patterns
Relative merits of milk and blood testing
Developing a plan for surveillance and control

9
We know that the majority of animals seroconvert (mount an immune response) to infection at 2-4
years old (Nielsen and Ersboll, 2006). By screening every animal in the milking herd quarterly,
we generate a result profile (see Table 2) for all animals in this ‘high risk’ age range allowing us to
make management decisions based on pre-empting their potentially infectious status.
To illustrate the benefit of quarterly screening, please see fig 3, which shows a schematic
presentation of the probability of testing positive in ELISA given the animal is infectious at
different ages. For 3 different test-frequencies: 1, 2 and 4 tests/cow/yr. The shaded areas
represent the uncertainty related to each line (taken from Nielsen S.S., 2007).
% r
eli
ab
ilit
y
By annually blood testing a herd with medium to high prevalence and a high risk of entry or
spread within the herd, we potentially miss all of those animals that become a risk after the test.
Nielsen found that repeat milk testing with 4 tests per year resulted in detection of 70-90% of high
shedders and only 25% if the animal was tested one year before shedding (Fig 3). These
animals could be transmitting the disease to many calves before they are detected by the next
year’s annual blood test. Furthermore, we are not testing the animals at those critical times
where separation decisions could be made. For example, we could test a cow mid lactation and
she could return a low test result. If we were to retest her prior to calving, she may test high.
That is a risky situation in terms of disease transmission. Quarterly milk testing would have
flagged that she is a cow to manage carefully.
Once a herd has a low enough prevalence with low risks of entry and spread, we would
recommend a cohort milk test. This would involve testing 30-cows quarterly or NMR’s
HerdTracker service. These cows are automatically selected using NMR data based on their age
and SCC offences. For pricing of this service, please go to www.nmr.co.uk.
Figure 3

10
Management of high risk animals (taken from Nielsen, S.S. – PhD
Thesis)
Once high risk animals are identified, it is important that transmission to susceptible animals does
not occur. Due to their susceptibility, calves require the most rigorous protection. Transmission of
MAP occurs via faeces, milk, colostrums and in the uterus. Therefore, calves should at all times
be protected from faeces, milk and colostrums obtained from high risk cows. Moreover, high-risk
animals with the highest risk of being infectious may be culled prior to calving if deemed
necessary. If a system is established to manage these high-risk cows, there is no need to
establish routines to manage all cows as if they were infectious. Many farmers may be reluctant
to establish such procedures for all cows, as they can be very time-consuming. Risk-based
management using this system can be cost-effective, but whether a risk-based approach or a non
-risk-based approach is most cost-effective depends on the amount of labour required to reduce
transmission (Kudahl et. al., 2008).
Management of non-affected test-positive animals
A challenge is presented by the management of repeated results, particularly if reacting cows do
not appear to be affected by the MAP infection. These animals may or may not be infectious,
because antibodies occur in approximately 20% of animals 3-4 years prior to onset of detectable
shedding, and they may become test negative in the meantime (Nielsen, 2008). In many cases
attempts to confirm that a cow is infected using faecal culture may fail (Nielsen, 2008), and it is
therefore of the utmost importance to trust the results, even though there is a high risk that false-
positive reactions have occurred. A false-positive in this situation may be a result of a) non-MAP
antibodies, or b) MAP antibodies in an infected cow that has not yet become infectious. It is not
possible to easily discriminate between the two kinds of case. However, a concurrent drop in milk
production (Nielsen et al., 2009 VI) might indicate that an infection associated with MAP is
ongoing. Cows with repeated positive ELISA tests have a higher probability of shedding MAP
than cows with fluctuating responses (Nielsen, 2008). Reactors that are not obviously affected or
have fluctuating ELISA responses may be considered of intermediate risk. Consequently, there
are three risk groups. These are referred to as red (High-risk), Amber (Moderate risk) and green
(Low-risk). Management of cows in the three groups can follow the guidance shown in Fig 4.
Figure 4

11
Testing and surveillance options Test option Test level Description Price Usefulnes
s
Bulk Milk test Herd This is not recommended due to poor
sensitivity. Over 10% of the animals
could be shedding Johne’s antibodies
into the bulk tank before a ‘low’
threshold becomes ‘medium’.
£ 0
Targeted 30-cow
screen
Herd This is a ‘herd level’ single indication of
the presence of Johne’s. It should be
targeted at those animals that are most
likely to be infected with Johne’s
££ ††
Quarterly 30-cow
screen -
HerdTracker
Herd A strong base level of surveillance for
low risk low prevalence herds. 30 cows
are automatically selected using NMR
records.
£££ †††
Whole herd
individual ad hoc
blood
Cow/Herd A useful starting point for beef herds,
block-calving herds in the dry period or
herds that are already being blood
tested for another reason. It is an
expensive way to test but there are
instances where it can be useful.
£££££ †††
Whole herd
individual ad hoc
milk
Cow/Herd This is a useful starting point for dairy
herds. It gives an informed snapshot of
herd-level prevalence. There is the
potential for false positive results for the
reasons outline in section 4.1 so
quarterly testing is recommended for a
cow-level status indication.
£££ †††
Quarterly whole
herd milk -
HerdWise
Cow This is the ultimate CHeCS accredited
surveillance model. Every cow in milk is
tested quarterly from NMR milk
recording samples. A test profile is
generated for each animal and this
forms a risk classification. This is the
most cost effective way to test the whole
herd regularly.
£££££ †††††††
Quarterly whole
herd blood
Cow An expensive way to test a dairy herd.
It would be effective if it were possible to
assign risk classifications to each cow.
There are no significant benefits to this
system compared to Herdwise (for dairy
herds) hence the classification module
is not available.
£££££££ †††††††
Table 1

12
A guide to report availability NMR’s Herdwise, HerdTracker and JESS (for non-NMR recorded herds) reports are available to
both the farmer and his/her vet via Herd Companion. To access these reports, click on the
Johne’s button which is found in the middle of the herd companion screen as seen in Fig 5 below.
To view Johne’s results from farmers not using these services please click on the disease monitor
tab. If vets do not have access to these data, they can call NMR customer services on 0844
7255567.
This section of the document highlights the HerdWise & HerdTracker reports available to vets and
farmers and explains the useful aspects of each type of report so that vets are better armed to
add consultative value to a farmer’s results.
The ‘Cohort Monitor’ report is only available to vets. This is to reduce the risk of misinterpretation
of the data.
The HerdWise reports currently available are:
High Risk Cows - available in pdf
Low Risk Cows - available in pdf
Herd Summary - available in pdf
Historical Data - available on screen
Cohort Monitor (with homebred and non homebred split) - available via Herd Companion Pro
High Risk Cows Low Risk Cows Herd Summary Historical Data Cohort Monitor
Figure 5

13
Herdwise reports Risk classification table
Figure 6
Risk level Herdwise
Classification
Johne’s
infection group
Definition
LOW
Green J0 Repeat ELISA –ve (minimum 2 tests)
Green J1 ELISA –ve but only one test
Green J2 ELISA –ve but +ve within 3 previous tests
HIGH
Yellow J3 ELISA –ve/+ve interchangeably
Yellow J4 Last ELISA +ve, all previous tests negative
Red J5 Repeat ELISA +ve (minimum 2 tests)
Summary report
The risk classification table (table 2) shows how the Herdwise scheme classifies cows into risk
groups of shedding MAP bacteria.
Table 2
This report provides a summary of the last 6 results for each cow in the herd. It allows the whole
herd to be viewed together and results are displayed in order of risk. As example report is shown
in Fig 6 below.

14
The high risk report is one of the most significant reports in the Herdwise service. This report
highlights which animals are of highest risk of shedding bacteria and thus highest risk of
transmitting the disease to susceptible animals. Predicted calving dates are shown so that cow
separation decisions can be made in good time. The milk yield predictor is added to the report so
that observations may be made for individual animals. An example report is shown in Figure 7
below.
Herdwise reports
Figure 7
High and low risk reports
The low risk report shows which animals have the lowest risk of shedding. This is useful for
decision making with regard to pooling of milk and colostrums and establishing which animals can
safely be calved in communal pens and yards. An example report is shown in Fig 8 below.
Figure 8

15
Herdwise reports Historic report
An aggregate data table summarises how many cows are in each risk group (J0-J5) along with a
summary of their ‘traffic light’ classification. This allows farmers to track the effectiveness of
control measures over several years. See Figure 10 below.
Figure 10
Figure 9
A graphical representation of ‘red’, ‘amber’ and ‘green’ cows is displayed as ‘numbers within herd’
and as a ‘percentage of the herd’. See Figure 9 below. These graphs illustrate trends in
prevalence over time.

16
Th
is c
olu
mn
show
s th
e
num
ber
of
day
s si
nce
th
e
cow
tes
ted
Th
e w
eig
ht
of
the
fon
t
den
ote
s th
e si
gn
ific
ance
of
the
test
res
ult
. 0 -
20
is
low
(fei
nt)
, 2
0 -
30 i
s m
ediu
m
(sta
ndar
d)
and
30+
is
hig
h
Th
is c
olu
mn
show
s th
e
hig
hes
t
Joh
ne’
s re
sult
on
rec
ord
.
Th
is c
olu
mn
den
ote
s
wh
eth
er t
he
cow
is
curr
entl
y pre
sen
t in
the
her
d. L
– l
ive
and
X -
sold
/cull
ed
A c
om
po
site
da
ta ta
ble
sh
ow
s the
te
st p
rofile
fo
r eve
ry c
ow
in
th
e m
ilkin
g h
erd
(pa
st a
nd
pre
sen
t). S
ee
Fig
11
be
low
.
Fig
ure
11
17
Herdwise reports
Cohort monitor report
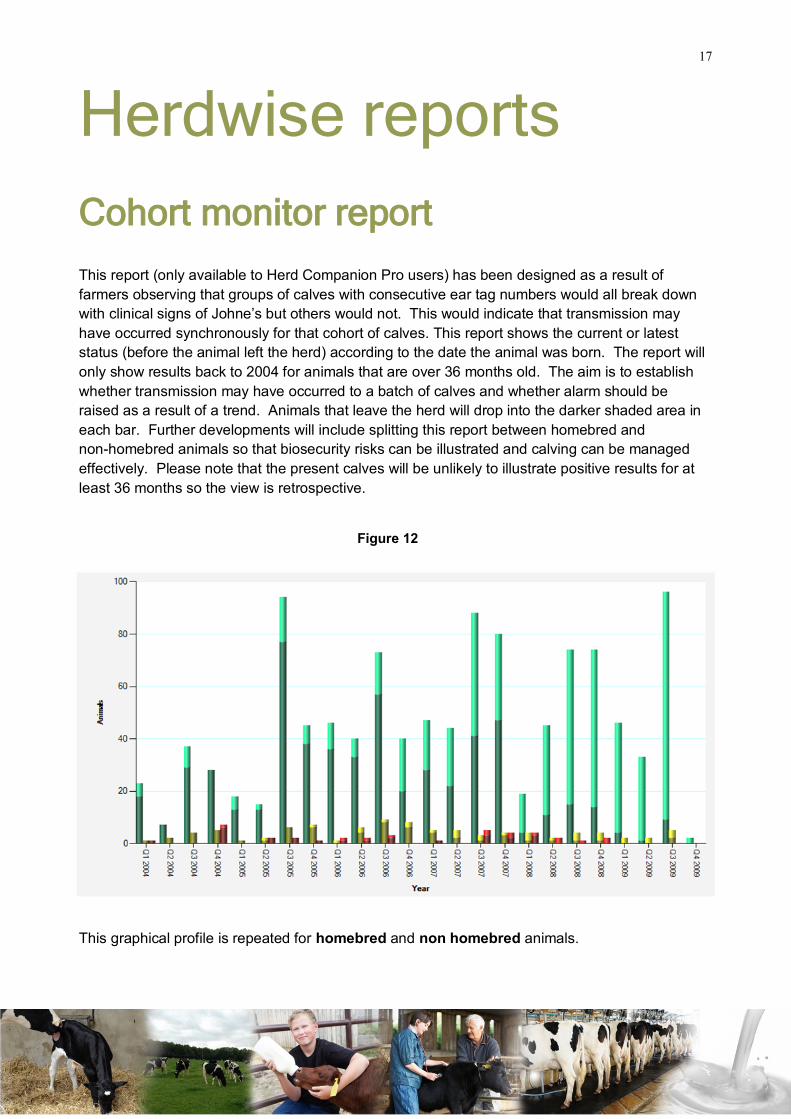
This report (only available to Herd Companion Pro users) has been designed as a result of
farmers observing that groups of calves with consecutive ear tag numbers would all break down
with clinical signs of Johne’s but others would not. This would indicate that transmission may
have occurred synchronously for that cohort of calves. This report shows the current or latest
status (before the animal left the herd) according to the date the animal was born. The report will
only show results back to 2004 for animals that are over 36 months old. The aim is to establish
whether transmission may have occurred to a batch of calves and whether alarm should be
raised as a result of a trend. Animals that leave the herd will drop into the darker shaded area in
each bar. Further developments will include splitting this report between homebred and
non-homebred animals so that biosecurity risks can be illustrated and calving can be managed
effectively. Please note that the present calves will be unlikely to illustrate positive results for at
least 36 months so the view is retrospective.
Figure 12
This graphical profile is repeated for homebred and non homebred animals.

18
HerdTracker Report
The HerdTracker results graph and table can be found within Herd Companion as described on page 12. The HerdTracker report contains a graphical representation of the % high cows within each of your quarterly 30 cow screens. This allows the farmer and the vet to see if there is an increasing % of high cows. If Johne’s disease is found in the herd or if the % of high cows is increasing then upgrading to our HerdWise service is advised. The HerdTracker summary table, found below the graph, gives an overview of the results. There also is an option to download your results report to gain a list of the individual animals tested for Johne’s.
Graph and Table

19
Herdwise and ad hoc Johne’s results are automatically uploaded into InterHerd +. These results
can be analysed alongside recording data providing a powerful method of analysis to assist you in
advising farmers on control. Example illustrations are shown below in Fig 13 and in Fig 14. If you
require training in this software or would like more information, please contact customer services
on 0844 7255567.
Current cows - Health details
Possible disease statuses:
POS: Positive for Johne’s disease at the most recent milk test.
pNEG: Positive for Johne’s disease at a previous test(s), but negative at the most recent test. A
positive cow can never revert to negative status.
NEG: Negative for Johne’s disease at every test in the cows life. Note that NEG also indicates
tested within the last 12 months.
No test: Either never tested or a cow with no positive tests that has not been tested in the last 12
months.
1. PREGNANT cows that are either POSITIVE or pNEG for Johne’s disease. They are listed in
order of the predicted calving date.
Figure 13
Johne’s analysis in ‘InterHerd +’ software
2. POSITIVE status cows that are NOT pregnant. Listed in order of the number of months
since the cow was first tested positive.
Figure 14

20
Johne’s control is a long term exercise. However, as progress is made there is scope to reduce
the costs of surveillance and control. Though, control mechanisms need to be sufficient to detect
and prevent re-emergence of the disease. It is important to remember that ‘test and manage’ only
works in conjunction with a repeated cow-level test structure like Herdwise. For a herd to get to a
stage where they could reduce the level of surveillance to the HerdTracker service, they would
either need to maintain a low risk of entry and be free of disease or to employ a level of Improved
Farm Management (IFM). The Johne’s Action Group, endorsed by both DairyUK and DairyCo
have proposed the following strands that should cover every farm scenario.
Outlook
1) Improved Farm Management
2) Improved Farm Management & Strategic Testing
3) Improved Farm Management & Test and Cull
4) Biosecurity Protect and Monitor
5) Breed to Terminal Sire
6) Firebreak Vaccination
NMR have services to assist with the 3 strands highlighted in green (above). For strand 2, we
would recommend a background surveillance method (e.g. HerdTracker—strategically selecting
your highest risk cows). For strand 3 and 4 we would recommend Herdwise (whole herd quarterly
testing).
NMR also have ad hoc milk or blood testing services available.
Any level of Improved Farm Management should be considered with care due to the difficulty of
managing larger herds in this way.
Vaccination should be considered with extreme caution as it is important to remember the
potential effects on TB testing along with the fact that it is impossible to test for antibodies to
Johne’s in a vaccinated animal.
When breeding to terminal sires, it is important to ensure that no progeny end up becoming a
suckler cow or breeding bull. Animals must be slaughtered once finished.

21
Cattle purchasing checklist One of the biggest risk factors associated with the transmission of Johne’s is the purchase of
infected animals. It is therefore important that farmers are made aware of a set of simple
questions that could be asked of cattle vendors. These questions have been designed to provide
buyers with an accurate picture of how Johne’s has been managed on the vendor’s premises.
This should allow buyers to make an informed decision as to whether they are happy with the
answers before any animals have changed hands. To get a copy of this questionnaire please call
customer services on 0844 7255567 or visit www.nmr.co.uk.
Figure 16

22
DEFRA report - Guidance on control of Johne’s Disease in Dairy Herds. http://
archive.defra.gov.uk/foodfarm/farmanimal/diseases/documents/johnesguidance.pdf
Kudahl, A.B., Nielsen, S.S. and Osergaard S. (2008). Economy, Efficacy and Feasibility of a risk-
based control program against Paratuberculosis. Journal of Dairy Science, 91 (12): 4599-4609.
Nielsen, S.S. and Ersboll A.K. (2006). Age at occurrence of Mycobacterium avium Subspecies
paratuberculosis in naturally infected dairy cows. Journal of Dairy Science, 89 (12): 4557-4566.
Nielsen, S.S. (2007). Danish Control Program for Bovine Paratuberculosis. Cattle Practice 15 (2).
Nielsen, S.S. and Toft, N. (2008). Ante mortem diagnosis of paratuberculosis: A review of accura-
cies of ELISA, interferon-γ assay and faecal culture techniques. Veterinary Microbiology, 217-
235.
Villarano M.A. and Jordan E.R. (2005). Production effects of MAP in dairy cows. Proceedings of
International Johne’s conference
References

23
Section A: Premises Details
Section B: Vet Details
NML Johne’s Screening Programme Enrolment Form
Producer Name*
Farm Name*
Address*
Postcode*
Telephone
Email*
NMR HERD Number* / /
Last TB test date* :
PTO
Vet Name*
Vet Practice Name*
Practice Address*
Postcode
Telephone
Email*
Section C: Scheme Details
Circle months for testing (quarterly): J F M A M J J A S O N D
Your NMR monthly milk recording samples will automatically be used for this service.
Completed enrolment forms should be faxed to NML 01902 749938 or posted to National Milk Laboratories, Unit 26-29, Laches Close, Calibre Industrial Park, Four Ashes. Wolverhampton. WV10 7TZ
* = Mandatory Field

24
Section D: Declaration
- I wish to enrol the above farm on the HerdWise surveillance programme as specified above.
- I certify to the best of my knowledge that the details specified are correct
- All reports will be sent to the consulting veterinary surgeon via email (if given)
I agree to pay all fees payable under the HerdWise programme and accept that this contract is valid for a minimum of 12 months, renewable thereafter. Failure to pay such fees may result in suspension of the
service until full payment is received
Please tick as appropriate:
NMR to invoice the vet practice on a monthly basis
NMR to invoice the farm on a monthly basis
Vet Signature Date
Print Name of Vet
THE HERD WILL NOT BE ENROLLED WITHOUT A VETERINARY SIGNATURE
Farm Signature Date
Status (e.g. Owner/herdsman
Completed enrolment forms should be faxed to NML 01902 749938 or posted to National Milk Laboratories, Unit 26-29, Laches Close, Calibre Industrial Park, Four Ashes. Wolverhampton. WV10 7TZ

25
Johne’s 30-cow Screening Programme Enrolment Form
Section A: Premises Details
Section B: Vet Details
Producer Name*
Farm Name*
Address*
Postcode*
Telephone
Email*
NMR HERD Number* / /
Last TB test date* :
Vet Name*
Vet Practice Name*
Practice Address*
Postcode
Telephone
Email*
Section C: Scheme Details
Circle months for testing (quarterly): J F M A M J J A S O N D
Your NMR monthly milk recording samples will automatically be used for this service.
Completed enrolment forms should be faxed to NML 01902 749938 or posted to National Milk Laboratories, Unit 26-29, Laches Close, Calibre Industrial Park, Four Ashes. Wolverhampton. WV10 7TZ
* = Mandatory Field

26
Completed enrolment forms should be faxed to NML 01902 749938 or posted to National Milk Laboratories, Unit 26-29, Laches Close, Calibre Industrial Park, Four Ashes. Wolverhampton. WV10 7TZ
Section D: Declaration
- I wish to enrol the above farm on the HerdTracker surveillance programme as specified above.
- I certify to the best of my knowledge that the details specified are correct
- All reports will be sent to the consulting veterinary surgeon via email (if given)
- NMR to invoice the farm on a monthly basis
I agree to pay all fees payable under the HerdTracker programme and accept that this contract is valid for a minimum of 12 months, renewable thereafter. Failure to pay such fees may result in suspension of the
service until full payment is received.
Farm Signature Date
Status (e.g. Owner/herdsman)

27

28
NMR Customer Services
National Milk Records PLC
Fox Talbot House
Greenways Business Park
Bellinger Close
Chippenham
Wiltshire
SN15 1BN
Tel: 08447 255 567
Email: [email protected]
Website: www.nmr.co.uk
I148-261112