John Turnbull PhD Thesis - University of St Andrews
175
QUALITY OF CARE FOR PEOPLE WITH MENTAL HANDICAP AND CHALLENGING BEHAVIOUR: AN INVESTIGATION OF THE IMPACT OF STAFF TRAINING IN GOAL ATTAINMENT SCALING AND BEHAVIOURAL PROCEDURES John Turnbull A Thesis Submitted for the Degree of PhD at the University of St. Andrews 1992 Full metadata for this item is available in Research@StAndrews:FullText at: http://research-repository.st-andrews.ac.uk/ Please use this identifier to cite or link to this item: http://hdl.handle.net/10023/2807 This item is protected by original copyright
Transcript of John Turnbull PhD Thesis - University of St Andrews
QUALITY OF CARE FOR PEOPLE WITH MENTAL HANDICAP
AND CHALLENGING BEHAVIOUR: AN INVESTIGATION OF THE IMPACT OF STAFF TRAINING IN GOAL ATTAINMENT SCALING
AND BEHAVIOURAL PROCEDURES
John Turnbull
A Thesis Submitted for the Degree of PhD
at the University of St. Andrews
1992
Full metadata for this item is available in Research@StAndrews:FullText
at:
http://research-repository.st-andrews.ac.uk/
Please use this identifier to cite or link to this item:
http://hdl.handle.net/10023/2807
This item is protected by original copyright

QUALITY OF CARE FOR PEOPLE WITH MENTAL HANDICAP
AND CHALLENGING BEHAVIOUR: AN INVESTIGATION OF
THE IMPACT OF STAFF TRAINING IN GOAL ATTAINMENT
SCALING AND BEHAVIOURAL PROCEDURES
John Turnbull B.A., R.N.M.H.

I, JOHN TURNBULL, hereby certify that this thesis which
is approximately 26,000 words in length has been written
by me, that it is a record of work carried out by me, and
that it has not been submitted in any previous
application for a higher degree.
Date .J ~ .( .1.1. ~?-. .. Signature of candidat
I hereby certify that the candidate has fulfilled the
conditions of the Resolution and Regulation appropriate
to the degree of the University of St. Andrews and that
he/she is qualified to submit this thesis in application
for that degree.
Signature of supervisor.

COPYRIGHT DECLARATION
In submitting this thesis to the University of
St. Andrews I understand that I am giving permission for
it to be made available for use in accordance with the
regulations of the University Library for the time being
in force, subject to any copyright vested in the work not
being affected thereby. I also understand that the title
and abstract will be published, and that a copy of the
work may be made and supplied to any bona fide library or
research worker.

CONTENTS
Acknowledgement
Terminology
Abstract
Chapter One
Quality Assurance and Health Care
Chapter Two
Goal Attainment Scaling
Chapter Three
Goal Attainment Scaling and the Delivery
of Nursing Care
Chapter Four
An Experiment to Introduce Goal Attainment
Scaling within a Mental Handicap Hospital
Setting
Conclusion
References
Apendices
i.
ii.
iii.
1.
18.
42.
63.
116. I I I
121. l'l,-L

i .
Acknowledgement
Gratitude is expressed to the management, staff and
residents of the hospital in which this study took place.
Unfortunately, to preserve anonymity, these people cannot
be named here.
Gratitude is also expressed to my supervisor, Professor
Chris Cullen for his encouragement and support.

4
ii.
Terminology
Throughout this thesis, the term 'mental handicap' has
been used as opposed to the recently preferred term
'learning disability'. The author does not wish to offend
any person by the use of this expression and believes
that, as his professional qualification still bears the
title mental handicap, this is the appropriate term for
the time being,
The word 'client' is now in general use to refer to all
recipients of health care, not just those people with a
mental handicap. However, when referring directly to the
clients involved in this study, the word 'resident' has
been used in deference to the wishes of the staff
involved in the project.

iii.
Abstrac~
This study examined the contribution to quality of care
of a goal planning technique called Goal Attainment
Scaling and its impact upon the quality of life of people
with severe mental handicaps and challenging behaviour.
The study also seeks to establish the utility of
employing Goal Attainment Scaling as a means of
evaluating clinical nursing performance,
This study essentially aims to bring about changes in the
care practices of nurses using a comprehensive staff
management procedure. The study was designed as a four
phase intervention using a multiple baseline design
across three wards in a hospital for people with mental
handicaps. Staff on three wards (n = 41) were initially
trained over three phases in the use of Goal Attainment
Scaling and other procedures. Training was carried out by
a combination of workshops and individual tuition which
incorporated the use of individualised learning contracts
for staff. The fourth phase consisted of establishing
weekly meetings to set objectives for staff to achieve
that were specifically related to material covered in
training. If targets were achieved, staff performance was
followed by letters of recognition from managers and by
financial donations to ward funds.
Dependent measures included frequency of challenging
behaviour, quality of staff-resident interaction and

iv,
engagement, ward activity, residents' adaptive behaviour,
staff attitudes and goals set by staff. Results indicate
that adaptive behaviour increased by small but
statistically significant levels. Levels of challenging
display a mixed pattern of results, as do levels of ward
activity and quality of interaction, although encouraging
trends may be identified, Despite some increases,
residents still spend significant amounts of time
unoccupied. The number of goals set increased throughout
the study, particularly in phase four, Data for staff
attitudes were not used because of the low compliance
rate and changes indicated below.
Considerable problems were encountered with turnover of
staff and other organisational changes outwith the
researcher's control which compromised both the quality
of training given to staff and, by virtue of this, the
final results, Statistically significant relationships
were found to exist between staff turnover and
interaction.
The implications of this study are discussed and
recommendations made for future research.

1 .
CHAPTER ONE
QUALITY ASSURANCE AND HEALTH CARE
Introduction
It could be argued that all employees responsible for
providing health care each have their own expectations of
what constitutes good quality care and how this care
should be given. These ideas will be shaped by their
training and experience. Although this might be
considered a positive aspect of our health care services,
this is of limited use to us should we wish to define and
guarantee a certain level of quality of care to the
public, as each person's values will inevitably differ.
The need to establish and define a system whereby health
care may be formally evaluated has, therefore, long been
recognised. Over fifty years ago Derryberry (1939), for
example, reported on attempts to measure the
effectiveness of nursing services in terms of the
changing health status of the patient. More recently,
professional nursing organisations in this country (Royal
College of Nursing 1980) and abroad (American Nurses
Association 1973, 1976) have examined ways in which their
work may be defined and measured.
The professionals' concern to evaluate the care they
provide has been given added impetus by the publication
of several government reports and the political debate
they have engendered. For example, the Salmon Report

2 .
(Ministry of Health and Scottish Horne and Health
Department 1968) recommended that senior nurses should
take on greater managerial responsibility. By
implication, this means the monitoring and maintenance of
nursing standards. Subsequently, the Briggs Report on
nursing (DHSS 1972) emphasised the need for nursing care
to be evaluated in order that resources could be managed
more effectively. In the early 1980s, Sir Roy Griffiths
questioned the ability of the National Health Service to
prove its effectiveness and his enquiry into health
service management (DHSS 1983) called for the
establishment of clear lines of accountability throughout
the NHS.
The Griffiths Report introduced the concept of general
management to the Health Service. As others had
previously observed (Ham 1981), the Health Service had
given the impression to many of being an organisation
largely run on a crisis management format with few
systems of performance monitoring. The examples of
hospital enquiries discussed in Martin (1984) would
appear to support this view. The implementation of many
of Griffiths' recommendations has probably been the most
significant development in the Health Service since its
inception: a trend has now been established in which the
efficient use of resources is a major consideration for
anyone involved in NHS management.
3 .
Kitson (1986) identifies a further reason why the
evaluation of health care has become a major issue. The
growth of consumerism, she argues, has led to increased
expectations of services which Government provides. In
the past, Community Health Councils have been seen as a
vehicle by which the public may become involved with
health policy. However good the intentions of such
bodies, their relationships with health districts have
not attained earlier expectations (National Consumer
Council 1984). Therefore, involving the public in formal
evaluations of the quality of health services is a
challenge which professionals are currently addressing.
At the same time, the Government's latest reforms of the
National Health Service (DHSS 1990) attempts to place the
interest of the consumer firmly at the centre of
everyone's concern and the recently constituted
'purchaser' and 'provider' separation will cause both to
consult closely with the service user a great deal more
than in the past.
We have, therefore, embarked upon a road in which health
is seen as a commodity to be purchased either by
individuals or on their behalf and those who are
responsible for providing health care now have an
obligation to do this effectively and efficiently. Thus
the concept of quality of care is not solely a
professional notion that allows one to distinguish
between the value of one procedure over another, but is

4.
also a question of how efficiently these procedures can
be provided in terms of resources.
This development has inevitably led to a huge growth in
formal evaluation methods whereby promises are not only
made to consumers of health care but have to be
guaranteed as well. This is the notion of quality
assurance. Although quality assurance and evaluation are
separate concepts, they are used interchangeably in the
literature (see Wyszewianski 1988). Quality assurance
itself is a term that has been imported from the world of
industry and commerce. A leading author on this subject
(Ishikawa 1985) describes quality in the commercial world
as the effort to produce satisfactory goods at the right
price for the consumer. Giving a specific example of
this, the Japanese car industry, Ishikawa suggests that
quality, to the consumer, means reliability and fuel
efficiency.
Although the terminology may have been transferred to
health settings with comparative ease, this has not been
the case for understanding the concept of quality as it
applies to health care. A convenient definition of
quality eludes us at present. However, since the 1960s,
the writings of Avedis Donnabedian have provided the
basic vocabulary by which quality may be described.
Donnabedian (1980) sees quality as an abstract concept
which will have different meanings for the different

5 .
groups of people involved in health care. Thus, the
professionals and technicians will be concerned with the
technical quality of their work. The consumer's
definition will be highly individualised and will take
into account the functional quality of the service as it
affects his values and expectations. A third group of
people involved with defining quality will be society at
large. The social definition, says Donnabedian, will be
concerned with the net gain to society provided by health
care taking into account the amount of resources needed
to sustain it. Finally, Donnabedian identifies the
emergence of a fourth group, namely the 'payers'. For
those who have direct responsibility for committing
resources to health care, quality means value for money
based on a statistically defined norm of acceptable care.
Notions of what quality might be, therefore, must rely on
an interplay and careful balance of these four factors.
Since economic circumstances and cultural values are
subject to change, quality itself cannot be seen as a
static concept. Absolute definitions of quality do not
exist.
The process of quality assurance
With this in mind, academics and professionals alike have
concentrated on standardising the process of quality
assurance. Figure 1 shows how this process is typically
represented. This illustrates how any quality assurance

~
Identify values / / __ ..,.., ___ --J
/ "-/ "-
"--
--------- .. -, -"
DESCRIBING
; "'-/
!
\
\
Take action
TAKING ACTION
Select course of action
'.~\."
" " /
I
~ I
~""- II
/ /
Identify structure, process & outcome
criteria & standards
/ /
/
/ /
/
Obtain measurements needed to identify
attainment of standards
! !
MEASURING
Evaluate strengths & weaknesses using
standards
'--------r---------------~~~ __ ~.,-----~-----------------------~
Identify possible courses
of action
Figure 1. Diagram showing the cyclical nature of the quality assurance process. (Kitson 1986)

6 .
system should be continuous and cyclical. It should also
concentrate on the three 'classic' elements in the
delivery of health care, once again originated and
defined by Donnabedian (1966). These elements are
described succinctly by Pearson (1987) as;
a)
b)
c)
Structure:
Process:
Outcome:
the prerequisites for patient
care which include the physical
facilities, the organisation of
the unit or institution and the
resources, both human and other
the carrying out of the care
including the intellectual
processes and behaviour of the
staff.
the patient's behaviour, health
status, or knowledge including
recovery or mortality rates and
some element of patient
satisfaction.
There is little dispute amongst academics that this is a
useful way of conceptualising any health care delivery
system. What is essential, however, is that these three
elements should not be seen as separate, unrelated
entities. Each one is dependent upon the other two. For
example, to be successfully inoculated against a disease
(outcome) will depend upon the vaccine being drawn-up and

7 .
injected correctly (process) by a person who is qualified
and competent to carry out this procedure (structure).
To assert the value or effectiveness of health care,
measurement of one or all of these elements must take
place. A further requirement is that, to make the
measurement meaningful, a set of criteria or standards
must be established. Only then can the judgement be made
of whether something is poor, average or excellent with
any confidence. It is at this point that controversy
arises, namely,
1) how are these standards to be devised and by
whom ?
and
2) assuming that the standard can be devised, does
this imply a minimum or optimum level of
performance ?
These are issues which will be returned to later, but
some brief points may be made here. The first question
might seem largely a matter for those responsible for
giving the care. People who may be considered to be
expert or proficient in their field should surely be
expected to know what the requirements are for a given
procedure, how to carry this out competently and what the
outcome should be. In many instances this would be a
naive assumption. Kroll and Mackenzie (1983), for
example, examined the often contentious issue of
discharging from psychiatric institutions patients who

8 .
had a history of violence. It might be assumed that
psychiatrists could make reliable judgements based on the
care given and the behaviour of their patients. However,
it was discovered that health departments in the United
States who were successfully sued following murders
committed by recently discharged patients were prosecuted
on the basis of administrative failure and not on the
failure of psychiatrists to assess risk. Kroll and
Mackenzie conclude that
"the courts have affirmed their acceptance that
psychiatry is not an exact science, that there
is disagreement about diagnosis and treatment."
This might seem an extreme example, but Cochrane (1972)
points out numerous examples of medical and surgical
intervention which is based largely on custom and
practice rather than empirical evidence.
However surprised and even alarmed we might be at the
idea that our doctors and other carers may not always use
tried and tested methods, this does not mean that they
have little idea of what constitutes quality in health
care. Nor should we regard the measurement of quality as
futile. The above examples indicate that there is often a
tenuous link between the elements of structure, process
and outcome. In particular, as Doris Bloch (1975) reminds
us, discovering the link between process and successful

9 .
outcome in every case is a particularly arduous task and
that no health care professional is ready for evaluation
based solely on process and outcome. We might have become
very sophisticated at determining the prerequisites of
care in terms of equipment and resources and these are
readily amenable to measurement. The matter of saying
that a given action will produce a given result is still
largely a matter of expectation rather than guarantee.
To summarise, there can be no short-cut answer to quality
measurement. On the one hand, research into more
effective ways of health care delivery and treatments
must continue so that the promise of a higher standard of
care can be made more certain. It would be a gross
mistake on the part of academics and professionals,
however, if changes in health services were dismissed out
of hand by them until they possessed all the evidence. On
the other hand, in the absence of absolute certainties,
it would be wrong of the managers to allow their concerns
about cost-efficiency and cost-effectiveness to override
professional anxieties about falling standards of care.
This can sometimes create an atmosphere of tension in
health services which prevents real progress being made
towards an acceptable definition of quality and how best
this might be measured.

10.
Quality assurance and mental handicap services
In many ways, the impetus to adopt and utilise quality
assurance systems in mental handicap services is no
different from other aspects of health care. However,
there do appear to be four main, but interrelated,
factors that make quality assurance a particularly
pertinent idea.
Firstly, the health service has legal responsibilities
under the Mental Health Act (DHSS 1983). This Act is the
latest of a series of Acts of Parliament which has laid
down circumstances under which a person with a mental
handicap may be compulsorily detained. Historically,
then, there has always been some obligation to inspect
services to ensure that the law is being adhered to. This
function is carried out in England and Wales by the
Mental Health Act Commission and by the Mental Welfare
Commission in Scotland. Both bodies report to their
respective Secretaries of State on conditions relating to
the care of people with mental handicaps who are
detained.
Secondly, the very nature of mental handicap itself
implies a degree of vulnerability amongst those so
labelled. Services, therefore, have a particular
responsibility to ensure and demonstrate that they are
acting in the best interests of their clients.

11.
This leads to a third, historical factor which makes
quality assurance a more necessary device in this
service. Mental handicap services have previously
encountered grave problems in providing a high quality
standard of care (Scull 1979). Martin (1984) chronicles a
lamentable list of public and private inquiries over the
past twenty years which have addressed issues of the
physical and psychological abuse of residents in long
stay hospitals. Following one such inquiry, the then
Secretary of State for Health, Richard Crossman,
established the Hospital Advisory Service (HMSO 1969).
The HAS subsequently inspected facilities and made
recommendations to each hospital to ensure standards
relating to the more tangible aspects of the service, for
example staffing ratios and skill mix, were being met.
The hospital inquiries referred to above led to a growing
body of practitioners and academics alike advocating
radical changes in the basis upon which
services should be planned. Although the original
motivation behind creating services for people with
mental handicaps may have been one of seeking to protect
a vulnerable group, such services have resulted in the
segregation and, some would say, oppression (Oliver
1990), of this client group. When some of the more
obvious consequences of such a policy were revealed to
the public through the media, considerable weight was
added to the notion that services should be planned to

12.
allow people with mental handicaps the opportunity of
leading more ordinary lives. Consequently, there has been
an unprecedented shift in government policy which
provides a fourth reason why services should be
evaluated. Although it is now generally agreed what
constitutes a poor quality service, we are obliged to
investigate whether the proposed alternatives can provide
clients with an enhanced quality of life and, should this
be the case, in what ways can this quality be assured?
(see Sines 1988).
Given the additional pressures to evaluate the quality of
care provided for people with mental handicaps, a
newcomer to the literature might expect to find a range
of sophisticated evaluation tools. Unfortunately this is
not the case. A recently published directory of
evaluation methods (Raynes 1987) shows a variety of
measurements but considerable debate surrounds
their utility. The Government's own attempts to evaluate
all health services via a series of 'performance
indicators' encountered great difficulty when addressing
provision for people with mental handicaps. The
Government's working group stated that;
"the shared understanding about the nature of
performance does not exist in mental handicap.
Without such a shared understanding it is not
possible to have performance indicators."
(DHSS 1983)

13.
Without official guidance, the different professional
groups within mental handicap services have sought to
develop their own standards of care and notions of what
constitutes high quality. It is impossible to provide a
critique of all of these methods here. However, some
general points may be made.
Firstly, the directory compiled by Raynes illustrates how
little empirical work has been carried out in producing
the various methods of measurement. Even the most widely
used method of evaluation, the Program Analysis of
Service Systems, or PASS (Wolfensberger and Glenn 1975),
explicitly requires the evaluator to use his or her
subjective judgement about a service according to how it
conforms to the philosophy of normalisation
(Wolfensberger 1983). Normalisation itself is a concept
which supposedly forms the basis of modern services, yet
has never been empirically justified and has been the
subject of growing doubt and criticism recently (Szivos
and Griffiths 1988, 1989).
Secondly, some of the methods of evaluation, as pointed
out by Hughson and Brown (1989), have been developed as a
result of media attention or political pressure and have
often been utilised on a short-term basis only in order
to prove that matters are now better than they were.
These authors go on to point out that some of the more
serious questions related to mental handicap services

14.
necessitate an examination of the longer term effects of
the 'new' services.
Thirdly, and importantly, many instruments developed to
measure quality seem to ignore the very basis of the
service, namely, to ensure a positive outcome for the
client in terms of quality of life. The impact of
services on the person with a mental handicap can very
much be life-defining. Whereas the person entering a
hospital for surgery, for example, will recognise and
accept the interruption in his/her lifestyle and its
consequent inconvenience, the person with a mental
handicap has comparatively limited capacities to control
his/her life. In this sense, the two issues of quality of
life and quality of care become interwoven.
The traditional response to this issue has been for
services to concentrate their evaluation according to the
more 'structural' aspects of care. Alaszewski (1978), for
instance, criticises the pre-occupation with service
'inputs'. In his research he was able to demonstrate how
staff ratios, the physical size and appearance of
buildings made little difference to any therapeutic
benefit accrued by residents in a mental handicap
hospital. Similarly, Repp and Barton (1980) investigated
differences between residences for people with mental
handicaps which had been licensed and those which had not
by the United States Joint Commission of the
15.
Accreditation of Hospitals. The Commission lays down
standards of care, amongst which are regulations
insisting that staff produce written objectives for
residents. As Repp and Barton discovered, however, this
provided no guarantee that residents could be observed to
be actively engaged in teaching activities. Furthermore,
"results showed that the licensed units were just
as derelict as unlicensed units in providing active
habilitative programming for their retarded
residents."
Studies such as these have major implications for
professionals, administrators and, ultimately, for those
who fund mental handicap services. The recent National
Health Service and Community Care Act (1990) pronounced
that Social Service Departments would have to establish
an inspectorate to evaluate the quality of care in
community residences. Furthermore, the aim of the Act is
also to introduce a "mixed economy" of care whereby
services may be purchased on behalf of an individual by a
care manager. In some ways this might seem an excellent
quali~! control mechanism: if the services being offered
to clients is not of the required standard to meet the
needs of the individual, then the provider is forced to
change in ways that meet those needs in a better way.
Care managers, it is envisaged, will be able to 'shop
around' for better services. In practice, it is debatable

16.
whether this will happen precisely as planned. Firstly,
as mentioned previously, it is not always known what
constitutes a good quality service which means that care
managers and other purchasers will not always be able to
communicate to providers exactly what is needed.
Secondly, even though needs may easily be identified in
certain areas, they may not be as easy to meet because of
the limits on expenditure set by government. Far from a
mixed economy of care we might, at best, develop a
different economy of care or, at worst, end up with an
even more inflexible system than we have at present. The
temptation will remain to evaluate services in more
easily identifiable and quantifiable ways.
From the point of view of service planners, responsible
for committing large sums of public money, global
measures of the service's performance are extremely
attractive. Whether they are reliable and valid measures
is open to question. Their reliability must be questioned
in terms of health care where individuals and their
circumstances differ widely. Whereas the vocabulary
of industry and commerce have been imported into the
health care arena, hospitals and clinics most definitely
are not factories, nor does the client behave in similar
ways to the materials that factory workers handle each
day. Most systems designed for use in the commercial
world are concerned with consistency or 'sameness'. For
example, can we produce the same cars for less money?

17.
Health care is vastly different. As Ashbaugh (1991)
comments,
"it is difficult to think of human services where
the central objective does not involve helping a
client to change his or her situation and where
this change is not ... contingent on the client's
particular situation and potential for change."
(pp 119-120
The main debate in quality assurance in health care,
then, is not whether performance monitoring should take
place, but how to make such measurement meaningful at an
individual level so that each person's circumstances and
the context in which this care is delivered can be taken
into account.

18.
CHAPTER TWO
GOAL ATTAINMENT SCALING
The background to Goal Attainment Scaling
From the discussion in the previous chapter, the
impression may be gained that there exists a certain
amount of tension between those who manage services and
those professionals who work within them. In 1968, Thomas
Kiresuk and Robert Sherman, both senior staff at the
Hennepin County Mental Health Centre, Minneapolis,
devised a technique called Goal Attainment Scaling which,
they proposed, would reconcile the needs of the two
groups mentioned above. Their method was first described
in the Community Mental Health Journal (Kiresuk and
Sherman 1968) and much attention has been paid to this
technique by administrators and professionals alike since
this time. The Programme Evaluation Resource Centre in
Minneapolis subsequently became responsible for
disseminating information about the technique and a
scientific journal was also originated for the purposes
of reporting research into the use of Goal Attainment
Scaling. Lloyd (1983) reported that over two hundred
references existed up until the year of her paper and
Seaberg and Gillespie (1977) also reported that the
American National Institute of Mental Health funded
research projects into the use of Goal Attainment Scaling
between 1970 and 1975 to the value of $ 1,429,168.00,
The resource centre in Minneapolis has now closed, though
papers continue to be published on the use of Goal

19.
Attainment Scaling. It is a technique which appears to
have been used mainly in the United States, with few
published papers in this country. It is also a technique
which has been adapted for use in a variety of settings:
for example with disturbed children (Holroyd and
Goldenberg 1978), psychiatric inpatients (Guy and Moore
1982), people with mental handicaps (Bailey and Simeonson
1988) and neurologically handicapped children (Maloney et
al 1978). This list is by no means exhaustive and a more
comprehensive guide can be found in the review by
Cytrynbaum et al (1979).
Methodology
Kiresuk and Sherman wished to devise a technique which
would allow for meaningful comparison between services or
aspects of services. At the same time, Goal Attainment
Scaling would permit outcomes for individual clients to
be compared, irrespective of their problems. The authors
also wished to set this evaluation technique within a
research framework in order to provide the most objective
measurement possible, To achieve these aims, Kiresuk and
Sherman laid down strict criteria for the use of Goal
Attainment Scaling. In terms of their own setting, mental
health, these guidelines were as follows;
1) after referral to the service, a goal selector or
goal selection committee considers the client's
circumstances, presenting problems, previous history

20.
and other relevant information.
2) following this, realistic and achievable goals are
selected for the individual based on his particular
circumstances. A scale for each goal is then
constructed ranging from least to most favourable
outcome. The original example given by the authors
is included here and shown in figure 2. As defined
by the authors, "at least two points on the scale
should have sufficiently precise and objective
descriptions to enable an unfamiliar observer to
determine whether the patient lies above or below
that point," Each point on the scale is given a
standard numerical value which is '-2' for the
least favourable and '+2' for the most favourable
outcome. The outcome considered to be most likely
is given the value '0'. It can be seen from figure 2
that it is not always necessary for five outcomes to
be defined for each goal. In certain cases this may
be impossible or irrelevant.
3) following the selection and scaling of goals, each
goal is assigned a series of weights. The weights
assigned are a reflection of their respective
importance. The weights may be given values such as
1,2,3 and so on, or they can be assigned values of
10,20,30 etc.
4) once the goals and weights have been agreed, the
client is randomly assigned to a particular
treatment programme or therapist. Kiresuk and

Figure 2: Example of Goal Attainment Scale (Kiresuk and Sherman 1968)
Goal Weights Outcome Value
Most unfavourable treatment outcome thought likely (- 2)
Less than expected success with treatment (- 1)
Expected level of treatment success (0)
More than expected success with treatment ( 1 )
Best anticipated treatment success (2)
Fear of Sex Involvement
20
Avoidant No dating No sex
Dating
Some satisfactory intercourse
Regular dating Regular satisfactory intercourse Marriage
Dependency on Mother
30
Lives at home Does nothing without mother's approval
Chooses own friends, activities without checking with mother
Returns to school
Establishes own way of life Chooses when to consult mother
GOA L S
Decisionmaking
20
No new decisions made, still weighing same alternatives (job, vocation)
Complains of being unable to make up mind
Makes up mind on vocation, other major items
Social Functioning
30
Institutionalized prison or hospital
On probation Further arrests
On probation No further arrests for peeping
No contact with police, states peeping no longer problem
MMPI - 78
Up at all over previous score
Remains in double prime range
Mid 60's T-score
40-60 T-score
21.
Sherman do not explicitly state that the therapist
should be aware of the goals already decided upon.
However, in their original paper, they state that it
is their belief that the therapist should be free
to chose his/her own goals without reference to
those chosen by the selection committee.
5) the treatment must then be administered. After a
pre-determined interval (one year in the original
paper) a "follow-up" unit contacts the client and
reviews any progress made. This unit is independent
of both the treatment team and the goal selection
process. The follow-up provides the opportunity for
recommendations to be made for future treatment but,
more importantly in this case, allows the client's
position to be determined according to the goal
attainment scales.
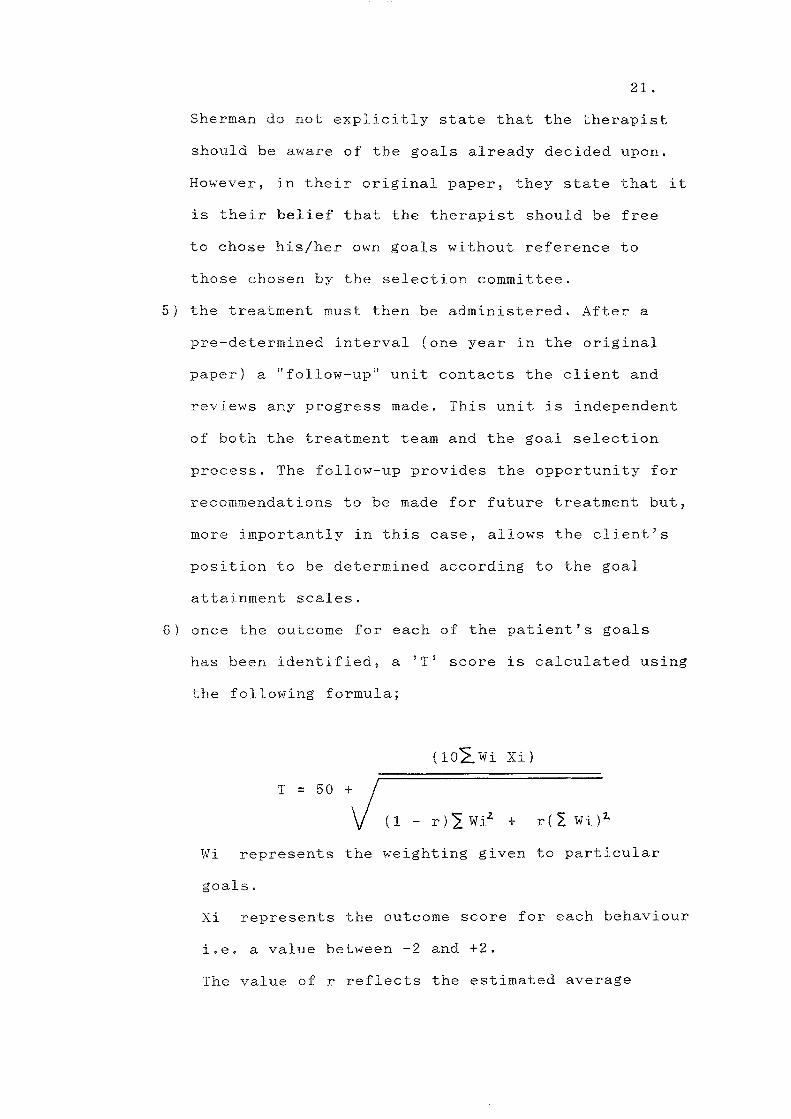
6) once the outcome for each of the patient's goals
has been identified, a 'T' score is calculated using
the following formula;
(10~Wi Xi)
T = 50
+ r( ~ Wi)2.
Wi represents the weighting given to particular
goals.
Xi represents the outcome score for each behaviour
i.e. a value between -2 and +2.
The value of r reflects the estimated average

22.
intercorrelation for the outcome scores. Kiresuk
and Sherman argue that an r value of .30 can be
safely assumed and used as a constant in the
formula. The T value is a standardised score with
a mean of 50 and a standard deviation of 10.
Therefore, a 'perfect' goal attainment score
(i.e. one whose outcome on the scale is 0) is
50. A score of less than 50 would mean that the
client's outcome was less than expected. A score
of over 50 would indicate that the client's
outcome was better than expected. A worked example
using the information supplied in table 1. is
given below.
50 + (10 x 7)
T = (.70 x 30) + (.30 x 100)
50 + 70
T = 51
T = 50 + 9.80
T = 59.80

23.
GOAL Wi Xi WiXi Wi
A 4 0 0 16
B 3 +2 +6 9
C 2 +1 +2 4
D 1 -1 -1 1
10 7 30
Table 1. Table showing goal attainment results for
hypothetical client.
It is important to note that goal attainment scores can
be calculated for single clients or groups of clients,
thus enabling comparisons to be made between therapists,
wards or entire services.
Critique of Goal Attainment Scaling
It is difficult to appraise the use of Goal Attainment
Scaling with any success since few studies have used the
'classic' methodology described above. In the major
review of Goal Attainment Scaling carried out by
Cytrynbaum et al (1977) only five out of ninety-one
published papers had adhered to Kiresuk and Sherman's
original design. The review concluded that Goal
Attainment Scaling is, perhaps, more of an ideology than
a technique. This comment echoed the previous view put
forward by one of the main proponents of the technique
who stated that,

24.
"Goal Attainment Scaling is much more of an approach
than it is a technique or a test or a particular
form or group of questions ..• Goal Attainment Scaling
is a series of ways of looking at and handling some
typical situations that would arise within human
service settings." (Garwick 1974a. p 15.)
The many and significant variations on the original
methodology will be discussed later. The following is a
critique of Kiresuk and Sherman's initial idea.
Any measurement used for evaluation purposes must conform
to basic notions of reliability and validity. The
question of the validity of Goal Attainment Scaling is
perplexing. The majority of studies carried out to
address issues of validity have concentrated on the
concurrent validity of the technique. Investigators have
correlated goal attainment outcome scores with changes in
widely used measures of treatment outcome such as the
Minnesota Mutiphasic Personality Inventory. In one such
study, Mauger et al (1974) found the correlation to be
non-significant. Client's own ratings of the
effectiveness of treatment were also found not to
correlate with goal attainment scores by Lefkowitz (1974)
although a similar study by Smith (1975) discovered a
significant correlation on consumer satisfaction scores.
A well constructed study by Willer and Miller (1976)
found a significant positive correlation between client
25.
goal attainment scores and client satisfaction but failed
to find a similar relationship between therapist goal
attainment ratings and the same client satisfaction
measure. The conclusion from this is that the studies
provide conflicting evidence for the concurrent validity
of Goal Attainment Scaling assuming, of course, that one
accepts the validity of consumer satisfaction rating
scales themselves.
Other studies in this area have also attempted to use
independent behavioural ratings by teachers, parents and
clinicians (Garwick 1974b. Weinstein and Ricks 1977).
Results here again provide conflicting evidence for the
validity of Goal Attainment Scaling. The proponents of
Goal Attainment Scaling have responded to criticism in
this area by suggesting that, since Goal Attainment
Scaling is an individualised method of establishing
treatment goals, then it would be highly unusual if
standard rating scales did correlate with goal attainment
scores. In one sense this argument seems valid, as the
authors' original reason for devising Goal Attainment
Scaling was that there existed few, if any, measures that
would be sensitive enough to allow for comparison across
treatments, therapists or services. On the other hand, it
might be expected that goal attainment scores would have
some association with other measures, particularly those
based on independent behavioural ratings.

26.
Studies addressing the content validity of Goal
Attainment Scaling are extremely rare. Sherman (1974)
defends the content validity of his technique by stating
that,
"content validity is validity established by the fact
that the measure in question is composed of a random
sample of behaviours (or 'items'), the totality of
which is the entity we represent to measure." (p. 81)
The studies that have examined content validity have
similarly concentrated on the appropriateness of goals
chosen for particular groups of clients. In asking other
experienced clinicians to rate goals according to their
'reasonability', 'relevance' or 'completeness', Garwick
and Lampman (1972) and Lampman et al (1977) conclude that
agreement was high.
By far the most perplexing issue arises from examining
the construct validity of Goal Attainment Scaling.
Defending the technique, Garwick (1974c) argues that the
construct being examined is 'outcome' or 'attainment of
expectations'. This is a somewhat vague comment that
poses as many questions as it seeks to answer. The
construct validity of Goal Attainment Scaling may be
better understood by considering the basic questions
asked during service evaluatioa, namely,

28.
on-going evaluations, as part of a quality assurance
initiative, or where it would be impossible or unethical
to manipulate treatments, a further method is required
which will seek to answer the third question posed
earlier, namely, has the service brought about the
necessary change in the client ?
Goal Attainment Scaling is a measurement system that
would fall into this category. Goal attainment systems,
in general, need not compare results with baseline
scores. It is more useful, here, to judge effectiveness
by measuring the end result against predetermined goals
for the service. This, in itself, raises questions.
Firstly, who decides what these goals will be ? Secondly,
how will it be known if the outcome is significant?
In many areas of health care goals have already been
established by research. For example, inoculation against
polio considerably reduces the risk of contracting the
illness, stopping smoking reduces the risk of developing
lung cancer and taking paracetomol will reduce the
sensation of headache in the majority of cases. In other
areas of health care, matters are not so straightforward.
As Stanley (1984) reminds us, selecting goals in the
field of psychiatry, care of the elderly and mental
handicap is a more hazardous process. This is partly due
to a lack of research to determine consistent outcomes,

29.
but also because the philosophy of care has changed. How,
then, may goals be decided upon and who is the best
judge ?
In constructing their argument for Goal Attainment
Scaling, Kiresuk and Sherman pose similar questions in
the area of psychiatry. The use of global rating scales,
they argue, might be appropriate for assessment purposes,
but provide little clue as to what goals to set for each
client. Measuring the effectiveness of a service on such
dimensions is also meaningless if they do not take into
account the unique nature of the person's problems.
Furthermore, because no standard rating scale exists,
comparison between services is futile. Kiresuk and
Sherman decided that experienced clinicians would be in
the best position to set goals for clients. In this way,
their approach is similar to the concepts of social
validity (Wolf 1978) and social evaluation (Kazdin and
Matson 1984). Social validity essentially considers the
social context in which treatment takes place. In areas
that are highly subjective, for instance quality of life,
it would be possible to construct socially valid criteria
for its measurement. These may be arrived at, for
example, by considering what the general public
considered to be a good quality of life. If this
investigation was carried out in an empirical fashion,
then it would also be possible to judge under what

30.
circumstances and to what extent someone was enjoying a
good quality of life.
By using experienced clinicians, the acceptability of the
focus of and purpose of treatment is being established by
socially valid criteria. However, it might be
satisfactory to determine what objectives should be set
for individuals, but at what point can it be determined
that the person has changed enough and that the service
has accomplished its task?
Traditionally, statistical tests of significance have
been used to indicate that sufficient change has taken
place. More recently, the value of such tests has been
questioned and the notion of clinical significance has
become more prominent (Jacobsen 1988). Essentially, the
use of statistical tests relies on the comparison of
group means and takes little account of the variability
of treatments. Furthermore, the notion of statistical
significance reinforces the false impression that a
person may be seen as 'well' or 'not well' or 'improved'
or 'not improved'. In reality, as Kendall and Norton-Ford
(1982) point out, change cannot be seen as a dichotomous
concept and it is far better to conceive of a range of
outcomes in treatment. In terms of Goal Attainment
Scaling, statistical tests cannot be applied as it is an
individualised measure and, more importantly, does not

31.
compare a person's outcome score to one obtained at
baseline. Instead, this technique requires a range of
possible outcomes to be selected by socially valid
criteria and the T test is used to give some indication
of the extent to which the expected outcome has been
attained.
To summarise, the essential concept, or construct,
underlying Goal Attainment Scaling as a service
evaluation measure is to provide as close an indication
as possible of the extent to which the care given to
individuals attains the expectations of the service given
the unique nature of that person's circumstances and the
context in which care takes place. It is not an indicator
of client progress or improvement, since the current
levels of functioning need not appear on the scales. This
is an important aspect of the measure, since in certain
areas of health care, progress or improvement may not be
the anticipated outcome. For example, there may be many
instances in which the efforts of staff will be directed
at maintaining a client at one level of functioning in
order that there will be no deterioration. Using Goal
Attainment Scaling would allow such staff to adjust their
expectations and subsequently receive recognition for
their work.

32.
Modifications to the original technique
The adoption of any innovation is never an all-or-nothing
process. It is inevitable that new techniques will be
adapted and changed. There is nothing inherently wrong
with this, as long as those who alter procedures and
techniques can provide valid reasons for doing so and
state these explicitly.
Goal Attainment Scaling is a technique that has been the
subject of many adaptations. Advocates of the technique
have usually welcomed the variations that have been
devised and Smith (1981) argues that Goal Attainment
Scaling was always intended to be a flexible evaluation
tool.
Most of the variations on the original idea are discussed
below but it is worth pointing out initially that an
extensive criticism of these changes is difficult to
accomplish given the nature of how they have been
described in the literature. Many papers report
adaptations that have been made and evaluated as part of
a 'one-off' study. Under these circumstances it is hard
to judge their overall success as a service evaluation
instrument and how these changes have been received by
those services.
A brief telephone survey carried out by Calsyn, Tornatzky
and Dittmar (1977) investigated the use of Goal

33.
Attainment Scaling. Seventy-one users of the technique
responded to their survey. Thirty-one reported that they
had discontinued its use. Seven of these said it had been
used only for a single evaluation and only six reported
that they had replaced Goal Attainment Scaling with a
superior method. The remaining eighteen previous users
commented that administrative problems had forced them to
discontinue their evaluations. The precise reasons for
this are not given but included financial and time
constraints and also the fact that key personnel familiar
with the technique had left the service.
From all of those surveyed, the authors questioned the
respondents about the purposes to which Goal Attainment
Scaling had been put. Only sixteen of the seventy-one
users reported that the technique had been used
exclusively for service evaluation purposes. Twenty-eight
said the technique had been used for the benefits of
service evaluation and treatment. In fact, a further
nineteen users said Goal Attainment Scaling was used
solely for therapeutic purposes. The remaining eight
users could not be classified in either category. Of the
forty-four respondents using the technique for
evaluation, sixteen evaluated both the outcome of
treatments and the skills of the therapists, twenty-four
evaluated only the treatment outcome and four used the
technique for therapist only evaluation.

34.
Whilst this survey is interesting from the point of view
that Goal Attainment Scaling has been modified, it is not
clear precisely whether the adaptations have improved or
compromised the original idea. For example, little
mention is made of for how long the various services have
been using the technique and to what extent staff feel
that this method of evaluation is superior to others.
From other reported studies, it is apparent that the
random assignment of clients to different treatment
programmes has been abandoned. In one sense this weakens
the technique as an objective measurement. In other
words, any differences in outcomes for individuals or
groups could now be attributed to the initial
characteristics of the clients or an interaction of other
variables that have little or nothing to do with the
intervention. These differences could be controlled for,
as others have suggested (Calsyn and Davidson 1978), by
taking some form of measurement of group characteristics,
but there is no evidence from most studies that this has
been carried out.
In other studies, further requirements of the original
design have been abandoned. A disturbing trend is that
which questions the value of using independent follow-up
raters (Maloney et al 1984). This is disappointing, since
an element of bias is automatically introduced into the
technique.

35.
A further threat to the internal validity of Goal
Attainment Scaling is the involvement of others in the
gcal selection process. For therapists wishing a
favourable evaluation, there may be a temptation, should
they be exclusively responsible for setting goals, for
easily attainable targets to be set. This potential
danger has been compensated for in many studies, however,
by involving as many people as possible in the goal
setting process, for example parents, the client
him/herself and other professionals involved in
treatment. In this situation, the result would appear to
be that more realistic goals are established (Jones and
Garwick 1973). This is encouraging, since the involvement
of others in treatment and service planning has long been
recognised as having many benefits (Porterfield, Evans
and Blunden 1984).
Whereas this departure might be seen as positive, other
trends away from Kiresuk and Sherman's original idea may
not be so. The authors originally thought that their
technique would provide objective measurements based on
truly individualised goals. The task of the goal setters
is clearly to take into account the individual's
circumstances and the context in which care is being
given. Whereas using standard ratings for assessment
purposes might be acceptable, there has been a temptation
to use such tools as a means of defining scales for each
person. For example, Maloney et al (1984) used Goal

36.
Attainment Scaling to evaluate treatment outcome for a
group of neurologically handicapped children. Each
child's goals were determined by establishing baseline
scores on five areas compiled from two developmental
checklists. The goal setters then utilised the parameters
set out within these checklists to determine scales for
each child. Although this eventually provided individual
goals for each child, they cannot be said to be
individualised, since a standard assessment tool was used
to determine them.
It has previously been demonstrated that this approach
may be acceptable in certain circumstances. For example,
Guy and Moore (1982) describe the use of Goal Attainment
Scaling with groups of schizophrenic clients. Scales were
constructed with reference to a rating scale which had
been devised following the authors' extensive experience
of individualised goal setting in this area. This process
is similar to that of 'core' planning which is to be
distinguished from 'care' planning because of the way in
which it makes use of standard plans of care,
irrespective of individual cirsumstances. Core planning
has been developed successfully in the general nursing
area where, under certain conditions, research would
suggest that care planning can become more efficient
(Wright 1987). However, it would be wise to proceed with
caution in adopting such an approach in every instance.
37.
An interesting departure from the original use of the
technique has been using Goal Attainment Scaling to
evaluate therapists themselves. Conceptually, Goal
Attainment Scaling is not a measure of client progress
but a measure of the extent to which expected outcome has
been achieved. In this sense, important information is
fed back to the therapist concerning their own abilities
at predicting outcome and conducting therapy. Holroyd and
Goldenberg (1978) describe the use of Goal Attainment
Scaling with disturbed children. Their study highlighted,
in quantifiable terms using the T score, to what extent
therapists under or over estimated outcomes for their
clients in common areas, for example maladaptive
behaviour and skill acquisition. This would be useful in
the field of mental handicap where expectations of
clients' abilities and potential for change has
traditionally been very low.
Continuing the trend away from a purely service
evaluation technique, considerable interest has been
expressed in the literature in the use of Goal Attainment
Scaling for therapeutic purposes. Many studies have
demonstrated that clients who have treatment goals
established in objective, measurable terms, have shown
greater improvement than clients who have not (La
Ferriere and Calsyn 1978). This study also showed that
clients who had been involved in goal setting showed
greater motivation for change than those who had not.

38.
Similarly, Galano (1977) compared four levels of client
participation in goal setting and also concluded that the
greater the involvement from clients, the more effective
treatment seemed to be.
The potential of Goal Attainment Scaling
However interesting these studies appear to be, they may
only demonstrate that goal setting is better than no goal
setting. It would be significant if research could
demonstrate the superiority of Goal Attainment Scaling
over other goal setting methods. In an attempt to answer
this question, Weinstein and Ricks (1977) examined the
influence of Goal Attainment Scaling on the extent to
which goals were more specific and more relevant to the
individual's problems than other techniques. This well
controlled study indicated advantages for clinicians
trained in Goal Attainment Scaling methodology.
Despite the amount of money and the extent of research
carried out on the technique, this brief review shows
that Goal Attainment Scaling has yet to receive
widespread adoption as a service evaluation technique.
From the literature, the reasons for this may be inferred
to be as follows.
Firstly, the correct use of Goal Attainment Scaling may
place huge administrative burdens on services. The
technique requires an intake committee of considerable

39.
expertise to establish goals for each client within the
service who would, in the light of their task, be
carrying out few other duties apart from this. Secondly,
an independent follow-up team would need to be employed
whose sole task would be to contact clients following
treatment. Added to this would be the consequent
administrative support. It could be argued that any
service seriously committed to the use of Goal Attainment
Scaling would make the necessary financial adjustments to
accomodate the change although this is rarely the case in
practice. It may be no coincidence that the two aspects
of the original methodology that are consistently omitted
in the reported application of the technique have been
the use of an intake committee and a follow-up team.
For any evaluation technique to be universally accepted,
it must answer the types of questions that are most
frequently asked of the service. As previously shown, in
recent times these questions will vary depending on
whether the consumer, the administrator or the funder of
the service is posing them. However, the overriding
concern will be with the impact the service is having on
the clients (Datta and Perloff 1979). Goal Attainment
Scaling provides some measure of outcome but it is
outcome based on the expectations of clinicians given the
context of care in which they practice. For consumers and
funders of the service, this may not be sufficient or may
not justify the amount of resources that would need to be

committed to the technique. As one review of Goal
Attainment Scaling summarised;
40.
"'goals attained may not be a satisfactory criterion
of success for most publicly funded programmes
which are accountable to public officials as well
as to clients and service providers. Most funding
sources will want outcome data on specific
criteria." (Calsyn and Davidson 1978)
Currently, many 'embarassing' questions are being asked
of professionals concerning their role and the issue of
accountability is becoming more prominent. It might be
imagined, therefore, that others would want greater
control over the clinicians' decision making process
rather than an evaluation technique based on outcome
criteria defined by the professionals alone. Whether this
situation is good or bad, there is mounting pressure on
professionals to produce results which are more easily
understood by those for whom they provide services and
those for whom they work. This situation not only applies
to health care but to other aspects of public services,
hence the recent debates emphasising standards of
performance in the three 'Rs' in our schools.
Furthermore, doubts still remain regarding the
reliability and validity of Goal Attainment Scaling that
would be sufficient to deter services from adopting the

41.
technique and committing resources to it. It may not be
sufficient, as some have argued, that the technique
should be accepted because it is at least as robust a
measure as any other (Garwick 1974b).
As far as future research is concerned, it would perhaps
be better to continue the trend away from developing Goal
Attainment Scaling as a service evaluation technique and
explore its value as a clinical evaluation method. From
previously cited studies, there is evidence to suggest
that the quality of care may be improved using the
technique and that goal attainment scores might provide a
valuable source of feedback to staff. This would further
conform to the essential nature of quality assurance
within service systems, that being to identify means of
improving as well as preserving the quality of what is
offered to clients. As mentioned above, there may have
been an over reliance on the measurement of the more
structural aspects of care and an almost slavish
adherence to the process of quality assurance. Goal
Attainment Scaling may not be able to answer all of the
questions concerning the effectiveness and efficiency of
services. Should it be able to make a contribution to the
improvement of care for clients, then further investment
of effort into its development is warranted.

42.
CHAPTER THREE
GOAL ATTAINMENT SCALING AND THE DELIVERY OF NURSING CARE
The potential for mental handicap nursing
The previous chapter has shown how Goal Attainment
Scaling may be considered to have several advantages as a
clinical evaluation technique. These advantages may be
summarised as follows.
Firstly, Goal Attainment Scaling is a flexible evaluation
tool. It can be used with a variety of client groups
within a range of health care settings. Its methodology,
with certain exceptions discussed earlier, is also
capable of being adapted. This is a feature of the
technique which contrasts sharply with other evaluation
methods that are usually designed for use in specific
areas (Kiresuk and Sherman 1968).
Secondly, Goal Attainment Scaling would appear to
complement rather than compromise the manner in which
clinicians make decisions concerning care for their
clients. Any professional must firstly be able to draw
upon a body of knowledge as a basis for his or her
practice. This knowledge must, however, be adapted to the
particular individual for whom he is caring and be set
within the context in which the care is taking place. In
this way, a plan of care which is unique for that

43.
individual will be devised and outcomes for that care
will be predicted. The methodology outlined by Kiresuk
and Sherman shadows this process and also requires the
expected outcomes to be explicitly stated and to be
capable of independent validation. This introduces the
important aspect of accountability to the professional's
role. Holroyd and Goldenberg (1978 comment that, whereas
professionals have traditionally resisted attempts by
others to formally appraise or evaluate their work, Goal
Attainment Scaling could possibly be perceived by them to
be less threatening because of the clear link between its
methodology and their own process of clinical decision
making.
A third important advantage of Goal Attainment Scaling is
its potential to enhance the status of emerging health
care professions, particularly nursing, Nursing is
rapidly developing its identity as an independent
profession (Salvage 1990) and no longer sees its role as
a passive one, undertaking tasks delegated by doctors.
Nurses are now seen as a more proactive and problem
solving workforce within the health care system. To
compliment this rise in status, nurses have developed a
system called the nursing process (Kratz 1979) which
introduced the practice of making nursing assessments,
planning a regimen of care, implementing such care and
evaluating its outcome.

44.
The literature on the nursing process is extensive and a
useful paper by De La Cuesta (1983) charts its main
developments, Conceptually, the nursing process is no
different to decision making models used by other
professional groups (Henderson 1982) but its significance
lies in the emphasis on nursing being an autonomous
health care discipline. Since the adoption of the nursing
process, however, nurses have been criticised for its
somewhat ritualistic application (Manthey 1980) and the
apparent neglect of nurses to link evaluation to every
stage of the process (Waters 1986). Critics point out
that nurses frequently reach the evaluation stage of the
process and have little or no means of demonstrating the
extent to which the client has progressed or even the
extent to which nursing intervention has been useful.
Part of this problem is certainly attributable to the
emerging, but not yet substantial, body of nursing
research knowledge upon which to base any planned
intervention. Nurse decision making, however, does not
draw solely on such a knowledge base. Woods and Catanzaro
(1988) describe other sources of knowledge as being
aesthetic, personal and ethical. Without elaborating upon
these, such components could be described as the more
intuitive aspects of care. As suggested in the previous
chapter, Goal Attainment Scaling could greatly assist
nursing in strengthening its scientific approach in the
absence of a large body of existing research knowledge.

45.
This could be a considerable advantage in branches of
nursing where the empirical basis of care is
comparatively sparse, for example mental handicap and
psychiatric nursing. Partly due to the lack of research
knowledge, greater emphasis is placed on
multidisciplinary teamwork to take decisions concerning
the best form of care. Although teamwork has sometimes
been criticised as providing an inferior service to
clients (Noon 1988), this has largely been because of
poor co-ordination of the different professions (Oswin
1984). With its emphasis on the prediction and
measurement of outcome, Goal Attainment Scaling could be
a useful vehicle for unifying the efforts of the team
members. What would be significant for nursing staff is
that they would be in the best position to co-ordinate
the goal attainment process. In the fields of mental
handicap and psychiatry nurses have long been recognised
as having a crucial impact upon the personal growth of
their clients (Milne 1986). Unfortunately, this
recognition has rarely been converted into actual
practice. The main reason for this has been suggested as
one of nursing staff not possessing a means of exercising
this responsibility (Milne 1985). If nursing staff became
skilled in the use of Goal Attainment Scaling, this could
enhance their status as well as providing a better
service for their clients and carers. In short, if any
profession should be trained in the use of the Goal
46.
Attainment Scaling methodology, it should be nursing
staff.
Barriers to adopting Goal Attainment Scaling
Three potential barriers exist to realising this
eventuality which could be described as professional,
technical and organisational. Firstly, mental handicap
nurses in particular have faced considerable pressures
over the past three decades both from within and outwith
their own profession. Reports have both recommended the
demise of mental handicap nurse training (DHSS 1979) and
its maintenance (DHSS 1991). Despite evidence to the
contrary (Lahiff 1990), the stereotype still exists of
the mental handicap nurse as someone who performs
relatively low level skills in an institutional
environment. The implicit criticisms of nursing staff
following the hospital inquiries referred to in Chapter
One could suggest to some that they are an unlikely
workforce to deliver services in line with the philosophy
of an ordinary life. Furthermore, the new arrangements
for community care (DHSS 1990) require explicit
statements from Health and Local Authorites as to what
are the health and social needs of the population for
whom they are responsible. In some people's view, mental
handicap nurses provide little in the way of specialist
health care, thus reducing their contribution to future
services to the extent of caring for a minority of the
population who have severely challenging behaviour or
multiple handicaps. Whereas this might provide nurses

47,
with some sort of role in future services, this option is
very much seen as a "cul-de-sac" (Brown 1991) which would
deny nursing staff the opportunity to realise their full
potential. Others prefer a more pro-active future for
nurses (Sines 1990) which would see them contracting
their skills to others to provide a range of social and
health care services. Coupled with this vision is the
need for nurses to take on a more executive function and
develop specialities in quality assurance, care
management and the co-ordination of the activities of
other professions (RCN/Society of Mental Handicap Nursing
1991). In order to achieve this objective, skills in
techniques such as Goal Attainment Scaling would affirm
their value to others.
From a technical viewpoint, evidence would suggest that
training professionals in the use of Goal Attainment
Scaling has not proved as easy as first imagined (Choate
et al 1981), It was anticipated, for example, that
experienced clinicians were already in the habit of
setting clear, measurable objectives and that Goal
Attainment Scaling would very much be seen as a minor
addition to this process. Choate and his colleagues found
that this was far from the case and consequently used
Goal Attainment Scaling as the sole method of teaching
general goal setting ability. Further evidence concerning
nursing's atempts to introduce a more individualised and
systematic approach to care could cast doubt on the

48.
wisdom of giving staff the responsibility for
implementing and co-ordinating the process of Goal
Attainment Scaling. An evaluation of nursing activity in
acute settings (RCN 1980) revealed alarming evidence
about standards of care. The report concluded that,
"there was no evidence of anyone in charge of
and managing the nursing. There was little
evidence of skilled nursing practice, no
supervision or teaching of unskilled nurses.
No-one appeared knowledgeable about, or
responsible for, individual patients. There was
no evidence of any assessment of patients'
needs, of any planning or co-ordination of
work or review of "l07ork that had been done."
To describe this as a report that would fail to inspire
confidence in nurses' abilities would be an
understatement. Similarly, the conclusions of a project
aimed at introducing the nursing process in a general
hospital (Gooch 1982) pronounced it a failure despite the
good intentions and willpower of staff. In psychiatry and
mental handicap settings, similar doubts are expressed
about nurses' ability to formulate treatment goals
(Heffrin and Hunter 1975a. 1975b) or even commence the
process of care due to a lack of knowledge of assessments
(Beaill and Cook 1987).

49.
Elsewhere, evidence exists to demonstrate the value of
training staff in the use of goal planning techniques.
For example, Sturmey et al (1988), Montgomery et al
(1988) and Martin and Ticktum (1987) are all examples of
how a more individualised and systematic approach to care
have been introduced at relatively little cost and
disruption into mental handicap settings. Similarly,
comparable papers regularly appear on the nursing process
concerning other types of setting (Chiarella 1985),
If any conclusions are to be drawn from such evidence it
would seem to be that, as far as nurses are concerned,
the difficulties in adopting innovations seem not to be
so much a problem of competence but of performance. If
nursing staff were to be trained in the use of Goal
Attainment Scaling, careful attention would need to be
paid to the organisational aspects of the environments in
which nurses practice. Examples are given below of
organisational changes that have been made in several
areas to bring about improvements in the quality of life
for people with mental handicaps, Such evidence needs to
be examined carefully if Goal Attainment Scaling is to
have any chance of being adopted successfully.
Overcoming the obstacles
a) The scale of the problem
Health care settings are complex environments, Whatever
the good intentions of would-be change agents, simplistic

50.
solutions to complex problems are rarely going to be of
any use. As far as mental handicap services are
concerned, despite the initial success of behavioural
interventions in the 1960s and the subsequent enthusiasm
for the philosophy of normalisation, real progress in
enhancing the quality of life for clients has been
difficult to achieve (Emerson 1985). Whereas the
deinstitutionalisation movement may have benefitted some
clients (Bell 1976. MacEacheron 1983), those with more
complex needs do not appear to continue to make gains
upon leaving hospitals as was first anticipated (Pedlar
1990. Intagliata et al 1986). Intervention designed to
meet the needs of clients with challenging behaviour, for
example, has traditionally relied upon individualised
programmes of behaviour change. Gradually, however, it
has become apparent that this approach alone may be
insufficient to bring about lasting change in people's
lives and attention has moved to the design of more
elaborate systems which include changing several aspects
of the person's life at one time. Such initiatives may
include altering staff habits and routines or changing
the physical environment in some way. Unfortunately, it
seems that such initiatives have been susceptible to the
identical problems of maintenance and generalisation. As
Partridge et al (1985) comment, recent literature is full
of " 'it would have worked ... but' " types of projects.
Such projects have continued to reveal additional

51.
variables that were not taken into account fully when
designing studies.
The realisation that 'quick fix' solutions do not
generally produce the desired result has led to
enquiries into obtaining an even more 'ecological' view
of organisations in order to further clarify important
variables that affect the quality of care. An ecological
perspective (Willems 1974) seeks to examine the system
like relationship between individuals, their behaviour
and the environment in a much broader context than
before, An extensive, but by no means exhaustive, list of
relevant factors that affect quality of life and quality
of care has been described by Meinhold and Mullick
(1990). These authors list the following major obstacles
to the personal growth of clients in care organisations;
staff absenteeism
staff turnover
low levels of skilled staff
staff attitudes
institutional regulations
size of the living environment
quality of the physical environment
Such a list is daunting in its implications and attempts
at change have rarely sought to act on every aspect of

52.
the service at once. The list may roughly be divided into
aspects of staff behaviour and the physical environment
and the following briefly gives examples of initiatives
taken already in this area. It may be important to
consider these in order to maximise the effectiveness of
any training undertaken in Goal Attainment Scaling.
b) The use of integration
A major initiative in this country over the past two
decades has followed examples from abroad in aiming to
reverse the segregationalist policies which have been
thought to inhibit the quality of life of people with
mental handicaps. The observations of investigators such
as Goffman (1961) and other sociological studies have
outlined specific problems faced by residents within
institutions. Social policy since the 1970s has been
aimed at creating new patterns of care in community
settings coupled with implied assumption that hospitals
will contract in size and eventually close. The
deinstitutionalisation movement, as Bachrach (1981)
observes, is essentially ideologically rather than
empirically driven and is "dedicated to the dignity of
individuals". There is little inherently wrong in this
approach but it has been discovered that the simple
physical relocation of people in the community has not
brought about the anticipated benefits in terms of
improved quality of life (Landesman-Dwyer 1981).
Experiments in the relocation of clients to smaller, more

53.
homely dwellings, may bring about initial improvements,
but it would appear that this trend cannot be maintained.
Saxby (1988) and McConkey et al (1982), for example,
demonstrated that new opportunities may be presented to
individuals to participate more in the life of the
community but these benefits must be viewed in context.
The study by Cheseldine and Jeffree (1981) examined the
use of leisure time by people with mental handicaps and
found that much of this was spent in solitary activities.
More recent studies (Causby and York 1991) continue to
show that friendships and meaningful contact with non
handicapped people are difficult to achieve. For some
groups of clients, especially those with challenging
behaviour, there are considerable risks of readmission to
hospital (Intagliata and Willer 1982). This is a rather
disappointing scenario but it should not deflect the
efforts of services to continue to examine other means of
enhancing the lifestyles of people with mental handicaps.
c) Changing attitudes
Altering the personal qualities of direct care staff and
how they are trained and organised is a further major
initiative that has been taken in order to bring about
better services to clients. Possession of the right
attitude is frequently cited as being a major factor in
determining the quality of care delivered to clients,
especially since the change in philosophy from segregated
to more integrated services. Many service evaluation

54.
systems have attempted to include some measurement of
staffs' values and beliefs (Chamberlain and Bradbury
1990). One of the immediate problems of such an approach
is that of definition, namely that no satisfactory
explanation exists as to what might constitute the right
attitude, In the opinion of many, a person's attitude
might be construed as positive if it is in line with the
principles of normalisation as outlined by Wolfensberger
(1983). The aim of this philosophy is that staff should
seek to maintain and develop valued social roles for
their clients in a way that is humane. Research has often
attempted to demonstrate that low levels of interaction
between staff and clients could be directly attributable
to the beliefs of staff. Grant and Moores (1976), for
example, categorised staff as being either "optimistic"
or "pessimistic" about their clients and they achieved
some success in showing that those who were pessimistic
about the potential of their clients spent less time in
meaningful activity with them. The authors of such
studies have found their views echoed by statements in
official reports. The Jay Committee (DHSS 1979) severely
criticised nursing staff attitudes and suggested that
hospitals were poor environments due to the impoverished
beliefs and values of the staff. Whereas some truth might
be found in this, more recent studies (Lahiff 1990) have
shown nursing staff to be overwhelmingly in favour of
normalisation principles. If this is the case, then why
are services still criticised? The answer must surely be
55,
that, whereas beliefs may have altered the planning
processes for services this has been insufficient, in
itself, to bring about lasting benefits to the clients
themselves.
d) Staffing
Further attempts to change the lifestyle of clients by
changing the behaviour of staff have been made by paying
increasing attention to staff ratios. The effects of
overcrowding on behaviour such as aggression has already
been demonstrated elsewhere (Hutt and Vaizey 1966) and
large living areas conjure up images of an overworked
staff performing basic care tasks only with little time
for training activities and more informal contact with
clients. A frequently proposed hypothesis is that which
supposes that an increase in staff:client ratio will
bring about improvements in learning and quality of life
for those in care. Studies have concentrated on improving
staff ratios in two ways. One method is to reduce the
numbers of clients whilst keeping staff numbers constant.
The other method involves increasing the number of staff.
Many studies may be used to provide conclusions in this
area but the one conducted by Harris, Veit and Chinsky
(1974) is the one most frequently cited, This study
manipulated ratios by adding staff to an institutional
unit caring for children and compared the effects of this
upon quality of interaction with subsequently reducing
resident numbers. Adding staff to the unit did not

56.
significantly effect the quality of interaction although
the average amount of staff-initiated contact increased.
Reducing numbers of residents did, however, positively
affect the quality of contact between staff and
residents. In this country, Felce, Mansell and Kushlick
(1980) demonstrated that the addition of staff did not
result in a proportional increase in interaction and the
study conducted by Mansell et al (1982) showed once again
that staff spend a diminishing amount of time interacting
with clients proportional to the amount of staff added to
a situation. It may be concluded from this that
improvements can be made in the quality of interaction by
manipulating staff ratios. However, the issue may be
further complicated by other research to suggest that it
may not be the addition of the staff member or the
reduction in client numbers that is important. Le Laurin
and Risley (1972) showed that improvements in interaction
can be brought about by allocating staff to specific
tasks rather than specific individuals. In other words,
it is the extent to which the staff member's role is
specified in a unit that is important.
Effective staff management
All of this has been described to demonstrate that simple
manipulations have little chance of success. An
ecological analysis might be useful in identifying
aspects of an organisation that needs to be changed but
it cannot, in itself, identify the ways in which these
57.
changes may be brought about. We know, for example, that
the nursing process or even Goal Attainment Scaling have
potential benefits but staff need a greater incentive to
introduce such innovations into their work other than the
fact that they, too, believe that they are a good idea.
As Cullen et al (1983) succinctly conclude,
"the problem of persuading direct care staff to
change the way they interact with residents from
present patterns to care more in line with that
specified by the nursing process ... is this: why
should they?"
If staff behaviour is going to change, these staff must
be given the correct framework in which to practice new
patterns of care. As Reid and Schepis (1986) point out,
previous interest in staff training as a means of
changing staff behaviour has now been superceded by an
interest in the wider issues of effective staff
management. This subject has recently been addressed by
the emerging technology of organisational behaviour
management. Organisational behaviour management seeks to
alter the manner in which staff apply previously acquired
skills. The essential features of this approach are
described by Reid and Shoemaker (1984) as including,
a) a focus on specific work behaviour of staff
b) a systematic means of monitoring work behaviour

58.
c) methods of reinforcing desirable work performance
Organisational behaviour management now has a substantial
body of literature to demonstrate its effects and
comprehensive reviews have been carried out by Prue et al
{1978" Reid and Whitman (1983) and Egleston (1986).
Essentially, the approach adopts a behavioural
orientation to staff management. As in the use of
behavioural methods with individual clients, the studies
carried out may be divided into the following categories;
antecedent procedures
consequence procedures
self-management or participative procedures
multi-faceted procedures
Antecedent procedures are concerned with manipulating
conditions prior to certain staff behaviours in order to
increase the probability of such behaviours occuring.
Shoemaker and Reid (1980), for example, provided staff
with clearly laid out instructions and explanations
concerning a procedure on absenteeism. Fielding et al
(1971) carried out some early investigations describing
the effects of providing staff with explicit written
instructions concerning their roles. Moving away from
written instructions, Gladstone et al (1977) used
modelling techniques to demonstrate to direct care staff
how to improve the self-care behaviours of children with

59.
mental handicaps. Although these studies achieved
moderate amounts of success, the effectiveness of
antecedent procedures alone has generally been found to
be weak. In a less empirical fashion, organisations
already utilise antecedent procedures in the form of job
descriptions, written policies and verbal directives from
managers. In general, such devices may be described as
ineffective, partly because of their inability to give
precise instructions to staff but also because the
consequences of performing certain tasks are equally
vague.
Because of this, greater interest has been paid in the
literature to procedures which manipulate the
consequences of staff behaviour. Consequences, of course,
can be either positive or negative. The use of negative
procedures alone to reduce undesirable behaviour is
comparatively rare. However, Repp and Deitz (1979)
successfully improved the administrative behaviours of
staff by removing staff from their posts as a consequence
of inadequate performance. The most popular approach in
this area is using positive consequences as a means of
improving desirable work behaviour. The main issue here
has been not whether such procedures have the desirable
effect but how practical they are to implement on a wide
scale due to the cost involved. For instance, Iwata et al
(1976) improved staff care practices by using a lottery
scheme as a means of rewarding appropriate behaviour.

60.
This scheme may be too expensive a means of staff
management for many services. A recent survey by Green
and Reid (1991) demonstrated that many facilities in the
United States for people with mental handicaps already
claim to use positive approaches to staff management. The
comprehensive list of methods produced by this survey
illustrate that the most frequently used reinforcements
may be described as the most inexpensive. Written
feedback was the most popular method followed by some
form of formal recognition such as being named "employee
of the month". When asked to rate how effective managers
believed the various options to be, however, feedback was
only felt to be moderately effective. Time off and
monetary incentives were rated as the most effective but
such procedures were infrequently used because of the
costs involved to the service.
Partly because of this issue, some interest has been
shown in the use of self-management to improve or
maintain staff performance. By self-management, this
means asking staff to monitor their own performance
(Burg et al 1979) or monitor and evaluate their behaviour
(Kissel et al (1983). A more complex study in this area
was carried out by Burgio et al (1983) to increase levels
of interaction between care staff and clients with mental
handicaps. In this study, staff not only recorded their
own behaviour but participated in setting goals for their

own performance and reinforced this performance
themselves following self-evaluation.
61.
By far the most effective means of staff management is
that using a multi-faceted approach. These approaches are
more comprehensive in that they combine antecedent and
consequence techniques. Ivancic et al (1981), for
example, describe an experiment designed to increase
language training activities for children with profound
mental handicaps, Firstly instructional sessions were
given to staff in how they might increase utterances in
the children. Secondly, prompts were delivered in the
form of written instructions posted within the facility
as well as verbal prompts and modelling delivered by
trainers. Thirdly, feedback was supplied consisting of
verbal praise and publicly posted results. The study
resulted in increases in verbal interaction as well as
demonstrating that this was achieved with no disruption
to existing routines and at relatively little cost.These
multi-faceted approaches may be seen as the most
effective in achieving the aim of altering staff
behaviour patterns. A model of the principle components
of such an approach is shown in figure 3.
To summarise, if Goal Attainment Scaling is to be used
within mental handicap services, it would be advantageous
to use a staff management approach similar to that
outlined above. This would necessitate paying careful

define staff responsibilities
monitor staff r---------------~ performance ~----------------------------
train staff
no
observed performance
dequate ?
provide negative
consequence
yes
provide posi tive
conseque nce
Figure 3. Model of staff management process (Reid et al 1989)

62,
attention to the antecedents and consequences of staff
behaviour within a particular setting

63.
CHAPTER FOUR
AN EXPERIMENT TO INTRODUCE GOAL ATTAINMENT SCALING
WITHIN A MENTAL HANDICAP HOSPITAL SETTING
Introduction
The previous section has detailed the main advantages of
Goal Attainment Scaling and the need to take a
comprehensive staff management approach rather than
merely using staff training to introduce Goal Attainment
Scaling as a technique into health service settings. It
has been demonstrated how the technique may have
advantages in a variety of settings but in mental
handicap services in particular.
Although the terminology and language used by services to
describe their aims may differ, the general aims of
services for people with mental handicaps may be seen as
the increased independence and personal growth of the
client. This aim is usually achieved, on a day-to-day
basis, through written plans of action detailing training
and teaching activities. In some countries, such written
objectives have become a legal requirement (State of
Victoria 1986). Similarly, in the United States, official
bodies such as the Accreditation Council for Facilities
for the Mentally Retarded ( 1971) and the U.S. Department
of Health, Education and Welfare (1974) establish
regulations concerning training programmes. In the United

64.
Kingdom such regulations do not exist, although recent
legislation IDHSS 1990) mandates an assessment of an
individual's needs. It is generally left to health
authorities to specify the requirements for planning care
through policies.
It is not apparent to what extent legislation contributes
to the quality of services. As reported earlier, Repp and
Barton (1980) discovered the levels of interaction in
accredited facilities to be generally as poor as those in
non-accredited residences in the United States. It could
be the case, as Holburn (1990) suggests, that the over
zealous use of rules and regulations has resulted in
staff paying greater attention to their accountability
requirements than to the actual quality of life
experienced by their clients.
Services for people with challenging behaviour
For one group of people with mental handicaps it has been
extremely difficult to provide high quality services.
Such people are those who may display inappropriate
behaviour which may be difficult to control or dangerous
to themselves or others. Consequently, this group have
been euphemistically referred to as having 'challenging
behaviour' (Emerson et al. 1987) to describe the task
that is presented to services. Strict definitions of
challenging behaviour do not exist. The extent to which a
person's behaviour may be described as challenging relies

65.
upon the interaction of several factors which include the
behaviour itself and the ability of the environment to
"absorb" fLeudar and Fraser 1987) this behaviour. Because
of this, estimating precise numbers of clients who would
fall into this group is hazardous. Jacobsen (1982), for
example, proposed that up to thirty-five per cent of
people with severe mental handicaps exhibit problem
behaviour. The survey conducted by Kushlick and Cox
(1967) considered that, within a total population of
100,000, between ten and twenty adults display severely
challenging behaviour.
Whatever the estimate of numbers may be, it is clear that
this group expose fundamental deficiencies in mental
handicap services. The subjective impression gained by
many is that services often respond to such individuals
by attempting to refer the 'problem' on to increasingly
custodial forms of care (see Cameron et al 1984).
Research tends to confirm this impression: studies by
Sutter et al (1980) and subsequently by Intagliata and
Willer (1982) showed that challenging behaviour is the
main reason for readmitting clients to hospital
facilities following discharge into the community.
Even when admission to hospital is resisted, it should
not be assumed that services are coping adequately. A
survey by Oliver et al (1987) showed that only two per
cent of the 596 cases of self-injury they had identified

66.
had any form of written psychological treatment
programme, Furthermore, comparisons of care staff
behaviour towards people with challenging behaviour in
hospitals and the community (Intagliata et al 1986)
showed that staff possessed little idea of how to manage
and treat challenging behaviour appropriately.
Despite this somewhat pessimistic scenario, examples of
good practice can be found both in institutional settings
(Marshall et al 1983. Slama and Bannerman 1983) and in
the community (see Allen et al 1991). From these
accounts, however, it is interesting to note that their
success is reported to be derived from good staff
management procedures, irrespective of the fact that the
settings differ in their physical appearance and
location. The central issue, here, is that services
should not continue to repeat mistakes as they strive to
support clients in less institutional surroundings, As
far as people with challenging behaviour are concerned,
Emerson et al (1987) point out that
"(the) failure to serve people whose behaviour
presents a challenge has far-reaching consequences,
not only for the people themselves, .. but also for
the future of community based services."

67.
The settin~ for the study
It was decided that the present study should be concerned
with clients who have challenging behaviour. More
specifically, the aims of the study were;
a) to examine the effect upon care practice of
training staff in the use of Goal Attainment
Scaling
b) to investigate the utility of Goal Attainment
Scaling as a means of providing feedback to
staff concerning their goal setting practice
c) to examine the utility of Goal Attainment
Scaling as a clinical evaluation technique
The study took place within a hospital providing a
service for approximately three hundred clients. At the
time of the study plans were being implemented to
discharge between thirty and fifty residents per year
into staffed homes in the community which were to be
organised and staffed by the Local Authority Social
Services Department.
The areas chosen for the study were three wards providing
a home for people with severe mental handicap and
challenging behaviour. The precise numbers of residents
and staff at the commencement of the research are shown
in table 2. Night staff are excluded from the figures as
they were not specifically allocated to a ward. In

68.
addition, student nurses are also excluded because of the
temporary nature of their work on wards.
RESIDENTS PERMANENT STAFF
WARD A 19 17
WARD B 20 14
WARD C 22 10
61 41
Table 2. The numbers of permanent staff and residents
on the three wards involved in the study
Apart from nursing staff, each ward was also served by a
domestic assistant and a housekeeper. The nursing staff
reported to a nursing officer who, in turn, was
responsible to a senior nursing officer. Throughout the
time of the study the post of Director of Nursing
Services for the hospital was kept vacant although the
management of the hospital was overseen by the Hospital
Manager. Clinical psychology support was provided to each
ward consisting of a referral system for individual
resident as well as training and developmental work
carried out as required. This situation continued

69.
throughout the course of the project. Medical support was
provided to the ward via a consultant psychiatrist and a
registrar.
Method
Study design
This study employed a four stage intervention set within
a multiple baseline design across wards (Johnston and
Pennypacker 1980). The sequence of wards was chosen on a
random basis and this is illustrated in figure 4.
Multiple baseline designs demonstrate the effectiveness
of the intervention by showing that change is associated
only with the introduction of the intervention at
different points in time. This design was chosen for
three reasons. Firstly, each ward was significantly
different in terms of the numbers and gender of both
residents and staff, the experience and ages of staff and
the abilities and behaviour of residents. This excluded
the use of a control group. Secondly, the intervention
was designed to build up the skills of staff in a
sequential manner and it was important that there should
be no deterioration in the use of these skills. This
therefore precluded the use of a reversal design.
Thirdly, it could be supposed that the mere presence on
one of the wards of a researcher could have significantly
altered the culture of the organisation so as to transfer
effects to other wards prior to the intervention being

1-'-----
WAIW A B 1 2
WARD B
WARD C
I r---
I I , I I I
L ...........
B 1
- - -- -
B
l----_ ,---------
B = Baseline
2 = Go5l Setting
4 = Organisational Change
3
2
1
----,-- -
4 F.U.
-- - - - - - ...
3 4 F.U.
-1
I
2 3 4 F.U.
_____ l
1 = A Constructional Approach
3 = Behavioural Techniques
F.U. = Follow-up
Figure 4. Diagram showing multiple baseline design used within
the present study.

70.
commenced. The multiple baseline design would indicate
whether this effect had taken place. The first three
stages of the intervention were teaching phases and the
fourth stage introduced organisational changes similar to
those procedures described in the previous section. All
of these stages will be described in detail below.
Firstly, however, it will be necessary to outline the
specific manner in which the training was carried out.
It was planned to deliver the training over a thirty-six
week period. The training would essentially serve two
purposes. Firstly, new material would need to be
assimilated. Secondly, and perhaps more importantly, the
training would fulfill the purpose of exercising some
degree of antecedent control over staff behaviour by
specifying what tasks the staff were expected to perform
in their workplace. The method of training would,
therefore, need to be practical, relevant and specific to
the workplace. Furthermore, the training would need to
take into account the different academic abilities,
experience and motivation of the members of staff on the
three wards. To fulfill these diverse requirements, two
different methods of training were planned. Initially,
the first six weeks of each teaching phase were spent
training staff using a workshop format. In practice, two
consecutive days each week were chosen to hold a one and
a half hour workshop and staff attended either workshop

71.
as their duty rota permitted. During the second six week
period of each phase, it was planned that individual
sessions lasting approximately one hour would be held
with each member of staff. During these sessions, staff
would have the opportunity of learning in what ways the
subject matter introduced during workshops could have a
practical value in their workplace. It was anticipated
that there would be some degree of turnover on the wards
during the course of the training, It was planned that
new staff to the ward would receive an intensive updating
as much as this was possible. The issue of turnover
became a significant issue over the course of the study
and this will be discussed later. Although it was hoped
that the training format would take into account the
diversity of staff characteristics, an additional device
was used to emphasise this aspect of training. This is
described briefly below.
The use of contract learning
Whereas the training carried out in the study was part of
a larger research project, it must also be seen as a
major initiative in continuing education. Traditionally,
continuing education has been regarded as a luxury rather
than a necessity with the consequence that its delivery
has been fragmented and the individual member of staff
often feels unsupported by the organisation (Keyzer
1980). The aim of any form of education must be to
personalise the instruction to the extent that the

72.
individual characteristics of the learner are taken into
account. This is, perhaps, even more important in
continuing education. One means of supporting and
personalising continuing education is by using individual
learning contracts. A learning contract is a formal
document drawn up between the learner and tutor which
specifies what the person will learn, how this will be
accomplished, within what period of time and what the
criteria for evaluation will be. Learning contracts have
been in use in some form since the beginning of this
century (De Tornay and Thompson 1987). However, it was
Knowles (1975) who first investigated their use in adult
education. This development may be seen as a continuation
of the efforts of education to move away from a didactic
approach to learning to one in which the learner is given
more responsibility for his own education. This
"redistribution of power" (Keyzer 1986) has been
discovered to have positive effects in terms of
motivation to learn, particularly in the area of
continuing nurse education (Martens 1981). Its particular
advantage in terms of the present study is that learning
contracts have been shown to clarify nurse's expectations
by specifying learning outcomes (Reinhart 1977).
The mechanism for establishing and operating a contract
learning system are described in detail in De Tornay and
Thompson (1987). Using these guidelines, the following
describes how contract learning was operationalised in

73.
the present study. It was decided to use two contracts
for each of the three training phases of the project, one
for the workshop stage and one for the individualised
component. Prior to the training commencing on each ward,
all staff were given a half hour presentation on contract
learning. The next step was to meet with each member of
staff on the relevant ward to negotiate a contract for
the six workshops. An immediate problem was presented at
this early stage, namely, that learning contracts are
supposed to specify individualised learning objectives.
Many learning contracts allow objectives to be negotiated
as well as study methods to be customised to suit
individual needs. These details had already been
established for the workshops. However, individual choice
was permitted by using a system of 'weights' which
allowed staff to prioritise outcomes for the evaluation
stage of the contract as well as choosing the actual
means of evaluation. An example of a learning contract
from the workshop stage of phase one is shown in figure
5. with the individualised component indicated in bold
characters,
During the individual instruction stages, it was easier
to use learning contracts to their fullest extent. An
example of such a contract is shown in figure 6. Any
staff joining the ward in the middle of a phase were
excluded from the learning contract system for
organisational reasons.

Nome of Trainee:
\o/unJ:
Learning QJjective
To understand the role of the nurse in relation to people with mental handicaps and to identify skills and other factors necessary to bring about positive practice.
I N 0 I V IOU A L LEA R N I N G
Resources
Grade:
Contract NLIllber:
Strategy / Activity
6 x 1~ hour workshops. Attend workshops. 60
Written handouts. Participate in workshop
Personal communication exercises. ,60
from tutor. Complete written exercises. 60
CONTRAC'l'
Signed:
Signed:
Date:
Means of Evaluation
Self evaluation and discussion with tutor.
Allocation of scores to learning strategies.
.
'111e Trdiner \'fill Contract \;0 Provide Resources and Arrange Learning Activitics as Outlined Above.
Figure 5. Example of learning contract from ~lOrkshop stage of phase one.
(Trainee) .
(Trainer) .
Criteria
Half marks for each learning strategy.
Date of Review
-
Outccxnc
-- ---

:!
NOlTlc of Trainee:
Ward:
Learning Cbjective
1. To identify one 1. area of conflict on the ward and list possible reasons. 2.
2. Construct a plan of action to rectify 3. conflict.
3. Examine and evaluatE current state of communication be tHeen night and day staff.
4. Prepare solutions tc improve communication.
-
I N D I V I D U A L
Grade:
Contract Nurber:
,(
RE:sources
Personal communication 1. with ward staff.
Interview Hith Nursing Officer. 2.
Writ ten tex t.
3.
4.
5.
6.
LEA R N I N G
Strategy / Ac ti vi ty
Construct questionnaire for staff.
Read 'Human Relationship Skills' by Nelson Jones.
Prepare brief notes on book.
Discuss plans Hith colleagues.
IntervieH night and day staff.
Write 2,000 Hord report.
--- -------- - ------ -- ~------------ --
CON T R ACT
Signed: --------------------- (Trainee).
Signed: (Truiner) .
Date:
Means of Evaluation Criteria
Self evaluation and Completion of report in assessment of report by draft form within tutor. 6 weeks at least.
Date of Rcview
Outcane
. ------------------ ---------------- ---
'l1)e Trainer Will Contract to Provide Resources and Arrange Learning Activities as Outlincd /Ibovc.
Figure 6. Example of learning contract from individualised stage of phase one.

74.
The content of training
The content of the workshop sessions was carefully
constructed to be as relevant and as practical as
possible. These sessions are now described along with a
brief rationale for their inclusion in the training. A
list of workshop titles is shown in figure 7.
Although the purpose of the training phases was to pass
on knowledge and skills in goal setting to staff, this
cannot adequately be achieved without a component to
determine the value base for the exercise. Planning care
for clients is essentially an ethical issue as it
involves choices which will affect the well-being of the
client (Marks-Maran 1988), It would be of little use, for
example, teaching goal setting techniques if the staff
possessed a custodial attitude towards people with mental
handicap. For this reason, phase one of the training was
primarily concerned with establishing this value base.
Staff were asked to examine the concept of normalisation
(Wolfensberger 1983) and to list ways in which these
principles could be operationalised within their ward
setting. Exercises outlined in the 'Lifestyles' training
package (Brown 1985) were extensively used during this
session.
As the clients cared for by this staff group had varying
degrees of challenging behaviour, it was essential to
examine the concept of challenging behaviour itself and

PHASE 1 A VALUES BASED APPROACH
Normalisation
The Constructional Approach
The Role of the Nurse
Communication
Working Relationships & Teamwork
Managing Change
PHASE TWO GOAL SETTING
Goal Attainment Scaling - Outline
Assessment
Prioritising Goals
Goal Attainment Scaling - Constructing Scales
Figure 7.
Effective Teaching
Evaluation
PHASE THREE - BEHAVIOURAL TECHNIQUES
How people learn
Observing Behaviour
Gentle Teaching
Positive Techniques
Negative Techniques
Ethics
List of workshop titles carried out in each training phase.

75.
also to outline a general orientation to people labelled
as such. Staff were therefore asked to consider the
"constructional approach" to behaviour modification,
first described by Goldiamond (1974), which now forms the
central theme of intervention in the area of challenging
behaviour (see Blunden and Allen 1987). Essentially, the
constructional approach encourages staff to concentrate
on building behavioural repertoires in clients to replace
inappropriate behaviour rather than aim to eliminate such
actions. This approach, therefore, is not composed of a
single set of techniques but provides a framework in
which staff should work.
To prepare staff for their tasks later in the training,
it was important that they should view their role as one
of an educator or facilitator rather than one which
provides basic or custodial care. A session on this theme
was therefore included.
The remaining three sessions in this phase further
concentrated on introducing concepts that would become
increasingly relevant as the study proceeded. It was
necessary for staff to examine their means of
communication with each other and their clients and to
reflect on their own teamwork.
Phase two of the training began by outlining the
principles of Goal Attainment Scaling and encouraging

76.
staff to compare their current methods of delivering care
with that of a more systematic approach. Workshops
concentrated on the four main elements of a systematic
approach. At the outset of this phase, staff were asked
to select three clients on their ward with whom to carry
out the necessary stages of such an approach. A vital
component of this phase was to introduce staff to a
framework or system within which to practice. Goal
Attainment Scaling itself is a systematic approach to
care but it was felt necessary to operationalise in
greater detail the mechanism by which staff would arrive
at their decisions in a ward situation. This point was
stressed in one of the few papers dealing exclusively
with training in Goal Attainment Scaling (Choate et al
1981). Vital components of this modification included
designating which staff would be responsible for which
stage of the process and also what written forms of
communication would be used. This is an aspect of goal
planning which is often omitted during training and
failure to address the practical implications may be one
of the reasons why a systematic approach is often
rejected by staff as being impractical (Kirwin 1980). To
assist in this process, aspects of the Bereweeke Skill
Teaching System (Mansell et al 1986) were selected. In a
recent review of goal planning systems by Sturmey (1990),
the Bereweeke system ranked high on measures of
readability and interest and was generally considered to
be 'user friendly'. In setting Goal Attainment Scaling
77.
within aspects of this system, a model was presented to
staff which is shown in figure 8. This system also
succeeded in reducing paperwork to a minimum.
Although staff were encouraged to use their goal planning
skills to identify and teach behaviours within the
context of a constructional approach, it was considered
necessary to introduce the staff to procedures that have
been designed specifically for use with their client
group, Consequently, phase three of the training
instructed staff in the practice of behavioural methods.
Staff were introduced to the principles of operant
conditioning (Skinner 1953) and were trained in the use
of procedures outlined principally in Kazdin (1975) and
Yule and Carr (1987). In addition, it was thought
appropriate to briefly cover recent developments in the
area of challenging behaviour. Therefore, a session
examining gentle teaching (McGee et al 1987) was
included. Gentle teaching itself has yet to establish
itself as a technique in its own right (Turnbull 1990)
but the ethical debate it engenders was regarded as an
important addition to the training.
As in phase two, staff were asked to identify three
clients at the beginning of this phase for whom this
aspect of the training was considered applicable. Staff
were also instructed to use the same model of goal

ASSESS CLIENT --,."..,. (Staff Nurse)
REVIEW COMPLETED TEACHING CHARTS
(Staff Nurse)
1 CARRY OUT TEACHING
(All Staff)
j
CHOSE SCALE BREAK GOAL INTO GOAL ---'" GOAL -~., 12 WEEKLY STEPS ( All ( All (Staff Nurse) Staff) Staff)
WRITE TEACHING ------------------~~ CHARTS
(Staff Nurse)
j PRESENT CHARTS
TO STAFF (Staff Nurse)
Fi~ure 8. Model of goal planning system used during the study (adapted from Mansell et al 1986)

78.
setting to carry out their objectives. This included the
scaling of goals.
Details of the individual component of training carried
out in the six weeks following each workshop stage are
too extensive to list here. However, it may be said that
all of the subject areas covered in the workshops were
reinforced during these sessions and staff were shown
practical methods of implementing many of the issues
introduced previously. It should also be pointed out,
here, that all workshop sessions were anonymously
evaluated by participants and this information is given
in appendix 1.
Organisational changes
Throughout the training, although staff were encouraged
to implement the material covered, there was no
compulsion to do so. However, as part of the aims of the
study, organisational changes were introduced during
phase four which, it was hoped, would provide the
necessary incentives for staff to utlise Goal Attainment
Scaling on their wards. As the previous section
concluded, staff behaviour should be monitored regularly
and consequences provided for such behaviour. Previous
research (Reid et al 1989) has suggested a variety of
items or procedures that can be used to positively
consequate staff behaviour. An essential point made by

79.
researchers in this area is that any devices chosen
should,
a) be desirable by staff.
b) be ethically acceptable.
c) be cost-effective
The first issue is basic to any reinforcement procedure.
No-one will be motivated by something they do not regard
as rewarding. This may prove difficult in any large scale
reinforcement procedure in selecting rewards that would
be acceptable to a large number of people at the same
time. The second issue is important in that any staff
should be rewarded for behaviour that is primarily in the
interests of the client. The third issue is a question of
weighing the gains to an organisation of any
reinforcement procedure against the cost involved.
Returning to the first issue, it does not necessarily
follow that expensive rewards will be those that are the
most acceptable to staff.
Phase four was therefore planned with these issues in
mind and the following was deemed to be the most
acceptable method. Firstly, weekly meetings were
established between the researcher, the nursing officer
and staff representatives on each ward. The purpose of
the first meeting was to negotiate a set of objectives
for the forthcoming week for the staff team to achieve.
These objectives related only to material that had been
covered during the training and included tasks related to
80.
the assessment of individuals, plans regarding care and
evidence that care had been carried out and evaluated. An
example of the objectives set for one ward for the twelve
week period of phase four is shown in figure 9.
Subsequent meetings evaluated progress towards these
weekly targets and set new objectives for the coming
week. There were two main reasons for evaluating the ward
objectives in this manner. Firstly, this system would
provide a means of monitoring and evaluating staff
performance. Secondly, it was hoped that the system would
provide an example, or 'model', for the hospital
management in how staff performance could be monitored
and reinforced. The reinforcement schedule was
established as follows. If objectives had been attained,
a monetary donation of one pound was made to ward funds
on behalf of each member of staff working for at least
three shifts on the ward in the previous week. In
addition, it was arranged that letters of recognition be
sent to all staff by an ascending hierarchy of hospital
management for every third target achieved. This
hierarchy consisted of,
the nursing officer for the ward
the senior nursing officer
the director of nursing for the priority care unit
the chief nursing officer
the chairman of the health board

PHASE FOUR OBJECTIVES - WARD A
:Week No. Client No.
Skills Teaching Behavioural
1.
2,
3.
4 •
5 .
6.
7.
8 .
9.
10.
11.
12.
KEY: C
A
P
I
=
= =
=
1 2 3 4 5 1
A C
P A C
I P A
I I P
I I I C
I I I A
I I I A
I I I C P
I I I A C I
I I I P A I
I I I I P I
I I I I I I
Consider client for intervention
Assess client
Plan intervention
Implement plan
Figure 9. Outline of objectives set for ward A
2 3
C
A C
A A
P A
I P
I I
I I

81.
Following completion of phase four, it was also arranged
that staff should be invited to a reception to receive
certificates of completion of training. The above
officers were also invited together with local press
representatives.
Following phase four, the weekly meetings were cancelled
and the ward entered the follow-up period.
Measures
In a large scale study such as this, it was considered
best to include as wide a variety of measures of staff
and client behaviour as possible. Consequently, the
following measures were used.
Challenging behaviour
One of the principle objectives of the study was to
measure the effectiveness of such a staff management
procedure upon the incidence of challenging behaviour.
With a comparatively large number of clients on each
ward, detailed descriptions of incidents would have been
time consuming. It was therefore decided to use a
sampling measure which would obtain data on the number of
incidents only. Initial discussions with staff concluded
that there seemed to be a 'core' of particular types of
behaviour which were seen as problematic. This was
formally tested prior to baseline by arranging for ward
staff to complete Part Two of the Adaptive Behaviour

82.
Scale (Nihira et al 1975) for each resident. Analysis of
the results revealed six areas of behaviour that were the
most frequently performed and these were operationalised
for recording by staff as follows;
1) Assault: hitting, kicking, punching, throwing
objects, biting or any other physical contact
intended to do harm to an individual.
2) Destruction to property: ripping clothing, breaking
windows or other damage to the ward fabric.
Pulling down curtains, pictures or other
ornamental items.
3) Temper tantrums: unacceptable displays of anger
which include a client throwing him/herself to
the ground, shouting and screaming. Any action
included in other categories which is associated
with a strong emotional expression.
4) Inappropriate exposure of body: in the public areas
of the ward in a state of semi or complete
undress.
5) Anti-social conduct: spitting, screaming, shouting
or items included above which may cause
annoyance to others rather than harm.
6) Self-injury: deliberate striking of him/herself by
the client.
Because of the reported high frequency of such behaviours
it was considered more appropriate to take a sample of

83.
such behaviours throughout the day. Initially, staff were
asked to count the occurrence of any of the above between
the hours of 7.00 a.m. and 7.00 p.m. each day. To assist
the staff in collecting such large amounts of data, it
was felt that some sort of portable counting device would
be the most convenient method. A relatively inexpensive
device, a golfer's score counter, was discovered to be an
excellent means of counting incidents. The counter was
six inches long and could be carried in a pocket. The
counter was divided into eighteen sections, the first six
of which were used by staff to match the six categories
of behaviour to be recorded. Staff reported that
counting, or 'clicking off' incidents in no way
interfered with their normal duties. Staff were assigned
groups of clients to observe to avoid duplication of
recording. If their duties meant that some of these
clients were unobservable at certain points during the
day, this was considered acceptable, as the principle aim
of the recording was to establish consistency of
recording rather than absolute accuracy. At the end of
each hour, staff were instructed to transfer their
results to a master sheet in the ward office. At the end
of the week, this sheet was collected by the researcher
and a new one issued. Staff recorded the clients'
behaviour in this manner for an eight week period.
Considering the length of time that staff would need to
collect these data and the relative stability of the
data, it was considered only necessary to obtain this

84.
information once every four weeks from this time onwards.
Reliability for this measure was calculated by percentage
agreement obtained by the researcher observing a group of
clients simultaneously for one per cent of the total
recording time. Results of this are presented in figure
10. In total, 7,840 hours of recording was obtaining
throughout the course of the project.
Client Adaptive Behaviour
It was hypothesised that the staff training and
management system introduced would lead to the
acquisition by clients of further adaptive skills. To
measure changes in this area, the Vineland Adaptive
Behaviour Scale (Sparrow et al 1984) was used. Each
client on the wards was assessed using this instrument by
interviewing a member of staff who knew the client well.
The Vineland interview edition is perhaps not the most
sensitive instrument for clients who have severe mental
handicaps. However, this point was considered a positive
advantage as any significant changes brought about would
be a strong indicator of the success of the study.
Another practical reason for selecting this scale was
that each individual assessment takes approximately
fifteen minutes to complete, thus saving time. All
clients were assessed once every three months during the
study, thus yielding one assessment per phase.

Assault 92 %
Destruction to Property 91 %
Temper Tantrums 89 %
Exposing Body 95 %
Anti-social Conduct 83 %
Self-injury 96 %
Figure 10. Reliability figures for categories included in the challenging behaviour measure.
Functional Active Treatment 70 %
Non-functional Active Treatment 76 %
Engaged Behaviour 86 %
Self-care Activity 80 %
Receiving Care 98 %
Aggressive/disruptive Behaviour 96 %
Off task 91 %
Unobservable 99 %
Prompting/training 37 %
Neutral Interaction 68 %
Instruction/command 66 %
Negative Interaction (none observed)
No Interaction 94 %
Fi~ure 11. Reliability figures for categories included in resident interaction measure

Office Duties 94 %
Domestic Activity 94 %
Supervision 87 %
Personal Care 79 %
Training 100 %
Positive Interaction 88 %
Negative Interaction (none observed)
Appropriate Behaviour 87 %
Inappropriate Behaviour 83 %
Neutral 88 %
Figure 12. Reliability figures for categories included in the Ward Activity measure.

85.
It was considered unecessary for reliability to be
calculated for this measure as it is a well established
instrument widely used in research studies.
Client interaction
A primary concern for anyone involved in the provision of
services for people with mental handicaps is that clients
should be actively engaged in interacting with their
environment. As previously mentioned, much of the time
spent by people with mental handicaps could be spent in
more purposefull activity. It was therefore considered
essential to measure any changes in the therapeutic
quality of interaction between the client and his
surroundings which would include members of staff. A
hierarchy of behaviours was constructed, ranging from
most to least therapeutic, based on a previous study by
Parsons et al (1989) and is operationalised below;
1) Functional Active Treatment: a client being
instructed in a new skill or assisted in
maintaining an existing skill that the client
would previously have had performed for him.
e.g. feeding, dressing.
2) Non-functional Active Treatment: a client being
instructed in a new task which the client
would not need to perform independently. e.g.
reciting a nursery rhyme.
3) Engaged Behaviour: the client is involved in an

86.
activity by himself or with others which is
purposeful e.g. listening to music, actively
listening or gesturing to others.
4) Self-care Activity: a behaviour already acquired
by the client which is essential to his basic
care e.g. feeding, dressing.
5) Receiving Care: passively accepting assistance from
someone in basic care activities e.g. being fed,
dressed, receiving medication.
6) Aggressive or Disruptive Behaviour: any action
causing harm to self or harm and annoyance to
others e.g. hitting, biting.
7) Off Task: a behaviour that has the minimum
amount of interaction with the environment
and appears purposeless e.g. rocking, pacing,
wandering.
S) Unobservable: occasions when the client is not
able to be observed.
At the same time as recording the client's behaviour, it
was considered appropriate to record aspects of the
staffs' interaction, if any, with the client being
observed. Firstly, the number of staff available to
interact with the client was recorded. Availablity to
interact was defined as a member of staff being within
twelve feet of the client and not involved in any
interaction with another person. Secondly, categories of

87.
staff behaviour were defined in a similar descending
order of therapeutic benefit as follows;
1) Prompting/Training: a member of staff seeking to
teach new skills or maintain exisiting ones
to clients.
2) Neutral Interaction: a member of staff engaged in
verbal exchanges with the client of a general
or casual nature.
3) Instruction/Command: ordering a client to carry
out something which cannot be included in the
above two categories.
4) Negative Interaction: using abusive language or
gestures towards a client or making derogatory
comments about him.
5) No Interaction: no verbal exchange at all.
Interactions were recorded in "real time" by using a
Psion II portable computer. Each behaviour category was
allocated a key on the computer. Each time a person's
behaviour changed, the observer pressed the appropriate
key. Inside the computer is a timer which marks the
precise second when behaviours alter. This information is
able to be transferred to a personal computer for
analysis. The recording of information in this way has
considerable advantages over traditional observational
methods (see Repp et al 1989). Not only is the means of
collecting the information made more convenient but the

88.
computer software programmes that can be applied to the
data enable more complex analyses to be carried out.
Ten clients per ward were chosen at random and observed
for fifteen minutes each every three months. Reliability
for this measure was obtained using a percentage
agreement between two observers for the amount of time
spent engaged in each behaviour for a ten per cent
sample. Results of this are given in figure 11. In total,
fifty-five hours of observations were obtained using this
measure.
Ward Activity
As well as concentrating on observing client's behaviour
in real time, it was also considered necessary to obtain
a profile of ward activity throughout the day. A measure
was therefore devised which would primarily examine staff
behaviour but also gather information on client activity
as a comparison. Categories of staff activity chosen for
this measure are described below;
1) Office Duties: a member of staff involved in
administrative or clerical tasks e.g. writing
reports, answering the telephone.
2) Domestic Activity: a member of staff involved in
housekeeping tasks e.g. putting away laundry,
mopping floors.
3) Supervision: a member of staff in the presence

89.
of clients but not interacting verbally with
them or involved in other tasks described
in this schedule.
4) Training Clients: a member of staff involved
in teaching new skills or maintaining existing
skills with clients.
5) Positive Interaction: a member of staff engaged
in verbal exchanges with clients of a general
or casual nature.
6) Negative Interaction: a member of staff using
abusive language to a client.
Clients' activities were operationalised as follows;
1) Appropriate Behaviour: activity which would be
deemed adaptive under the circumstances.
2) Inappropriate Behaviour: activity which would
be deemed maladaptive or is disruptive or
harmful.
3) Neutral: actvity which may be purposeful but
is passive.
To measure this activity, the researcher paid hourly
visits to each ward in turn, commencing at 7.30 a.m. and
ceasing at 4.30 p.m. During these visits, the same route
was taken through the ward. Each client and member of
staff present was observed once for a period of two
seconds and their behaviour coded. For reasons of

90.
preserving the dignity of clients, private areas of the
wards, for example toilets, were not visited unless doors
had been left open, thus making them observable from the
public areas. Reliability for this measure was obtained
by percentage agreement between two observers on a
fifteen per cent sample. Results for this are given in
figure 12. In total, 660 separate observations of ward
activity were obtained.
Staff Attitudes
As previously mentioned, some would consider the
attitudes of staff to play an important role in the
delivery of high quality services. Whereas some evidence
may exist for this hypothesis, it was decided to
investigate whether the values component included in the
training and the subsequent staff management system had
any effect upon aspects of the staff's attitudes. A scale
previously devised and validated by Cullen et al (1983)
was considered particularly useful in this respect. A
factor analysis carried out by the authors discovered two
factors relating to staffs' expectations of the abilities
of people with mental handicaps and feelings towards
their employers. This scale contains forty-eight
statements to which staff are asked to respond according
to the scale shown in figure 13. The scoring system for
this scale was adapted and is also shown below. This
scoring method was adapted to give a greater indication
of positive or negative attitudes. This measure was

administered once in each phase. It was felt more
pertinent to label this measure as a 'Staff Opinion
Survey' rather than an attitude questionnaire.
91.
Strongly
Disagree
1
Disagree Undecided Agree Strongly
Agree
2 3 4 5
-2 -1 o +1 +2
Figure 13. Response categories for Staff Opinion Survey
with alternative scoring system shown beneath
Goal Setting and Goal Attainment Scores
As this study was primarily concerned with introducing an
empirical, goal orientated approach on the three wards,
data were collected on the number and outcome scores of
care objectives set by staff. It was originally conceived
that goal attainment scores could be used as part of the
staff management programme introduced in phase four. This
could have been achieved by making reinforcement for
staff contingent on goal attainment scores as close to
the 'perfect' score of fifty as possible. Two factors
conspired to preclude the use of scores in this way.
Firstly, the goal setting ability of the staff was
initially overestimated by the researcher. Although some
staff had a theoretical knowledge of goal setting
procedures, no ward, in fact, utilised an empirical
approach with the result that no goals existed for any

92.
client on the wards at baseline. In order to calculate a
T score for an individual, multiple goals need to be set.
After discussions with staff, it was considered too great
an objective for them to begin to set more than one goal
for each client at a time. This was unfortunate but
probably resulted in staff gaining greater confidence as
results shown later will point out. Instead of computing
the T score, however, outcome scores for each client
could still be used as a means of feedback for staff
themselves. In this way, it would be useful to discover
if the use of Goal Attainment Scaling would have the
similar effect as in the study by Holroyd and Goldenberg
(1978). These authors found that staff consistently
underestimated the potential of their clients which was
shown by initial scores of +2. It could be that
consistent use of Goal Attainment Scaling over time might
result in the technique being a valuable aid to clinical
decision making by making the objectives set by staff
become more realistic.
The second reason for removing the computation of the T
score concerned the involvement of management in the
fourth phase. It was hoped that the procedures utilised
during the study could be used or modified by the
hospital managers at the end of the research project.
This would have necessitated a clear understanding by the
managers of the content of the training. It quickly
became obvious that managers were as equally unfamiliar

93.
with the material as their staff. To expect managers to
continue using Goal Attainment Scaling and to consequate
staff behaviour, this would have necessitated someone to
perform this procedure. Organisationally speaking, it
proved impossible to fully instruct managers in this
task, although some attempt was made to familiarise
managers more fully with the material staff were being
taught.
Results
The following 1S principally intended as a description of
the main findings of the study. A full discussion of the
results will be given later but some general points may
be made here. Examining the data according to the
multiple baseline design reveal little evidence that the
intervention had similar effects for all wards. This does
not mean that the intervention had no effect. Figure 13a
demonstrates this by showing a very mixed pattern of
results for a sample of residents behaviour. Various
organisational difficulties, to be discussed later, meant
that the intervention was not carried out on each ward in
an identical fashion. Therefore, each ward's data are
presented separately.
1) Incidents of challenging behaviour
Figures 14, 15 and 16 show line graphs for incidents of
challenging behaviour for the three wards. Data are

AVERAGE PER RESIDENT
24
20
16
12
8
4
16
12
8
4
14
12
8
4
EXPOSING BODY
I I I I I
:~:\ :J I I \/,,1 I I 1
I I B II I 1/1 IV FU WARD A
I I- ___ _
I I I I -----,
L_____ I I L _____ , L---l I I
I I I I I I
1 : I I :
I /"'v:~ ~ --~.:~: AARD B
L _____ I I
I -- ----, I
WARD C
o 20 40 60 100 1 0
WEEKS
Figure 13a Line graph showing number of incidents for a sample of resident behaviour using the multiple baseline format.

CHALLENGING BEHAVIOUR: WARD A ~Av~e~r~a=g~e~n~u~m~b~e~r-=p~e~r~r~e~s~id~e~n~t~ __ -, 16,·
12
10
8
6
-4 .
o~--~----~--~----~--~--~ o 20 40 60 80 100 120
12~------------------------__,
DESTRUCTION TO PROPERTY
10
8
:7I/\~ .. -,'\ J~
14r-----------------------------, SELF-INJURY
12
10
8
6
2
o~--~----~--~----~--~--~ 100 o ..... CLlMIt
40 60 '"" .... ! ,.Hue.
80 120
Average number per resident 30~~~~==~~~~~~~~--~
ASSAULT
26
20
16
10
6
0 0 20 40 60 80 100 120
26 r----------------------------, EXPOSING BODY
20
16
10
6
o~--~----~--~---~-~--~ o 20 40 60 80 100 120
20r---------------------------,
TANTRUMS
16
10
6
o~--~----~--~----~--~--~ o 20 40 60 80 100 120
..... c:LlMIt '"" .... c 1 I"H ..... J "HMe • 'H .... e <I rOLLO._UP
Weeks
Figure 14: Line graphs showing incidence of challenging behaviour for Ward A.

CHALLENGING BEHAVIOUR: WARD B Avera e number per resident 6~~~~~~~~~~~~----~ ~Av~e~r~a~g=e~n~u=m~b~e~r~p=e~r~r=e=s~id~e~n~t ____ ~ 10,--
ANTI-SOCIAL CONDUCT ASSAULT
8
o~--~----~----~----~----~ o~--~----~----~----~--~ o 20 40 60 80 100 o 20 40 60 80 100
2,-------------------------~ 6,---------------------------~ DESTRUCTION TO PROPERTY EXPOSING BOD
1.6
3
2
0.6
o~--~----~----~----~--~ o 20 40 60 80 100 20 40 60 80 100
3~------------------------~ 10,-----------------------------,
SELF-INJURY TANTRUMS
2.6 8
2
1.6
oL---~----~----~----~--~ 100 o 20 40 60 80 100
"MoUe I "" .... e:r rOLl.ow·u"
Weeks
Figure 15 Line graphs showing incidence of challenging behaviour for Ward B.

CHALLENGING BEHAVIOUR: WARD C Average number per resident
14 ANTI SOCIAL CONDUCT Average number per resident 15~~~~~~~~~~~~~~-----.
ASSAULT 12 14
8
6 .
oL---~--~~~--~--~--~--~--~ o~--~--~--~--~---L--~--~--~
o 10 20 30 40 50 60 70 80 o 10 20 30 40 50 60 70 80
10,--------------------------------,
2.5 8
2
6
1.6
0.5
o~--~--~~~--~--~--~--~--~ O~--~ __ ~ __ J_ __ ~ __ ~ __ ~ __ _J __ ~
o 10 20 30 40 60 50 70 80 o 10 20 30 40 50 60 70 80
7,-------------------------------~
SELF-INJURY TANTRUMS 6
5
3
.... ~ ..... .
~
2 ...•. ~.. • .. ···············1
oL-__ ~ __ ~ __ -L __ ~ __ -J ____ L-__ L-~
20 30 40 60 60 70 80 o 10 20 30 40 60 60 70 80 I'M .... I:. • .wI:LlMC 'H .... 1:1 IOHA'II.:I; .. H .... e:l;
Weeks
Figure 16 Line graphs showing incidence of challenging behaviour for Ward C.

94.
presented here as the average number of incidents per
resident each week. Results on this measure show no
consistent changes across wards although interesting
trends can be detected on individual wards. All
categories of behaviour on ward A except anti-social
conduct show a trend towards reduced incidents. In
particular, both the trend and the mean number of
incidents has been reversed from baseline for exposing
body, self-injury and temper tantrums. Although the trend
and the mean for assault on this ward has been reversed
in phase one from baseline, the trend in phase four and
subsequent follow-up shows a slight movement towards an
increase in incidence. Results for anti-social conduct
show an increased trend until phase three when this is
reversed. It could be possible that this category had
been used by some staff to score minor incidents of the
other five categories of behaviour. However, the large
decrease in incidents from the other categories would not
explain the relatively small upward trend for this type
of behaviour.
Similar effects may not be noted on other wards for this
measure. Curiously, the results for assault, exposing
body and temper tantrums on ward B shows an increased
trend following baseline. Self-injury shows a slight
reduction in the mean for phases one to four but the
greatest number of incidents occurs in follow-up. The
increased trend for destruction to property in baseline

95.
and phase one is reversed and the mean reduced for phases
two to four but there is a sharp increase in incidents in
follow-up. Anti-social conduct shows a slight downward
trend throughout the study.
Results for ward C on this measure show yet a different
pattern again. In all categories there is a drop in the
mean from baseline to phase one but the mean increases in
phases two and three and there is a marked upward trend
in these phases except for temper tantrums. This category
shows a reduction in the mean but this is still above
baseline levels.
2) Client adaptive behaviour
The Vineland Adaptive Behaviour Scale contains four
domains, or categories, of behaviour. Scores for all
residents were totalled and divided by the number of
residents per ward to yield a mean figure per ward for
each administration of the scale. Results for the
communication, socialisation and maladaptive behaviour
domains show no change. However, scores for the daily
living skills domain indicate a trend towards increased
adaptive behaviour and this is shown in figure 17.
Statistical analysis of these data was carried out using
the Friedman test. The Friedman's test is a non
parametric test which assesses the effects on subjects'
scores of different levels of treatment. A matrix was
constructed consisting of raw scores on the Vineland for

70 -{ I Ward AI
60
50
40
30
20
10
0 BASELINE PHASE 1 PHASE 2 PHASE 3 PHASE ~ FOLLOW-UP FOLLOW-UP
70 Ward 60
50
40
30
20
10 MISSING DATA
o 1/ / (
BASELINE BASELINE BASELINE PHASE 1 PHASE 2 PHASE 3
70 Ward B
60
50
40
30
20
10
0 BASELINE BASELINE PHASE 1 PHASE 2 PHASE 3 PHASE 4 FOLLOW-UP
VINELAND DAILY LIVING SKILLS DOMAIN
Figure 17:
Mean score per resident
Bar charts showing results for the Daily Living Skills domain of the Vineland on all Wards

96.
each of the three wards. A mean score was calculated for
baseline scores on wards A and B. Changes in scores were
discovered to be significant (p = 0.05). Although the
Friedman test establishes whether or not significant
changes have occurred, it cannot indicate whether the
change was in the desired direction. The Page's L trend
test is a test that is frequently used in association
with the Friedman to assess this factor. Once again, the
data were entered into a matrix in an identical fashion
as above and the trend from baseline indicated a
significant movement towards increased functional ability
(p = 0.001).
3) Client interaction
All data for this measure are presented as a percentage
of the total time observed for each ward at each data
collection point.
Firstly, the availability of staff to interact with
residents shows positive trends across all wards, in that
increasing numbers of staff were observed to be in the
proximity of residents and not engaged in non-resident
centred activities. This can be seen by examining the bar
chart shown in figure 18. Each ward shows a significant
reduction in the amount of time no staff were available
to interact during training phases from the baseline
phases.

% of time 100
Ward A 80
60
40
t ~ J l l ~ rk
20
o BASELINE PHASE 1 PHASE 2 PHASE 3 PHASE 4 FOL'W UPFOLLOW UP .0 ~1 02 ~3 1illilll4 05
100" ~~~~~--~~--~~--~--~--~~--~~~~--,
Ward C 80
60
40
20
01-..;.1 -...-:11 w:<J6: ---...-Jt-"-'S ~
BASELINE BASELINE BASELINE PHASE 1 PHASE 2 PHASE 3
• 0 ~1 02 ~3 1illilll4 05
% of time
100
80
60
40
20
o
Percent
Ward B
BASELINE BASELINE PHASE 1 PHASE 2 PHASE 3 PHASE 4
_ 0 staff availa~ 1 staff availabD 2 staff availa~ 3 staff available
!TIilll 4 staff availabD 5 staff availatllillll 6 staff available
STAFF WITHIN PROXIMITY OF RESIDENT
AVAILABLE TO INTERACT (12 ft radius)
Figure 18: Bar charts showing staff availability to interact on all Wards .

97.
Disappointingly, results for the type of interaction do
not replicate the positive changes in staff availability,
The bar chart shown in figure 19. indicates that, even
when more staff were available to engage residents in
more purposeful activity, interaction did not alter
appreciably. For well over 80% of the time on all three
wards, residents are largely ignored. When interaction
did occur, minor positive trends may be discerned and
these can be seen in the bar chart presented in figure
20. Instruction-giving declined from baseline levels on
all three wards. This is encouraging since this type of
interaction has previously been identified as a
contributing factor in the incidence of certain types of
challenging behaviour (Iwata et al 1982). On wards A and
B giving out instructions to residents was the
predominant mode of interaction: at the end of phase four
of the study it had become the least used category on all
wards. The category of neutral interaction showed an
increase from baseline on wards A and B which may be
indicative of a more 'open' style of communication
amongst staff and residents. On ward C the trend is
towards reduced amounts of interaction.
Disappointing results were obtained for the higher levels
of interaction. Staff were observed prompting residents
for only 2% of the time on ward A in baseline. Further
incidents of prompting were observed for 2% of the time
in phase two and 11% in phase four. No prompting was

of time WARD A
o BASELINE PHASE 1 PHASE 2 PHASE 3 PHASE 4 FOL'W-UPFOLLOW-UP
WARD C 100" ----------------------------------------------
80
60
40
20
o BASELINE BASELINE BASELINE PHASE 1 PHASE 2 PHASE 3
% of time WARD B
20
o BASELINE BASELINE PHASE 1 PHASE 2 PHASE 3 PHASE 4 FOLLOW-UP
NO STAFF BEHAVIOUR
Figure 19: Bar charts showing incidence of no interaction for all Wards.

% of time 25" ---------------------------------------------
Ward A 20
15
10
BASELINE PHASE 1 PHASE 2 PHASE 3 PHASE 4 FOL'W-UPFOLLOW UP
~ Neutral 0 Instruction giving ~ Prompting
25" ~~~~~~~~~~~~--~~~--~~~--~~~-,
Ward C 20
15
10
5
o! t;:::.-;:::::=: t???1 f:C::%<1 tc;::..//C------J t?""~~
BASELINE BASELINE BASELINE PHASE 1 PHASE 2 PHASE 3
~ Neutral 0 Instruction giving
% of time 25.-, ---
Ward B 20
15
10
5
o I f.:"':.::/j I I V/l ! I v:<::l ! I t%<1 I I ~ t?'"~ V:?f""D
BASELINE BASELINE PHASE 1 PHASE 2 PHASE 3 PHASE 4 FOLLOW-UP
~ Neutral 0 Instruction giving ~ Prompting
STAFF BEHAVIOUR
Figure 20: Bar charts showing amount of interaction displayed for all Wards.

98.
observed on ward B except for less than 1% of the time in
phase three and no prompting occurred on ward C
throughout the study.
Despite the erratic picture and apparently minor changes
in staff behaviour, resident behaviour shows a greater
magnitude of change in a positive direction. Figures 21a
and 21b show bar charts for resident behaviour. The data
from all wards show a reduction in off task behaviour
throughout the study with an increase in follow-up on
wards A and B. Whilst residents appear to be spending
less time with little or nothing to do, engaged behaviour
shows a positive trend following baseline. On
ward B this trend is maintained in follow-up but is
reversed on ward A. Similarly, self-care behaviour shows
a trend towards residents performing more tasks for
themselves on wards A and B but a more erratic picture is
shown in this respect on ward C. Once again, this trend
is reversed in follow-up. There is very little evidence
that residents spent increasing time engaged in the
highest level of interaction. Functional active treatment
appears at its highest level on ward A in phase four but
the actual figure for this is only 3.5% of the total
time. This behaviour is at negligible levels on the other
two wards. Levels of aggressive and disruptive behaviour
are also at very low levels, thus making trends difficult
to discern.

% of time 100,
Ward A
80
60
40
20
o BASELINE PHASE 1 PHASE 2 PHASE 3 PHASE 4 FOL'W-UPFOLLOW-UP
100" ------------------------------------------------, Ward C
60
40
20
o BASELINE BASELINE BASELINE PHASE 1 PHASE 2 PHASE 3
% of time 100" --------------------------------------------,
Ward B
60
40
20
o BASELINE BASELINE PHASE 1 PHASE 2 PHASE 3 PHASE 4 FOLLOW-UP
RESIDENT BEHAVIOUR - OFF TASK
Figure 21 (a) : Bar charts showing amount of resident 'off task' behaviour for all Wards on the interaction measure

% of time 40
1
Ward A 30
20
10 r1 I I~ ~ I~ o It;;::t--t.."-"tl I ~ I ~ m V1 !}''111 t=::l tNl t, ..... J V1 ~1D. V;) ~II I
BASELINE PHASE 1 PHASE 2 PHASE 3 PHASE 4 FOL'W UP FOLLOW UP
~ Engaged
o Unobserved
o Rec'ng care ~ Self-care IITilll Aggressive!
I§l§!l§l Functional active treatment
Non-functional active treatment
Disruptive
40rl ------------------------------------------------------,
30
20
10
Ward C
BASELINE BASELINE BASELINE PHASE 1 PHASE 2 PHASE 3
~ Engaged
Iillill Aggressive! Disruptive
D Receiving care
D Unobserved
I§l§!l§l Self-care
% of time 40
Ward B 30
20
10
o I t:d ~ !! !., 10;, I ~'I V;l ~ !! f2 &--"'-= k1 &i ~~ 0 I
BASELINE BASELINE PHASE 1 PHASE 2 PHASE 3 PHASE 4 FOLLOW-UP
~ Engaged
Iillill Aggressive! Disruptive
D Rec'ng care
D Unobserved
I§l§!l§l Self-care
[illj Functional active treatment
RESIDENT BEHAVIOUR
Figure 21(b): Bar charts showing amount of other resident behaviour for all Wards on the interaction measure

99.
4) Ward activity
Data for this measure are shown in figures 22 to 27.
Figures were calculated as being a percentage of the
total observed time at each data collection point. As far
as staff behaviour is concerned, once more there is a
mixed pattern of results. A consistent trend may be seen
for all wards for the category of supervision, showing
that increasing amounts of time were being spent by staff
in the proximity of residents. Domestic activity on all
wards shows a downward trend which rises in follow-up for
wards A and B. Time spent in office duties shows a
somewhat erratic trend for all wards. A rise in this
category can be seen on ward A in phases one and two with
phase four and follow-up showing a reduction in time
spent in this behaviour from baseline. Ward B shows a
similar rise during phases one and two, returning to mean
baseline levels throughout the remainder of the study.
Ward C shows an increase in time spent in office duties
during phase one followed by a drop below the mean
baseline scores in phases two and three. The category of
personal care shows no change on all wards except an
increase in follow-up on ward A. Similarly, there are no
changes in the categories of positive interaction or
training.
For the resident categories, few distinct changes can be
detected. There is a slight increase in the mean for
appropriate behaviour during phases two, three and four

STAFF ACTIVITY: WARD A % of observations % of observations
100 100 DOMESTIC OFFICE DUTIES
80 80
60 60
40 40 Vv~"--- V I~ ~V I: I'vJ ---/
20 / 20
0 0 0 6 10 15 20 25 0 5 10 15 20 26
100 100 PERSONAL CARE POSITIVE INTERACTION
80 80
60 60
40 40
/J0A 20
1\ J 20
V-J ~"'-- -----~ 0 0 /'
0 6 10 16 20 25 0 5 10 16 20 26
100,--------------------------------------- 100 SUPERVISIOI\ TRAINING
80 80
60 60
40
20
oL-______ L-____ ~L-____ ~ ______ ~ ______ ~ 0 ./ '-
o 6 10 15 20 25 0 6 10 16 26 BASELINE PHASE 1 PHASE 2 PHASE 3 PHASE. FOLLOW-UP M 0 n t nsLlNEPHASE 1 PHASE 2 PHASE 3 PHASE •
20 FOLLOW-UP
Figure 22: Line graphs for staff behaviour on Ward activity measure for Ward A.

STAFF ACTIVITY: WARD B % of observations % of observations
100 100
DOMESTIC OFFICE DUTIES
80 80
60 60
40 40
~f\\\// 20 ~ 0~ 20
~/V 0 0
0 6 10 16 20 26 0 6 10 16 20 26
100 100
PERSONAL CARE POSITIVE INTERACTION
80 80
60 60
40 40
20 \v-~j~/\ 20
~/~/\ ~ 0 0 ./
0 6 10 16 20 25 0 5 10 15 20 25
100 100
SUPERVISION TRAINING
80 80
60
~-/~ 60
40 vfv 40
20 20
0 0 ~ -"- ~ I
0 6 10 16 20 26 0 6 10 16 20 25
8ASELINE PHASE 1 PHASE 2 PHASE 3 PHASE 4 FOLLOW-UP BASELINE PHASE 1
Months PHASE 2 PHASE 3 PHASE 4 FOLLOW-UP
Figure 23: Line graphs for staff behaviour on Ward activity measure for Ward B.

STAFF ACTIVITY: WARD C % of observations % of observations
100 100
DOMESTIC OFFICE DUTIES
80 80
60 60
40 40
vv~\ llA~j~ ~ 20 20 "-
0 0 0 5 10 15 20 25 0 5 10 15 20 25
100 100
PERSONAL CARE POSITIVE INTERACTION
80 80
60 60
40 40
20 \AA,,;J 20
/\/'y" /' i'- 1\ ~ 0 0
0 5 10 15 20 25 0 5 10 15 20 25
100 100
SUPERVISION TRAINING
80 80
60 60
40 rFJ~t 40
20 20
0 0 ~~ /
0 5 10 15 20 25 0 5 10 15 20 25
BASELINE PHASE 1 PHASE 2 PHASE 3 BASELINE PHASE 1 PHASE 2 PHASE 3
Months
Figure 24: Line graphs for staff behaviour on Ward activity measure for Ward C.

% of observations 100" -------------------------------------------,
NEUTRAL
80
60 r-(v /"V-~ 40
~ASELINE PHASE 1 PHASE 2 PHASE 3 PHASE 4 FOLLOW-UP
20
o ,'---__________ L-__________ -'-__________ -'-__________ -'--__________ --'
o 5 10 15 20 25
100 1, ------------------------------------------~ APPROPRIATE
80
60
BASELINE PHASE 1 PHASE 2 PHASE 3 PHASE 4 FOLLOW-UP 40
I~y(~\j\~~ I o
20
o 5 10 15 20 25
Mon ths
Months
% of observations 100,
INAPPROPRIATE
80
60
40
\_ ~ -\ V "~ r"--j 20
BASELINE PHASE 1 PHASE 2 PHASE 3 PHASE 4 FOLLOW-UP OL' ____________ L-__________ -L ____________ L-__________ -L __________ ~
o 5 10 15 20 25
RESIDENT ACTIVITY: WARD A
Figure 25: Line graphs for resident behaviour on Ward activity measure for Ward A.
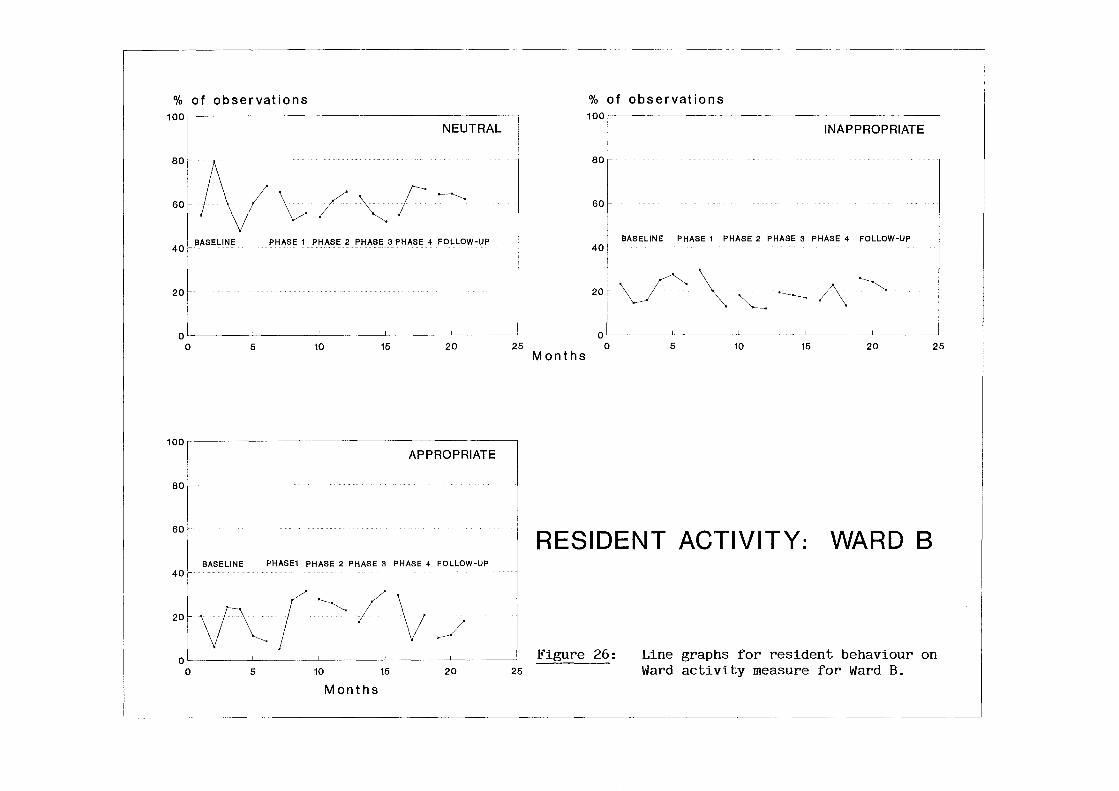
% of observations 100" --------
NEUTRAL
80
tv~/~F'-~ 60
40' BASELINE PHASE 1 PHASE 2 PHASE 3 PHASE 4 FOLLOW-UP
20
OLI ________ -L ________ ~ __________ L_ ________ ~ ________ ~
o 5 10 15 20 25
100 1,----------------------APPROPRIATE
80
60
BASELINE PHASE1 PHASE 2 PHASE 3 PHASE 4 FOLLOW-UP 40
20 V~(·~/\; J OLI ______ ~ _________ L_ ______ ~ ________ _L ________ ~
o 5 10 15 20 25
Months
% of observations 100,r----------------------~
INAPPROPRIATE
80
60
BASELINE PHASE 1 PHASE 2 PHASE 3 PHASE 4 FOLLOW-UP 40
20~ ~ \ ~ ~ /\. ~ 01L---------~----------~----------~----------L-----____ ~ o 5 10 15 20 25
Months
RESIDENT ACTIVITY: WARD B
Figure 26: Line graphs for resident behaviour on Ward activity measure for Ward B.

% of observat ions 100
1 NEUTRAL
80 1
eocf\{\; ( ~ \ 401 20f-
0' 0 5 10 15 20 25
100'r----------------------------------------------------~
APPROPRIATE
80
60
BASELINE PHASE 1 PHASE 2 PHASE 3 40
20 VvF~Jv OL' __________ -L __________ -L __________ ~ __________ ~ __________ ~
o 5 10
Months
15 20 25
% of observations 100
I INAPPROPRIATE
80
60
40 r BASELINE PHASE 1 PHASE 2 PHASE 3
20f vY \ __ A f' 0 1
0 5 10 15 20 25
Months
RESIDENT ACTIVITY: WARD C
Figure 27: Line graphs showing resident behaviour on Ward activity measure for Ward C.

100.
above baseline scores on ward A. Similarly, there is an
increase in phases one, two and three for this category
on ward B. Again, on ward C, increases in the mean for
appropriate behaviour can be seen in phases one and two.
5) Staff attitudes
The intention in using this measure was to detect any
changes in the attitude of staff over the course of the
study. Because of extensive changes in personnel on the
wards, which will be discussed later, and the mixed
compliance rate in completing the questionnaire amongst
staff, it was only possible to identify a full set of
questionnaires for three members of staff. For this
reason, no data are presented here for this measure.
6) Goals set and Goal Attainment Scores
Figures 28, 29 and 30 show the data for goals set over
the course of the study. The majority of goals were set
during phase four of the project in line with the
reinforcement schedule described earlier and shown in
figure 9. Ward A completed goal plans for three
residents, as recommended to them during training. Wards
Band C set objectives for only two residents each but
these were abandoned by staff. In phase three, wards A
and C set goals for two residents, with the latter once
more abandoning their plans. Ward B failed to set any
goals during this phase. Eight goals were set for
residents over the course of phase four, all of which

WARD A
GOAL NO. PHASE COMMENCED OUTCOME
1- II -1
2. II +1
3. II +2
4 . III 0
5 . III +1
6 . IV -1
7. IV -1
8 . IV 0
9. IV 0
10. IV Abandoned
11- IV Abandoned
12. IV +1
13. IV Abandoned
Figure 28. Goal Attainment Data for Ward A,

WARD B
GOAL NO. PHASE COMMENCED OUTCOME
1. II Abandoned
2. II Abandoned
3. IV 0
4 . IV 0
5. IV -1
6. IV +1
'7. IV -1
8. IV 0
9. IV 0
10. IV 0
Fi~ure 29. Goal Attainment Data for Ward B.
WARD C
GOAL NO. PHASE COMMENCED OUTCOME
1. II Abandoned
2 . II Abandoned
3. III Abandoned
4. III Abandoned
Figure 30. Goal Attainment Data for Ward C.

101.
were completed by ward B, with ward A abandoning three
out of the last four set by staff.
Goal attainment scores shows no discernable trend towards
more accurate prediction of outcome. It is
perhaps worth noting, however, that only one goal may
have indicated an underestimation of both staff and
resident abilities. Three out of ten of the goals on ward
A achieved a perfect goal attainment score. Five out of
eight of the goals set by staff on ward B attained this
score.
Discussion
Any research project of this scale and carried out in an
applied setting is subject to difficulties. Most of the
local problems were resolved satisfactorily but the wider
context in which this study took place resulted in
problems which were beyond the control of the researcher.
Theses problems are dealt with as fairly as possible
below.
a) Continuity of staffing
It was promised that, as far as possible, staffing levels
on the wards would be maintained in as consistent a
manner as possible in order that practice and training
could be assured. It was anticipated, however, that some
turnover of staff would occur naturally over the course
of the study and that new staff could be updated in time
as much as possible. In reality, the scale of the

102.
turnover on the three wards was too large to manage
successfully and some effect on practice was inevitable,
although difficult to quantify. Appendix 2. lists the
changes on the three wards during the course of the
study. Greater discussion of these factors will follow.
However, to summarise, the average turnover rate across
the three wards was 56%. The twenty-six new starters on
the wards meant that the quality of instruction given to
these staff may have been inferior to that received by
the remainder. Full credit must be given to the more
experienced staff on the wards who assisted in the
induction of new staff.
b) Training on ward C
As it can be seen from table 2. shown earlier, Ward Chad
only nine permanent staff allocated to the ward.
Additional staff to this ward were supplied, as required,
from a 'pool' and could not be included in the training
because of their temporary status. Precise reasons for
the lack of staff on this ward were not forthcoming from
the hospital managers. The low number of staff resulted
in difficulties when organising workshops. In phase one
of the training, half of the workshops had to be
cancelled due to a lack of staff available to run the
ward. Individual sessions were arranged to cover material
although their presentation was more didactic than
participatory, The hospital managers eventually agreed to
two full day workshops to be held in phases two and three

103.
whilst alternative staffing arrangements were made for
the ward. The entire content of the twelve remaining
workshops was condensed and delivered during these two
days. Inevitably, the input to the staff was of an
Inferior quality despite the good intentions of
management.
c) Data collection on Ward C
During the early part of the baseline phase, some of the
staff on ward C expressed concern at being asked to
collect data. They reported that they did not consider it
in their job description to carry out such duties. This
matter appeared to be part of a dispute arising from the
recent clinical regrading exercise that had taken place
throughout nursing. Negotiations between staff and
managers quickly resolved this issue but meant that, for
the first eight weeks, data on challenging behaviour are
missing and the first collection of data for the Vineland
is absent.
d) Ward closures
As clients were being discharged into the community, the
inevitable issue of rationalising resources was addressed
by the Health Board and hospital management team. Several
options had been considered but the one chosen required
ward C to be closed at the end of phase three of the
training. This meant that some of this ward's staff were
redeployed to the other wards involved in the study, as

104.
well as some of their residents. This rationalisation
also meant that ward A was physically relocated to
another part of the hospital.
The mention of these difficulties should not detract from
the endeavour and goodwill which was present throughout
the study. However, account must be taken of the problems
when discussing the results.
General discussion
This study has centred around the introduction of a more
empirical approach to care to a group of staff caring for
people with severe mental handicaps and challenging
behaviour. More specifically, it has sought to introduce
staff to a type of goal setting called Goal Attainment
Scaling which potentially provides a means whereby staff
performance may be evaluated and compared with their own
previous performance or that of other groups of staff,
irrespective of the client group with whom they are
working. Essentially, the subjects of this research were
the staff. No amount of intervention with staff is
worthwhile or successful unless any change in their
behaviour impacts upon the lives of residents in a
significant way. This discussion of results must
therefore attempt to find associations between any
changes that have taken place in both groups.

105.
In terms of the residents, improvements were investigated
in their quality of life. Although strict definitions of
this concept are elusive, it might be reasonable to
assume that if residents were more actively engaged in
their environment, showed less disruptive or dangerous
behaviour and were caring more for themselves, their
quality of life had been enhanced. There were certainly
significant changes in the daily living skills domain of
the Vineland Adaptive Behaviour Scale. This domain
includes many of the aspects of behaviour that were
chosen by staff to teach in their written goal plans, for
example washing, feeding, dressing and so on. There is
additional evidence of more self-care behaviour on direct
observation measures on two of the wards and the category
of engaged behaviour suggests that residents were
spending more time in purposeful behaviours. The category
of appropriate resident behaviour on the Ward Activity
Checklist would further suggest that residents were
behaving more purposefully. However, the rather modest
changes in this respect did not prove statistically
significant. Amongst this evidence, it might have been
expected that the personal care category of staff
behaviour would have been reduced. Observation did not
confirm this. It would not be unusual, however, to see
staff still attending to some of the residents' needs.
A reduction in the amount of challenging behaviour
displayed would further suggest an improved quality of

106.
life. This would not only apply to the individual who is
displaying less challenging behaviour but to others as
well who would consequently enjoy a more satisfying
environment. For ward A, such changes were undoubtedly
brought about but for the other wards the picture is more
complex. Although the intervention should have operated
in a similar fashion on all wards, it may be worth
examining aspects of the characteristics of each ward to
detect any fundamental differences prior to the study
commencing. Ward A, for example, was the only female ward
and the actual number of incidents of challenging
behaviour was considerably higher than the other two
wards. This may have meant that the relatively smaller
number of incidents on wards Band C made these areas
more susceptible to changes in the behaviour of one or
two individuals. The fact that ward A was comprised of
female residents is unlikely to have influenced the
results given previous research showing no significant
involvement of gender in the incidence of challenging
behaviour (Leudar et al 1984).
A factor which may have brought about the differences in
the direction of change is the changing perceptions of
staff. Challenging behaviour can very much be a
subjective matter. Some staff may have become more
tolerant of certain behaviours and scored them less
often: on the other hand, some staff may have become more
sensitive to certain behaviours and scored them more

107.
often. Although there may have been instances where this
happened, the high reliability figure for this measure
tends to contradict this view.
A further factor to take into account is the nature of
the recording instrument. Only the frequency of
challenging behaviour was measured. It was impossible to
examine in more detail any changes in intensity or
duration. Unfortunately, assessment in this area has
traditionally been problematic given the complex nature
of the phenomenon being measured (Leudar and Fraser
1987).
Two positive aspects of change on this measure need to be
emphasised. Firstly, the relative intractibility of
behaviour such as anti-social conduct and assault, even
on ward A, tends to confirm previous research suggesting
that these behaviours are usually the most persistent and
stable (Leudar et al 1984). Furthermore, the mixed
picture of increases and decreases, at least, confirms
that the intervention had some effect.
If such changes have occurred in residents' behaviour, to
what extent may this be attributed to changes in staff
behaviour? Evidence from other studies suggests that, as
clients become more engaged in their environment, this is
usually attributable to more structured interaction
between clients and staff rather than increases in

108.
general conversation or passing remarks (Mansell and
Beasley 1990). This had been anticipated in constructing
the categories of staff behaviour for the data collected
by the Psion portable computer. The setting condition for
any type of interaction is the availability of staff to
interact. Throughout the course of the study the amount
of time that no staff were available showed a downward
trend, thus providing the opportunity for interaction to
take place. Even though more staff time became available,
however, the incidence of 'no interaction' likewise
increased. This is a curious phenomenon that has been
reported in several other studies (Rile and Walbran
1991). As staff availability increases, the pressure to
interact with and engage clients reduces. The ultimate
result may be one in which staff spend greater amounts of
time interacting between themselves rather than the
people in their care.
This hypothesis is better illustrated by more careful
analysis of the data. On wards Band C there is a
considerable increase in staff availability as the study
progressed. Most notable increases are in phase two to
follow-up on ward B and from phase one to three on ward
C. This coincides almost exactly with the highest
incidence of no interaction on these wards. The picture
on ward A is different in that larger numbers of staff
available does not occur until follow-up. This coincides
with the highest amount of time staff refrain from

109.
interaction. To test the possible relationship between no
staff availabile to interact and no staff interaction, a
Pearson correlation coefficient was calculated for the
three wards. The relationship on ward A was discovered to
be non-significant. For ward B an 'r' value of -0.720 (Df
= 6) was obtained, thus giving a significant negative
correlation (p = 0.05). For Ward C an 'r' value of -0.81
(Df = 5) was obtained, giving a significant negative
correlation (p = 0.02). This demonstrates that as more
staff become available to interact on Wards Band C, the
amount of interaction diminishes. It is also interesting
to note that the quality of interaction on ward A
improved up until the follow-up stages. Phase four
contained the greatest amount of neutral interaction and
prompting amongst staff, the lowest amount of off task,
highest amount of engaged behaviour and second highest
amount of self-care behaviour amongst residents.
A conclusion that could be drawn from this evidence is
that the training had a damaging effect upon the quality
of interaction. In other words, staff might have been
encouraged to spend more time with residents, but did not
have the means of turning this time to their advantage.
To consider this issue, the changes in personnel on the
wards needs to be examined more closely. Appendix 3.
lists the changes in numbers of staff during the study.
Some relationship appears to exist between availability
to interact and ward numbers, namely that ward A

110.
consistently lost staff, ward B initially lost, then
gained staff, as did ward C. To test any association
between these factors, a Pearson correlation coefficient
was calculated. Only ward B was discovered to demonstrate
a statistically significant association (p < 5%). It is
reassuring to note that signficiant relationships did not
exist on two of the wards. On the other hand, in order to
fully explain the differences in changes across the three
wards, the following interpretation may be the most
plausible.
As staff numbers diminished on ward A, the staff managed
to reorganise themselves to comply with the objectives of
the study, namely to improve interaction and engagement.
They may have been assisted in this by the relative
stability of the numbers of unqualified staff. Such staff
are employed to perform the larger part of direct care
duties. Ward B suffered changes in this respect in two
out of the three training phases. Ward C lost only one
unqualified member of staff but received a more inferior
type of training. This is a complex argument but
essentially proposes that ward A had two advantages:
their stability of unqualified staff and the quality of
their training. They were therefore able to maintain
improvements in the face of diminishing numbers of staff.
Ward C had greater stability but an inferior training
which made it impossible for them to make proper use of
this. Ward B received a higher quality of training but

111.
the instability in staff numbers and increasing amount of
staff meant that additional staff were not able to
interact at improved levels with their residents. This
may explain the somewhat diverse pattern of changes that
occurred in resident and staff behaviour across the
course of the study.
Amidst such significant organisational changes, it is
difficult to evaluate the other aims of the study,
namely, to what extent is Goal Attainment Scaling a
useful means of feedback and what is its potential as a
clinical evaluation tool ? The change in emphasis during
the course of this study brought about by discussions
with staff and managers meant that goal attainment scores
could no longer be used as a means of consequating staff
behaviour. Nevertheless, staff reported that the scaling
of goals made greater methodological sense in terms of
their client group. After initial concerns about their
goal setting ability, staff quickly gained confidence and
were reasonably accurate in their ability to predict
outcome. Anecdotedly, staff reported that they felt
reassured by this system and regarded it as a more
realistic way of reflecting their efforts not simply to
add to residents' skills but to prevent deterioration. In
constructing a similar study, it would be worthwhile to
examine this feeling more empirically.

112.
The feedback given to staff during phase four, in
addition to that gained through the outcome scores
appears to have motivated staff on ward B to continue
their efforts into the follow-up phase. It might be
supposed that the same would have occurred on ward A, as
these staff were consistently attaining their targets set
in phase four. However, the physical relocation of the
ward and the addition of four residents to their numbers
during follow-up may have resulted in three out of four
of their care plans being abandoned. Once more,
organisational factors have obscured a proper anlysis of
the data, The greater involvement of managers in the
training might have created the climate whereby some of
the benefits of the study could have continued after the
intervention ceased. Any subsequent project of this
nature should incorporate a more substantial role for
managers. Ward C never had the opportunity of gaining any
type of feedback from their goal setting efforts. Again
it is a matter for conjecture what may have happended if
this ward had entered phase four and acquired more
experience at goal setting. This exercise in teaching
Goal Attainment Scaling is probably best viewed as an
important first step in investigating the utility of the
technique as a clinical evaluation tool. Staff are
certainly able to acquire the necessary skills and can
apply them given the right circumstances as shown in
phase four.

113.
The majority of goal setting was planned to occur during
phase four of the study and this is where the majority of
changes in behaviour should have occurred. On ward A,
evidence of improved staff and resident behaviour has
already been pointed out in this phase. It cannot be
claimed, however, that the goal setting component alone
was responsible for this. Important trends had commenced
in the data on this ward at an earlier stage. On ward B,
the greater goal setting resulted in no obvious
improvement in terms of greater amounts of prompting or
residents engaged in functional active treatment. One
explanation for this may be the content of the goals
chosen for residents. Although too lengthy to list here,
many objectives concerned self-care behaviours which
would have been taught at times and in places which made
direct observation impossible, for example early mornings
in bathrooms and dormitories. This fact may be
corroborated by the higher Vineland scores obtained
during follow-up on this ward. Methodological problems
may also account for the paucity in higher levels of
interaction. As Orlowska (1990) notes, when staff are
being observed they may feel obliged to 'look busy', with
the result that staff may prefer to perform more
physically active tasks such as putting away laundry or
tidying.
The efectiveness of phase four is similarly difficult to
assess. In terms of goals set and carried out, the

114.
feedback procedure arranged undoubtedly increased their
quality and quantity. It may be inferred, therefore, that
the quality of care improved. On the other hand, this
aspect of care may not have been entirely responsible for
improvements in the residents' quality of life.
Other important changes, for example in challenging
behaviour, had taken place before staff became more
skilled in goal setting. Unfortunately, the measures used
may not have been sufficiently sensitive to isolate
precise reasons for the changes.
Although the experiment should have brought about similar
effects on the three wards, it should be remembered that
the wards were quite different in many respects: this may
have affected the impact of the intervention. For
example, the high levels of challenging behaviour on ward
A may have provided staff with a greater motivation to
want to change their own behaviour. Even so, it is
curious that the incidence of challenging behaviour began
to fall before any goal setting or behavioural skills
were taught to the staff. Measures of staff behaviour
provide no immediate clues to this change. Discussions
with staff concerning this issue reveal that they
initiated changes in some of their routines. For example,
whereas previously they organised one sitting for
residents at mealtimes, in order that staff breaks could
be taken, this was altered to two sittings and their own

115.
meals breaks taken later than usual. Staff felt that this
change would reduce overcrowding in the dining room and
contribute to a less stressful experience for both
residents and staff. A more detailed analysis of the data
for challenging behaviour revealed a reduction in
incidents for this period of the day but there was no
more of a reduction here than at other times.
Other changes pointed out by staff included the opening
of doors from the ward day room to allow residents access
to other parts of the ward, for example the dormitories.
These had previously been locked to permit closer
supervision of residents from the large ward office. This
did not mean that residents now wandered through the ward
unsupervised. Some staff were always present in the
dormitories completing domestic tasks. It might be
imagined that the opportunity to explore, as well as the
chance to 'escape' from a large but often noisy and
crowded area was sufficient to prevent incidents.
Another decision reported by staff included spending more
time with residents. There was no significant change
detected in the quality of interaction, however.
Nevertheless, it must be remembered that the collection
of interaction data via the Psion computer measured
verbal interaction. It could be that the presence, alone,
of staff was sufficient to affect some of the residents'
behaviour.
116.
It is encouraging, if the above is correct, that
relatively small changes in routine can positively affect
client behaviour. The effect on behaviour of altering
certain aspects of the physical envronment has been
demonstrated elsewhere (Adams et al 1980). This is not to
say that all types of challenging behaviour can be
affected using this approach. A high level of skill and
knowledge is still required to help in most cases.

117.
CONCLUSION
This study has taken place at a time of great transition
in the pattern of service delivery to people with
disabilities. The transfer of people into the community,
the closure of hospitals and the advent of the 'mixed
economy' of care have created feelings of anxiety amongst
those who care and work for people with mental handicap.
Not least of their concerns is the preservation and
improvement in care standards. The exhortations of policy
makers concerning improvements in quality will be
ineffective unless the lessons of the past are heeded.
This study has attempted to provide a framework in which
high quality services may be delivered to the most
challenging of people in the most challenging of
environments. Surely, any changes made here would have
implications for other services.
Some encouraging trends may be noted but, overall, it is
extremely difficult to make a case for the widespread
adoption of the intervention used in this study. This is
not because it has been demonstrated to have failed, but
because circumstances gave it little chance of
succeeding. The changes in the composition of staff
proved traumatic to the wards themselves as well as to
the timing and quality of the intervention. In fact, it

118.
is surprising that any positive trends can be detected in
many respects. What is even more surprising is that, out
of the twenty-four leavers during the course of the
project, only five staff left the hospital for
professional reasons. The remainder were transferred to
wards within the hospital. The hospital keeps no record
of exit interviews. Certainly, only one member of staff
to the knowledge of the researcher requested to leave the
ward because of the pressures of the training. A few may
have requested moves for reasons of job stress but the
majority were moved, according to the managers, for
organisational reasons.
There is no substantial body of literature to link staff
turnover with impaired quality of life (Baumeister and
Zahira 1987). These authors point out that the impact of
turnover will be dependent upon other factors such as the
morale and prior cohesiveness of the staff group and also
the timing of the changes. In this study, these changes
carne at a time of uncertainty when staff morale was felt
to be low throughout the organisation. Similar attempts
to improve the quality of care and the lives of this
client group should take careful account of the effects
of the stability of staff numbers in the future. More
research is necessary concerning the impact of unstable
organisational conditions upon the care practices of
staff.
119.
Even if this project had been one hundred per cent
successful, several issues should be addressed to improve
the procedures. It must be considered an error not to
have involved the hospital managers more fully into the
training and the running of the project. Although their
co-operation was exemplary, their increased participation
and commitment to the aims of the study would have been a
considerable advantage. Secondly, the cost of the study
must be examined. It is unlikely that a major initiative
such as this could be undertaken in the present economic
climate. The workshop style of teaching and individual
supervision of staff was time-consuming. It would be
worthwhile examining the possible cost benefits of
conducting similar training in an open, or semi-open
learning format. This would have proved advantageous for
new staff joining the ward. Furthermore, it is believed
that the use of learning contracts contributed to the
motivation of staff. Although this aspect of the training
was not evaluated thoroughly, it is recommended that
future ventures in continuing education include an
element of personalisation of this type.
Despite some consensus as to what we would see as the
outcomes of a good quality service, it still remains
unclear precisely how this may be brought about.
Paradoxically, this study may have exacerbated some of
the problems it aimed to solve. The study hypothesised
that the wrong type of staff behaviour was being

120.
consequated by the organisation with the result that
staffs' actions were goverened more by the management
than by the needs of the clients. With its high profile
and extensive intervention in a somewhat impoverished
setting, the project may have succeeded in shaping and
rewarding the right types of staff behaviour. However,
this may simply have meant that the staff became more
motivated by the researcher than the behaviour of the
clients. It may be that quality of care may only be
realised when the correct balance between these factors
is achieved. How this is brought about is a matter for
conjecture. This is not an argument for abandoning an
empirical approach, setting standards or introducing
quality assurance systems. The investment of effort must
be directed towards discovering how best they may be
introduced. It may be that we need to pay greater
attention to facilitating a climate of innovation amongst
direct care staff. It is known that where staff are
permitted greater freedom to construct goals and monitor
their own actions, then positive benefits for clients can
accrue (Burgio et al 1980). The success of quality
circles is also attributed to the belief that staff are
being permitted to use their initiative in solving
problems that directly affect them instead of relying on
managers to intervene (Ishikawa 1985).
This does not mean that managers should withdraw and
follow the direction given by their direct care staff.

121.
This is a recipe for inertia which will produce a
disaffected workforce. The manager still has a duty to
set the boundaries within which staff will operate and
should articulate the aims and the vision of the service
at every opportunity, What this means is that managers
need to reward innovation as an outcome as well as a
process. After all, helping people to change is the
central aim of health services.

122.
Accreditation Council for Facilities for the Mentally Retarded (1971) Standards for residential facilities for the mentally retarded. Chicago. Joint Commission on Accreditation of Hospitals.
Adams G.L., Tallon R.J. and Stangl J.M. (1980) Environmental influences on self-stimulatory behaviour. Anerican Journal of Mental Deficiency. Vol. 85. No.2. pp 171-175.
Alaszewski A. (1978) The situation of nursing administrators in hospitals for the mentally handicapped: problems in measuring and evaluating the quality of care. Social Science and Medicine. Vol. 12. pp 91-97.
Allen D., Banks R. and Staite S. (1991) Meeting the Challenge. London. Kings Fund Centre.
American Nurses Association (1973) Quality assurance for nursing care. Proceedings of an institute jointly sponsored by the American Nurses Association and American Health Association held in Kansas. Kansas City. ANA.
American Nurses Association (1976) Standards: nursing practice. Kansas City. ANA.
Ashbaugh J.W. (1990) The role of performance contracts in quality assurance. In Bradley V. and Bersani H.A. (eds.) Quality assurance for individuals with developmental disabilities. Baltimore. Paul Brookes.
Bachrach L.L. (1981) A conceptual approach to deinstitutionalisation of the mentally retarded: a perspective from the experience of the mentally ill. In Bruinicks R.H., Meyers C.E.! Sigford B.B. and Lakin K.C. (eds.) Deinstitutionalisation and community adjustment of mentally retarded people. Washington D.C. AAMD.
Bailey D.B. and Simeonsson R.J. (1988) Investigation of use of Goal Attainment Scaling to evaluate individual progress of clients with severe and profound mental retardation. Mental Retardation. Vol. 26. No.5. pp 289-295.
Baumeister A.A. and Zahira E.S. (1987) Withdrawl and commitment of basic-care staff in residential programmes. In Landesman-Dwyer S. and Vietze P. (eds.) Living Environments and Mental Retardation. Washington. AAMD.
Beaill N. and Cook S. (1987) Assessing the training gap. Nursing Times. April 8th. pp 46-47.

123.
Bell N.J. (1976) I.Q. as a factor in community lifestyles of previously institutionalised retardates. Mental Retardation. Vol. 14. No.3. pp 29-33.
Bloch D, (1975) Evaluation of nursing care in terms of process and outcome: issues in research and quality assurance. Nursing Research. Vol. 24. No.4. pp 256-263.
Blunden R. and Allen D. (1987) Facing the Challenge. London. Kings Fund Centre.
Brown H. (1985) Lifestyles for people with mental handicaps. A staff training exercise based on normalisation principles. Brighton. ESCATA.
Brown J. (1991) Stand up and be counted. Nursing Times. Vol. 87. No. 47. pp 60-61.
Burg M.M., Reid D.H. and Lattimore J. (1979) Use of a self-recording and supervision programme to change institutional staff behaviour. Journal of Applied Behaviour Analysis. 12. pp 363-375.
Burgio L.D., Whitman T.L. and Reid D.H. (1983) A participative management approach for improving direct-care staff performance in an institutional setting. Journal of Applied Behaviour Analysis. 16. pp 37-53.
Calsyn R.J. and Davidson W.S. (1978) Do we really want a programme evaluation strategy based solely on individualised goals ? Community Mental Health Journal. Vol. 14(4). pp 300-308.
Calsyn R.J., Tornatzky L.G. and Dittmar S. (1977) Incomplete adoption of an innovation: the case of Goal Attainment Scaling. Evaluation. 4. pp 127-130.
Cameron R., Shackleton-Bailey M. and Wallis J. (1984) Difficult and disruptive behaviour: reconciling needs of clients and staff. Mental Handicap. Vol. 12. pp 95-97.
Causby V.D. and York R.O. (1991) Predictors of success in community placement of persons with mental retardation. British Journal of Mental Subnormality. Vol. 37. Part 1. pp 25-34.
Chamberlain P. and Bradbury N. (1990) Service Evaluation Readings. Bromsgrove and Redditch Health Authority.
Chesledine S.E. and Jeffree D.M. (1981) Mentally handicapped adolescents: their use of leisure. Journal of Mental Deficiency Research. 25. pp 49-59.

124.
Chiarella M. (1985) Monitoring the nursing process. Nursing Mirror. 160(20). pp 40-42.
Choate R., Smith A., Cardillo J.E. and Thompson L. (1981) Training in the use of Goal Attainment Scaling. Community Mental Health Journal. Vol. 17(2) pp 171-181.
Cochrane A.L. (1972) Effectiveness and efficiency: random reflections of health services. London. Nuffield Provincial Hospitals Trust.
Cullen C., Burton M. and Thomas M. (1983) Residents Development Project. Final Reports to the DHSS. Manchester. Hester Adrian Research Centre. University of Manchester.
Cytrynbaum S., Ginath Y., Birdwell J. and Brandt L. (1979) Goal Attainment Scaling: a critical review. Evaluation Quarterly. Vol. 3. No.1. pp 5-40.
Datta L.E. and Perloff R. (1979) Improving Evaluations. Beverley Hills. Sage.
De Tornay R. and Thompson (1987) Strategies for teaching nursing. 3rd. edition. London. Wiley and Sons.
DHSS (1972) Report of the Royal Commission of Nursing Care. The Briggs Report. Cmnd. 5115. London. HMSO.
DHSS (1979) Report of the Committee of Enquiry into Mental Handicap Nursing and Care. The Jay Report. Cmnd. 7468. London. HMSO.
DHSS (1983a) Report of the National Health Service Management Enquiry. The Griffiths Report. London. HMSO.
DHSS (1983b) The Mental Health Act for England and Wales. Chap. 20. London. HMSO.
DHSS (1983c) Performance Indicators for the National Health Service: services for Mentally Handicapped People. Consultation paper number 5. London. DHSS.
DHSS (1990) National Health Service and Community Care Act. Chap. 19. London. HMSO.
DHSS (1991) Mental Handicap Nursing in the context of 'Caring for People'. The Cullen Report. London DHSS.
Derryberry M. (1939) Nursing accomplishments as revealed by case records. Public Health Reports. 54. pp 20-35.
Donnabedian A. (1966) Evaluating the quality of medical care. Milbank Memorial Fund Quarterly. 4. pp 166-203.

Donnabedian A. (1980) The definition of quality and approaches to its assessment. Michigan. Arbor.
125.
Emerson E., Toogood A., Mansell J., Barrett S., Bell C., Cummings R. and McCool C. (1987) Challenging behaviour and community services: 1. introduction and overview. Mental Handicap. Vol. 15. pp 166-168.
Felce D., Mansell J. and Kushlik A. (1980) Evaluation of alternative residential facilities for the severely mentally handicapped in Wessex; staff performance. Advances in Behaviour Research and Therapy. 3. pp 25-30
Fielding L.T., Errickson E. and Bettin B. (1971) Modification of staff behaviour: a brief note. Behaviour Therapy. 2. pp 550-553.
Galano J. (1977) Treatment effectiveness as a function of client involvement in goal-setting and goal planning. Goal Attainment Review. 3. pp 17-29.
Garwick G. (1974a) A study comparing Goal Attainment Scaling for clients in four types of outpatient treatment. In Garwick G. and Brintnall J. (eds.) Proceedings of the second Goal Attainment Scaling Conference. Minneapolis. Program Evaluation Resource Centre.
Garwick G. (1974b) An introduction to reliability and the Goal Attainment Scaling Methodology. Minneapolis. Programme Evaluation Resource Centre.
Garwick G. (1974c) A construct validity overview of Goal Attainment Scaling. Minneapolis. Programme Evaluation Resource Centre.
Garwick G. and Lampman S. (1972) Typical problems bringing patients to a community mental health centre. Community Mental Health Journal. 8. pp 271-280
Gladstone B.W. and Spencer C.J. (1977) The effects of modelling on the contingent praise of mental retardation counsellors. Journal of Applied Behaviour Analysis. 10. pp 75-84.
Goldiamond I. (1974) Towards a constructional approach to social problems. Behavioursim. 2. pp 1-84.
Gooch J.K. (1982) Failure or success? Nursing Times. Vol. 78. NO. 25. pp 1199-1196.
Grant G.W.B. and Moores B. The avoidance syndrome in hospitals for the mentally retarded. International Journal of Nursing Studies. 14. pp 91-95.

126. Green C.W. and Reid D.H. (1991) Reinforcing staff
performance in residential facilities: a survey of common managerial practices. Mental Retardation. Vol. 29. No.4. pp 195-200.
Guy M.E. and Moore L.S. (1982) The Goal Attainment Scale for Psychiatric Inpatients. Development and use of a Quality Assurance tool. Quality Review Bulletin. June.
Ham C.J. (1981) Policy making in the NHS. London MacMillan.
Harris J.M., Veit S,W'! Allen G.J. and Chinsky J.M. (1974) Aide-resident ratio and ward population density as mediators of social interaction. American Journal of Mental Deficiency. Vol. 79. No.3. pp 320-326.
Hefferin E.A. and Hunter R.E. (1975a) Nursing observation and care planning for the hospitalised aged. Gerontologist. 15. pp 57-60.
Heffrin E.A. and Hunter R.E. (1975b) Nursing assessment and care plan statements. Nursing Research. 24. pp 360-366,
Henderson V. (1982) The Nursing Process - is the title right? Journal of Advanced Nursing. 7. pp 103-109.
Hile M.G. and Walbran B,B. (1991) Observing staffresident interactions: what staff do, what residents receive, Mental Retardation. Vol. 29. No.1. pp 35-41.
HMSO (1969) Hansard: statement of the Secretary of State for Social Services. (5th series, 780. pp 1808-1820)
Holburn C.S. (1990) Our residential rules - have we gone too far? Mental Retardation. Vol. 28. No.2. pp 65-66.
Holroyd J. and Goldenberg I. (1978) The use of Goal Attainment Scaling to evaluate a ward treatment programme for disturbed children. Journal of Clinical Psychology. Vol. 34. No.3.
Hughson E.A. and Brown R.I. The evaluation of adult rehabilitation programmes, The Irish Journal of Psychology. 9. 2. pp 249-263.
Hutt C. and Vaizey M.J. (1966) Differential effects of group density on social behaviour. Nature. 209. pp 1371-1372.
Intagliata J., Willer B. and Ricks M. (1981) Factors related to the quality of community adjustment in family care homes. In Bruininks R.H., Meyers C.E.,

127. Sigford B.B. and Lakin K.C. (eds) Deinstitutionalisation and Community Adjustment of Mentally Retarded People. Washington D.C. AAMD.
Intagliata J. and Willer B. (1982) Reinstitutionalisation of mentally retarded persons successfully placed in family care and group homes. American Journal of Mental Deficiency, 87. pp 34-39.
Intagliata J., Rinck C. and Calkins C. (1986) Staff response to maladaptive behaviour in public and community residential facilities. Mental Retardation. Vol. 24. No.2. pp 93-98.
Ishikawa K. (1985) What is total quality control - the Japanese way. New York. Prentice Hall.
Iwata B.A., Bailey J.S., Brown K.M., Foshee T.J. and Alpern M. (1976) A performance based lottery to improve residential care and training by institutional staff. Journal of Applied Behaviour Analysis. 9. pp 417-431.
Iwata B.A., Dorsey M.F., Slifer K.J., Bauman K.E. and Richman G.S. (1982) Toward a functional analysis of self-injury, Analysis and Intervention in Developmental Disabilities. 2. pp 3-20.
Jacobsen J.W. (1982) Problem behaviour and psychiatric impairment within a developmentally disabled population. 1. Behaviour frequency. Applied Research in Mental Retardation. 3. pp 121-139.
Jacobsen N.S. (1988) Defining clinically significant change: an introduction. Behavioural Assessment. 10. pp. 131-132.
Johnston J.M. and Pennypacker H.S. (1980) Strategies and tactics of human behavioural research. Hillsdale, New Jersey. Lawrence Earlbaum Associates.
Kazdin A.E. (1975) Behaviour modification in applied settings. Homeward, Illinois. Dorsey Press.
Kazdin A.E. and Matson J.L. (1981) Social Validation in Mental Retardation. Applied Research in Mental Retardation. Vol. 2. pp 39-53.
Kendall P.C. and Norton-Ford J.D. (1982) Therapy outcome research methods. In Kendall P.C. and Butcher J.N. (eds.) Handbook of research methods in clinical psychology. New York. Wiley and Sons.
Keyzer D. (1980) Learning contracts: a non-formal approach to in-service education. MSc. thesis. University of Manchester.

128. K~yzer D. (1986) Using learning contracts to support
change in nursing organisations. Nurse Education Today, 6. pp 103-108.
Kiresuk T.J. and Sherman R.F. (1968) Goal Attainment Scaling: a general method for evaluating comprehensive community health programmes. Community Mental Health Journal. 4. pp 443-453.
Kirwin B. (1980) From the ivory tower to the ward floor, Nursing Mirror. Feb, 28. pp 36-38.
Kissel R.C., Whitman T.L. and Reid D.H. (1983) Development of self-care skills in retarded children through an institutional staff training and selfmanagement programme. Journal of Applied Behaviour Analysis. 16. pp 395-416.
Kitson A. (1986) Quality Counts. In Quest for Quality. Procedings of a conference held by the University of Edinburgh Nursing Studies Association.
Knowles M. (1975) Self-directed learning. Chicago. Follett Publishing Company,
Kratz C. (1979) The Nursing Process. London. BalliereTindall.
Kroll J. and Mackenzie T.B. (1983) When psychiatrists are liable: risk management and violent patients. Hospital and Community Psychiatry. Vol. 34. No.1. pp 29-37.
Kushlick A. and Cox G. (1967) Ascertained prevalence of mental subnormality in the Wessex region. Montpelier. Proceedings of the International Congress for the Scientific Study of Mental Deficiency.
Lahiff J. (1990) Profile of a Profession: a survey of RNMHs in the United Kingdom - a selection of early findings. Paper presented at ENB conference, Ripon.
La Ferriere L. and Calsyn R. (1978) Goal Attainment Scaling: an effective treatment technique in shortterm therapy. American Journal of Community Psychology, Vol. 6. No.3. pp 271-282.
Lampman S. j Garwick S.G. and Grygelko M. (1977) Content Analysis and Goal Attainment Scaling. Goal Attainment Review. 3. pp 113-148.
Landesman-Dwyer S. (1981) Living in the Community. American Journal of Mental Deficiency. 86. pp 223-234.
Lefkowitz P. (1974) Programme evaluation in a day treatment centre. Goal Attainment Review. 1. pp 44-48.

129. Le Laurin K. and Risley T.R. (1972) The organisation of
day care environments: 'zone' versus 'man-to-man' staff assignments. Journal of Applied Behaviour Analysis. 5. pp 225-232.
Leudar I., Fraser W.I. and Jeeves M.A. (1984) Behaviour disturbance and mental handicap: typology and longitudinal trends. Psychological Medicine. 14. pp 923-935.
Leudar I. and Fraser W.I. (1987) Behaviour disturbance and its assessment. In Hogg J. and Raynes N.V. (eds.) Assessment in Mental Handicap. Beckenham. Croom Helm.
Lloyd M.E. (1983) Selecting systems to measure client outcome in human service agencies. Behavioural Assessment. 5. pp 55-70,
MacEacheron A. (1983) Institutional reform and adaptive functioning of mentally retarded persons: a field experiment. American Journal of Mental Deficiency. 88. pp 2-12.
Maloney F.P.! Mirrett P., Brooks C. and Johannes K. (1978) Use of the Goal Attainment Scale in the treatment and ongoing evaluation of neurologically handicapped children. The American Journal of Occupational Therapy. Vol. 30. No.9. pp 505-510.
Mansell J., Felce D., Jenkins J. and De Kock U. (1982) Increasing staff ratios in an activity with severely mentally handicapped people. British Journal of Mental Subnormality. 28. pp 97-99.
Mansell J., Felce D., Jenkins J., Flight C. and Dell D. (1986) The Bereweeke Skills Teaching System: handbook. Windsor. NFER Nelson.
Mansell J. and Beasley F. (1990) Severe mental handicap and problem behaviour: evaluating transfer from institutions to community care. In Fraser W.I. (ed.) Key Issues in Mental Retardation Research. London. Routledge.
Manthey M. (1980) The Pratice of Primary Nursing. Oxford. Blackwell Scientific.
Marks-Maran D.J. (1988) Skills for care planning. London. Scutari Press.
Marshall B.D.! Banzett L., Kuehnel T. and Moore J. (1983) Maintaining nursing staff performance on an intensive behaviour therapy unit. Analysis and Intervention in Developmental Disabilities. Vol. 3. pp 193-204.
Martens K.H. (1981) Self-directed learning: an option

for nursing education. Nursing Outlook. August. pp 472-477.
130.
Martin J. (1984) Hospitals in trouble. London. Blackwell.
Martin R.W. and Ticktum R.J. (1987) The nursing process in mental handicap services. Mental Handicap. Vol. 15. pp 54-59.
Mauger P.D., Audette C., Simonini C and Stolberg A. (1974) A study of the construct validity of Goal Attainment Scaling. Goal Attainment Review. 1. pp 13-19
McConkey R., Walsh J. and Mulcahy M. (1982) Mentally handicapped adults living in the community - a survey conducted in and around the city of Dublin. Mental Handicap. Vol 10. pp 90-93.
McGee J., Menolascino F.J. and Hobbs D.C. and Menousek P.E. (1987) Gentle Teaching: a non-aversive approach to helping persons with mental retardation. New York. Human Science Press.
Meinhold P.M. and Mulick J.A. (1990) Counter-habilitative contingencies in institutions for people with mental retardation: ecological and regulatory influences. Mental Retardation. Vol. 28. No.2. pp 67-75.
Milne D, (1985) The more things change the more they stay the same: factors affecting the implementation of the nursing process. Journal of Advanced Nursing. 10, pp 39-45,
Milne D. (1986) Nurses as therapists: a review of research. (chap 5.) in Milne D. Training behaviour therapists: methods, evaluation and implementation with parents, nurses and teachers. London, Croom Helm,
Montgomery L" Ludwick J, and Munchow J, (1988) Individual programme planning on a ward for men with severe mental handicaps. Mental Handicap. Vol. 16. pp 155-158.
Noon M. (1988) Teams: the best option? Health Service Journal. Oct. 6th. pp 1160-1161.
National Consumer Council (1984) Community Health Councils. London. National Consumer Council.
Nihira K., Foster R., Shellhaas M. and Leland H. (1975) Adaptive Behaviour Scale. Washington. AAMD.
Oliver C., Murphy G.H. and Corbett J.A. (1987) Selfinjurious behaviour in people with mental handicap: a total population study. Journal of Mental Deficiency Research. 31. pp 147-162.

131. Oliver M. (1990) The politics of disablement. Basingstoke
MacMillan.
Orlowska D. (1990) Staff reactivity to observation. The British Journal of Mental Subnormality. Vol. 36. Part 2
Oswin M. (1984) They keep going away. London. Kings Fund.
Parsons M.B., Cash V.B. and Reid D.H. (1989) Improving residential treatment services: implementation and norm-referenced evaluation of a comprehensive management system. Journal of Applied Behaviour Analysis. 22, pp 143-156.
Partridge K., Chisholm N. and Levy B. (1985) Generalisation and maintenance of ward programmes: some thoughts on organisational factors. Mental Handicap. Vol. 13. pp 26-29.
Pedlar A. (1990) Normalisation and integration: a look at the Swedish experience. Mental Retardation. Vol. 28. No.5. pp 275-282.
Pearson A. (1987) Nursing quality measurement. Quality assurance methods for peer review. London. Wiley and Sons.
Porterfield J., Evans G. and Blunden R. (1984) Working together for change: involving clients, families and staff in planning improvements in mental handicap services. Mental Handicap. Vol. 12. pp 67-69.
Prue D.M. and Fairbank J.A. (1981) Performance feedback in organisational behaviour management: a review. Journal of Organisational Behaviour Management. 3(1) pp 1-16.
Raynes N.V. (1987) Annotated directory of measures of environmental quality for use in residential services for people with a mental handicap. University of Manchester, Department of Social Administration.
Reid D.H. and Whitman T.L. (1983) Behavioural staff management in institutions: a critical review of effectiveness and acceptibility. Analysis and Intervention in Developmental Disabilities. 3. pp 131-149.
Reid D.H. and Shoemaker J. (1984) Behavioural supervision: methods of improving institutional staff performance. In Christian W,P., Hannah G.T. and Glahn T,J. (eds) Programming effective human services: strategies for institutional change and client transition. New York, Plenum Press.
Reid D.H. and Schepis M.M. training. In Barrett R.P.
(1986) Direct care staff (ed) Severe behaviour

132. disorders in the mentally retarded: non-drug approaches to treatemnt. New York. Plenum Press.
Reid D.H., Parson M.B. and Green C.W. (1989) Staff management in human services: behavioural research and application. Springfield. Thomas.
Reinhart E. (1977) Independent study: an option in continuing education. Journal of Continuing Education in Nursing. Vol. 8. No.1. pp 38-42.
Repp A.C. and Deitz D.E.D. (1979) Improving administrative-related staff behaviours in a state institution. Mental Retardation. August. pp 185-192.
Repp A.C. and Barton L.E. (1980) Naturalistic observations of institutionalised retarded persons: a comparison of licensure decisions and behavioural observations. Journal of Applied Behaviour Analysis. 13. pp 333-341.
Repp A,C., Harman M.L., Felce D., Van Acker R. and Karsh K.G. (1989) Conducting behavioural assessments on computer-collected data. Behavioural Assessment. Vol. 11. pp 249-268.
RCN (1980) Standards of Care. London. Royal College of Nursing.
RCN/Society of Mental Handicap Nursing. (1991) Newsletter to Society Members. January.
Salvage J. (1990) The theory and practice of the 'new nursing'. Nursing Times. Vol. 86. No.4. pp 42-45.
Saxby H., Felce D., Harman M. and Repp A. (1988) The maintenance of client activity and staff:client interaction in small community houses for severely and profoundly mentally handicapped adults: a two year follow-up. Behavioural Psychotherapy. 16. pp 189-206.
Scull A.T. (1979) Museums of Madness. Harmondsworth. Pelican.
Seaberg J.R, and Gillespie D.F. (1977) Goal Attainment Scaling: a critique. Social work research and abstracts. 13.4. pp 4-8.
Sherman R. (1974) The content validity argument of the goal attainment score. PERC Newsletter. November.
Shoemaker J. and Reid D.H. (1980) Decreasing chronic absenteeism among institutional staff: effects of a low cost attendance programme. Journal of Organisational Behaviour Management. 2. pp 317-328.

133.
Sines D. (1988) Managing services to assure quality. In Sines D. (ed.) Towards integration: comprehensive services for people with mental handicaps. London. Harper and Row.
Sines D. (1990) The case for reform. Nursing Times. Vol. 86. No. 49. pp 28-30.
Skinner B.F. (1953) Science and Human Behaviour. New York. Free Press.
Slama K.M. and Bannerman D.J. (1983) Implementing and maintaining a behavioural treatment system in an institutional setting. Analysis and Intervention in Developmental Disabilities. Vol. 3. pp 171-191.
Smith D. (1976) Goal Attainment Scaling as an adjunct to counselling. Journal of Counselling Psychology. 28. 1. pp 22-27.
Smith A. (1981) Goal Attainment Scaling: a method for evaluating the outcome of mental health treatment. In McReynolds P. (ed) Advances in Psychological Assessment San-Francisco. Jossey-Bass.
Sparrow S.S., Balla D.A. and Cicchetti D.V. (1984) The Vineland Adaptive Behaviour Scale. Interview Edition. Minnesota. American Guidance Service Inc.
Stanley B. (1984) Evaluation of treatment goals: the use of Goal Attainment Scaling. Journal of Advanced Nursing 9. pp 351-356.
State of Victoria, Australia (1986) Intellectually Disabled Persons' Services Act. Melbourne. Victoria Government Publication Office.
Sturmey P., Newton T. and Crisp A.G. (1988) Writing behavioural objectives: an evaluation of a simple, inexpensive method. Journal of Advanced Nursing. 13. pp 496-500.
Sturmey P. (1990) Goal planning manuals: their readability, human interest and content. Mental Handicap Research. 3:1. pp 70-80.
Sutter P., Mayeda T., Call T., Yanagi G. and Yee S. (1980) Comparison of successful and unsuccessful community placed mentally retarded persons. American Journal of Mental Deficiency. Vol. 85. No.3. pp 262-267.
Szivos S.E. and Griffiths E. (1989) Consciousnessraising: a challenge to normalisation. Paper presented at the British Psychological Society Annual Conference,

134. St. Andrews University.
Szivos S.E. and Griffiths E. (1990) Group processes involved in coming to terms with a mentally retarded identity. Mental Retardation. Vol. 28. No.6. pp 333-341.
Turnbull J. (1990) Gentle teaching: the emperor's new clothes? Nursing Times. Vol. 86. No. 32. pp 64-68.
U.S. Department of Health, Education and Welfare (1974) Regulations for intermediate care facility services. Federal Register.
Waters K. (1986) Cause and Effect. Nursing Times. Jan. 26th. pp 28-29.
Weinstein M.S. and Ricks F.A. (1977) Goal Attainment Scaling: planning and outcome. Canadian Journal of Behavioural Science. 9(1) pp 1-11.
Willems E.P. (1974) Behavioural technology and behavioural ecology. Journal of Applied Behaviour Analysis. 7. pp 151-165.
Willer B. and Miller G. (1976) On the validity of Goal Attainment Scaling as an outcome measure in mental health. American Journal of Public Health. 66. pp 1197-1198.
Wolf M.M. (1978) Social validity: the case for subjective measurement or how applied behaviour analysis is finding its feet. Journal of Applied Behaviour Analysis 11. pp 203-214.
Wolfensberger W. and Glenn L. (1975) Programme Analysis of Service Systems: handbook and manual (3rd. edition). Toronto. National Institute on Mental Retardation.
Wolfensberger W. (1983) Normalisation. Toronto. NIMH.
Woods N.F. and Catanzaro M. (1988) Generating Nursing Science (chap. 1) in Nursing Research. Washington D.C. Mosby,
Wright S. (1987) Getting to the core of the matter. Nursing Times. Vol. 83, No. 24. pp 61-63.
Wyszewianski L. (1988) Quality of care: past achievements and future challenges. Inquiry. Vol. 25. No.1. pp 13-22.
Yule W. and Carr J. eds. (1987) Behaviour modification for people with mental handicaps. 2nd Edition. London. Croom Helm.

APPENDIX 1.
Summary of staff evaluations of workshops.
Question 1- The workshop was
NOT WELL AVERAGE VERY WELL PRESENTED PRESENTED
1% 3.6% 95.2%
Question 2. The workshop contained
NOT ENOUGH TOO MUCH ABOUT DETAIL DETAIL RIGHT
1% 1% 98%
Question 3. The workshop was
NOT AT ALL AVERAGE VERY RELEVANT RELEVANT
0% 4.2% 95.7%
Question 4. The workshop made me feel
VERY AVERAGE ENTIRELY UNCOMFORTABLE AT EASE
4.2% 2.6% 93.1%

APPENDIX 2
Figures for staff turnover on the three wards over the course of the research project.
Ward A
Phase of Study Total
I II III IV FU
Leavers:
Qualified 0 3 1 1 2
Unqualified 0 0 3 0 0
0 3 4 1 2 10
Starters:
Qualified 0 2 0 0 2
Unqualified 0 0 2 0 1
0 2 2 0 1 5
Ward B
Leavers:
Qualified 3 1 0 0 1
Unqualified 2 1 0 0 2
5 2 0 0 3 10
Starters:
Qualified 3 1 0 0 2
Unqualified 1 2 1 1 1
4 3 1 1 3 12

(appendix 2 • cant. )
Ward C
Phase of Study Total
I II III
Leavers:
Qualified 3 0 0
Unqualified 0 0 1
3 0 1 4
Starters:
Qualified 3 1 0
Unqualified 0 0 2
3 1 2 6

APPENDIX 3
Changes in numbers of staff per ward over the course of the research project.
Ward A
Data Collection Total Numbers of Point Staff
Baseline 17
Phase One 15
Phase Two 14
Phase Three 12
Phase Four 11
Follow-up (first) 12
Follow-up (second) 11
Ward B
Baseline (first) 14
Baseline (second) 12
Phase One 12
Phase Two 13
Phase Three 14
Phase Four 15
Follow-up 16
Ward C
Baseline (first) 10
Baseline (second) 9
Baseline (third) 9
Phase One 9
Phase Two 10
Phase Three 11


![A St Andrews PhD St Andrews PhD –event funded by ... 1415 The application experience and the PhD interview ... [TeachFirst] [researchersinschools.org]](https://static.fdocuments.in/doc/165x107/5b39b63d7f8b9a5a518ecc1c/a-st-andrews-phd-st-andrews-phd-event-funded-by-1415-the-application-experience.jpg)