John Silvia – Chief Economist December 12, 2003 Art of Forecasting: The Financial Economy...
37
John Silvia – Chief Economist December 12, 2003 Art of Forecasting: The Financial Economy Presentation to: FDIC Economic Outlook Panel
-
Upload
dominick-kelly -
Category
Documents
-
view
219 -
download
0
Transcript of John Silvia – Chief Economist December 12, 2003 Art of Forecasting: The Financial Economy...

John Silvia – Chief EconomistDecember 12, 2003
Art of Forecasting: The Financial Economy
Presentation to: FDIC Economic Outlook Panel

20032002200120001999
10%
8%
6%
4%
2%
0%
-2%
10%
8%
6%
4%
2%
0%
-2%
REAL GDP GROWTHQuarter/Quarter Percent Change, Seasonally Adusted Annual Rate
3rd Quarter 2003@ 8.2%

03020100999897
15%
10%
5%
0%
-5%
-10%
15%
10%
5%
0%
-5%
-10%
FINAL DOMESTIC DEMAND COMPONENTS(Year-on-Year Growth)
Blue Line = Consumer Spending @ 3.5%Red Line = Government Spending @ 3.7%
Green Line = Business Fixed Investment @ 6.8%
3Q 2003

0302010099
$1350
$1300
$1250
$1200
$1150
$1100
$1050
$1000
$950
$1350
$1300
$1250
$1200
$1150
$1100
$1050
$1000
$950
REAL EXPORTS & BUSINESS FIXED INVESTMENTIn Billions of 1996 Dollars
Blue Line = Real Business Fixed InvestmentGreen Line = Real Exports
3Q 2003

Blue Chip Consensus performs better than any individual forecaster.
Average of forecasts reduces noise/bias of individual forecasters
Access to independent information
Auto, Housing, SectorsRegional Influences
*Forecast Evaluation with Cross-Sectional Data: The Blue Chip Surveys, Bauer et. Al., FRB-Atlanta Economic Review, Second Quarter 2003

Forecast Date 2003 2004
April 2002 3.5 NA
February 2003 2.7 3.6
July 2003 2.3 3.7
December 2003 3.1 4.4
Real GDP
Error Persistence second Half of 1990s*
GDP, Unemployment Rate, Inflation
Underreported GDP when inflation, Interest Rates Low
Inefficient Forecasts
* Scott Schuh, An Evaluation of Recent Macroeconomic Forecast Errors, Forecasts Unbiased but Inefficient Structural Change: Inflation, Unemployment and Nominal Interest Rate Error Correlated. New England Economic Review, Jan/Feb 2001

Second Half of 1990s
Forecast Errors Persist: GDP, Unemployment Rate
Errors biased over short periods
Inflation: Underpredict 1970s
On Track 1990s
Inefficient Forecasts
Data on Inflation, Nominal Interest Rate Improves, GDP forecast
Not All Information on Inflation and Interest Rates are Incorporated into Average GDP Forecasts.

030199979593918987
6%
5%
4%
3%
2%
1%
0%
-1%
6%
5%
4%
3%
2%
1%
0%
-1%
INCOME & SPENDING GROWTHYear to Year Percent Change, 12 Month Moving Average
OctoberReal Spending (Green Line) @ 3.0%Real, Disposable Income (Blue Line) @ 2.9%

020098969492908886848280
30%
25%
20%
15%
10%
30%
25%
20%
15%
10%
FINANCIAL OBLIGATIONS RATIOS (FOR)Total Financial Obligations as % of Disposable Personal Income
Blue Line = Homeowners FOR @ 14.1%
Green Line = Renters FOR @ 28.8%
3Q 2003
Red Line = Aggregate FOR @ 18.1%

200320022001
20%
10%
0%
-10%
-20%
20%
10%
0%
-10%
-20%
REAL BUSINESS EQUIPMENT & SOFTWARE SPENDINGSeasonally Adusted Annual Rate
3rd Quarter 2003@ 18.4%

020098969492908886848280
$1.4
$1.2
$1.0
$0.8
$0.6
$0.4
$0.2
$0.0
$1.4
$1.2
$1.0
$0.8
$0.6
$0.4
$0.2
$0.0
RENTAL COST OF CAPITALCents on the Dollar
Blue Line = Computers
Green Line = Software

030201009998979695949392
10%
9%
8%
7%
6%
5%
4%
3%
10%
9%
8%
7%
6%
5%
4%
3%
Cost Of FundsAfter Tax Cost of Equity and Debt Financing
Green Line is After Tax Cost of Equity, 3Q @ 6.0%Blue Line is After Tax Cost of Debt, 3Q @ 3.8

03020100999897
2.6
2.4
2.2
2.0
1.8
1.6
1.4
1.2
1.0
2.6
2.4
2.2
2.0
1.8
1.6
1.4
1.2
1.0
BB CORPORATE BOND YIELD /10-YEAR TREASURY YIELD
WorldCom

02009896949290
$1100
$1000
$900
$800
$700
$600
$500
$400
$300
$1100
$1000
$900
$800
$700
$600
$500
$400
$300
CORPORATE PROFITSIn Billions of Dollars, SAAR
3rd Quarter 2003@ $1002.6 B
Adjusted for Inventory Valuation & Capital Consumption

030201009998979695949392
12%
10%
8%
6%
4%
2%
0%
-2%
12%
10%
8%
6%
4%
2%
0%
-2%
REAL FEDERAL FUNDS RATEVS. M2 MONEY GROWTH
Green Line = Real Fed Funds Rate*,Blue Line = M2 Growth, Yr/Yr % Change, October @ 6.2%
* Fed Funds Rate minus "Core" Consumer Price Index
October @ - 0.3%

030199979593918987
23%
22%
21%
20%
19%
18%
17%
16%
15%
23%
22%
21%
20%
19%
18%
17%
16%
15%
FEDERAL SPENDING vs. REVENUEAs Percent of GDP
October '03
16.2%
SPENDING
REVENUE
19.7%
Latest 12 months:
Spending $ 2,183 TrillionRevenue $ 1,794 Trillion
(Blue Line)
(Green Line)

Financial Risk

20032002
3.5%
3.0%
2.5%
2.0%
1.5%
1.0%
0.5%
30%
20%
10%
0%
-10%
-20%
CONSUMER PRICE INDEXYear-over-Year Percent Change
OctoberBlue Line = Food, left scaleGreen Line = CPI, left scale
Red Line = Energy, right scale

030201009998979695949392
5%
4%
3%
2%
1%
0%
-1%
-2%
-3%
5%
4%
3%
2%
1%
0%
-1%
-2%
-3%
U.S. "Core" CPI - SERVICES VS GOODSYear to Year Percent Change
October
@ 2.9%Blue Line is "Core" Services
Green Line is "Core" Goods @ - 2.4%
"Core" = Ex. Food & Energy

Forecast Date 2003 2004
April 2002 2.5 NA
February 2003 2.3 2.3
July 2003 2.2 1.8
December 2003 2.3 1.9
Consumer Price Index

03020100999897
4.5
4.0
3.5
3.0
2.5
2.0
1.5
1.0
0.5
4.5
4.0
3.5
3.0
2.5
2.0
1.5
1.0
0.5
10-YEAR TREASURY / FED FUNDS RATE

03020100999897
2.2
2.0
1.8
1.6
1.4
1.2
1.0
0.8
0.6
2.2
2.0
1.8
1.6
1.4
1.2
1.0
0.8
0.6
2-YEAR TREASURY / FED FUNDS RATE

Forecast Date 2003 2004
April 2002 5.8 NA
February 2003 4.3 5.2
July 2003 3.7 4.3
December 2003 4.0 4.8
10-Year Treasury Yield

Forecast Date 2003 2004
April 2002 5.3 NA
February 2003 6.0 5.6
July 2003 6.0 5.8
December 2003 6.0 5.8
Unemployment Rate

Bank Lending

03020100999897
15%
10%
5%
0%
-5%
-10%
-15%
15%
10%
5%
0%
-5%
-10%
-15%
BANK C&I VS. CONSUMER LOANSYear-over-Year Percent Change
November 26
Blue Line = Consumer Loans @ 7.5%
Green Line = C&I Loans @ - 8.3%

03020100999897969594939291
60%
30%
0%
-30%
60%
30%
0%
-30%
REVOLVING HOME EQUITY LOANSPercent Change in 13 week moving average
November 26
@ 29.6%Yr/Yr
13 WeekAnnual Rate
@ 28.9%
Blue Line is Yr/YrGreen Line is 13 Week, Annual Rate

03020100999897969594939291
40%
20%
0%
-20%
40%
20%
0%
-20%
REAL ESTATE LOANSPercent Change in 13 week moving average
November 26
@ 13.8%Yr/Yr
13 WeekAnnual Rate
@ 8.6%
Blue Line is Yr/YrGreen Line is 13 Week, Annual Rate

03020100999897
80%
60%
40%
20%
0%
-20%
80%
60%
40%
20%
0%
-20%
BANK CREDIT POLICY - C&I LOANSMeasures Net Easing or Tightening of Credit Standards
October '03
Above Zero = TighteningBelow Zero = Easing
Senior Loan Officer Opinion Surv ey by the Federal Reserv e
Blue Line = Large & Medium FirmsGreen Line = Small Firms
S

009692888480767268
80%
60%
40%
20%
0%
-20%
-40%
-60%
-80%
80%
60%
40%
20%
0%
-20%
-40%
-60%
-80%
BANK CREDIT POLICY - CONSUMER LOANSMeasures Net Easing or Tightening of Consumer Credit Criteria
October '03@ 14.3 %
Above Zero = EasingBelow Zero = Tightening
Senior Loan Officer Opinion Surv ey by the Federal Reserv e
030201009998979695949392
80%
60%
40%
20%
0%
-20%
-40%
-60%
-80%
7%
6%
5%
4%
3%
2%
1%
0%
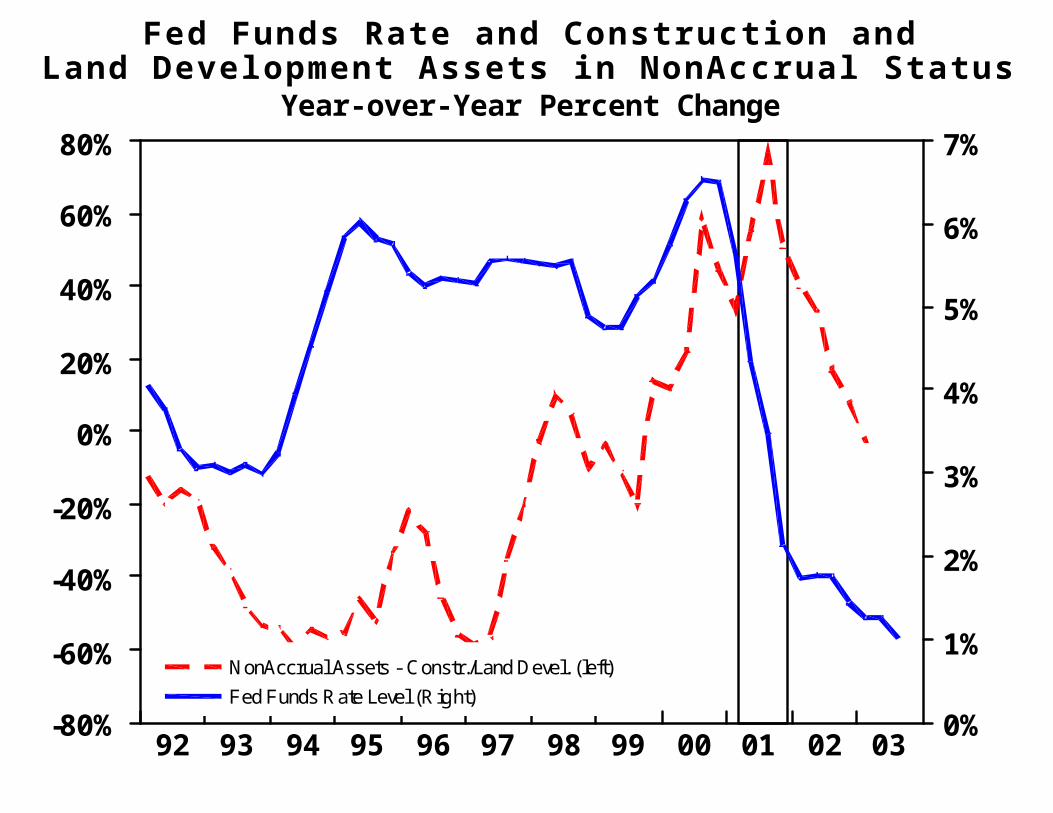
Fed Funds Rate and Construction andLand Development Assets in NonAccrual Status
Year-over-Year Percent Change
NonAccrual Assets - Constr./Land Devel. (left)Fed Funds Rate Level (Right)

030201009998979695949392
400%
300%
200%
100%
0%
-100%
-200%
5%
4%
3%
2%
1%
0%
-1%
Real GDP and Construction/Land Development Charge-OffsYr/Yr % Change
Construction & Land Develop. Charge-Offs (left)Real GDP (Right)

030201009998979695949392
60%
40%
20%
0%
-20%
-40%
-60%
-80%
5%
4%
3%
2%
1%
0%
-1%
Real GDP and Assets Secured by MultifamilyResidential Properties in NonAccrual Status
Yr/Yr % Change
NonAccrual Assets - Multifamily Properties (left)
Real GDP (Right)

0201009998979695949392
$45000
$40000
$35000
$30000
$25000
$20000
$15000
$10000
$5000
7%
6%
5%
4%
3%
2%
1%
0%
Non-Accrual Assets, Federally Chartered Commercial BanksAssets in Nonaccrual Status Less Debt Securities and Other Assets
Blue line (left) is Non-Accrual Assets, Quarterly, in millions of dollarsGreen line (right) is Fed Funds Rate

0201009998979695949392
$10000
$8000
$6000
$4000
$2000
$0
$10000
$8000
$6000
$4000
$2000
$0
Total and Net Charge-OffsFederally Chartered Commercial Banks
Quarterly, in millions of dollars
Green line is total charge-offs
Blue line is net charge-offs

www.wachovia.com/economics