JOHN D. THOMPSON* statistical theory and study of individual ...
13
JOHN D. THOMPSON* Departments of Epidemiology and Public Health and Industrial Administration, ROBERT B. FETTER Yale University THE ECONOMICS OF THE MATERNITY SERVICEt The relationship between the size of a hospital, as measured by its average daily census, and the percentage occupancy of its beds has fascinated students in hospital planning and administration for many years. A further extension of this relationship to include the cost of operating that bed reveals the importance of this inter-connection. If, indeed, the factor of the size in small hospitals results of itself in a low percentage of occupancy and consequently, in high operating costs, then this relationship is not only fascinating but should be understood as a basic determinant of hospital economics. One of the first major discussions of this relationship appeared in Hospital Care In The United States where C. H. Hamilton not only isolated and described the occurrence of lower occupancy in smaller hospitals but advanced a theory to explain it.' When Dr. Hamilton stated, "Both statistical theory and study of individual hospital data indicate that the extreme limit of occupied beds will not be greater or less than the average daily census plus or minus approximately four times the square root of the average daily census," he assumed the year's daily census followed a Poisson distribution. This inference can be drawn even though it was stated that "the daily number of beds occupied will follow the normal curve." The reason for this inference is that for a Poisson distribution the mean is equal to the variance and since the square root of the variance is the standard deviation, the above formula puts the limits of occupancy at four standard deviations from the average daily census. In accepting the Poisson distribution of daily census, we are accepting a whole series of suppositions but weakly demonstrated by the Commission * Associate Professor of Hospital Administration, Department of Epidemiology and Public Health. ** Professor of Industrial Administration. f This work has been supported in part by Grant W-53C of the United States Public Health Service. Computations were carried out both at the Yale Computer Center and at the M.I.T. Computer Center. Received for publication 22 March 1963. 91
Transcript of JOHN D. THOMPSON* statistical theory and study of individual ...
JOHN D. THOMPSON* Departments of Epidemiology and PublicHealth and Industrial Administration,ROBERT B. FETTER Yale University
THE ECONOMICS OF THE MATERNITY SERVICEt
The relationship between the size of a hospital, as measured by its averagedaily census, and the percentage occupancy of its beds has fascinatedstudents in hospital planning and administration for many years. A furtherextension of this relationship to include the cost of operating that bedreveals the importance of this inter-connection. If, indeed, the factor ofthe size in small hospitals results of itself in a low percentage of occupancyand consequently, in high operating costs, then this relationship is not onlyfascinating but should be understood as a basic determinant of hospitaleconomics.One of the first major discussions of this relationship appeared in
Hospital Care In The United States where C. H. Hamilton not only isolatedand described the occurrence of lower occupancy in smaller hospitals butadvanced a theory to explain it.' When Dr. Hamilton stated, "Bothstatistical theory and study of individual hospital data indicate that theextreme limit of occupied beds will not be greater or less than the averagedaily census plus or minus approximately four times the square root of theaverage daily census," he assumed the year's daily census followed aPoisson distribution. This inference can be drawn even though it wasstated that "the daily number of beds occupied will follow the normalcurve." The reason for this inference is that for a Poisson distribution themean is equal to the variance and since the square root of the variance isthe standard deviation, the above formula puts the limits of occupancy atfour standard deviations from the average daily census.
In accepting the Poisson distribution of daily census, we are acceptinga whole series of suppositions but weakly demonstrated by the Commission
* Associate Professor of Hospital Administration, Department of Epidemiology andPublic Health.
** Professor of Industrial Administration.f This work has been supported in part by Grant W-53C of the United States
Public Health Service. Computations were carried out both at the Yale ComputerCenter and at the M.I.T. Computer Center.Received for publication 22 March 1963.
91

YALE JOURNAL OF BIOLOGY AND MEDICINE
and considered rather shaky in the light of present hospital practice. It isassumed that every admission to the hospital is a random occurrence thatis independent of every other admission. This eliminates scheduled admis-sions and waiting lists for nonemergency elective admissions. Anothersupposition made in accepting a Poisson distribution of hospital census isthat all patients' lengths of stay follow a single negative exponentialdistribution. This also does not withstand examination.
If a Poisson distribution is used as an indicator of bed needs, theresult is ultra conservative when it is hypothesized that the extreme limitof the occupied beds will not be greater or less than four standard deviationsfrom the average census. For any average census, this would imply aservice failure with a probability much less than 0.001. Solving the formulac+ 4 /c for various numbers of beds, the percentage of occupancy expectedon this assumption can be determined.The result of such a mathematical projection demonstrates that an 80
per cent occupancy is not reached until somewhere between 300 and400 beds are used in the formula. Such a mathematical projection doesillustrate the fact that smaller institutions will tend to have a loweroccupancy than larger institutions but is in no way predictive in newsituations for which only population characteristics are known. What isprobably true is that hospitals are a "mixed" system, responding in partto several random demands, and in part to some level of schedulabledemand. Such a theory would explain the difference in distributions ofoccupancy between various clinical services in a hospital. Obstetricsprobably is more "random" than medicine, which is more "random" thansurgery. Expected occupancy levels would vary inversely with this "degreeof randomness."The basis for this conceptual model of the hospital was advanced in
less exact terms in a paper covering the first aspects of this investigation.2Blumberge clarified the approach in isolating the probable different inputsto each "Distinctive Patient Facility." While this latter paper was primarilyconcerned with the prediction of bed needs, the possible economic impli-cations of these various inputs was also mentioned.The purpose of this investigation is to demonstrate not only that the
size of the obstetrical service (as measured by number of patients dis-charged) affects its average occupancy, but also to show the effect of size interms of direct costs of operation and investment costs.
92
Volume 36, August 1963

Economics of maternity service I THOMPSON, FETTER
RELATIONSHIP BETWEEN SIZE OF MATERNITY SERVICE AND AVERAGE OCCUPANCY
The character of the prediction problem may be observed if one attemptsanalysis using past experience. Table 1 (A, B, C) divides the 33 hospitalsin Connecticut with obstetrical services into three groups according to thenumber of obstetrical discharges, Group I having over 2,000 dischargesa year, Group II discharging from 1,000 to 2,000 obstetrical patients ayear, and Group III having under 1,000 discharges a year.
TABLE 1 (A). GROUP I HOSPITALS (OvER 2,000 DISCHARGES PER YEAR)MATERNITY SERVICE STATISTICS AND SELECTED FINANCIAL STATISTICS
Avg. Beds re- DirectAverage beds in quired, cost
Dis- Patient days Per cent comple- using of routine Net gainHospital charges days stay occupancy ment 3VA.C. services or loss
I-1 6,275 30,758 4.902 73.3% 115 112 $5.20 ($1.80)I-2 5,503 25,356 4,608 73.9% 94 94 $6.10 $4.20I-3 3,592 14,165 3.943 66.9% 58 57 $4.33 $12.79I-4 3,503 16,676 4.760 68.2% 67 66 $7.44 ($2.35)I-5 3,292 13,039 3.961 74.4% 48 54 $8.60 $3.82I-6 2,685 12,058 4.491 62.3% 53 50 $6.36 ($ .05)I-7 2,671 12,011 4.497 71.5% 46 50 $7.13 ($1.84)I-8 2,406 10,727 4.458 77.3% 38 50 $5.91 $2.04I-9 2,289 9,047 3.952 63.6% 39 40 $7.22 ($2.31)I-10 2,158 10,608 4.916 72.7% 40 45 $5.46 $1.07
Weightedaverage 4.493 70.6% $6.22 $1.51
Column five demonstrates the variation in average per cent of occupancyin the three groups, ranging from 70.6 per cent in Group I and 59.9 per centin Group II to 43.6 per cent in Group III. The hospitals are consideredby group to determine whether or not this rather marked difference inaverages is significant in Table 2, which shows the number of hospitalsabove and below the median per cent occupancy (62.3%o).
Subjecting these figures to Fishers' Exact Test reveals that the per-centages of occupancy of hospitals in Group III were significantly lowerthan those in Group II or Group I. Further the hospitals in Group IIhad significantly lower occupancies than the larger maternity servicesin Group I. The size of a maternity service would seem, at first comparison,to affect the percentage of occupancy.
93

YALE JOURNAL OF BIOLOGY AND MEDICINE
TABLE 1 (B). GROUP II HOSPITALS (FROM 1,000 To 2,000 DISCHARGES PER YEAR)MATERNITY SERVICE STATISTICS AND SELECTED FINANCIAL STATISTICS
Avg. Beds re- DirectAverage beds in quired, cost
Dis- Patient days Per cent comple- using of routine Net gainHospital charges days stay occupancy ment 3,VA.C. services or loss
II-1 1,949 8,969 4.602 53.4% 46 39 $4.71 ($1.50)II-2 1,778 6,771 3.808 64.0% 29 31 $8.51 $1.95II-3 1,775 7,022 3.956 66.3% 29 32 $7.67 $3.10II-4 1,725 7,751 4.493 75.8% 28 35 $8.08 $4.14II-5 1,685 6,759 4.011 50.0% 37 31 $4.32 ($ .99)II-6 1,609 6,229 3.871 71.1% 24 29 $6.32 $1.47II-7 1,472 6,416 4.359 53.3% 33 30 $8.39 ($4.26)II-8 1,393 8,282 5.945 54.0% 42 37 $6.99 ($5.31)II-9 1,360 6,914 5.084 65.3% 29 32 $7.05 ($3.44)II-10 1,300 8,155 6.273 79.8% 28 37 $8.42 ($2.36)II-11 1,210 5,058 4.180 57.7% 24 25 $4.51 $3.88II-12 1,161 4,764 4.103 42.1% 31 24 $9.12 ($6.82)
Weightedaverage 4.512 59.9% $6.97 ($ .86)
TABLE 1 (C). GROUP III HOSPITALS (UNDER 1,000 DISCHARGES PER YEAR)MATERNITY SERVICE STATISTICS AND SELECTED FINANCIAL STATISTICS
Avg. Beds re- DirectAverage beds in quired, cost
Dis- Patient days Per cent comple- using of routine Net gainHospital charges days stay occupancy ment 3 VA.C. services or loss
III-1 987 4,057 4.107 42.7% 26 21 $12.68 ($13.45)111-2 906 3,989 4.403 42.9% 25 21 $6.40 ($4.01)III-3 903 3,426 3.794 40.8% 23 19 $10.62 ($6.82)III-4 806 3,468 4.303 52.8% 18 19 $11.40 ($4.12)III-5 764 2,113 2.766 57.9% 10 13 $12.71 ($7.00)III-6 639 2,814 4.404 77.1% 10 16 $9.14 $ .36III-7 570 2,528 4.345 49.5% 14 15 $9.09 ($7.76)III-8 458 1,790 3.908 40.1% 12 12 $6.13 ($4.74)III-9 396 1,689 4.265 46.3% 10 11 $18.51 ($18.08)III-10 338 1,491 4.411 40.8% 10 10 $5.66 ($5.57)III-11 329 1,344 4.085 26.3% 14 9 $13.67 ($21.66)
Weightedaverage 3.856 43.6%o $10.55 ($7.97)
94
Volume 36, August 1963

Economics of maternity service THOMPSON, FETTER
There are two factors other than size of these hospitals which maycontribute to these differences in occupancy: the average length of stayand the supply of beds relative to the demand. The first of these is includedin column four of Table 1, and though the average length of stay variesfrom 2.8 days in Hospital III-5 to 6.3 days in Hospital II-10, there is nosignificant difference in the average lengths of stay among the hospitalsconsidered as groups. When the occupancy is corrected for length of stay,there is still a significant difference between the percentage occupancy ofhospitals in Group I and Group II and between Group I and Group III.The only difference between the raw and corrected occupancy rates isthat the significant difference in the comparison between hospitals in
TABLE 2. DISTRIBUTION OF INDIVIDUAL HOSPITALS BY GROUP-ABOVE ANDBELow MEDIAN OCCUPANCY RATE (62.3% IN HOSPITAL I-6)
Group I Group II Group III Total
Occupancy above 62.3% 9 6 1 16Occupancy below 62.3% 0 6 10 16
9 12 11 32
Group II and Group III disappears. The original observation that smallermaternity services have lower occupancy rates still stands when the datais corrected for average stay.
It is almost impossible with the data available to measure the supplyof beds relative to the demand for obstetrical facilities much less to predictthe facilities required for any level of service. The only way any informationof this kind could be obtained at all would be a comparative count of thedays within a given year when all the beds were occupied in each of thehospitals. Even this would not allow effective prediction of facility eco-nomics. Other measurements of bed utilization such as discharges per bedare affected by the per cent of occupancy (the factor to be isolated) andthe average length of stay-the factor already considered. The only measure-ment possible with the data available-and it, too, contains some elementsof the above factors-was to determine whether the size of each maternityservice equals its average census plus three times the square root of itsaverage census. A breakdown of the way hospitals in the three groupssatisfied this criterion is contained in Table 3.As can be seen from this chart the hospitals in the various size groups
do not differ significantly in meeting this criterion. The criterion in fact
95.
YALE JOURNAL OF BIOLOGY AND MEDICINE
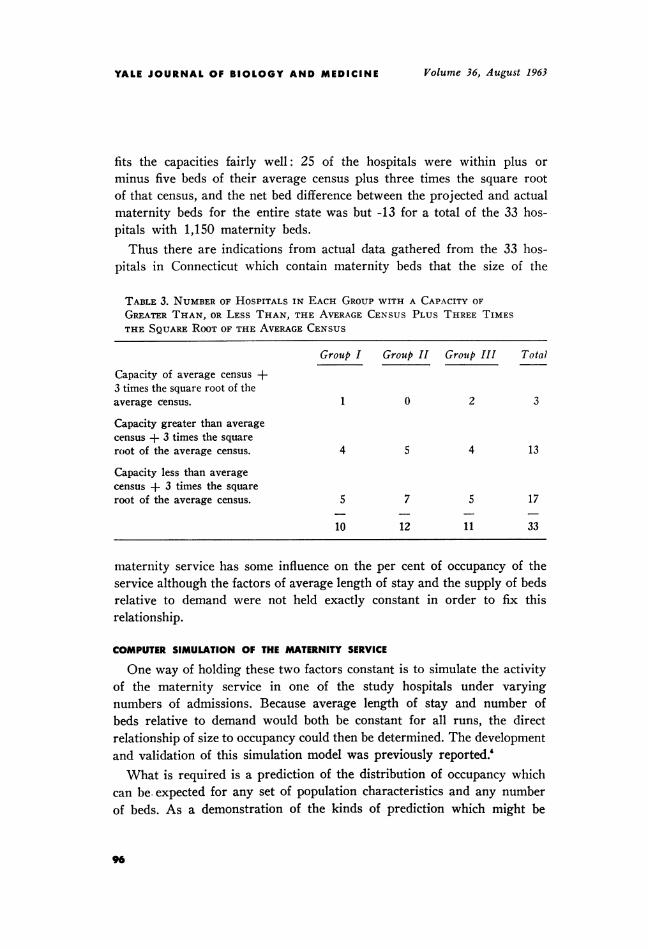
fits the capacities fairly well: 25 of the hospitals were within plus orminus five beds of their average census plus three times the square rootof that census, and the net bed difference between the projected and actualmaternity beds for the entire state was but -13 for a total of the 33 hos-pitals with 1,150 maternity beds.Thus there are indications from actual data gathered from the 33 hos-
pitals in Connecticut which contain maternity beds that the size of the
TABLE 3. NUMBER OF HOSPITALS IN EACH GROUP WITH A CAPACITY OFGREATER THAN, OR LESS THAN, THE AVERAGE CENSUS PLUS THREE TIMESTHE SQUARE ROOT OF THE AVERAGE CENSUS
Group I Group II Groutp III Total
Capacity of average census +3 times the square root of theaverage census. 1 0 2 3
Capacity greater than averagecensus + 3 times the squareroot of the average census. 4 5 4 13
Capacity less than averagecensus + 3 times the squareroot of the average census. 5 7 5 17
10 12 11 33
maternity service has some influence on the per cent of occupancy of theservice although the factors of average length of stay and the supply of bedsrelative to demand were not held exactly constant in order to fix thisrelationship.
COMPUTER SIMULATION OF THE MATERNITY SERVICE
One way of holding these two factors constant is to simulate the activityof the maternity service in one of the study hospitals under varyingnumbers of admissions. Because average length of stay and number ofbeds relative to demand would both be constant for all runs, the directrelationship of size to occupancy could then be determined. The developmentand validation of this simulation model was previously reported.'What is required is a prediction of the distribution of occupancy which
can be. expected for any set of population characteristics and any numberof beds. As a demonstration of the kinds of prediction which might be
96
Volume 36, August 1963
Economics of maternity service I THOMPSON, FETTER
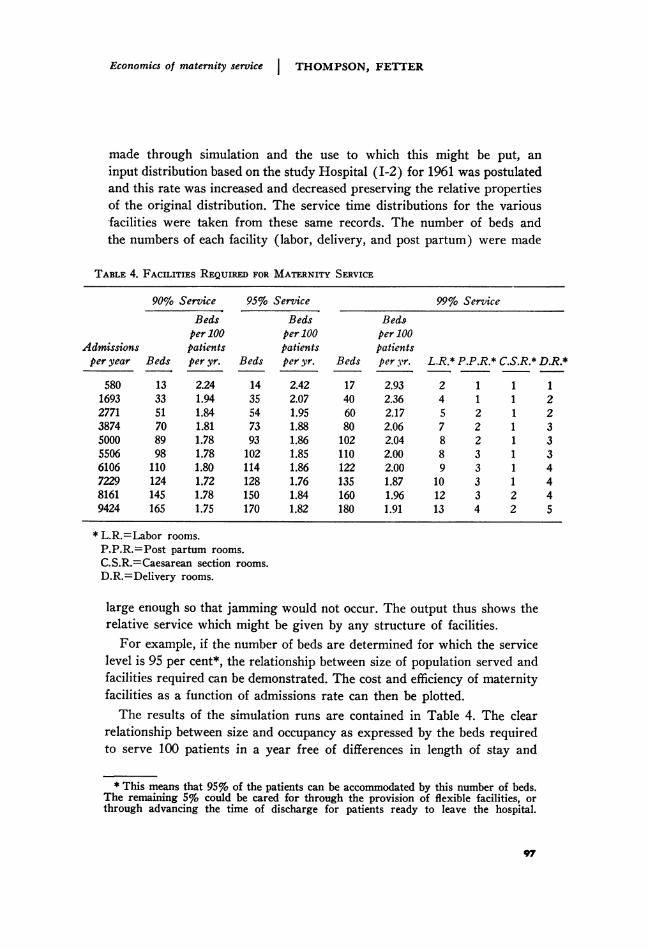
made through simulation and the use to which this might be put, aninput distribution based on the study Hospital (I-2) for 1961 was postulatedand this rate was increased and decreased preserving the relative propertiesof the original distribution. The service time distributions for the variousfacilities were taken from these same records. The number of beds andthe numbers of each facility (labor, delivery, and post partum) were made
TABLE 4. FACILITIEs REQUIRED FOR MATERNITY SERVICE
90% Service 95% Service 99% ServiceBeds Beds Beds
per 100 per 100 per 100Admissions patients patients patientsper year Beds per yr. Beds per yr. Beds per yr. L.R.* P.P.R.* C.S.R.* D.R.*
580 13 2.24 14 2.42 17 2.93 2 1 1 11693 33 1.94 35 2.07 40 2.36 4 1 1 22771 51 1.84 54 1.95 60 2.17 5 2 1 23874 70 1.81 73 1.88 80 2.06 7 2 1 35000 89 1.78 93 1.86 102 2.04 8 2 1 35506 98 1.78 102 1.85 110 2.00 8 3 1 36106 110 1.80 114 1.86 122 2.00 9 3 1 47229 124 1.72 128 1.76 135 1.87 10 3 1 48161 145 1.78 150 1.84 160 1.96 12 3 2 49424 165 1.75 170 1.82 180 1.91 13 4 2 5
* L.R.=Labor rooms.P.P.R.=Post partum rooms.C.S.R.=Caesarean section rooms.D.R.=Delivery rooms.
large enough so that jamming would not occur. The output thus shows therelative service which might be given by any structure of facilities.For example, if the number of beds are determined for which the service
level is 95 per cent*, the relationship between size of population served andfacilities required can be demonstrated. The cost and efficiency of maternityfacilities as a function of admissions rate can then be plotted.The results of the simulation runs are contained in Table 4. The clear
relationship between size and occupancy as expressed by the beds requiredto serve 100 patients in a year free of differences in length of stay and
* This means that 95% of the patients can be accommodated by this number of beds.The remaining 5% could be cared for through the provision of flexible facilities, orthrough advancing the time of discharge for patients ready to leave the hospital.
97

YALE JOURNAL OF BIOLOGY AND MEDICINE
supply-demand factors is evident from the graph (Fig. 1). It would seemthat there is little difference in occupancy in maternity services which carefor 4,000 or more births a year, but below that rate the number of bedsper 100 patients per year tends to rise and begins to rise more noticeablybelow 1,800 births a year.
3.0
A CS~~~~~~~.s.
S 95~~~~~~~~~~~~~~~~~~~~~~~~~~~~~~~~~~~~~~~~~% 3,rvz f4; ~~~~~90/. &tc' ^
C p000400 /0000
Acbzaw-so *so 6oo aa nooADMzYsZONs PEEI9
FIG. 1.Relationship between maternity beds required and size of maternity service (for
three service levels).
The difference between the simulated runs and the actual experiencegives us some very interesting technical and economic information con-cerning maternity operations. We can see from Figure 1 that bed invest-ment costs per 100 patients served level off at 4,000 admissions per year butbecome increasingly higher below this level. The number of labor. delivery,and post partum facilities required as a function of admission rate isshown in Table 4, giving us even greater investment requirements for thelower admission rates. Conversely, we discern the point at which sizeceases to pay off in terms of lowered investment cost per patient served.
98
Volume 36, August 1963

Economics of maternity service I THOMPSON, FETTER
RELATIONSHIP BETWEEN SIZE OF MATERNITY SERVICE AND OPERATING COSTS
Operating costs are difficult to isolate but it can at least be inferredstrongly from available data that direct costs per day are more thanproportionally higher for maternity suites serving small populations.The measurement used in evaluating the cost to a community of these
variously sized services was what is called the Direct Cost of RoutineServices for maternity patients. It was felt that this cost as reported inConnecticut was the "cleanest" figure obtainable, uninfluenced by variablessuch as interest charges, overhead allocation or varying patterns of specialservice utilization. Furthermore, when Direct Cost of Routine Services
TABLE 5. DISTRIBUTION OF INDIVIDUAL HOSPITALS DIRECT COST OF ROUTINESERvIcES BY GROUP ABOVE AND BELOW MEDIAN(MEDIAN COST $7.22 IN HOSPITAL I-9)
Group I Group II Group III TotalDirect cost of routine services:Above $7.22 2 6 8 16Below $7.22 7 6 3 16
9 12 11 32
was compared with Hours of Bedside Care, the correlation is +.957,close enough to imply that the Direct Costs of Routine Care reflect thatpart of cost tied to the labor costs in the actual operation of the maternityin-patient unit.The corrected average Direct Cost of Routine Services for the 33
hospitals is $6.94 per patient day. The average costs for Group I hospitalsis $6.22, for Group II hospitals $6.97, and for Group III, $10.55, adifference between the two end classes of $4.33 or, as a percentage ofGroup I costs, Group III hospitals cost 69.6 per cent more per patientday than do those in Group I.When these costs are submitted to the same analysis by individual hos-
pitals as was done for occupancy, Table 5 results.Though differences in each hospital by group are not as marked as in
some of the previous charts, there is a significant difference between thecosts of Group I and Group III. This evidence coupled with the differencesin average group costs warrant the conclusion that size of unit affects notonly investment costs but the direct cost of operating that unit as well.
99

YALE JOURNAL OF BIOLOGY AND MEDICINE
Though total per diem costs were considered as having within them toomany components to reflect the economic relationships between size,occupancy and costs, total costs and revenue can be used to indicate themagnitude of the problem. The corrected average total cost per diem forthe 33 hospitals was approximately $37.77 while the average income perpatient day was $37.46, indicating an operating loss of $0.31 a patient day.When the hospitals are examined by group, however, a different pictureemerges. Group I hospitals on the average profited at $1.51 a patient dayon maternity patients while Groups II and III lost money on this serviceat the rate of $0.86 and $7.97 a day, respectively. When each hospital's ex-
TABLE 6, DISTRIBuTIoN OF INDIVIDUAL HOSPITALS BY GROUP ABOVE ANDBELow MEDIAN GAIN OR Loss ON MATERNITY SERVICES(MEDIAN Loss $2.31 IN HOSPITAL I-9)
Group I Group II Group III Total
Loss above $2.31 1 5 10 16Loss below $2.31 8 7 1 16
9 13 11 32
perience above and below the median value is compared as in Table 6the by now familiar pattern of differences between the groups againemerges.
It would appear then that not only do maternity services in the smallerhospitals cost more, but they are less able to recover their costs than arethe larger hospitals.
DISCUSSION
The implications of the study are, the authors believe, important forthree reasons: (1) the general increase in our knowledge of basic economicbehavior of a hospital sub-system, (2) the elaboration of a methodology, inthis case computer simulation which enables the researcher to study theproblem free from the inadequacies shown earlier in empirical information,and (3) the practical application of the results in hospital planning andadministration.The first and most obvious application of these principles lies in the
area of planning for maternity services. Thirteen of the 33 hospitals inConnecticut were situated in six cities, five cities having two hospitals andone city having three hospitals. When these multiple hospital towns are
100
Volume 36, August 1963
Economics of maternity service THOMPSON, FETTER
compared with our predictions of what are economically feasible services,some rather startling results emerge. In one city there was a Group IIhospital with a 37-bed maternity unit of a marginal size economically, butsince the service was required by the Community it had to be provided.However, very shortly after the war, a second hospital was built in thissame town with a 10-bed unit and as a consequence at last reports the10-bed unit was operating at a 77.1 per cent occupancy while the 37-bedunit was operating at a 50 per cent occupancy.* These two units are
TABLE 7. COMPARISON OF REQUIREMENTS FOR ONE CENTRALIZED VS.THREE DECENTRALIZED MATERNITY SERVICES
Post Caesar.Labor partum section Delivery
Beds rooms rooms rooms rooms
Required for 1,300 to 1,400admissions per year 30 3 1 1 2
30 3 1 1 230 3 1 1 2
Total facilities for threeseparate maternity units 90 9 3 3 6
Required for 3,900 to 4,200admissions per year 75 7 2 1 3
maintained at an enormous cost to the community. It would have been farmore economical to have concentrated all the maternity beds the town re-quired in the one unit. Predictions of the kind made by the simulator wouldhave allowed the direct pricing of these alternatives.
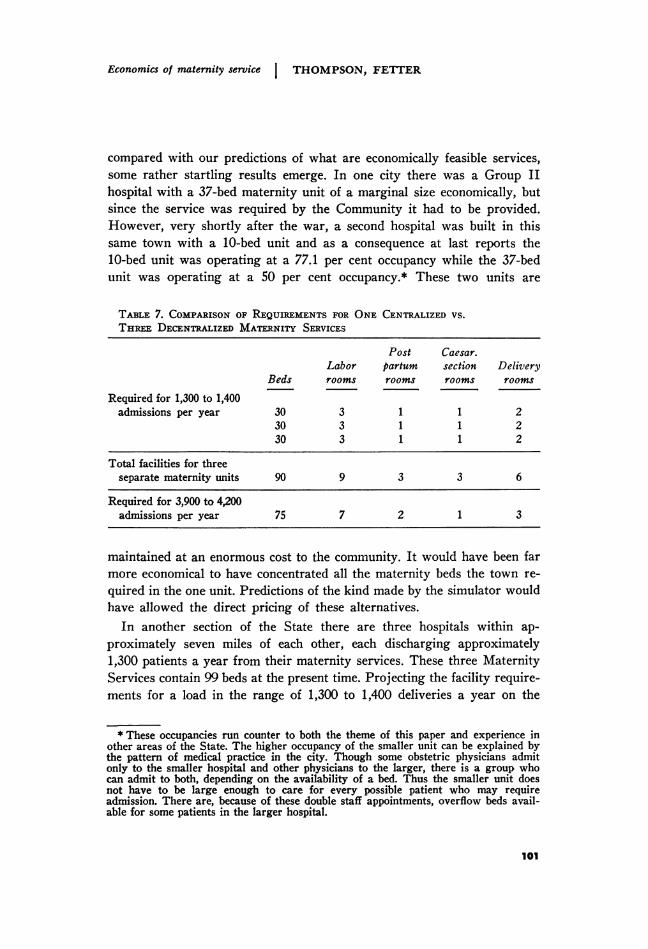
In another section of the State there are three hospitals within ap-proximately seven miles of each other, each discharging approximately1,300 patients a year from their maternity services. These three MaternityServices contain 99 beds at the present time. Projecting the facility require-ments for a load in the range of 1,300 to 1,400 deliveries a year on the
* These occupancies run counter to both the theme of this paper and experience inother areas of the State. The higher occupancy of the smaller unit can be explained bythe pattern of medical practice in the city. Though some obstetric physicians admitonly to the smaller hospital and other physicians to the larger, there is a group whocan admit to both, depending on the availability of a bed. Thus the smaller unit doesnot have to be large enough to care for every possible patient who may requireadmission. There are, because of these double staff appointments, overflow beds avail-able for some patients in the larger hospital.
101
YALE JOURNAL OF BIOLOGY AND MEDICINE
simulator and comparing three such units with the facilities required fora single Maternity Service serving from 3,900 to 4,200 admissions a yearresults in the data of Table 7. This Table demonstrates not only that sub-stantial personnel savings can be anticipated by operating one unit insteadof three, but that fewer beds serving a larger population would result inhigher occupancy. In addition, the Delivery Suite requirements in thesingle unit are significantly less than would be necessary for the threeservices operating independently. It is important to recognize that theservice given by these alternatives is at the same level.With information of the kind obtained from this model the unnecessary,
expensive duplication of maternity beds in a community, especially whenmultiple units will result in each of them being of an uneconomic size, canbe costed for the community's knowledge, and perhaps if costs had beenstated in these terms different kinds of facilities might well have been con-structed. When this is coupled with the strong implication drawn regard-ing direct operating costs for services designed for patient populations ofabout 1,000 per year, the economics seem to us persuasive.
But what of those hospitals which must have small obstetrical servicessimply because they are the only hospital in the community? Is there anyway to free their obstetrical utilization from this Poisson-like prison ofrandom demand, low occupancy and high costs? The artificial isolationof obstetrical beds from the beds in other services not only results in lowservice occupancy, but may result in waiting lists in surgery, for example,because empty obstetrical beds cannot be utilized for the surgical patients.
If such isolation is required for medical reasons then the cost of such apolicy is one the community must bear. If, however, this random system isbeing maintained because of out-moded regulations which no longer apply,this study demonstrates the cost of such regulations. Is it not time to inquireinto the validity of the medical reasons dictating the practice that non-maternity patients can not be treated in the maternity service? The sub-stitution of a "mixed input," part random and part scheduled to thesebeds, could raise their percentage of occupancy. In these days of increasinghospital costs is it not necessary to consider every possible alternativewhich might result in more efficient utilization of all hospital beds witha consequent decrease in cost per patient day?
CONCLUSIONS
We feel strongly that computer models of the kind described in this reportcan and should play an important role in hospital administration. That the
102
Volume 36, August 1963
Economics of maternity service THOMPSON, FETTER
benefits to be derived for both planning and operations could be reallysignificant can be appreciated only by considering the magnitude of thedollars allocated in our economy to these services. A contribution to theinvestment problem has been demonstrated. Additional contributions canbe made if the approach illustrated here is used by those responsible fordecision making in the design of health services.
ACKNOWLEDGMENT
Research assistance and programming by the following students and staff is grate-fully acknowledged: Miss Katherine Kleemann, Messrs. Clinton McIntosh, RonaldStoerts, Arthur Katz, Bent Rasmussen, Michael Bulkin, Bernard Roederer, andJohn Luber.
REFERENCES
1. Commission on Hospital Care: Hospital Care in the United States. New York,The Commonwealth Fund, 1947.
2. Thompson, J. D., Avant, 0. W., and Spiker, E. D.: How queuing theory worksfor the hospital. Mod. Hosp., March 1960.
3. Blumberg, M. S.: DPF concept helps predict bed needs. Mod. Hosp. December1961.
4. Thompson, J. D. and Fetter, R. B.: Predicting requirements for maternityfacilities. Hospitals, February 16, 1963.
103