

John bruce
29
Modelling dust emissions By John Bruce 1
-
Upload
institution-of-environmental-sciences -
Category
Environment
-
view
171 -
download
0
Transcript of John bruce

Modelling dust emissions
By John Bruce
1
Methods for dust prediction
• Knowledge Transfer Partnership
• Investigation into dust modelling
• Based on primary collected data
• Directional sticky-pad dust collection
• Weather data collected at on site meteorological stations
• First approach using two sites
2
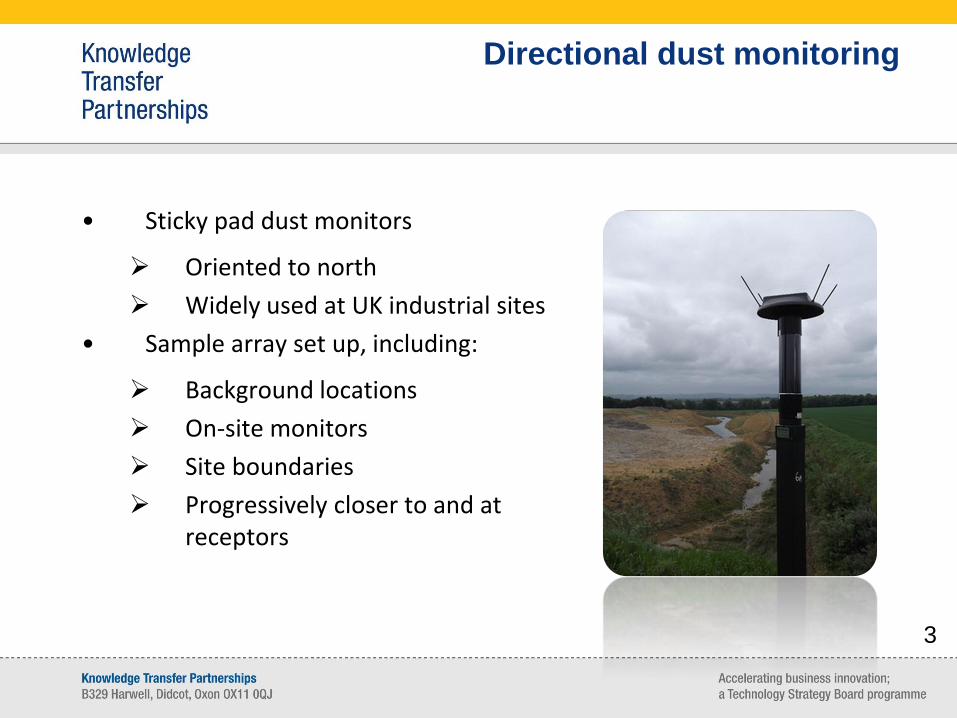
Directional dust monitoring
• Sticky pad dust monitors
Oriented to north
Widely used at UK industrial sites
• Sample array set up, including:
Background locations
On-site monitors
Site boundaries
Progressively closer to and at receptors
3

Directional dust data
• Directional dust samples sealed using transparent film
• Scanned & analysed for directional:
Dust coverage (AAC%)
Dust soiling (EAC%)
• Further analysis possible:
Gravimetry
Mass spectrometry
Particle size analysis
4
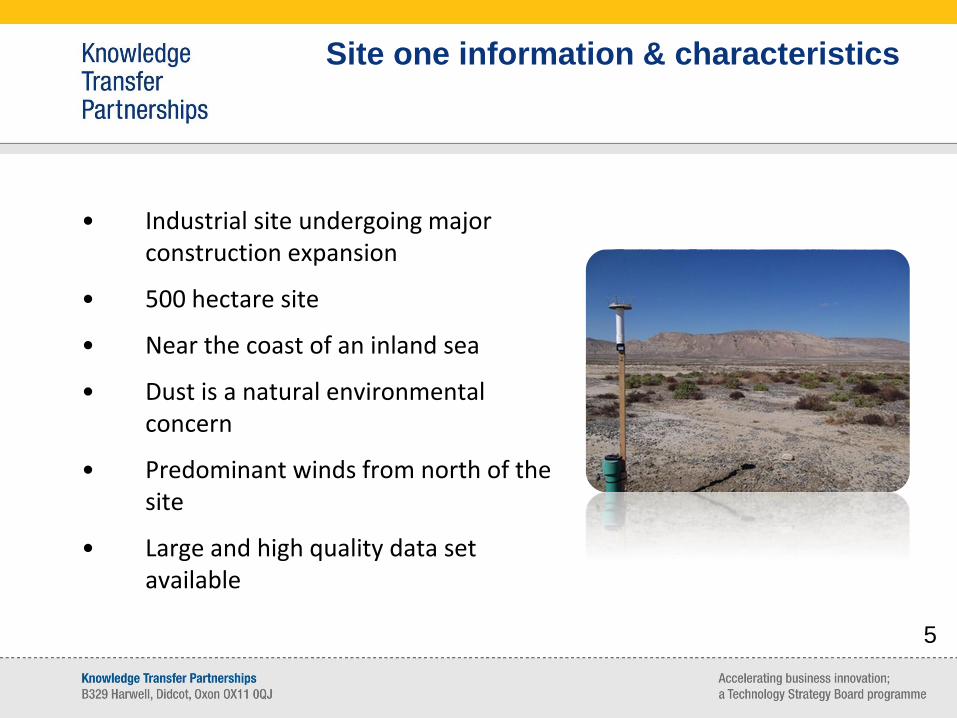
Site one information & characteristics
• Industrial site undergoing major construction expansion
• 500 hectare site
• Near the coast of an inland sea
• Dust is a natural environmental concern
• Predominant winds from north of the site
• Large and high quality data set available
5
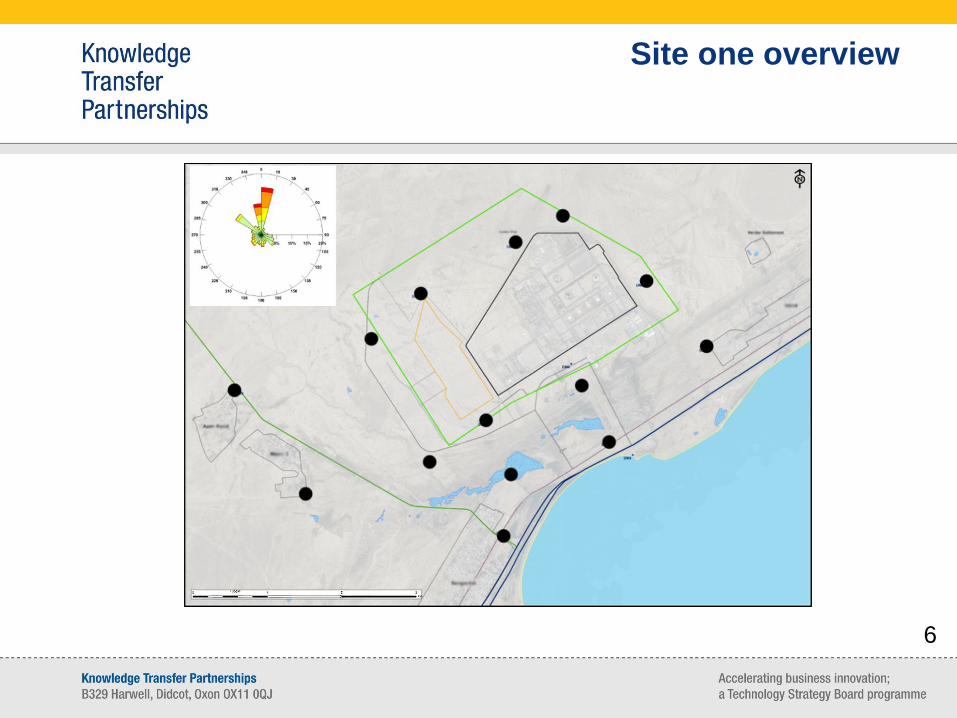
Site one overview
6
Site two information & characteristics
• Site two chosen to contrast to site one
• 10 hectare sand and gravel quarry
• Located in southern England
• Sensitive receptor to the north east
• Considerable existing data
• Flexible dust monitoring available
7
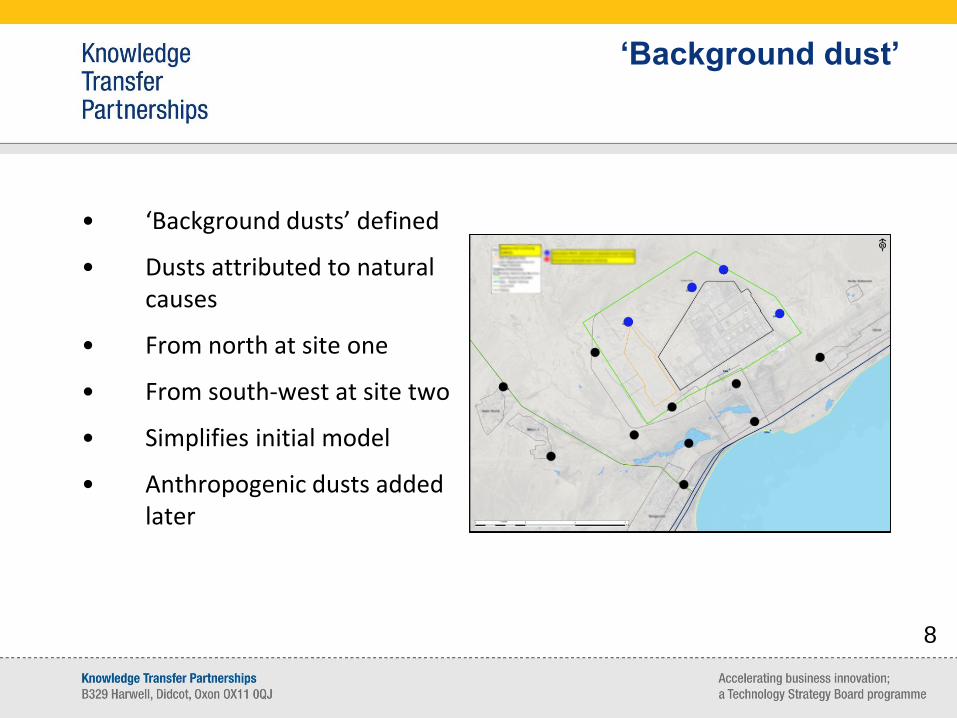
‘Background dust’
• ‘Background dusts’ defined
• Dusts attributed to natural causes
• From north at site one
• From south-west at site two
• Simplifies initial model
• Anthropogenic dusts added later
8
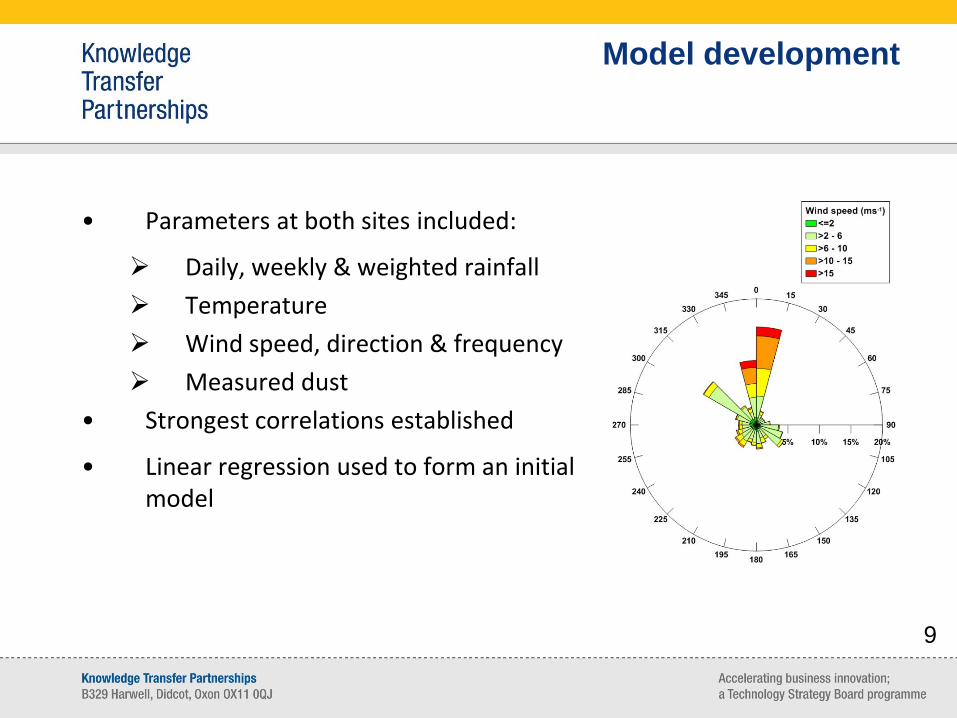
Model development
• Parameters at both sites included:
Daily, weekly & weighted rainfall
Temperature
Wind speed, direction & frequency
Measured dust
• Strongest correlations established
• Linear regression used to form an initial model
9
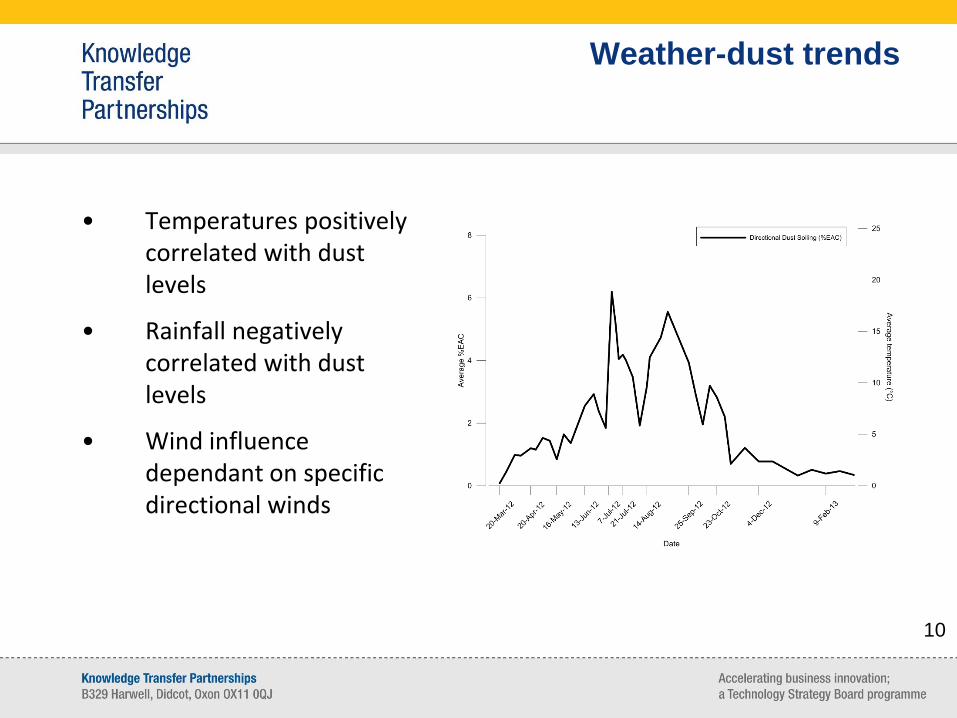
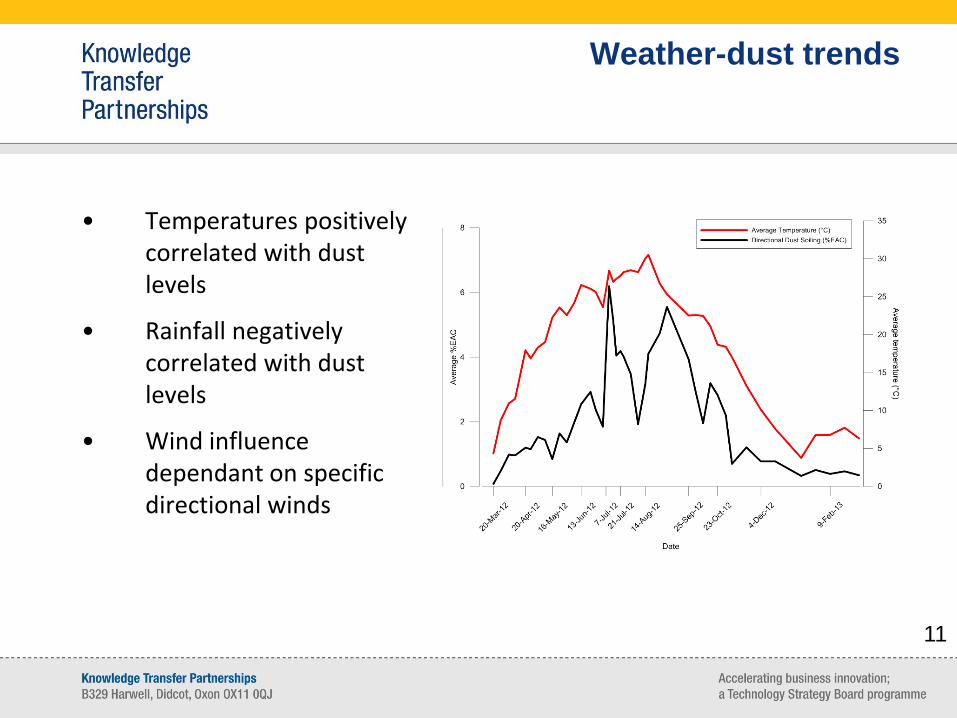
Weather-dust trends
• Temperatures positively correlated with dust levels
• Rainfall negatively correlated with dust levels
• Wind influence dependant on specific directional winds
10
Weather-dust trends
• Temperatures positively correlated with dust levels
• Rainfall negatively correlated with dust levels
• Wind influence dependant on specific directional winds
11
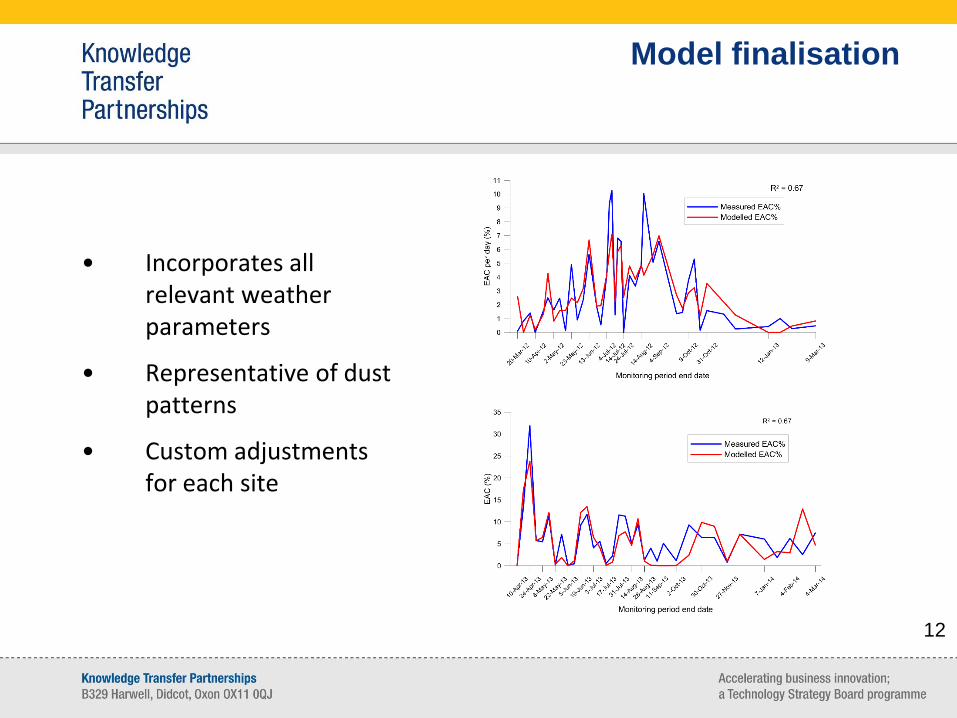
Model finalisation
• Incorporates all relevant weather parameters
• Representative of dust patterns
• Custom adjustments for each site
12
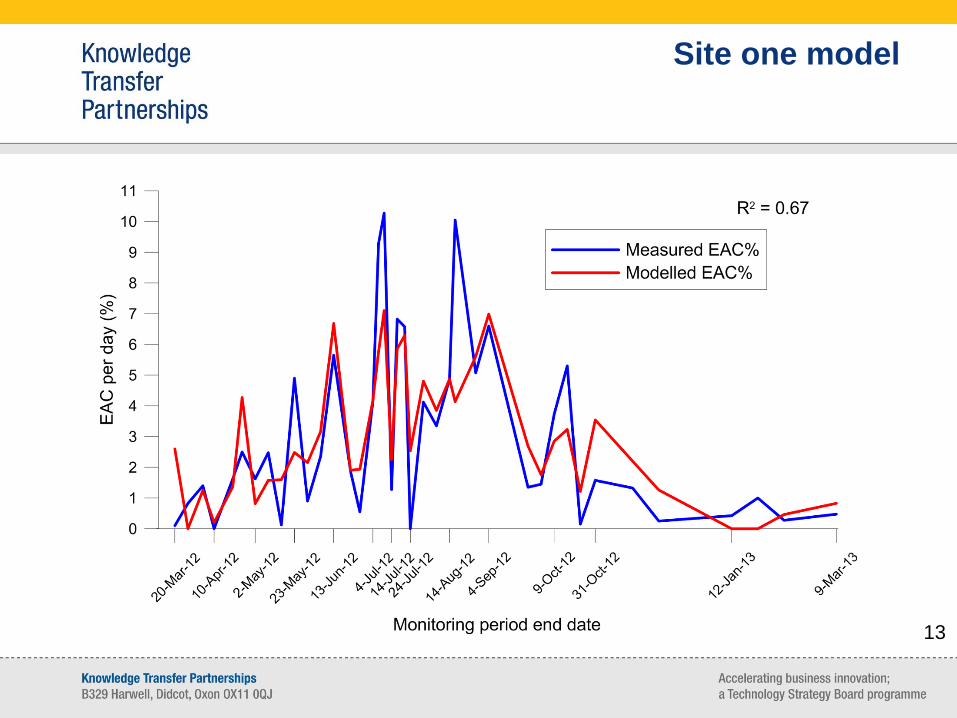
Site one model
13

Site two model
14
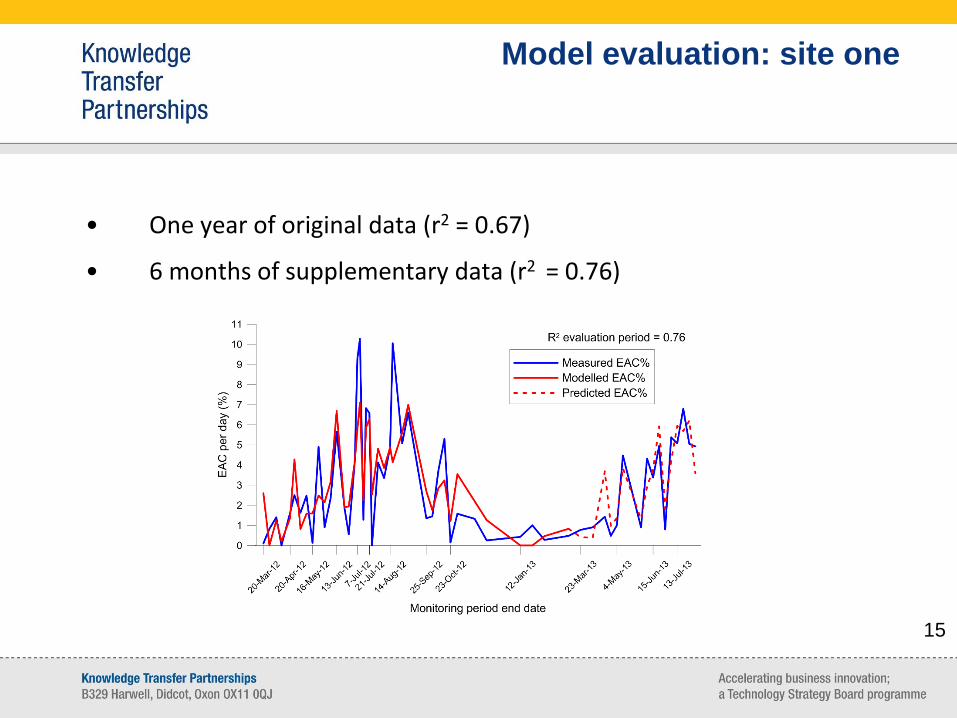
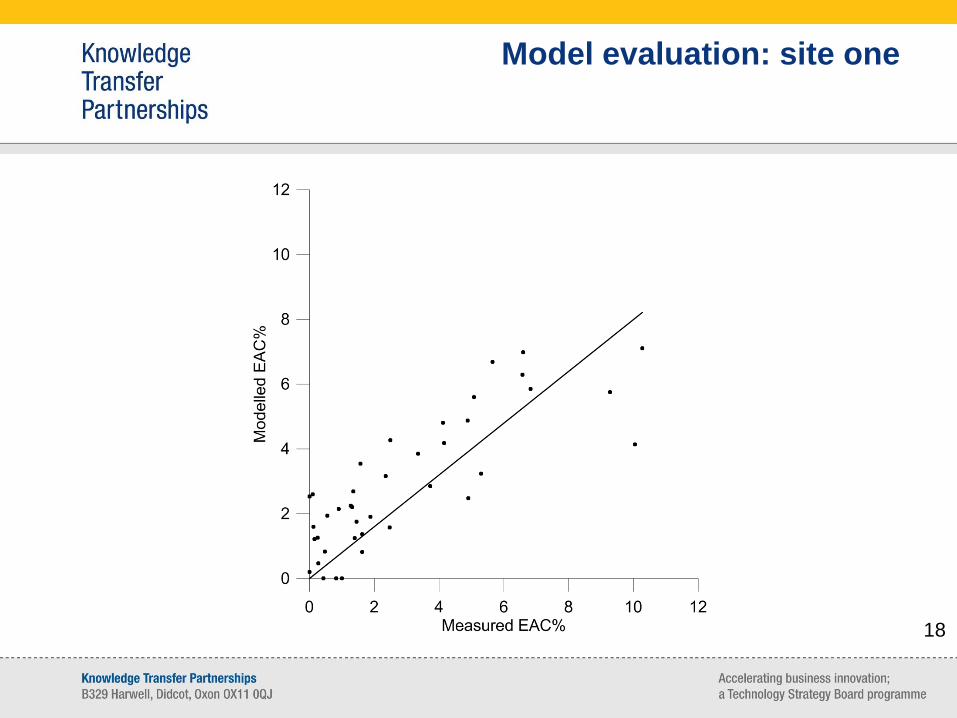
Model evaluation: site one
• One year of original data (r2 = 0.67)
• 6 months of supplementary data (r2 = 0.76)
15

Model evaluation: site one
16

Model evaluation: site one
17
Model evaluation: site one
18

Model evaluation: site one
19
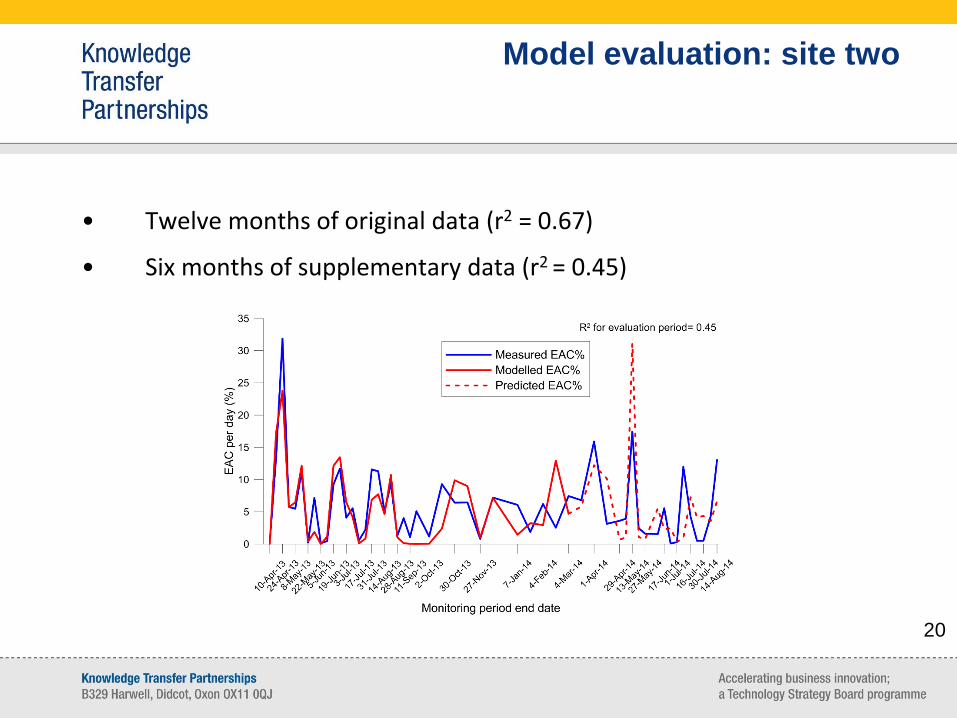
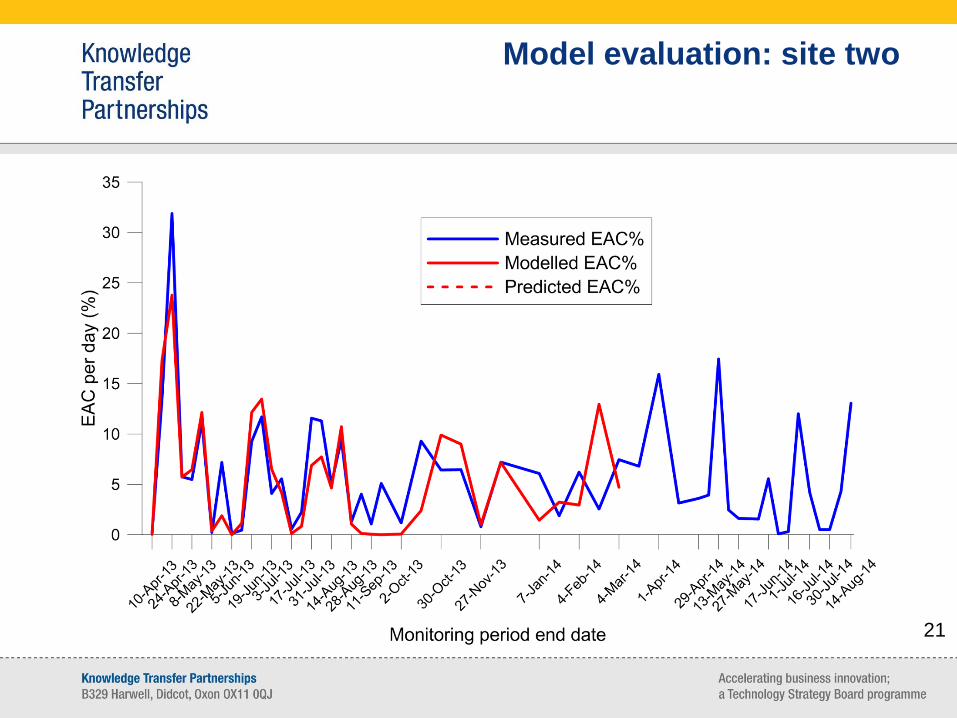
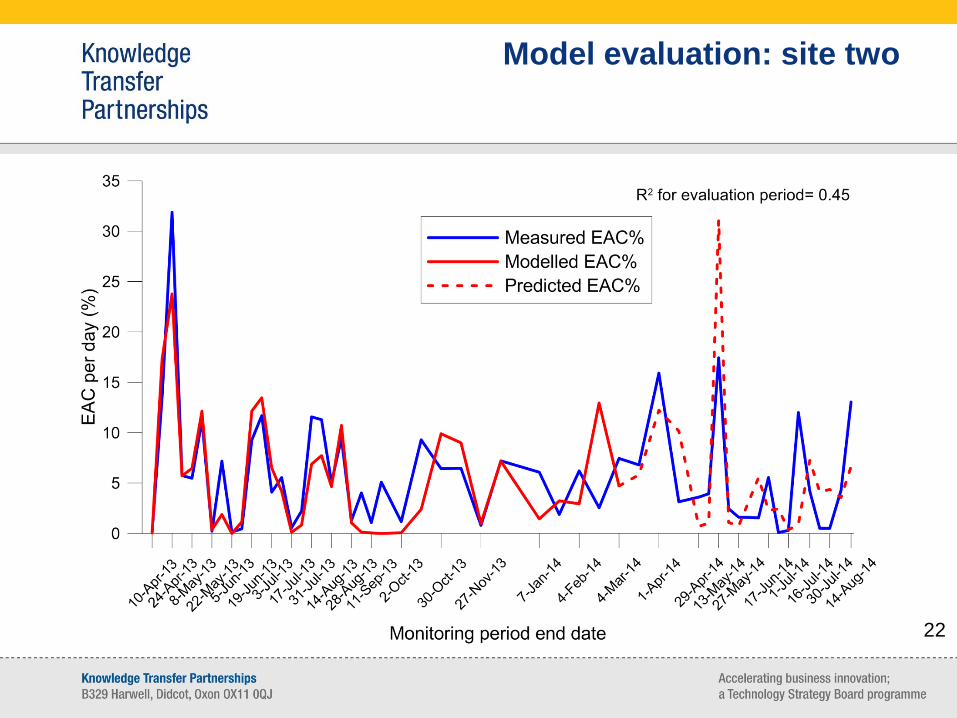
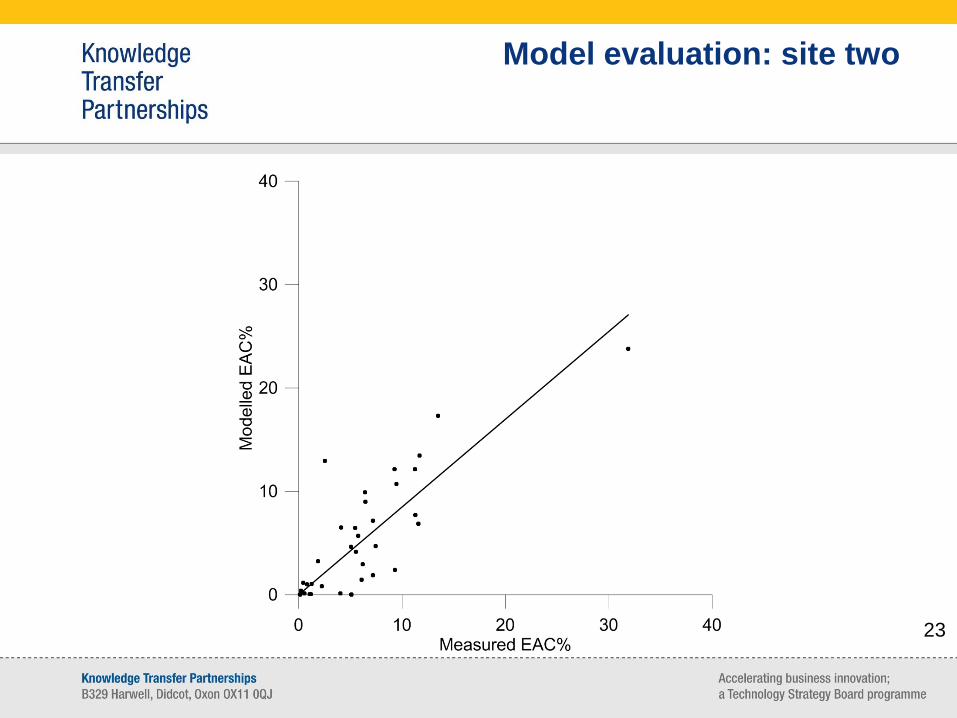
Model evaluation: site two
• Twelve months of original data (r2 = 0.67)
• Six months of supplementary data (r2 = 0.45)
20
Model evaluation: site two
21
Model evaluation: site two
22
Model evaluation: site two
23

Model evaluation: site two
24
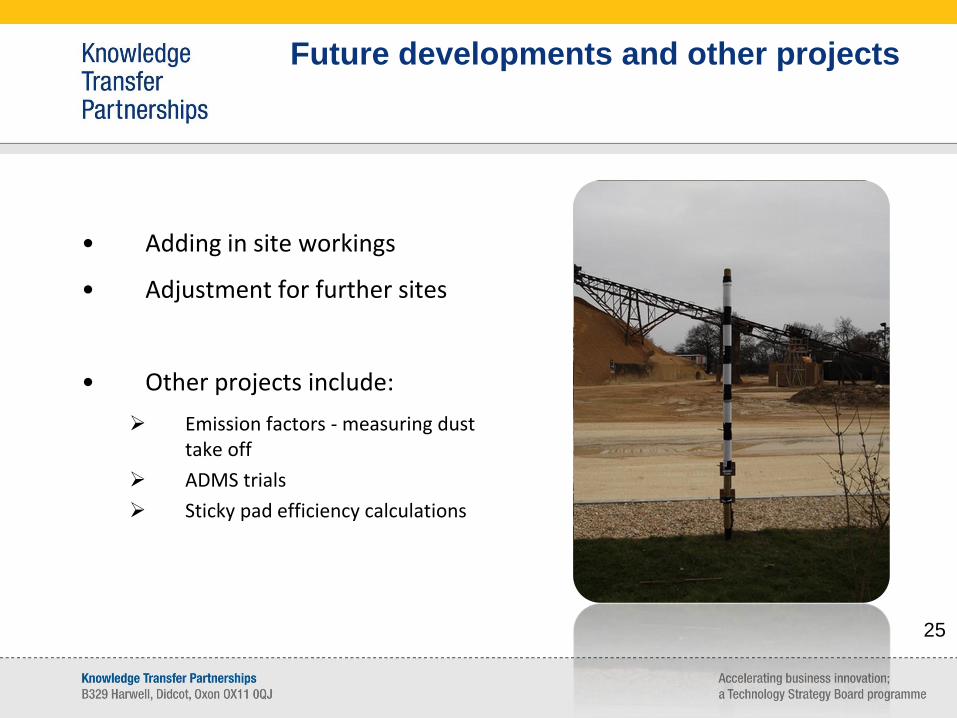
Future developments and other projects
• Adding in site workings
• Adjustment for further sites
• Other projects include:
Emission factors - measuring dust take off
ADMS trials
Sticky pad efficiency calculations
25
Future developments and other projects
• Adding in site workings
• Adjustment for further sites
• Other projects include:
Emission factors - measuring dust take off
ADMS trials
Sticky pad efficiency calculations
26
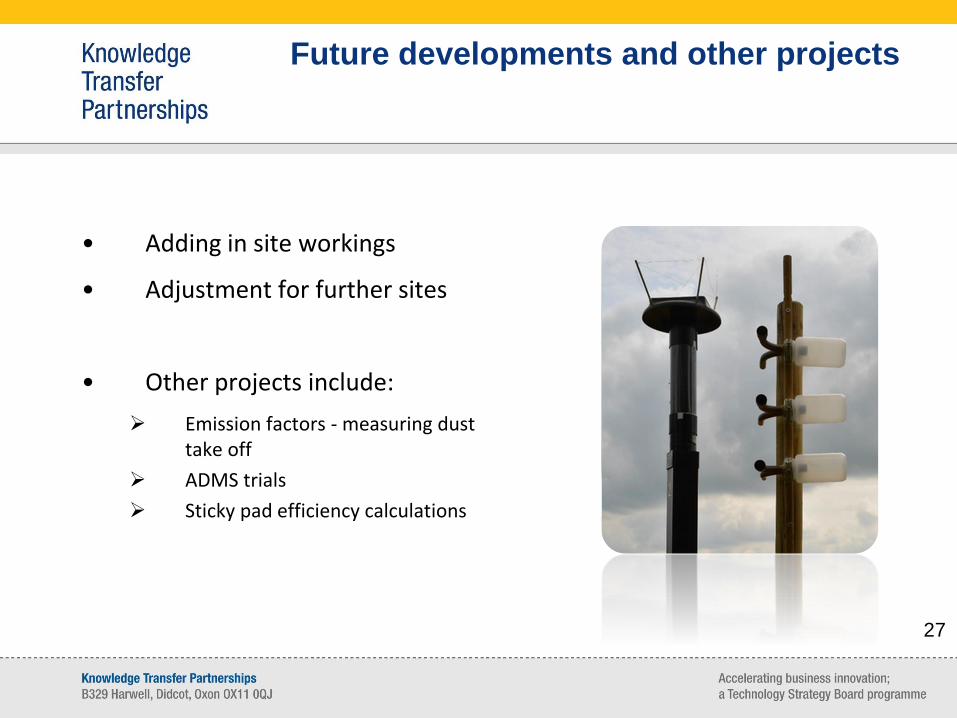
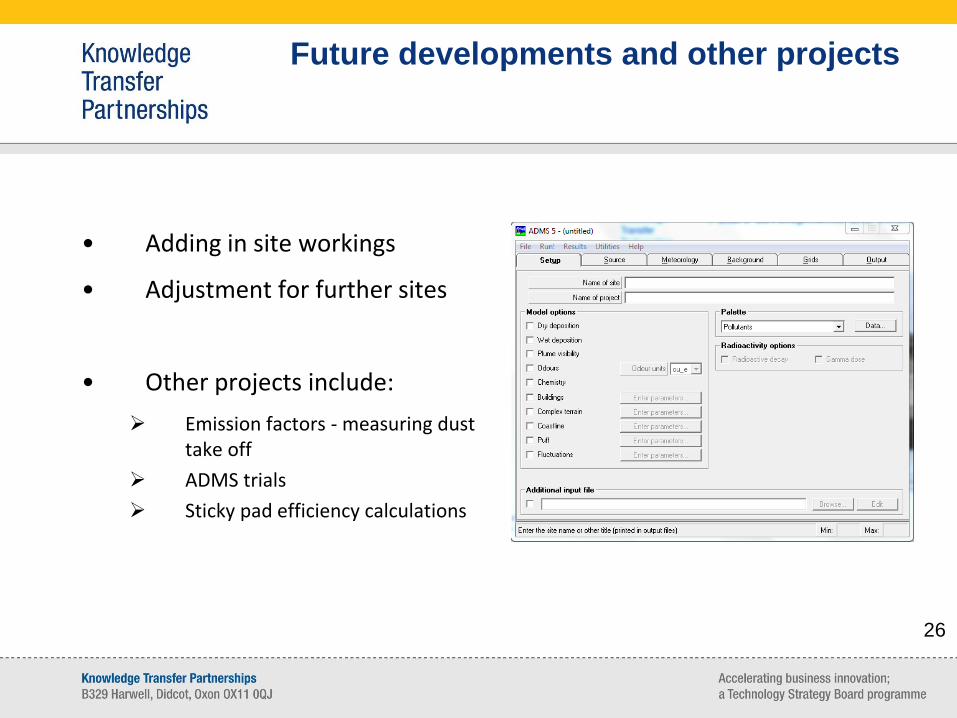
Future developments and other projects
• Adding in site workings
• Adjustment for further sites
• Other projects include:
Emission factors - measuring dust take off
ADMS trials
Sticky pad efficiency calculations
27

Conclusions
• Low cost, modest dust monitoring
• Trends visible for individual sites
• Simple but effective baseline modelling
29