John Archer - Domestic Violencedomestic-violence.martinsewell.com/Archer2002.pdf · Sex differences...
39
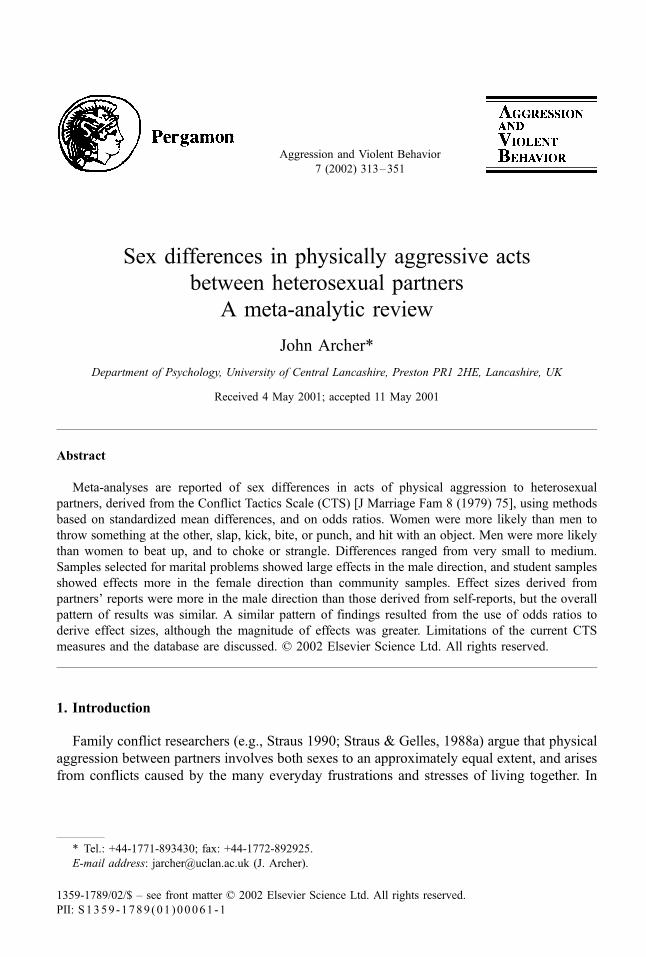
Sex differences in physically aggressive acts between heterosexual partners A meta-analytic review John Archer* Department of Psychology, University of Central Lancashire, Preston PR1 2HE, Lancashire, UK Received 4 May 2001; accepted 11 May 2001 Abstract Meta-analyses are reported of sex differences in acts of physical aggression to heterosexual partners, derived from the Conflict Tactics Scale (CTS) [J Marriage Fam 8 (1979) 75], using methods based on standardized mean differences, and on odds ratios. Women were more likely than men to throw something at the other, slap, kick, bite, or punch, and hit with an object. Men were more likely than women to beat up, and to choke or strangle. Differences ranged from very small to medium. Samples selected for marital problems showed large effects in the male direction, and student samples showed effects more in the female direction than community samples. Effect sizes derived from partners’ reports were more in the male direction than those derived from self-reports, but the overall pattern of results was similar. A similar pattern of findings resulted from the use of odds ratios to derive effect sizes, although the magnitude of effects was greater. Limitations of the current CTS measures and the database are discussed. D 2002 Elsevier Science Ltd. All rights reserved. 1. Introduction Family conflict researchers (e.g., Straus 1990; Straus & Gelles, 1988a) argue that physical aggression between partners involves both sexes to an approximately equal extent, and arises from conflicts caused by the many everyday frustrations and stresses of living together. In 1359-1789/02/$ – see front matter D 2002 Elsevier Science Ltd. All rights reserved. PII:S1359-1789(01)00061-1 * Tel.: +44-1771-893430; fax: +44-1772-892925. E-mail address: [email protected] (J. Archer). Aggression and Violent Behavior 7 (2002) 313–351
Transcript of John Archer - Domestic Violencedomestic-violence.martinsewell.com/Archer2002.pdf · Sex differences...
Sex differences in physically aggressive acts
between heterosexual partners
A meta-analytic review
John Archer*
Department of Psychology, University of Central Lancashire, Preston PR1 2HE, Lancashire, UK
Received 4 May 2001; accepted 11 May 2001
Abstract
Meta-analyses are reported of sex differences in acts of physical aggression to heterosexual
partners, derived from the Conflict Tactics Scale (CTS) [J Marriage Fam 8 (1979) 75], using methods
based on standardized mean differences, and on odds ratios. Women were more likely than men to
throw something at the other, slap, kick, bite, or punch, and hit with an object. Men were more likely
than women to beat up, and to choke or strangle. Differences ranged from very small to medium.
Samples selected for marital problems showed large effects in the male direction, and student samples
showed effects more in the female direction than community samples. Effect sizes derived from
partners’ reports were more in the male direction than those derived from self-reports, but the overall
pattern of results was similar. A similar pattern of findings resulted from the use of odds ratios to
derive effect sizes, although the magnitude of effects was greater. Limitations of the current CTS
measures and the database are discussed. D 2002 Elsevier Science Ltd. All rights reserved.
1. Introduction
Family conflict researchers (e.g., Straus 1990; Straus & Gelles, 1988a) argue that physical
aggression between partners involves both sexes to an approximately equal extent, and arises
from conflicts caused by the many everyday frustrations and stresses of living together. In
1359-1789/02/$ – see front matter D 2002 Elsevier Science Ltd. All rights reserved.
PII: S1359 -1789 (01 )00061 -1
* Tel.: +44-1771-893430; fax: +44-1772-892925.
E-mail address: [email protected] (J. Archer).
Aggression and Violent Behavior
7 (2002) 313–351
contrast, feminist (e.g., Pagelow, 1984; Walker, 1989) and evolutionary (e.g., Shackleford &
Buss, 1997; Wilson & Daly, 1992) researchers emphasize the imbalance between male
perpetrators and female victims of relationship aggression, which they view as arising either
from patriarchy or from the evolved proprietary motives of men.
Evidence for the family conflict researchers’ position is derived from questionnaires
inquiring about the ways people solve relationship conflicts, typically administered to
samples not selected for their high level of violence (e.g., Magdol et al., 1997; Morse,
1995; Straus & Gelles, 1988b). Evidence for the alternative view is typically derived from
crime surveys (e.g., Dobash & Dobash, 1977–1978; Gaquin, 1977–1978; Schwartz, 1987),
from female victims’ reports (e.g., Mooney, 1994), or from male perpetrators identified by
law enforcement agencies (e.g., Claes & Rosenthal, 1990). The difference in the conclusions
reached from these different sources has been attributed either to the different nature of the
samples (Johnson, 1995; Straus, 1997, 1999) or to the different nature of the measures. Two
opposing arguments have been advanced about the methods. One is that the family conflict
researchers’ questionnaire measure is unreliable, in that it neglects the context and con-
sequences of acts of physical aggression (Dobash, Dobash, Wilson, & Daly, 1992; Romkens,
1997). The other is that the crime surveys are unreliable (Mihalic & Elliott, 1997; Straus,
1997, 1998, 1999).
Meta-analyses of sex differences in physical aggression to heterosexual partners (Archer,
2000a) have revealed little difference in the proportion of men and women who used one or
more acts of physical aggression, and in the composite frequency of such acts. Typically,
these studies involve questionnaires consisting of specific acts of physical aggression (usually
the Conflict Tactics Scales, or CTS: Straus, 1979) administered to dating or community
samples of married or cohabiting people. When measures of the consequences of physical
aggression were obtained from the targets of such aggression, men were more likely than
women to inflict an injury. Even so, around a third of those injured were men. These findings
partially support the claims that different measurement methods have been responsible for
conflicting findings. Nevertheless, the sample involved was an important moderator of effect
size. Reports from women in refuges, and from men selected for high levels of partner
violence, produced high effect sizes in the male direction using the CTS. Younger-aged
samples of dating couples, and samples with lower rates of male aggression, showed effect
sizes in the female direction.
Despite the finding that, overall, men and women show a similar likelihood and frequency
of using any act of physical aggression, it is widely believed (e.g., Fagan & Browne, 1994;
Straus, Gelles, & Steinmetz, 1980) that serious acts of physical aggression are perpetrated
mainly by men against their women partners. In assessing whether this is so, it is important to
weigh both the severity of different acts of physical aggression and their consequences.
Consequences were analyzed previously in the form of injuries (Archer, 2000a). The present
paper reports further meta-analyses of sex differences in partner aggression, using the
individual acts of physical aggression from the CTS, to assess whether there is increased
male involvement for more severe acts. Parallel meta-analyses of the same data were
undertaken in view of the use of two different methods for calculating effect sizes for
dichotomous data (Haddock, Rindskoff, & Shadish, 1998; Johnson, 1989: see below).
J. Archer / Aggression and Violent Behavior 7 (2002) 313–351314
1.1. The Conflict Tactics Scale
The CTS is the questionnaire most commonly used by family conflict researchers. It
involves asking which of a number of acts of physical aggression the person and his or her
partner have used in seeking to solve conflicts. Various ways in which conflicts can be solved
are listed: These involve constructive problem solving, verbal or indirect aggressive acts, and
physically aggressive acts. It is the third of these that are scored in studies of physical
aggression towards partners. Although there are more studies providing aggregate measures
of the occurrence and frequency of CTS acts for men and women, there is still a substantial
number providing data for specific acts. Following Straus (1977–1978), many researchers
have divided the CTS items into minor acts (the first three, such as ‘‘slapped the other one’’),
and severe (the remaining five or six1, starting with ‘‘hit, bit, or hit with a fist’’ and ending
with ‘‘used a knife or gun’’). The distinction is made on the basis that the first three are less
damaging than the others. If it is men who typically perpetrate damaging acts, we should
expect such acts to show a different pattern from the first three, ‘‘minor’’ acts.
The present paper uses data on the occurrence of each individual CTS act, to address this
issue of whether serious acts of physical aggression are mainly perpetrated by men against
their women partners, with less serious acts, such as throwing something at or slapping, being
more frequently used by women. If so, we could conclude that the apparent lack of sex
differences (or higher female levels) found for aggregate measures hides a different pattern of
distribution of acts of physical aggression among men and women. This would go some way
towards supporting the view of critics of conclusions derived from aggregate CTS measures
(e.g., White, Smith, Koss, & Figueredo, 2000; see Archer, 2000b) that these do not account
for the more damaging nature of men’s physical aggression.
To illustrate this point, consider the following case reported in the British press in 1998.
Police were called to a violent domestic incident, and photographed the woman’s injuries to
reveal severe bruising to her face, and fingernail and hand marks on her neck. The subsequent
account of the event stated that it involved the following. First, a struggle occurred, in which
the woman grabbed at and scratched the man’s cheek and jaw; the man squeezed her throat,
and then caused the injuries shown in the photograph. The man claimed that these resulted
from pushing his partner, who then fell, but it seems more likely that the bruising resulted
from several punches. CTS measures of the numbers of men and women showing any form of
physical aggression would count this incident as one each for the man and woman. Measures
of ‘‘cause visible injury’’ might also score one for each partner, if we assume that the
woman’s scratches left marks. Scoring the incident in terms of individual CTS acts would
produce a different picture. The man would score positively for ‘‘push, grab, shove,’’ ‘‘kick,
bite, punch,’’ ‘‘beat up,’’ and ‘‘choke or strangle,’’ and the woman for ‘‘push, grab, shove’’
only (scratching not being included in the CTS). Owing to the serious nature of the last two
acts scored for the man, separating out the individual CTS acts provides a more realistic
account of this incident than relying on one measure, whether based on acts or consequences.
1 Choke or strangle is an often-used addition to the original items.
J. Archer / Aggression and Violent Behavior 7 (2002) 313–351 315
The following prediction can be made: Although the threshold between physical and
verbal or indirect acts of aggression is just as likely to be crossed by women as men, men will
be more likely than women to exhibit more serious acts of physical aggression. In this
context, serious refers to levels where there is greater risk of injury to the recipient, such as
beating them up, or choking them, or threatening them with a weapon.
1.2. Acts measured by the CTS
Acts of physical aggression used in the CTS and modifications of it vary in their potential
for damaging the other, and in the risks they entail to the self. The first act, throwing
something at the other, does not involve close proximity, and therefore to some extent avoids
the immediate danger of physical retaliation associated with acts delivered by a part of the
protagonist’s body. The next category (‘‘push, grab, or shove’’) involves physical contact but
is not aimed at inflicting pain on a specific part of the opponent’s body. However, ‘‘slap,’’ and
the potentially more damaging ‘‘kick, bite or punch,’’ are intended to inflict pain on a
particular part of the body. ‘‘Hit with an object’’ typically has more potential for damage than
if an object is not used (although there is some ambiguity here, since ‘‘object’’ could range
from a rolled-up newspaper to a baseball bat).
The category ‘‘beat up’’ is different from those preceding it, in that it does not specify the
action involved, and is defined more by its consequences than the way it is achieved. Thus a
person may be ‘‘beaten up’’ by being punched, kicked, pushed and hit with an object, or some
combination of these. It also carries the implication that the damaging acts are one-sided, and
they are repetitive in form. ‘‘Beat up’’ is particularly relevant to the hypothesis that men are
much more likely than women to perpetrate serious acts, since it implies that there are
damaging consequences. This category is not subject to the charge that only actions and not
their consequences are included in the CTS (e.g., Dobash et al., 1992; Romkens, 1997).
Choke or strangle involves specific actions that are by definition potentially damaging, in
that one of them is life threatening. Since this is well known, it must be assumed that choking
or strangling a partner involves the perpetrator acting recklessly regarding the other’s life.
Choke and strangle also involve the ability to overwhelm the other physically, and therefore
we should expect the most frequent perpetrators to be men.
Threaten with a knife or gun, or using one of these, are the remaining two categories.
Because they involve artificial weapons, they increase the danger to the opponent without
increasing the (immediate) cost2 to the perpetrator. A gun can be used at a distance, thus
further eliminating the immediate danger of retaliation from an unarmed opponent. Knives
are more likely to be carried by men, and are involved in many acts of intermale violence; on
the other hand, they are also readily available as kitchen and other household utensils, and
may also be used by women as a result. Guns have been referred to as ‘‘the great equalizer’’
2 Here costs are assessed in terms of the immediate danger of retaliation, following evolutionarily based
analyses of animal fights (Archer & Huntingford, 1994). For humans, there will of course be additional long-term
costs in the form of retaliation or revenge, and action by law-enforcement agencies.
J. Archer / Aggression and Violent Behavior 7 (2002) 313–351316
but again their widespread possession (particularly in the US) is a mainly male occurrence.
For these reasons, it is difficult to predict whether we should expect men to be the
predominant sex using or threatening to use knives or guns.
1.3. Sources of data
The data set used here is different from that used to analyze aggregate measures and
injuries (Archer, 2000a). Of the total number of studies used for these meta-analyses (shown
in the Appendix of the previous paper), 48 are included in the present analyses because they
also provided data that enabled effect sizes to be calculated for specific acts. A further 10
studies not used in the previous analyses were included in the present ones because they
provided data for individual acts (but not overall values). Sixty-nine of the studies used in the
previous analyses could not be used in the present ones because they only provided data for
aggregate CTS measures.
Most of these studies provide separate measures for self-reports and reports by partners,
enabling effect sizes to be calculated for the two data sources. Self-reports are comparable to
the many individual difference variables used in personality, social and clinical psychology.
Partner reports are similar to peer reports used in studies of children’s aggression (e.g.,
Bjorkqvist, Lagerspetz, & Kaukiainen, 1992), and also to reports from significant others used
in studies of adults (e.g., Buss & Perry, 1992; McCrae & Costa, 1990; O’Connor, Archer, &
Wu, 2001). A meta-analysis of aggregate measures comparing self- and partner reports
(Archer, 1999) found that while there was evidence of high correlations between the two
sources, self-reports were overall lower than partner reports, and that this was more
pronounced for men than for women. This pattern explained the finding from the meta-
analyses of aggregated data that effect sizes were more in the male direction for partner than
for self-reports. The most obvious explanation for this finding is systematic underreporting of
one’s own physical aggression compared to that of a partner, and for this tendency to be more
pronounced for men than women.
This issue may be more complex in the case of specific CTS acts. Riggs, Murphy, and
O’Leary (1989) asked people to rate how likely they would be to report items on the CTS:
they found that willingness to report one’s own aggression was not only less than willingness
to report partners’ aggression, but it also decreased with the seriousness of the CTS act. In a
meta-analysis, Sugarman and Hotaling (1997) also found that the largest negative correlation
between social desirability and physical aggression occurred for serious CTS acts. In the
present study, discrepancies between reports from the self and the partner were calculated, to
assess their possible association with the seriousness of the acts concerned.
1.4. Categorical variables
The present meta-analyses provided an opportunity to examine the impact of moderator
variables on the sex differences in acts of partner aggression. The rationale for choosing the
variables was as follows. (1) The source of data was included to assess whether published
studies were a representative sample of all available studies, in view of claims that
J. Archer / Aggression and Violent Behavior 7 (2002) 313–351 317
publication of some studies finding assaults by women on their partners had been
suppressed (Straus, 1997). (2) The measurement instrument was coded to enable a
comparison between effect sizes from studies using the CTS (see above) and other, more
rarely used, measures. (3) The country of origin enabled a preliminary comparison across
nations. (4) Age category allowed examination of whether sex differences were more in the
female direction at younger ages, as was found for aggregate measures. (5) The sample was
included to assess whether those selected for relationship problems, including marital
violence, showed large effect sizes in the male direction, and whether student samples
showed effect sizes more in the female direction. (6) Comparing dating with married or
cohabiting samples enabled an assessment of whether effect sizes were more in the female
direction for less permanent liaisons. (7) Nominal and interval level were compared to
assess whether effect sizes differed according to whether they were derived from numbers
of each sex or frequencies of each act. (8) There was variation in the period used when
asking about partner aggression, and since higher rates would be expected over longer
time periods, this was coded. (9) Sex of author was included because, for the aggregate
measure, the sex difference was more in the female direction for male than female
authors (Archer, 2000a).
1.5. Meta-analyses of dichotomous data
In the analysis of values representing the aggregate from self- and partner reports,
dichotomous data, mainly in the form of frequencies of occurrence for men and for
women, were converted into mean values using the DSTAT program (Johnson, 1989), a
method that is usually used for meta-analyses in psychology. However, Haddock et al.
(1998) have argued that this method underestimates the magnitudes of effect sizes unless
the marginal distributions are similar to one another. Instead, they recommend computing
odds ratios from the proportions of two categories that did and did not fulfil a particular
criterion (in the present case commit a particular act of physical aggression to a partner).
These odds ratios can be converted into effect sizes (d values) by a simple calculation.
Haddock et al. provided some examples from individual studies of divergent effect sizes
calculated by the two methods, those from odds ratios being considerably higher than
those calculated from treating the proportions as means.
In the present study, since nearly all the data was in the form of proportions
committing specific acts, it was possible to calculate effect sizes from odds ratios and to
compare these with values from the standardized mean difference (DSTAT) method. The
dichotomous data in each study involved exactly the same categories (men and women)
and the same measures (did or did not commit a specific act). It was therefore also
possible to aggregate the data from individual studies, to produce overall values for men
and women who did and did not commit each act (cf. Shadish & Haddock, 1994,
pp. 272–273). These aggregate values could then be used to calculate effect sizes using
both the DSTAT, and the odds ratio methods. The present study therefore also provides
a comparison between effect sizes calculated in two different ways from the same data,
and also between effect sizes calculated from individual studies and from combined
J. Archer / Aggression and Violent Behavior 7 (2002) 313–351318
frequencies across all studies. It will become apparent that effect sizes calculated from
odds ratios derived from aggregate proportions overcomes a problem encountered when
using this method for acts that have zero values in individual studies.
2. Method
2.1. Sample of studies
The main search involved PsycLIT(r) on CD-ROM for the years 1976 to October 1998,
using the key words ‘‘marital or dating’’ and ‘‘aggression or violence’’ but excluding
‘‘sexual,’’ ‘‘rape’’ and ‘‘pornography’’ because sexual forms of aggression are typically
studied separately and have only recently been included in studies involving the CTS and
related measures (see Discussion). This search produced 581 titles. Dissertations were
searched via DISS (Dissertation Abstracts International Online), from 1979 to 1998, using
the same keywords. This produced 426 titles. In both cases, titles and abstracts were assessed
in relation to the criteria described below, and those likely to fulfil them were subsequently
examined (in the case of dissertations in microfiche form).
Several complementary searches were also undertaken. The descendency method was
applied to the standard questionnaire measure used in research on relationship aggression, the
CTS (Straus, 1979): BIDS3 searches were undertaken of all subsequent studies that cited this
paper, to find those fulfilling the selection criteria. Systematic literature searches were
undertaken of the following. The lists of current papers on aggression, entitled A Guide to
the Literature on Aggressive Behavior, which appear regularly in the journal Aggressive
Behavior, were examined, from 1987 to 1998. These lists are derived from extensive key
word searches of ISI Science Citation Index, Social Science Citation Index, and Current
Contents. Papers concerning physical aggression in marital or dating relationships were
obtained from this source, using the titles to assess whether the contents were likely to be
within the scope of this review.
A hand search of the following journals covering relationship aggression, from 1987 to
1998, was undertaken: Aggressive Behavior, Family Relations, Journal of Family Violence,
Journal of Interpersonal Violence, Journal of Marriage and the Family, Journal of
Personality and Social Psychology, Journal of Social and Personal Relations, and Violence
and Victims. Again titles were first examined for papers likely to concern physical
aggression in marital or dating relationships, and abstracts were checked of all possibly
relevant papers.
The criterion for inclusion in the meta-analyses was the presence of self- and/or partner
reports of acts of physical aggression by men and women during present or past relationships,
expressed either as the numbers showing these acts, or their frequency, or another numerical
measure. Studies were included if an effect size could be calculated for the sex difference.
3 BIDS is a British electronic information system providing access to ISI databases.
J. Archer / Aggression and Violent Behavior 7 (2002) 313–351 319
Samples of married or cohabiting people typically involved self and partners’ reports for the
same couples whereas dating samples involved partners who were not matched.
2.2. Study-level effect size calculations
For each sample, g4 values were calculated for acts of physical aggression for which there
were data. In nearly all studies, the values were derived from the proportions (or frequencies)
of males and females showing each act; in only two cases were interval data, in the form of
standard deviations and means, provided. There were often separate values for self-reports
and partner reports. These transformations of data into g values were carried out using
DSTAT software (Johnson, 1989), and independently checked by a research assistant. In all
cases of discrepancies, the values were recalculated. Values were later rechecked against the
original papers.
Studies were also entered in SPSS files, in the form of the numbers of men and women
committing each act, and the sample sizes for the two sexes. From these values, odds ratios
were computed, and from these d values were derived, by the methods described in Haddock
et al. (1998). These calculations were undertaken using the compute command in SPSS. The
method involves multiplying each of the diagonals in a 2�2 contingency table of presence or
absence for the two sexes, and dividing one by the other. Thus, the product of the number of
men committing an act and the number of women not committing it is divided by the product
of the number of women committing it and the number of men not committing it. The method
has one serious drawback: it cannot accommodate cases where one or both sexes do not
commit the act. To overcome this problem, Haddock et al. (following Fleiss, 1981) advocated
adding .5 to each cell. As we note in the Results section, this can considerably inflate effect
sizes from studies where neither sex shows the act but one has a smaller sample size than the
other. One way of avoiding this problem is to aggregate all the scores for presence and
absence of an act across the study populations and to calculate one odds ratio from this
aggregate. This removes the necessity to deal with zero values from individual studies. Effect
sizes derived from the two methods can be compared to determine whether the frequent
presence of zero values has had much impact.
Effect sizes were also computed for the aggregate proportions using the DSTAT method to
assess the convergence of the two methods in this case. There are two possible sources of
discrepancy. First, d values calculated from aggregate frequencies involve a form of implicit
weighting by sample size, whereas those calculated from study level g values are weighted by
the reciprocal of the variance. Second, in order to derive d values from overall frequencies,
the data bases are treated as single large-sample studies: This has the effect of mitigating the
impact of studies generating a zero or near to zero effect size as a result of the infrequent
occurrence of that act.
4 d provides an estimate of effect size corrected for bias whereas g is the biased estimate (Hedges &
Becker, 1986).
J. Archer / Aggression and Violent Behavior 7 (2002) 313–351320
2.3. Analyses of effect sizes
For each sample, a composite effect size was calculated for each act of physical aggression
using the DSTAT method. If a composite of self- and partner reports was provided in the
paper, this was used to compute the effect size; if self- and partner reports were provided, the
mean of the two values was calculated; if only partner or self-reports were reported, neither
was used for the composite. If nominal and interval data were reported, the former was used
(since all but one of the sources produced data in this form). If both current and past
relationships were reported, past relationships were used. In the case of two longitudinal
studies, the mean of the values was taken in two cases (O’Leary et al., 1989; Papalia, 1994),
and the largest sample in the third (Morse, 1995) since additional couples were included at
successive times. Self- and partner reports were also analyzed separately. In each case, a
sample-level effect size was calculated by the DSTAT method and separate values for self-
and partner reports were also derived from the odds ratio method described above.In the analyses of effect sizes from study-level d values (whether derived from DSTAT or
from odds ratios), these were weighted by the reciprocal of the variance, which gives more
weight to those values that are more reliably estimated (Hedges & Olkin, 1985), to generate
an overall weighted mean d value. In each case, the data set was tested for the homogeneity of
effect sizes across all studies, by calculating the homogeneity statistic Qw, which has an
approximate c2 distribution with k�1 degrees of freedom, k being the number of effect sizes.
If this showed significant heterogeneity at the P <.05 level, the progressive removal of
outliers was undertaken, and the d value recalculated. This was repeated until a nonsignificant
Qw value was obtained. The outliers were put back when starting each new analysis. Since
several studies involved very large samples, and therefore may have dominated the analysis,
the overall weighted d was also recalculated with a ceiling n for individual studies of 800 (for
the DSTAT method only).
These calculations were carried out using D-STAT software (Johnson, 1989). Where
comparisons were made of effect sizes obtained from self- and from partner reports, they were
undertaken using the D-STAT program, by entering the respective TWD, TWDS, and TW
terms. These are, respectively, d multiplied by the reciprocal of the variance, d2 multiplied by
the reciprocal of the variance, and the reciprocal of the variance. It should be noted that these
statistics are designed for between-study comparisons, and therefore the values in this case
have to be interpreted with this in mind.
The present analyses involved a large number of data sets: There were nine acts of
physical aggression, and each was analyzed separately for composite, self-, and partner
reports; each analysis was carried out for the original sample sizes, and with a ceiling of 800
per study. There were therefore 54 DSTAT data files. In addition, two SPSS files were
established for each act (for self- and for partner reports), producing another 18 data files.
The numbers involved generates considerable scope for errors. Files were therefore checked
and rechecked against a summary table showing each study, effect sizes, study characteristics
and which statistic was used in the meta-analysis (see Appendix A). In the case of self- and
partner reports, individual entries in each DSTAT files were also checked against those in the
independently derived SPSS files, which were established to compute the odds ratios and
J. Archer / Aggression and Violent Behavior 7 (2002) 313–351 321
associated effect sizes. A number of errors were identified during these checks, and were
corrected before computing the final effect sizes.
2.4. Additional measures
From the aggregate proportions of men and women showing each CTS act, for self- and
partner reports, proportions of those committing each act who were men was calculated, since
a similar measure was previously used for injuries (Archer, 2000a). In order to further explore
differences between self- and partner reports, the proportions of the total sample committing
each act according to self- and partner reports was computed for men and for women. In each
case, the percentage difference between these proportions was calculated.
2.5. Variables coded from each study
The following information was coded from each study as categorical variables: (1) source
of data; (2) the measurement instrument; (3) the country; (4) the age category; (5) the type of
sample (classified as students, community or selected, which comprised one of each of the
following: women from a refuge; couples referred to a treatment program for assaultive
husbands, and couples referred to a treatment program for marriage counseling); (6) whether
most of the sample were single or cohabiting (including married); (7) the level of
measurement; (8) the time period to which the measures referred; (9) the sex of the first
author. In each case, the coding was undertaken separately by two coders. Cohen’s kappas
were calculated for the extent of agreement for each of the categorical variables: Most kappas
were between .83 and .95.
The study characteristics were used in categorical model analyses, to investigate the
sources of heterogeneity in effect sizes within the data sets. In each case, mean weighted d
values for each class were calculated, together with the statistic QB for the between-classes
comparisons. Where appropriate, categories were combined to enable meaningful compar-
isons: for example, the three categories, student, community, and samples selected for
relationship conflict, were used, rather than retaining the original categories (Table 1). These
calculations were undertaken on the composite data (d values derived from the DSTAT
method), using D-STAT software (Johnson, 1989).
3. Results
3.1. Study characteristics
Appendix A lists each study used for the meta-analyses, together with the effect sizes for
each act (from the DSTAT method) and the study characteristics. Table 1 summarizes the study
characteristics, indicating that most were carried out in the 1980s and 1990s, in the USA. Over
half involved college or high school students in dating relationships. These statistics alone limit
the generalizations that can be made from the subsequent analyses. There are, however,
J. Archer / Aggression and Violent Behavior 7 (2002) 313–351322
sufficient numbers of community samples, and of samples selected for relationship violence to
enable some meaningful comparisons to be made across these categories.
3.2. Sex differences for composite values
Table 2 shows the overall weighted d values for the composite measures for each act (all
computed by the DSTAT method): The first line shows the unadjusted values, the second
values when outliers were removed, and the third values when a ceiling n=800 was
imposed for individual studies. Three of the first four CTS acts (‘‘throw something at’’;
‘‘slap’’; ‘‘kick, bite, hit’’), and also ‘‘hit with an object,’’ showed a significant effect size in
the female direction. The values were relatively small, in terms of Cohen’s (1988) criteria,
or when compared to other sex differences in social behavior (Eagly, 1995; Eagly & Wood,
1991), although we should note criticisms of the DSTAT method for producing low
estimates of effect size (Haddock et al., 1998). In all three cases, effect sizes increased
when a ceiling n was placed on large samples, and after outliers were removed. The
remaining ‘‘minor’’ act (‘‘push, grab, shove’’), showed a significant sex difference in the
male direction, although the effect size was very small in magnitude. Putting a ceiling n on
large sample studies, or removing outliers, made very little difference to this value. As
predicted, ‘‘beat up,’’ and ‘‘choke or strangle’’ showed significant sex differences in the
male direction, although the effect sizes were again small. Again, putting a ceiling n on
large sample studies, or removing outliers, made practically no difference to these effect
sizes. Threatening with a knife or gun, or using these, showed d values near to zero.
3.3. Self- and partner reports
Table 3 shows the overall weighted d values for self- and partner reports for each act.
As in Table 2, the first line shows the unadjusted values, the second the values when
outliers were removed, and the third the values when a ceiling n=800 was imposed for
individual studies. These values were all obtained by the DSTAT method. Line 4 (in
italics) shows the values when the DSTAT method was applied to aggregate proportions.
Lines 5 and 6 (in bold) show the values derived from odds ratios, first from study-level
effect sizes, and second from aggregate proportions.
The results of comparisons between the mean weighted d values from self- and partner
reports for each act are also shown in Table 3, for the DSTAT-derived d values. It should
be borne in mind that the methods used for these calculations were designed for within-
subject comparisons, whereas the samples of studies used to calculate self- and partner
reports showed considerable overlap. Significant differences were found between the two
sources for the first six acts, but not for ‘‘choke or strangle,’’ ‘‘threaten with a knife or
gun’’ and ‘‘use a knife or gun.’’ The differences were particularly large in the cases of
‘‘push, grab, shove,’’ and ‘‘kick, bit, punch.’’ In all cases where there were differences,
partners’ reports were more in the male direction than aggressors’ reports, by magnitudes
of d=.08 to .15 for the unadjusted values. Discrepancies between self- and partner
reports are considered further in the final subsection of the Results.
J. Archer / Aggression and Violent Behavior 7 (2002) 313–351 323
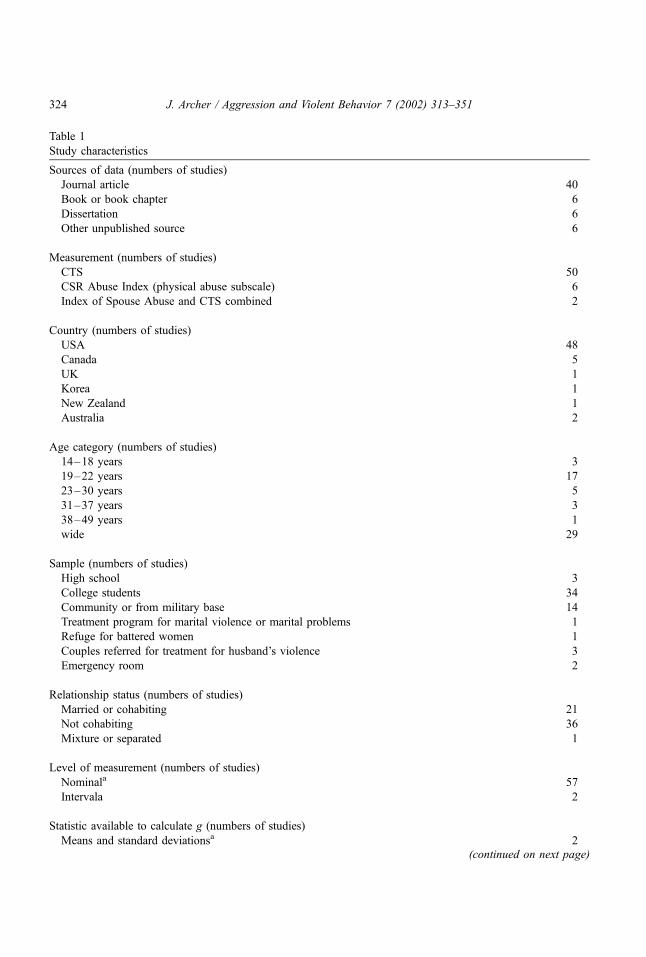
Table 1
Study characteristics
Sources of data (numbers of studies)
Journal article 40
Book or book chapter 6
Dissertation 6
Other unpublished source 6
Measurement (numbers of studies)
CTS 50
CSR Abuse Index (physical abuse subscale) 6
Index of Spouse Abuse and CTS combined 2
Country (numbers of studies)
USA 48
Canada 5
UK 1
Korea 1
New Zealand 1
Australia 2
Age category (numbers of studies)
14–18 years 3
19–22 years 17
23–30 years 5
31–37 years 3
38–49 years 1
wide 29
Sample (numbers of studies)
High school 3
College students 34
Community or from military base 14
Treatment program for marital violence or marital problems 1
Refuge for battered women 1
Couples referred for treatment for husband’s violence 3
Emergency room 2
Relationship status (numbers of studies)
Married or cohabiting 21
Not cohabiting 36
Mixture or separated 1
Level of measurement (numbers of studies)
Nominala 57
Intervala 2
Statistic available to calculate g (numbers of studies)
Means and standard deviationsa 2(continued on next page)
J. Archer / Aggression and Violent Behavior 7 (2002) 313–351324
DSTAT-derived effect sizes from self-reports showed the same general pattern to those
obtained from the composites, in that those for four of the first five acts were in the
female direction, but the magnitudes were greater than for composite values. The
exception was again, ‘‘push, grab, shove,’’ with a value near to zero (the composite
value was slightly in the male direction). Self-reports for ‘‘beat up’’ were in the male
direction but smaller than for composites. Values for the two acts involving weapons
were around zero for self-reports.
Partners’ reports showed effect sizes in the female direction for the same four of the
five acts as for self-reports and composites, but with smaller effect sizes than for self-
reports. ‘‘Push, grab, shove,’’ ‘‘beat up, and ‘‘choke or strangle’’ showed small effect
sizes in the male direction for partner reports, but the acts involving weapons were still
near to zero (Table 3).
The d values computed from aggregate frequencies using DSTAT (Table 3, lines 4)
were broadly similar to those calculated from the study-level gs (Table 3: lines 1–3).
Both self- and partner reports indicated that four of the first five acts had higher
frequencies for women than men, and that this was more pronounced for self- than
partner reports. The overall consistency between results from these two parallel analyses
also provides a further check against errors, since the data files, and the software, were
different for the two analyses.
Weighed mean d values computed from odds ratios were, as expected (Haddock et al.,
1998), much higher than those derived by the DSTAT method. In only one case was the odds
Statistic available to calculate g (numbers of studies)
Frequencies or proportionsa 56
c2 1
Reference period (numbers of studies)
Current or most recent relationship 20
Past year 16
Present and past relationships 17
Past 2 years 1
All past relationships 2
Not specified 3
Sex of first author (numbers of studies)
Male 19
Female 36
Unknown 3
Median date of publication 1988
Mean proportion of women in the samples .54
Mean number of males in each sample 325
Mean number of females in each sample 375a One study provided both these measures.
Table 1 (continued )
J. Archer / Aggression and Violent Behavior 7 (2002) 313–351 325
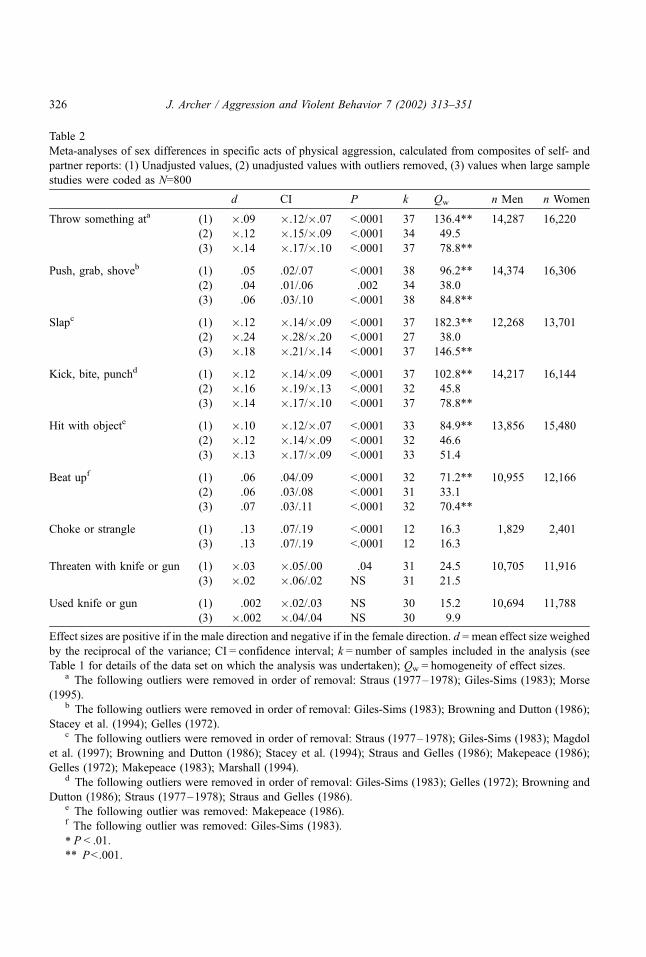
Table 2
Meta-analyses of sex differences in specific acts of physical aggression, calculated from composites of self- and
partner reports: (1) Unadjusted values, (2) unadjusted values with outliers removed, (3) values when large sample
studies were coded as N=800
d CI P k Qw n Men n Women
Throw something ata (1) �.09 �.12/�.07 <.0001 37 136.4** 14,287 16,220
(2) �.12 �.15/�.09 <.0001 34 49.5
(3) �.14 �.17/�.10 <.0001 37 78.8**
Push, grab, shoveb (1) .05 .02/.07 <.0001 38 96.2** 14,374 16,306
(2) .04 .01/.06 .002 34 38.0
(3) .06 .03/.10 <.0001 38 84.8**
Slapc (1) �.12 �.14/�.09 <.0001 37 182.3** 12,268 13,701
(2) �.24 �.28/�.20 <.0001 27 38.0
(3) �.18 �.21/�.14 <.0001 37 146.5**
Kick, bite, punchd (1) �.12 �.14/�.09 <.0001 37 102.8** 14,217 16,144
(2) �.16 �.19/�.13 <.0001 32 45.8
(3) �.14 �.17/�.10 <.0001 37 78.8**
Hit with objecte (1) �.10 �.12/�.07 <.0001 33 84.9** 13,856 15,480
(2) �.12 �.14/�.09 <.0001 32 46.6
(3) �.13 �.17/�.09 <.0001 33 51.4
Beat upf (1) .06 .04/.09 <.0001 32 71.2** 10,955 12,166
(2) .06 .03/.08 <.0001 31 33.1
(3) .07 .03/.11 <.0001 32 70.4**
Choke or strangle (1) .13 .07/.19 <.0001 12 16.3 1,829 2,401
(3) .13 .07/.19 <.0001 12 16.3
Threaten with knife or gun (1) �.03 �.05/.00 .04 31 24.5 10,705 11,916
(3) �.02 �.06/.02 NS 31 21.5
Used knife or gun (1) .002 �.02/.03 NS 30 15.2 10,694 11,788
(3) �.002 �.04/.04 NS 30 9.9
Effect sizes are positive if in the male direction and negative if in the female direction. d = mean effect size weighed
by the reciprocal of the variance; CI = confidence interval; k = number of samples included in the analysis (see
Table 1 for details of the data set on which the analysis was undertaken); Qw = homogeneity of effect sizes.a The following outliers were removed in order of removal: Straus (1977–1978); Giles-Sims (1983); Morse
(1995).b The following outliers were removed in order of removal: Giles-Sims (1983); Browning and Dutton (1986);
Stacey et al. (1994); Gelles (1972).c The following outliers were removed in order of removal: Straus (1977–1978); Giles-Sims (1983); Magdol
et al. (1997); Browning and Dutton (1986); Stacey et al. (1994); Straus and Gelles (1986); Makepeace (1986);
Gelles (1972); Makepeace (1983); Marshall (1994).d The following outliers were removed in order of removal: Giles-Sims (1983); Gelles (1972); Browning and
Dutton (1986); Straus (1977–1978); Straus and Gelles (1986).e The following outlier was removed: Makepeace (1986).f The following outlier was removed: Giles-Sims (1983).
* P < .01.
** P<.001.
J. Archer / Aggression and Violent Behavior 7 (2002) 313–351326
ratio value lower. In most cases, values were increased by a factor of .5 to 3. The two methods
do not, of course, produce differences in the direction of effect sizes at study levels: the
contrast is in the magnitude of effect derived from the same proportions. This is particularly
marked in the case of infrequent acts. Zero values have already been commented upon, but
low frequencies for one sex compared to the other will also produce much larger d values than
with the DSTAT method. Computing odds ratio d values from aggregate frequencies
generally produced similar values. The only evidence that the weighted mean value derived
from study-level odds ratios had been substantially inflated by zeros combined with unequal
sample sizes occurred for partner reports of threaten with a weapon, and use a weapon.
The main difference in the conclusions derived from odds ratio effect sizes as opposed to
those derived from standardized mean statistics is that the differences are larger from odds
ratios, but in the same direction as those from the other method. Thus, according to odds
ratios, ‘‘throw something,’’ ‘‘slap,’’ ‘‘kick, bite, punch,’’ and ‘‘hit with an object,’’ were all
considerably more frequent among women than men, based on self-reports, producing
medium effect sizes. The effect sizes for these acts were lower, but in the same direction,
when derived from partner reports, i.e., the effect size was small rather than medium. Values
around zero tended to remain there whichever method was used. This was the case for ‘‘push,
grab, shove,’’ and the two acts involving weapons, according to self-reports. According to
odds ratio d values, ‘‘choke or strangle’’ is very clearly a male act, whether based on self- or
partner reports, and so is ‘‘beat up’’ according to partner reports (but not self-reports where
the value was in the very small category). There was some evidence from partner repots of
slightly greater use of a weapon by men, and of slightly more threats to do so by women,
when odds ratios were used.
Odds ratios produced a much more heterogeneous collection of d values in all cases,
as evidenced by the very large Qw values (Table 3). This would produce complications in
any further analyses. Removing outliers is a procedure that can help to focus on a core
of studies with similar values in the case of DSTAT-derived effect sizes. For the odds
ratios, it led to a considerable number of the study-level effect sizes being discarded
before homogeneity was achieved.
3.4. Tests of categorical models
All tests of categorical models were undertaken on the composite data, i.e., on values
derived from DSTAT calculations. Only the main findings are reported here. There were
significantly higher effect sizes in the female direction for unpublished than published
reports for ‘‘throw something at’’ (d =�.20 vs. �.09; QB = 5.4; P <.05), ‘‘slap’’ (d =�.30
vs. �.10; QB = 15.1; P <.001), ‘‘kick, bite, punch’’ (d =�.22 vs. �.11; QB = 5.5; P < .05)
and ‘‘hit with an object’’ (d =�.20 vs. �.09; QB = 5.0; P < .05). Other acts showed no
significant differences. When studies from the US were compared with those from Canada,
UK, and New Zealand (combined), ‘‘slap’’ showed a larger effect in the female direction
among these other nations than in the US (d =�.22 vs. �.10; QB = 10.54; P < .01).
There was a trend for younger samples (19 to 22 years) to show effect sizes more in
the female direction than older ones (23 to 37 years). This was largest for slap, where a
J. Archer / Aggression and Violent Behavior 7 (2002) 313–351 327
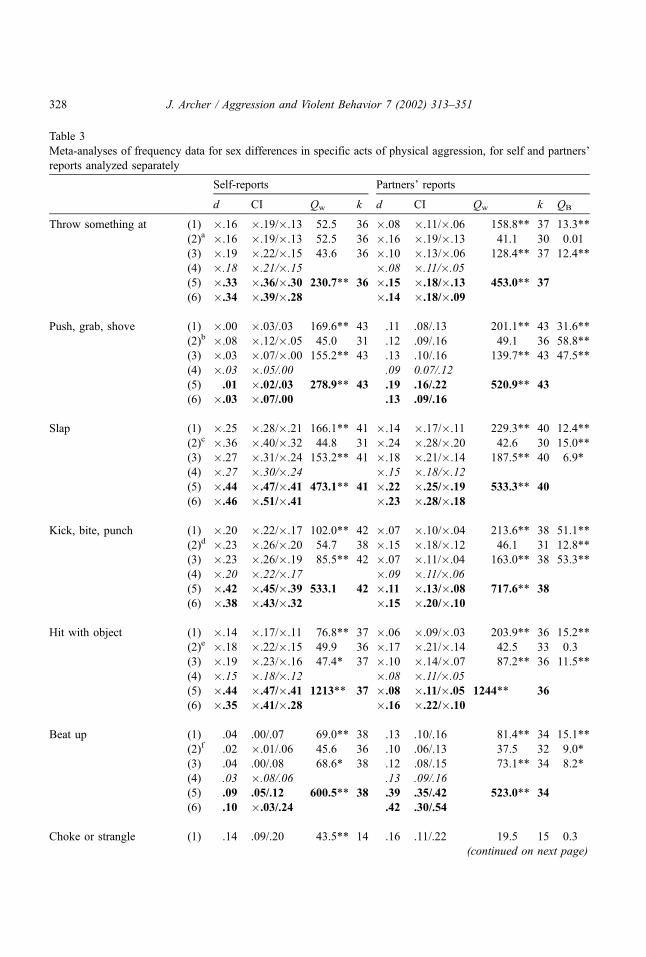
Table 3
Meta-analyses of frequency data for sex differences in specific acts of physical aggression, for self and partners’
reports analyzed separately
Self-reports Partners’ reports
d CI Qw k d CI Qw k QB
Throw something at (1) �.16 �.19/�.13 52.5 36 �.08 �.11/�.06 158.8** 37 13.3**
(2)a �.16 �.19/�.13 52.5 36 �.16 �.19/�.13 41.1 30 0.01
(3) �.19 �.22/�.15 43.6 36 �.10 �.13/�.06 128.4** 37 12.4**
(4) �.18 �.21/�.15 �.08 �.11/�.05
(5) �.33 �.36/�.30 230.7** 36 �.15 �.18/�.13 453.0** 37
(6) �.34 �.39/�.28 �.14 �.18/�.09
Push, grab, shove (1) �.00 �.03/.03 169.6** 43 .11 .08/.13 201.1** 43 31.6**
(2)b �.08 �.12/�.05 45.0 31 .12 .09/.16 49.1 36 58.8**
(3) �.03 �.07/�.00 155.2** 43 .13 .10/.16 139.7** 43 47.5**
(4) �.03 �.05/.00 .09 0.07/.12
(5) .01 �.02/.03 278.9** 43 .19 .16/.22 520.9** 43
(6) �.03 �.07/.00 .13 .09/.16
Slap (1) �.25 �.28/�.21 166.1** 41 �.14 �.17/�.11 229.3** 40 12.4**
(2)c �.36 �.40/�.32 44.8 31 �.24 �.28/�.20 42.6 30 15.0**
(3) �.27 �.31/�.24 153.2** 41 �.18 �.21/�.14 187.5** 40 6.9*
(4) �.27 �.30/�.24 �.15 �.18/�.12
(5) �.44 �.47/�.41 473.1** 41 �.22 �.25/�.19 533.3** 40
(6) �.46 �.51/�.41 �.23 �.28/�.18
Kick, bite, punch (1) �.20 �.22/�.17 102.0** 42 �.07 �.10/�.04 213.6** 38 51.1**
(2)d �.23 �.26/�.20 54.7 38 �.15 �.18/�.12 46.1 31 12.8**
(3) �.23 �.26/�.19 85.5** 42 �.07 �.11/�.04 163.0** 38 53.3**
(4) �.20 �.22/�.17 �.09 �.11/�.06
(5) �.42 �.45/�.39 533.1 42 �.11 �.13/�.08 717.6** 38
(6) �.38 �.43/�.32 �.15 �.20/�.10
Hit with object (1) �.14 �.17/�.11 76.8** 37 �.06 �.09/�.03 203.9** 36 15.2**
(2)e �.18 �.22/�.15 49.9 36 �.17 �.21/�.14 42.5 33 0.3
(3) �.19 �.23/�.16 47.4* 37 �.10 �.14/�.07 87.2** 36 11.5**
(4) �.15 �.18/�.12 �.08 �.11/�.05
(5) �.44 �.47/�.41 1213** 37 �.08 �.11/�.05 1244** 36
(6) �.35 �.41/�.28 �.16 �.22/�.10
Beat up (1) .04 .00/.07 69.0** 38 .13 .10/.16 81.4** 34 15.1**
(2)f .02 �.01/.06 45.6 36 .10 .06/.13 37.5 32 9.0*
(3) .04 .00/.08 68.6* 38 .12 .08/.15 73.1** 34 8.2*
(4) .03 �.08/.06 .13 .09/.16
(5) .09 .05/.12 600.5** 38 .39 .35/.42 523.0** 34
(6) .10 �.03/.24 .42 .30/.54
Choke or strangle (1) .14 .09/.20 43.5** 14 .16 .11/.22 19.5 15 0.3
(continued on next page)
J. Archer / Aggression and Violent Behavior 7 (2002) 313–351328
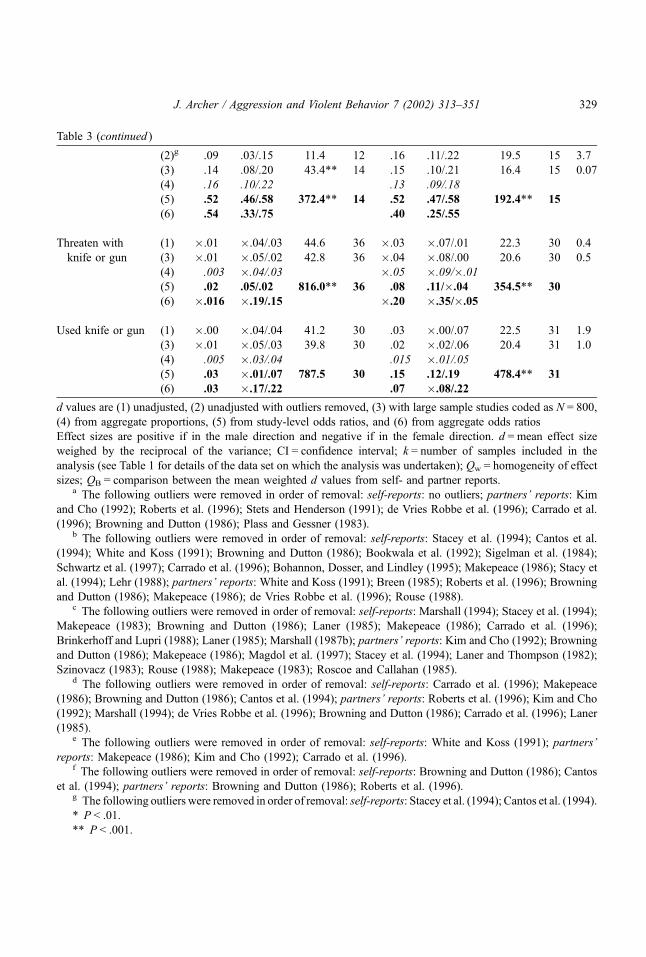
Table 3 (continued )
(2)g .09 .03/.15 11.4 12 .16 .11/.22 19.5 15 3.7
(3) .14 .08/.20 43.4** 14 .15 .10/.21 16.4 15 0.07
(4) .16 .10/.22 .13 .09/.18
(5) .52 .46/.58 372.4** 14 .52 .47/.58 192.4** 15
(6) .54 .33/.75 .40 .25/.55
Threaten with (1) �.01 �.04/.03 44.6 36 �.03 �.07/.01 22.3 30 0.4
knife or gun (3) �.01 �.05/.02 42.8 36 �.04 �.08/.00 20.6 30 0.5
(4) .003 �.04/.03 �.05 �.09/�.01
(5) .02 .05/.02 816.0** 36 .08 .11/�.04 354.5** 30
(6) �.016 �.19/.15 �.20 �.35/�.05
Used knife or gun (1) �.00 �.04/.04 41.2 30 .03 �.00/.07 22.5 31 1.9
(3) �.01 �.05/.03 39.8 30 .02 �.02/.06 20.4 31 1.0
(4) .005 �.03/.04 .015 �.01/.05
(5) .03 �.01/.07 787.5 30 .15 .12/.19 478.4** 31
(6) .03 �.17/.22 .07 �.08/.22
d values are (1) unadjusted, (2) unadjusted with outliers removed, (3) with large sample studies coded as N = 800,
(4) from aggregate proportions, (5) from study-level odds ratios, and (6) from aggregate odds ratios
Effect sizes are positive if in the male direction and negative if in the female direction. d = mean effect size
weighed by the reciprocal of the variance; CI = confidence interval; k = number of samples included in the
analysis (see Table 1 for details of the data set on which the analysis was undertaken); Qw = homogeneity of effect
sizes; QB = comparison between the mean weighted d values from self- and partner reports.a The following outliers were removed in order of removal: self-reports: no outliers; partners’ reports: Kim
and Cho (1992); Roberts et al. (1996); Stets and Henderson (1991); de Vries Robbe et al. (1996); Carrado et al.
(1996); Browning and Dutton (1986); Plass and Gessner (1983).b The following outliers were removed in order of removal: self-reports: Stacey et al. (1994); Cantos et al.
(1994); White and Koss (1991); Browning and Dutton (1986); Bookwala et al. (1992); Sigelman et al. (1984);
Schwartz et al. (1997); Carrado et al. (1996); Bohannon, Dosser, and Lindley (1995); Makepeace (1986); Stacy et
al. (1994); Lehr (1988); partners’ reports: White and Koss (1991); Breen (1985); Roberts et al. (1996); Browning
and Dutton (1986); Makepeace (1986); de Vries Robbe et al. (1996); Rouse (1988).c The following outliers were removed in order of removal: self-reports: Marshall (1994); Stacey et al. (1994);
Makepeace (1983); Browning and Dutton (1986); Laner (1985); Makepeace (1986); Carrado et al. (1996);
Brinkerhoff and Lupri (1988); Laner (1985); Marshall (1987b); partners’ reports: Kim and Cho (1992); Browning
and Dutton (1986); Makepeace (1986); Magdol et al. (1997); Stacey et al. (1994); Laner and Thompson (1982);
Szinovacz (1983); Rouse (1988); Makepeace (1983); Roscoe and Callahan (1985).d The following outliers were removed in order of removal: self-reports: Carrado et al. (1996); Makepeace
(1986); Browning and Dutton (1986); Cantos et al. (1994); partners’ reports: Roberts et al. (1996); Kim and Cho
(1992); Marshall (1994); de Vries Robbe et al. (1996); Browning and Dutton (1986); Carrado et al. (1996); Laner
(1985).e The following outliers were removed in order of removal: self-reports: White and Koss (1991); partners’
reports: Makepeace (1986); Kim and Cho (1992); Carrado et al. (1996).f The following outliers were removed in order of removal: self-reports: Browning and Dutton (1986); Cantos
et al. (1994); partners’ reports: Browning and Dutton (1986); Roberts et al. (1996).g The following outliers were removed in order of removal: self-reports: Stacey et al. (1994); Cantos et al. (1994).
* P < .01.
** P < .001.
J. Archer / Aggression and Violent Behavior 7 (2002) 313–351 329
d =�.36 for younger samples became .16 for older ones (QB = 48.9; P<.001). A lesser
reversal of direction was found for ‘‘kick, bite, punch’’ (d =�.22 vs. .12; QB = 22.9;
P < .001). There were also significant differences for ‘‘push, grab, shove’’ (d =�.01 vs.
.37; QB = 28.4; P < .001). ‘‘beat up’’ (d = .02 vs. .26; QB = 6.8; P < .01), and ‘‘choke or
strangle’’ (d = .08 vs. .35; QB = 7.8; P < .001). A substantial d value was found in each
case in the male direction among the 23- to 37-year-olds, whereas the younger samples
showed values close to zero. However, these findings were generally based on small
sample numbers, from 8 to 10 for the younger samples and 4 to 5 for the older ones.
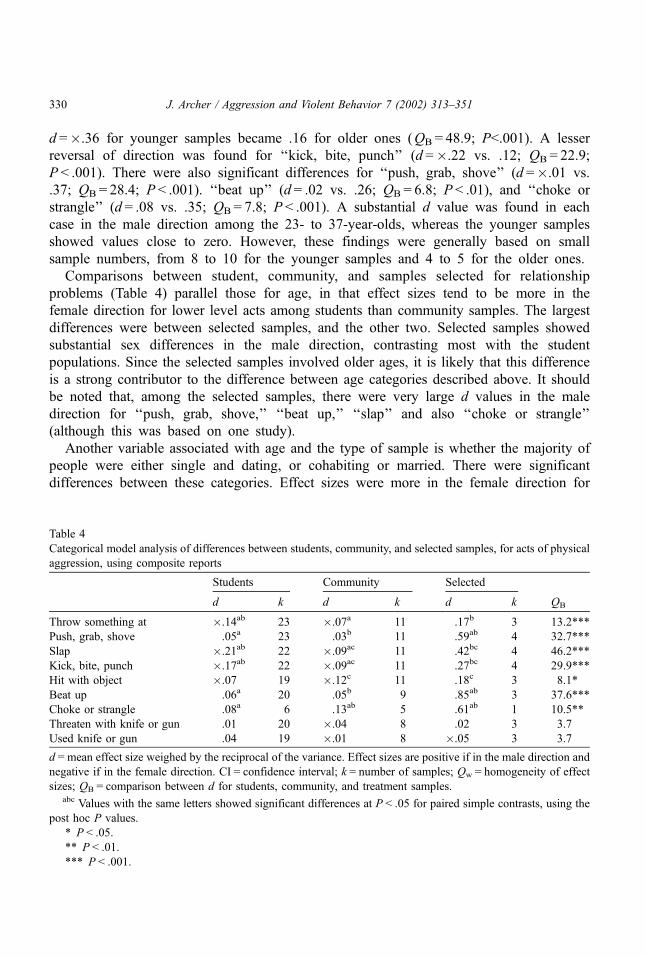
Comparisons between student, community, and samples selected for relationship
problems (Table 4) parallel those for age, in that effect sizes tend to be more in the
female direction for lower level acts among students than community samples. The largest
differences were between selected samples, and the other two. Selected samples showed
substantial sex differences in the male direction, contrasting most with the student
populations. Since the selected samples involved older ages, it is likely that this difference
is a strong contributor to the difference between age categories described above. It should
be noted that, among the selected samples, there were very large d values in the male
direction for ‘‘push, grab, shove,’’ ‘‘beat up,’’ ‘‘slap’’ and also ‘‘choke or strangle’’
(although this was based on one study).
Another variable associated with age and the type of sample is whether the majority of
people were either single and dating, or cohabiting or married. There were significant
differences between these categories. Effect sizes were more in the female direction for
Table 4
Categorical model analysis of differences between students, community, and selected samples, for acts of physical
aggression, using composite reports
Students Community Selected
d k d k d k QB
Throw something at �.14ab 23 �.07a 11 .17b 3 13.2***
Push, grab, shove .05a 23 .03b 11 .59ab 4 32.7***
Slap �.21ab 22 �.09ac 11 .42bc 4 46.2***
Kick, bite, punch �.17ab 22 �.09ac 11 .27bc 4 29.9***
Hit with object �.07 19 �.12c 11 .18c 3 8.1*
Beat up .06a 20 .05b 9 .85ab 3 37.6***
Choke or strangle .08a 6 .13ab 5 .61ab 1 10.5**
Threaten with knife or gun .01 20 �.04 8 .02 3 3.7
Used knife or gun .04 19 �.01 8 �.05 3 3.7
d = mean effect size weighed by the reciprocal of the variance. Effect sizes are positive if in the male direction and
negative if in the female direction. CI = confidence interval; k = number of samples; Qw = homogeneity of effect
sizes; QB = comparison between d for students, community, and treatment samples.abc Values with the same letters showed significant differences at P < .05 for paired simple contrasts, using the
post hoc P values.
* P < .05.
** P < .01.
*** P < .001.
J. Archer / Aggression and Violent Behavior 7 (2002) 313–351330
single than cohabiting people for four acts (slap: d =�.24 vs. �.06; QB = 44.6; P < .001;
kick, bite, punch: d =�.18 vs. �.06; QB = 26.9; P < .001; throw something at: d =�.14
vs. �.06; QB = 14.5; P < .001; choke or strangle: d = .09 vs. .24; QB = 3.8; P < .05).
There were few differences in effect sizes according to when the acts of physical
aggression were sampled, whether in current or recent, or all, experiences. Studies with a
female first author showed significantly larger d values in the female direction for the first
five acts than those with a male first author (slap: d =�.24 vs. �.05; QB = 52.0; P < .001;
throw something at: d =�.16 vs. �.03; QB = 33.0; hit with an object: d =�.16 vs. �.04;
QB = 27.1; P < .001; kick, bite, punch: d =�.17 vs. �.06; QB = 22.5; P < .001; push, grab,
shove: d = .02 vs. .07; QB = 3.8; P < .05). No differences were found for the last four acts.
3.5. Sex differences expressed as proportions of all aggressors who were men
In the previous meta-analyses (Archer, 2000a), injuries were expressed as the
proportion of those injured who were male and female, to provide an additional measure
to effect size that did not depend on overall frequency. The same proportion measure was
calculated for the acts analyzed in the present study so as to provide a readily understood
measure that is comparable with that used for injuries. Table 5 shows, for self- and for
partner reports, the numbers of men and women committing each act, the total sample
numbers for each sex, and the proportion of those committing each act who were men.
Since the sample sizes were generally smaller for men than for women, these proportion
figures have been corrected for unequal sample sizes (by dividing the numbers of each
sex committing an act by the sample size prior to calculating the proportion). Table 5 also
shows the odds ratios for the aggregate proportions that were used to calculate the d
values shown in lines 6 of Table 3.
In the case of the proportion measure, any value over .5 indicates an act more common
among men than among women. For the odds ratios, any value greater than one indicates
an act more likely to occur among men than women, and any value less than one an act
more likely to occur among women than men. These figures do not provide additional
information to the effect sizes shown in Table 3, but they do provide it in a more
intuitively understandable form.
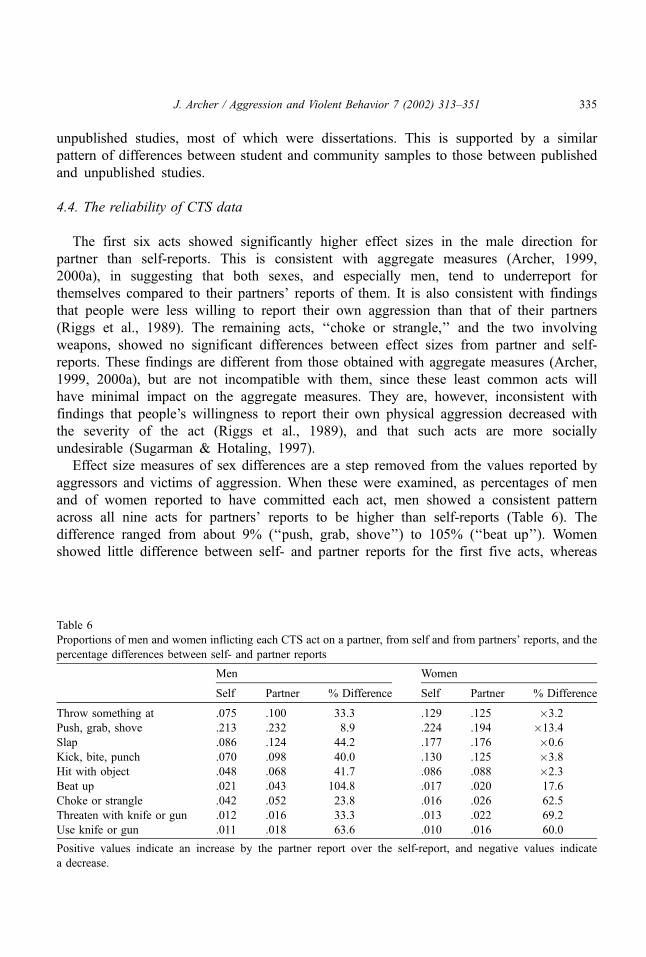
3.6. Proportions of men and women who used each CTS act
The numbers of men and women committing each act and the respective sample sizes
(Table 5) were also used to calculate the proportions of men and women using each act,
according to self- and partner reports. These values were used to further investigate
agreement between self- and partner reports. For men, the proportions committing each
act were higher for partner than self-reports, differences ranging from 9% to 105%. The
lowest discrepancy was for ‘‘push, grab, shove,’’ and the highest was for ‘‘beat up.’’ For
women, there were only small discrepancies for the first five acts, all involving slightly
lower proportions from partner than from self-reports (1% to 13%). For the last four acts,
partner reports generated higher values than self-reports, ranging from 18% for ‘‘beat up’’
J. Archer / Aggression and Violent Behavior 7 (2002) 313–351 331
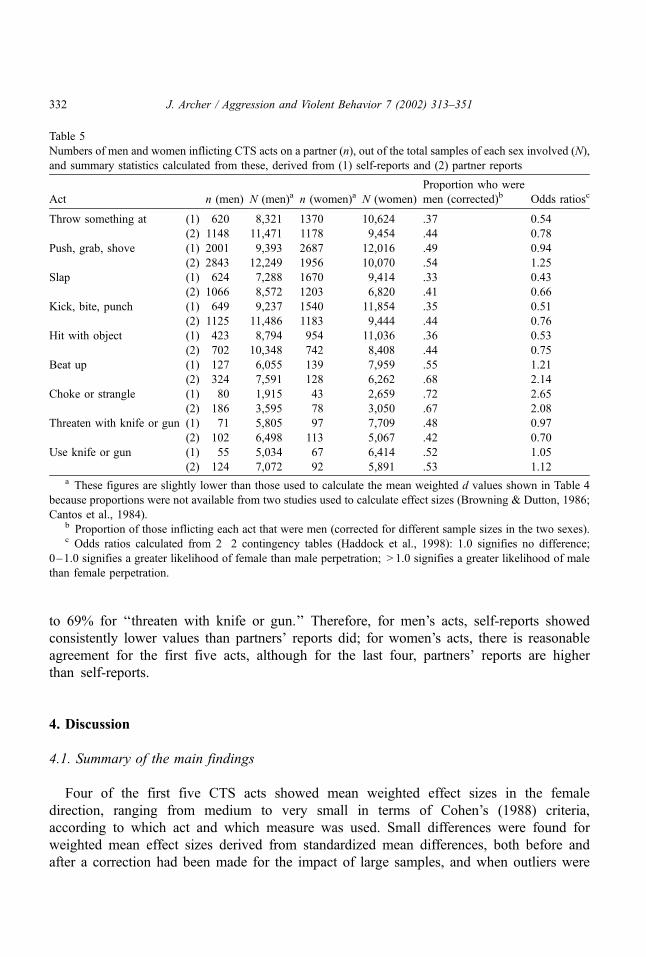
to 69% for ‘‘threaten with knife or gun.’’ Therefore, for men’s acts, self-reports showed
consistently lower values than partners’ reports did; for women’s acts, there is reasonable
agreement for the first five acts, although for the last four, partners’ reports are higher
than self-reports.
4. Discussion
4.1. Summary of the main findings
Four of the first five CTS acts showed mean weighted effect sizes in the female
direction, ranging from medium to very small in terms of Cohen’s (1988) criteria,
according to which act and which measure was used. Small differences were found for
weighted mean effect sizes derived from standardized mean differences, both before and
after a correction had been made for the impact of large samples, and when outliers were
Table 5
Numbers of men and women inflicting CTS acts on a partner (n), out of the total samples of each sex involved (N),
and summary statistics calculated from these, derived from (1) self-reports and (2) partner reports
Act n (men) N (men)a n (women)a N (women)
Proportion who were
men (corrected)b Odds ratiosc
Throw something at (1) 620 8,321 1370 10,624 .37 0.54
(2) 1148 11,471 1178 9,454 .44 0.78
Push, grab, shove (1) 2001 9,393 2687 12,016 .49 0.94
(2) 2843 12,249 1956 10,070 .54 1.25
Slap (1) 624 7,288 1670 9,414 .33 0.43
(2) 1066 8,572 1203 6,820 .41 0.66
Kick, bite, punch (1) 649 9,237 1540 11,854 .35 0.51
(2) 1125 11,486 1183 9,444 .44 0.76
Hit with object (1) 423 8,794 954 11,036 .36 0.53
(2) 702 10,348 742 8,408 .44 0.75
Beat up (1) 127 6,055 139 7,959 .55 1.21
(2) 324 7,591 128 6,262 .68 2.14
Choke or strangle (1) 80 1,915 43 2,659 .72 2.65
(2) 186 3,595 78 3,050 .67 2.08
Threaten with knife or gun (1) 71 5,805 97 7,709 .48 0.97
(2) 102 6,498 113 5,067 .42 0.70
Use knife or gun (1) 55 5,034 67 6,414 .52 1.05
(2) 124 7,072 92 5,891 .53 1.12a These figures are slightly lower than those used to calculate the mean weighted d values shown in Table 4
because proportions were not available from two studies used to calculate effect sizes (Browning & Dutton, 1986;
Cantos et al., 1984).b Proportion of those inflicting each act that were men (corrected for different sample sizes in the two sexes).c Odds ratios calculated from 2�2 contingency tables (Haddock et al., 1998): 1.0 signifies no difference;
0–1.0 signifies a greater likelihood of female than male perpetration; > 1.0 signifies a greater likelihood of male
than female perpetration.
J. Archer / Aggression and Violent Behavior 7 (2002) 313–351332
removed. The same pattern was found for self- and partner reports analyzed separately by
the same method, although partner reports tended to show smaller effect sizes than self-
reports. The same pattern was apparent when corrections were made for large samples,
and when outliers were removed. When d values were derived from odds ratios, this
considerably increased the magnitude of the effect sizes. These values are reflected in the
proportions of those committing each act who were male for the four acts (self-reports:
.33 to .37; partner reports: .41 to .44), shown in Table 5, and also in the odds ratios in
the same table. The exception to this pattern among the three ‘‘minor’’ acts was ‘‘push,
grab, shove,’’ which showed a very small mean weighted d in the male direction for
partner and composite measures and a value of near zero for self-reports when stand-
ardized mean differences were used. Men and women tended to use this act approx-
imately equally, although partner reports showed a slight tendency in the male direction
(odds ratio of 1.25). The two acts, ‘‘kick, bite, punch,’’ and ‘‘hit with object,’’ which have
been labeled as ‘‘severe’’ items in some previous studies (Makepeace, 1983; Morse, 1995;
Straus, 1977–1978), were more frequent among women than men, whatever the method
of measurement used, with odds ratios considerable less than one (Table 5).
Men used ‘‘beat up’’ and ‘‘choke or strangle’’ more often than women did, although
effect sizes were very small to small when derived from standardized mean differences.
They became medium for ‘‘beat up’’ from partners’ reports and for ‘‘choke or strangle’’
from both respondents, when derived from odds ratios. The proportions of those
committing these acts that were men were .55 (self) and .68 (partner) for ‘‘beat up’’
and .72 (self) and .67 (partner) for ‘‘choke or strangle.’’ Odds ratios were over two in the
last three cases. Therefore men committed these acts considerably more frequently than
women, although even on the basis of the higher estimates, around a third of the
perpetrators were women.
Effect sizes for the acts involving weapons showed little difference from zero, with the
possible exception of values obtained from odds ratios from partners’ reports. In this case,
there was a suggestion of a small effect in the female direction, for threaten with a
weapon, and an even smaller one in the male direction for using a weapon.
These analyses showed that only ‘‘beat up’’ and ‘‘choke or strangle’’ (and possibly
‘‘push, grab, shove’’) were consistently in the male direction. Even in these cases, the
difference was smaller than had been anticipated, in that a substantial number of those
reported to have carried out these potentially damaging acts were women.
4.2. Using odds ratios as effect sizes
Odds ratios provide a statistic that is intuitively understandable, and when there are
substantial numbers involved in all cells (as in the case of the aggregate values shown in
Table 5), they are clearly a useful statistic, which can also be converted to d values.
When they are derived from individual studies involving zeros, they can only be
computed by adding a constant to all of the cells in the 2�2 contingency table. This
yielded some inflated values in individual cases. For example, where one sex (usually
men) had a substantially lower sample size than the other, an effect size of around .50
J. Archer / Aggression and Violent Behavior 7 (2002) 313–351 333
could result from zero values for both sexes (which would produce a g value of zero
from the standardized mean difference method). Although such individual cases would
seem anomalous, for most acts they did not produce substantial discrepancies in the mean
weighted effect size when this was compared with that obtained from aggregated
frequencies, where no weighting was required because there were no zeros.
Generally, study-level effect sizes were considerably larger when computed from odds
ratios than from standardized mean differences. The second method must therefore be
regarded as conservative. At the same time, d values obtained from odds ratios clearly
yield inflated values when infrequent acts are involved. One consequence of the much
larger study-level effect sizes generated from odds ratios is that they resulted in much
more heterogeneous data sets than those generated from standardized mean differences
(Table 3). This may produce problems for analyzing moderators of effect sizes. In the
present study, this analysis was restricted to the composite data from the standardized
mean difference effect sizes.
4.3. Moderators of effect sizes
Samples involving younger ages and dating, rather than older, cohabiting or married
couples showed effect sizes more in the female direction for some acts, in particular
‘‘slap,’’ ‘‘kick, bite, punch,’’ and to a lesser extent, ‘‘throw something at’’ and ‘‘choke or
strangle.’’ However, this difference is likely to be a partial consequence of treatment
samples being included among the older people. Community samples showed no items
substantially in the male direction (Table 4), although effect sizes were slightly less in the
female direction than for students on some items. The largest differences were between
the treatment samples (which were characterized by relationship problems including
partner violence), and both the community and student categories. Treatment samples
had large d values in the male direction for a number of acts, both ‘‘severe’’ and
‘‘minor.’’ These findings are consistent with the analysis of aggregate data (Archer,
2000a), in showing that high effect sizes in the male direction are found using the CTS
among samples such as women in refuges, and those selected for high levels of partner
violence or marital problems. They indicate that the CTS is sensitive to high levels of
male violence, and support the view of Johnson (1995) that physical aggression is
generally mutual in community samples, but is much more in the male direction in
samples selected for severe victimization.
There were higher effect sizes in the female direction for unpublished than published
reports, for four of the first five acts. Straus (1997) claimed that in the earlier years of
research on partner aggression, several findings that were in the female direction had been
deliberately suppressed. It is difficult to say whether the present patterns indicate any
hidden publication bias. Findings in the female direction have been published many times
since the early 1980s, often by women investigators: In the present study effect sizes were
also significantly higher in the female direction for the same four acts, when the first
author was female rather than male. The findings for unpublished studies could be due to
a confounding variable, such as the greater prevalence of student samples among
J. Archer / Aggression and Violent Behavior 7 (2002) 313–351334
unpublished studies, most of which were dissertations. This is supported by a similar
pattern of differences between student and community samples to those between published
and unpublished studies.
4.4. The reliability of CTS data
The first six acts showed significantly higher effect sizes in the male direction for
partner than self-reports. This is consistent with aggregate measures (Archer, 1999,
2000a), in suggesting that both sexes, and especially men, tend to underreport for
themselves compared to their partners’ reports of them. It is also consistent with findings
that people were less willing to report their own aggression than that of their partners
(Riggs et al., 1989). The remaining acts, ‘‘choke or strangle,’’ and the two involving
weapons, showed no significant differences between effect sizes from partner and self-
reports. These findings are different from those obtained with aggregate measures (Archer,
1999, 2000a), but are not incompatible with them, since these least common acts will
have minimal impact on the aggregate measures. They are, however, inconsistent with
findings that people’s willingness to report their own physical aggression decreased with
the severity of the act (Riggs et al., 1989), and that such acts are more socially
undesirable (Sugarman & Hotaling, 1997).
Effect size measures of sex differences are a step removed from the values reported by
aggressors and victims of aggression. When these were examined, as percentages of men
and of women reported to have committed each act, men showed a consistent pattern
across all nine acts for partners’ reports to be higher than self-reports (Table 6). The
difference ranged from about 9% (‘‘push, grab, shove’’) to 105% (‘‘beat up’’). Women
showed little difference between self- and partner reports for the first five acts, whereas
Table 6
Proportions of men and women inflicting each CTS act on a partner, from self and from partners’ reports, and the
percentage differences between self- and partner reports
Men Women
Self Partner % Difference Self Partner % Difference
Throw something at .075 .100 33.3 .129 .125 �3.2
Push, grab, shove .213 .232 8.9 .224 .194 �13.4
Slap .086 .124 44.2 .177 .176 �0.6
Kick, bite, punch .070 .098 40.0 .130 .125 �3.8
Hit with object .048 .068 41.7 .086 .088 �2.3
Beat up .021 .043 104.8 .017 .020 17.6
Choke or strangle .042 .052 23.8 .016 .026 62.5
Threaten with knife or gun .012 .016 33.3 .013 .022 69.2
Use knife or gun .011 .018 63.6 .010 .016 60.0
Positive values indicate an increase by the partner report over the self-report, and negative values indicate
a decrease.
J. Archer / Aggression and Violent Behavior 7 (2002) 313–351 335
partners’ reports were higher than self-reports for the four most damaging acts, by
between 18% and 69%.
These findings suggest the following possibility. Men’s self-reports consistently involve
a degree of underreporting compared to partner reports, and this ranges from moderate or
small to large. Women’s self- and partner reports show considerable overall agreement for
the first five acts, but for the last four acts there is the same pattern of underreporting
found for men. It was predicted that potentially damaging acts would be underreported by
both sexes, and to a greater extent by male than female recipients, but this pattern was
only found for ‘‘beat up.’’ For ‘‘choke or strangle’’ and ‘‘threaten with a knife or gun,’’
women appeared to be underreporting to a greater extent than men, suggesting that
women are less willing than their partners to report these two severe acts of physical
aggression. For the first three of the last four acts, differences of interpretation could have
accounted for the discrepancies, so that women could be viewing their own acts as less
threatening and damaging, and therefore less salient, than their male partners do. It is
difficult to see how this explanation could apply to ‘‘use a knife or gun,’’ since it is
relatively unambiguous and (presumably) memorable. It would be useful in future to
clarify exactly what men and women are referring to when endorsing these items,
particularly when a woman is the perpetrator.
4.5. Suggested revisions to the CTS as a measure of partner violence
Some limitations of the CTS are apparent from the present findings. The version used
in most research involves several composite acts, notably ‘‘push, grab, shove’’ and ‘‘kick,
bite, punch,’’ which may produce different results when separated. These items are
separated in the Revised Conflict Tactics Scale (CTS2) described by Straus, Hamby,
McCoy, and Sugarman (1996), but this has not yet been widely used. As indicated above,
there are problems with combining guns and knives, and it may be useful to separate
household knives from knives that are carried on the person. It would also seem advisable
to include some additional items. One of these would be ‘‘scratch,’’ which featured in the
example used in the Introduction. In the CTS2, Straus et al. also introduced twisting a
partner’s arm or hair, slamming them against a wall, and burning or scalding them
on purpose.
Marshall (1994) addressed the limitations of the CTS items by designing a more
comprehensive measure including further acts of psychological and physical aggression.
Effect sizes for most acts showed higher frequencies for women than men according to
self-reports, as the CTS does, but there were some striking exceptions among some items
not included on the CTS. Pinning or holding the partner down was more commonly
admitted by men than women (g = .525; OR = 3.8, d = .74), as was shaking or roughly
5 Effect sizes calculated by D-STAT from the percentages of men and women committing each act (Table 12.1
in the paper), i.e., by the standardized mean difference method. Since this may be a conservative procedure, odds
ratios, and the d values computed from these, are also presented.
J. Archer / Aggression and Violent Behavior 7 (2002) 313–351336
handling (g = .28; OR = 1.9, d = .36) and spanking (g = .28; OR = 2.6, d = .53). For the
first two of these, partners reported larger values in the same direction (g = .63, OR = 5.1,
d = .89; and g = .39, OR = 2.4, d = .49). These values suggest that there are certain acts not
included in the CTS that were used by considerably more men than women, even though
several other acts were used by more women than men in the same sample. We should
note the controlling nature of the three acts referred to above. Marshall also found that
distress among the victims of marital abuse was often most closely related to subtle forms
of behavior by the partner rather than those that are more obviously harmful.
The term ‘‘battering’’ is often used in general discussions of marital violence (e.g.,
Smith, Earp, & DeVellis, 1995), as in ‘‘wife batterer,’’ but is seldom employed in studies
involving physical aggression by both sexes. Unlike most CTS items, it is not defined in
terms of a specific action, although it clearly has connotations of repeated and one-sided
use of force.
The CTS is often criticized for failing to take into account the different meanings of
the same acts for men and for women. According to some commentators, any act
included on the CTS will have more serious physical and psychological effects when
carried out by a man than a woman (e.g., Dobash et al., 1992; Dutton, 1994; Nazroo,
1995; Rhodes, 1992; Romkens, 1997). Marshall (1992a) assessed the impact of acts of
physical aggression on women by asking samples of students and women from the
community to rate (along 10-point scales) the seriousness of 49 forms of abusive and
violent behavior found in the family violence literature. Specifically, they asked how
serious, aggressive, abusive, threatening, and violent it would be if a man did the
particular act to a woman partner. From these ratings, global severity scores were
calculated. Factor analysis revealed four different levels of severity of physical aggression,
three of threat, and also sexual and symbolic violence. The highest severity score was, as
expected, obtained for serious violence. Women from the community generally rated the
acts more severely than did the students: for example, the highest mean rating (for serious
physical violence) was 9.24 for the students and 9.79 for the community women, ratings
that were near to maximum.
Marshall (1992b) also considered these forms of abusive and violent behavior when
directed towards men by women, and undertook a similar study involving men rating the
severity of the acts used by a woman to her male partner. Similar dimensions were found
to those in the study involving male abuse and violence. Again, the highest mean ratings
were for serious forms of violence (8.15 for the students and 9.02 for the community
sample). The ratings were overall a little reduced compared with those by men to women,
but not as much as might be expected if the whole meaning of such acts changes when
the sex of the aggressor changes. Again, the ratings were highest among the community
sample, indicating that both male and female students take specific acts of relationship
abuse and aggression slightly less seriously than do people from an older community
sample. We should, however, note the low response rate for the community study that
may have biased the sample.
Concentrating on the impact of acts of physical aggression in terms of the sex of the
aggressor may hide a more general problem with several of the CTS categories. It is
J. Archer / Aggression and Violent Behavior 7 (2002) 313–351 337
difficult to determine the extent to which they represent innocuous actions akin to
symbolic violence, or whether they are likely to cause injuries. Throwing a paperweight
or kicking someone hard on the shin with a pointed-toed shoe or heavy boot are clearly
different in their effects from throwing a pillow or a light punch to a well-padded part of
the body. A man or a woman could inflict either of the two alternatives on a partner. It is
important to acknowledge these possibilities in future, by incorporating measures of the
impact of such events (as indeed the CTS2 does to some extent).
The evidence reviewed in this section suggests that if certain controlling acts are added
to those already in the CTS, effect sizes of medium to large magnitude may be found in
the male direction. This is to some extent consistent with the present findings for ‘‘choke
or strangle’’ and ‘‘beat up,’’ which showed low to medium effect sizes in the male
direction. The claim that acts are perceived in substantially different ways by the two
sexes received only very limited support in a rating scale study of samples of students
and community men and women. It would be useful to incorporate such severity of
impact ratings into future studies involving the recipients of partner physical aggression.
This would go a long way towards meeting the criticism of lack of meaning in CTS acts,
and at the same time minimize reliance on ambiguous terms such as battering or abuse, or
‘‘intimidating’’ or ‘‘undefendable’’ acts (Nazroo, 1995).
4.6. Limitations of the current data base
The database currently available for these analyses is considerably limited in that most
studies have been carried out in the US, with a minority in other western nations (Table 1).
There is also a disproportionate number of samples comprising college students.
Therefore, the generality of the present findings must be qualified in terms of the
geographical location and cultures involved. Historical and cultural analyses have
indicated widespread encouragement of men hitting their wives as a form of social
control, which is associated with patriarchal values (Dobash & Dobash, 1977–1978,
1980). In the previous paper (Archer, 2000a), I argued that among samples in the modern
US, particularly young, dating, college students, the impact of these values is diminished,
owing to a more modern norm involving disapproval of men hitting women. One
consequence of this will be, in many cases, to remove the deterrent effect of physical
aggression by a male partner (Fiebert & Gonzalez, 1997). Although not as clear as in the
analyses of aggregate data (Archer, 2000a), there were still larger effect sizes in the
female direction among younger, dating, student samples. This was the case for items
such as ‘‘slap,’’ ‘‘kick, bite, punch’’ and ‘‘throw something,’’ and in the smaller effect
sizes in the male direction for ‘‘beat up’’ and ‘‘choke or strangle.’’ Again, this supports
the view that partner physical aggression is influenced by two competing sets of norms
(Archer, 2000a).
In many parts of the world, these inhibitory influences on male aggression are absent,
and women are subject to patriarchal values that enable men to use acts of severe
violence with few sanctions. Reviewing the scattered evidence from a variety of
nonwestern peoples and places indicated greater acceptance, and occurrence, of men’s
J. Archer / Aggression and Violent Behavior 7 (2002) 313–351338
violence to their spouses (Archer, 2000a). The evidence was not in a form that made it
easy to compare with western data. Since the first priority is to highlight the occurrence
of women’s maltreatment, practically no data are available for male partners. The CTS
has been used in only three studies in nonwestern nations, one of which (Kim & Cho,
1992) contained data on individual acts. This study obtained partners’ reports from a
fairly large sample of married people in Korea. For the first six CTS acts, g values
computed from standardized mean differences ranged from .17 to .35 in the male
direction (ORs from 1.62 to 4.48; associated d values from .27 to .83). The authors
suggested that influences such as male dominance, tolerance of men’s spousal violence,
and lack of community support for victims, all contribute to a social climate enabling
men to physically aggress more to their wives than vice versa. Findings such as these
indicate that the CTS is suitable for such cross-cultural comparisons. Notwithstanding the
limitations discussed in the previous section, the CTS does have two considerable
strengths: It is a standard measure that has been used in many investigations in the US
and elsewhere, and there is no doubt that it does register high levels of male aggression.
There are of course practical problems in obtaining representative samples for cultures
(and subcultures) where patriarchal values (including the use of violence to control
women) are part of the traditions of a closed community. Reports of the position of
women in countries under Islamic law, such as Iran (Moin, 1998) and Pakistan
(Frenkiel, 1999), indicate the following. Women are kept in strict purdah, so-called
honor killings of wives are widespread, and the law is lenient towards husbands who
have killed their wives. It would be extremely difficult to study violence towards
women under such conditions.
4.7. Implications for application and public policy
Public policy is concerned mainly with women as victims of partner violence and men
as perpetrators, an approach that is largely based on victim samples or analyses of crime
statistics. The present analyses involved samples where measures could be obtained for
both men and women, and typically consisted of community samples rather than those
selected for severe victimization. Together with previous meta-analyses involving aggreg-
ate CTS and injury data (Archer, 2000a), it supported the view of researchers such as
Johnson (1995) and Straus (1997, 1999) that, in such general samples, perpetrators of
physical aggression can be male or female. The present analyses extended the previous
ones to indicate that it is not only low-risk acts that are perpetrated by women, but that a
substantial minority of endorsements of ‘‘beat up’’ and ‘‘choke or strangle’’ involved
women perpetrators.
The issue raised by these analyses for public policy is whether current concern with
female victims of prolonged and severe male violence, for example in refuges, is
misplaced, as some advocates of ‘‘battered husbands’’ would suggest. However, the
present findings confirm the very high rates of male violence perpetrated against such
women. Where CTS measures were available from samples of violent husbands or from
refuge samples, they showed very large effect sizes in the male direction, overall (Archer,
J. Archer / Aggression and Violent Behavior 7 (2002) 313–351 339
2000a) and for individual acts (present study). Concern with the victims in such cases is
certainly not misplaced, but regarding them as the only victims of partner violence is too
narrow a view of the problem according to the present findings.
One reaction to such findings has been to regard them as being of little relevance for
dealing with severe victimization, which is usually defined as that inflicted upon
women. For example, Smith et al. (1995) constructed a questionnaire measure of the
psychological state involved in chronic victimization, and were careful to distance these
items from the sort of acts of physical aggression measured by the CTS. In doing so, it
was implied that CTS acts were qualitatively different from ‘‘battering,’’ the prolonged
use of force or the threat of force to control another through instilling fear. Yet, the
same study showed that measures on the new Women’s Experience with Battering scale
were strongly associated with CTS scores. One practical danger with seeking to
downplay the significance of acts of physical aggression found through the CTS applied
to community samples is that their physical and psychological consequences will also be
minimized. The present analyses indicate that men are among those who are likely to be
on the receiving end of acts of physical aggression. The extent to which this involves
mutual combat or the male equivalent to ‘‘battered women’’ is at present unresolved.
Both situations are causes for concern. Straus (1997) has warned of the dangers
involved — especially for women — when physical aggression becomes a routine
response to relationship conflict. ‘‘Battered men’’ — those subjected to systematic and
prolonged violence — are likely to suffer physical and psychological consequences,
together with specific problems associated with a lack of recognition of their plight
(George, 1994, 1998). Seeking to address these problems need not detract from
continuing to address the problem of ‘‘battered women.’’
Acknowledgments
I thank Nicola Graham-Kevan, Jane Ireland, and Samantha Gilling for invaluable
assistance with the analysis and literature search; Blair Johnson and Alice Eagly for
answering inquiries about meta-analytic procedures; Norman Birbeck, Marion Seed,
and Andrea Burch for additional help with the literature search. I also thank Alice
Eagly and Frank Fincham for constructive critical comments on an earlier version of
the paper.
Appendix A. Effect sizes for specific CTS acts of physical aggression towards spouses or
nonmarital partners
The main figures are from the aggressor’s reports, those in round brackets are from
victims’ reports, and those in square brackets are composites d=effect size, which is
positive if in the male direction and negative if in the female direction; n=number of
individuals in the study.
J. Archer / Aggression and Violent Behavior 7 (2002) 313–351340
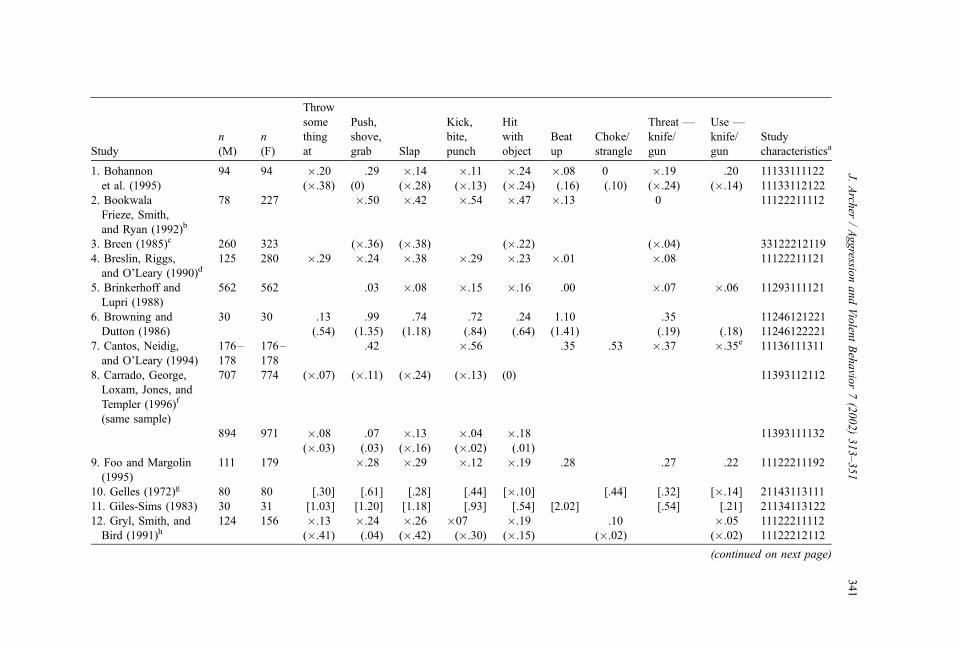
Study
n
(M)
n
(F)
Throw
some
thing
at
Push,
shove,
grab Slap
Kick,
bite,
punch
Hit
with
object
Beat
up
Choke/
strangle
Threat —
knife/
gun
Use —
knife/
gun
Study
characteristicsa
1. Bohannon 94 94 �.20 .29 �.14 �.11 �.24 �.08 0 �.19 .20 11133111122
et al. (1995) (�.38) (0) (�.28) (�.13) (�.24) (.16) (.10) (�.24) (�.14) 11133112122
2. Bookwala
Frieze, Smith,
and Ryan (1992)b
78 227 �.50 �.42 �.54 �.47 �.13 0 11122211112
3. Breen (1985)c 260 323 (�.36) (�.38) (�.22) (�.04) 33122212119
4. Breslin, Riggs,
and O’Leary (1990)d125 280 �.29 �.24 �.38 �.29 �.23 �.01 �.08 11122211121
5. Brinkerhoff and
Lupri (1988)
562 562 .03 �.08 �.15 �.16 .00 �.07 �.06 11293111121
6. Browning and 30 30 .13 .99 .74 .72 .24 1.10 .35 11246121221
Dutton (1986) (.54) (1.35) (1.18) (.84) (.64) (1.41) (.19) (.18) 11246122221
7. Cantos, Neidig,
and O’Leary (1994)
176–
178
176–
178
.42 �.56 .35 .53 �.37 �.35e 11136111311
8. Carrado, George,
Loxam, Jones, and
Templer (1996)f
(same sample)
707 774 (�.07) (�.11) (�.24) (�.13) (0) 11393112112
894 971 �.08 .07 �.13 �.04 �.18 11393111132
(�.03) (.03) (�.16) (�.02) (.01)
9. Foo and Margolin
(1995)
111 179 �.28 �.29 �.12 �.19 .28 .27 .22 11122211192
10. Gelles (1972)g 80 80 [.30] [.61] [.28] [.44] [�.10] [.44] [.32] [�.14] 21143113111
11. Giles-Sims (1983) 30 31 [1.03] [1.20] [1.18] [.93] [.54] [2.02] [.54] [.21] 21134113122
12. Gryl, Smith, and 124 156 �.13 �.24 �.26 �07 �.19 .10 �.05 11122211112
Bird (1991)h (�.41) (.04) (�.42) (�.30) (�.15) (�.02) (�.02) 11122212112
(continued on next page)
J.Arch
er/Aggressio
nandViolen
tBehavio
r7(2002)313–351
341
13. Kim and Cho
(1992)
609 707 (.28) (.19) (.35) (.26) (.26) (.17) (.06) (.05) 21593112129
14. Lane and 156 162 �.19 .11 �.25 �.16 .28 .17 �.04 11192211152
Gwartney-Gibbs
(1985)i(�.02) (.05) (�.10) (�.18) (�.10) (�.18) (.03) 11192212152
15. Laner (1985: 1)j 106 191 �.13 .16 �.06 �.19 .17 .17 .07 12192211112
(�.35) (.15) (�.22) (�.44) (.08) (.18) (�12) 12192212112
16. Laner (1985: 2)j 32 80 .33 .19 .48 0 0 .33 0 12192211112
(�.33) (�.10) (.12) (�.22) (.12) (0) (0) 12192212112
17. Laner and 129 242 0 0 �.31 �.07 �.09 .24 .17 11192211132
Thompson (1982)k (�.27) (.09) (.09) (�.03) (�.07) (.02) (�.09) 11192212132
18. LeBlanc (1995) 126 302 �.18 �.25 �.30 �.35 �.24 0 �.07 0 0 31222211121
(.03) (.20) (�.30) (�.06) (.04) (.07) (.12) (.08) (.12) 31222212121
19. Lehr (1988) 75 75 �.29 .25 �.02 .00 �.11 .17 �.25 �.19 31297111111
(�.11) (.10) (�.04) (�.10) (.02) (.62) (�.30) (�.05) 31297112111
20. Magdol et al. 436 425 �.27 �.18 �.40 �.35 �.35 .02 .17 �.10 �.06 11623211122
(1997) (�.25) (.14) (�.49) (�.27) (�.21) (.07) (.09) (�.11) (0) 11623212122
21. Makepeace 97 146 .14 .07 .27 .06 .21 .32 .17 .27 11192211121
(1983) (0) (.25) (.04) (�.09) (.08) (�.06) (�.06) (�.03) 11192212121
22. Makepeace
(1986)
1059 1279 �.11 .02 �.12 �.07 �.04 .01 .05 .05 11192211131
(�.09) (.28) (�.02) (�.07) (.33) (.14) (.00) (.09) 11192212131
23. Marshall 15 15 �.13 .28 �.84 �.39 �.55 0 0 0 41192111132
(1987a)/Marshall
and Rose (1988: 1)
(.17) (.55) (.17) (.17) (0) (.55) (0) (0) 41192112132
24. Marshall 77 108 �.27 �.14 �.62 �.46 �.36 .15 .15 0 41192211132
(1987a)/Marshall
and Rose (1988: 2)
(�.12) (.31) (�.23) (�.12) (�.16) (�.13) (�.15) (0) 41192212132
J.Arch
er/Aggressio
nandViolen
tBehavio
r7(2002)313–351
342
25. Marshall 60 33 �.08 �.28 �.14 �.04 �.16 .22 .18 0 41192211132
(1987a)/
Marshall and
Rose (1988: 3)
(.09) (.34) (�.51) (�.35) (�.35) (�.22) (�.18) (�.18) 41192212132
26. Marshall 34 44 �.16 .15 .1 �.26 �.39 .21 0 0 41192111112
(1987b: 1) (�.53) (.34) (�.68) (�.50) (�.26) (.10) (�.16) (.19) 41192112112
27. Marshall 106 155 �.24 .16 �.52 �.32 �.35 .10 �.08 �.13 41192211112
(1987b: 2) 103 (�.30) (.18) (�.39) (�.38) (�.16) (.09) (0) (0) 41192212112
28. Marshall 98 93 �.24 �.21 �.61 �.27 �.17 .05 0 0 41192211112
(1987b: 3) (�.14) (.37) (�.16) (.06) (�.10) (.19) (.06) (.08) 41192212112
29. Marshall (1994)l 208 229 �.32 �.20 �.43 �.23 �.20 �.14 .07 �.05 .02 21193111192
(�.24) (.15) (�.41) (�.41) (�.22) (.15) (.15) (.01) (�.14) 21193112192
30. Marshall and 204 249 �.22 �.07 �.53 �.30 �.23 .06 �.02 �.02 11122211132
Rose (1990) (�.24) (.24) (�.29) (�.21) (�.17) (.08) (�.06) (.15) 11122212132
31. Masterson
(1987)
60 91 (.02) (�.38) (.04) (�.10) (.22) (.24) 33122222112
32. Morse (1995)
time 1m 475 475 [�.40] [.05] [�.16] [�.28] [�.32] [.31] [�.03] [.03] 11193213122
time 2m 723 723 [�.36] [�.03] [�.20] [�.32] [�.30] [.18] [�.13] [.02] 11193913122
time 3m 959 959 [�.31] [�.02] [�.22] [�.27] [�.30] [.07] [�.08] [.00] 11193913122
time 4m 1001 1001 [�.28] [�.04] [�.22] [�.21] [�.22] [.09] [�.10] [�.10] 11193113122
33. Murphy (1988)n 222 250 �.11 .02 �.47 �.14 �.14 0 0 .09 21192211141
(�.23) (.17) (�.21) (�.23) (�.11) (.23) (.12) (0) 21192212141
(same sample) 118 153 �.19 .13 �.31 .02 �.04 0 0 0 21192211111
(�.02) (�.11) (�.19) (�.14) (�.02) (0) (0) (0) 21192212111
34. O’Keefe (1997) 385 554 �.27 �.10 �.34 �.27 �.21 .02 �.09 �.08 11111211132
�.22 �.08 �.21 �.21 �.16 .07 �.05 �.04 11111221232
35. O’Leary et al.
(1989)
time 1o 272 272 �.20 �.10 �.38 �.34 �.25 �.15 .00 11133211111
(continued on next page)
J.Arch
er/Aggressio
nandViolen
tBehavio
r7(2002)313–351
343
time 2 272 272 �.19 �.22 �.31 �.27 �.22 .00 �.13 11133111111
time 3 272 272 �.22 �.04 �.18 �.22 �.25 �.08 �.11 11133111111
36. Papalia (1994)p 147 147 �.26 .03 �.24 �.29 �.28 �.24 31133111119
(�.33) (�.13) (0) (�.22) (�.28) (.04) 31133112119
�.13 .11 �.21 �.11 �.11 .17 31133111119
(�.27) (�.11) (�.11) (�.21) (�.30) (0) 31133112119
37. Pedersen and 50 116 �.34 �.31 �.32 �.22 �.08 .08 .26 .26 11222211112
Thomas (1992) (�.33) (.21) (�.22) (�.20) (�.29) (�.15) (�.24) (�.37) 11222212112
38. Plass and 90 79 �.10 .04 �.47 �.49 �.30 �.30 0 0 11192211192
Gessner (1983)q (78) (�.55) (�.24) (�.41) (�.28) (�.28) (.12) (0) (0) 11192212192
39. Riggs (1993) 262 391 �.24 �.22 �.32 �.35 �.03 .07 .04 11122211111
(�.19) (.10) (�.10) (�.10) (.05) (.02) (�.09) 11122212111
40. Riggs and
O’Leary (1996)
113 232 �.07 �.26 �.37 .03 .07 .05 11122211111
41. Roberts,
O’Toole, Raphael,
Lawrence, and
Ashby (1996)r
670 553 (.21) (.42) (.38) (.40) (.33) (.10) 11455112122
42. Roscoe and
Callahan (1985)s96 108 (.13) (.25) (.05) (.05) (.13) (0) (.13) (0) (0) 11111212131
43. Rouse (1988)c 104 124 (�.21) (�.53) (�.42) 13192212112
44. Rouse, Breen,
and Howell
(1988: 1)c
48 82 (�.27) (�.27) (�.38) 13192112132
45. Rouse et al.
(1988: 2)c58 72 (�.20) (�.44) (�.32) 13192212132
46. Schartz (1995) 88 88 �.44 �.07 �.24 �.22 �.27 �.22 0 .15 31122211132
(�.30) (.04) (�.42) (�.31) (�.31) (�.15) (�.15) (�.15) 31122212132
J.Arch
er/Aggressio
nandViolen
tBehavio
r7(2002)313–351
344
47. Schwartz,
O’Leary, and
Kendziora (1997)
122 106 �.43 �.63 �.43 �.28 .20 .22 11111211131
48. Sigelman, Berry 112 384 �.21 .29 �.38 �.26 �.18 .11 .4 0 11122211132
and Wiles (1984) (�.28) (.10) (�.45) (�.39) (�.22) (0) (.02) (.10) 11122212132
49. Stacey, 86 86 .74 .48 .14 .78 �.28 23146111111
Hazelwood,
and Shupe (1994)t(.45) (.36) (.19) (.43) (.10) 23146112111
50. Stacy, Schandel,
Flannery, Conlon,
and Milardo (1994)
53 106 �.50 �.45 �.68 �.59 �.48 0 �.12 0 .24 11192211111
51. Stets and 146 125 �.51 �.21 �.58 �.38 �.39 �.23 �.09 �.19 �.19 11123211122
Henderson (1991)u (.27) (.03) (�.31) (�.21) (�.28) (.19) (.23) (�.11) (0) 11123212122
52. Stets and Pirog-
Good (1989)
118 169 (�.09) (.37) (�.12) (.03) (.05) (.03) (0) (0) 11122212132
53. Straus
(1977-1978)v2143 2143 [.12] [.08] [.02] [�.04] [�.05] [.05] [�.03] [.02] 11193113121
54. Straus and
Gelles (1986)
3520 3520 [�.08] [.01] [�.07] [�.07] [�.09] [.05] [�.03] [0] 11193113121
55. Szinovacz 103 103 �.22 �.16 �.08 �.29 �.26 �.19 11193111122
(1983) (�.15) (.12) (.10) (.05) (.04) (�.14) 11193112122
56. de Vries Robbe,
March, Vinen,
Horner, and Roberts (1996)w
475 526 (.05) (.31) (.18) (.13) (.15) (.06) 11495912132
57. White and Koss 2105 2602 �.10 .09 �.18 �.01 11122211122
(1991) (�.13) (�.08) (�.18) (�.20) . 11122212122
58. Worth, Matthews, 31 78 �.26 .11 �.29 �34 �.14 0 0 0 11192211132
and Coleman (1990) (.09) (.29) (.09) (.27) (.13) (.13) (0) 11192212132
J.Arch
er/Aggressio
nandViolen
tBehavio
r7(2002)313–351
345

a Sample characteristics: Variable 1: source of data (1 = journal article; 2 = book or book chapter;
3 = dissertation; 4 = other unpublished source). Variable 2: measurement instrument (1 = CTS, or modified or
earlier version of it, including the CRT (Straus, 1977–1978) and measures used by Gelles (1972); 2 = a mixture of
Hudson and McIntosh’s (1981) Index of Spouse Abuse and the CTS; 3 = Center for Social Research (CSR) Abuse
Index (physical abuse subscale) designed by Stacey and Shupe (1983). Variable 3: country (1 = USA; 2 = Canada;
3 = UK; 4 = Australia; 5 = Korea; 6 = New Zealand). Variable 4: age category, means (1 = 14–18; 2 = 19–22;
3 = 23–30; 4 = 31–37; 5 = 38–49; 9 = wider age range or not specified). Variable 5: type of sample (1 = high
school students; 2 = college students; 3v= community or from military base; 4 = women shortly after entering
women’s shelter for abused wives; 5 = emergency room; 6 = couples referred to treatment program for assaultive
husbands; 7 = couples referred to treatment program for marital violence or marriage counselling). Variable 6:
majority marital status (1 = married or cohabiting; 2 = unmarried and not cohabiting; 9 = mixture). Variable 7:
level of measurement (1 =nominal (usually frequency or proportions of each sex showing one or more incidences
of that act); 2 = interval (usually from a frequency scale applied to each act). Variable 8: source of data (1 = self-
report; 2 = partner’s report; 3v = composite, i.e., some data points were from self-reports and others were from
partners). Variable 9: statistic used to calculate g value (1 = frequency or proportion; 2 = means and standard
deviations; 3 = c2). Variable 10: Reference period (1 = current or most recent relationship; 2 = over the past year;
3 = in present and past relationships; 4 = in past relationships only; 5 = over more than 2 years; 9 = not specified).
Variable 11: sex of first author (1 = male; 2 = female; 9 = not specified).b In this study, ‘‘kick, bite or punch’’ was replaced by ‘‘kick or bite.’’c In these studies, ‘‘kick, bite or punch’’ were replaced by ‘‘strike, slap or punch,’’ which was included under
‘‘slap’’ because this was the more common act of the three. In Breen’s study, ‘‘threaten with a knife or gun’’ was
replaced by ‘‘threaten with an object or weapon.’’d This appears to be the same sample and findings reported by Riggs, O’Leary, and Breslin (1990).e This figure was calculated from the P value.f In this study, ‘‘throw something at’’ was replaced by ‘‘hit with object, throw heavy object, or smash
something over you’’; ‘‘push, grab, shove’’ was replaced by ‘‘push, grab, bitten, scratched or shoved with some
force’’; ‘‘kick, bite or punch’’ was replaced by ‘‘punch or kick’’; and ‘‘hit with object’’ replaced by ‘‘struck with a
sharp or pointed object.’’ Two values were provided in this paper, for all relationships and for current
relationships. Those for all relationships were used in the meta-analyses, because there were figures for both self-
and partner reports, and the sample sizes were larger for current relationships.g ‘‘Slap’’ included scratch and grab; ‘‘kick, bite or punch’’ was replaced by ‘‘punch or kick.’’h In this study, ‘‘kick, bite or punch’’ was replaced by separate categories for kick and punch: The larger values
were used to calculate gs. Choke or strangle was replaced by ‘‘attempt to strangle.’’ A separate category, ‘‘clawed,
scratched or bit’’ showed g=�0.31 (aggressor) and �0.46 (recipient).i Further analysis of this sample is reported in Gwartney-Gibbs, Stockard, and Bohmer (1987).j Punch and kick were separate categories: the larger values were used to calculate gs.k Data from this sample also reported in Laner (1983).l In this study, ‘‘kick, bite or punch’’ was replaced by separate categories for the three acts; ‘‘push, grab, shove’’
was replaced by ‘‘push, shove’’ and ‘‘grab suddenly/forcefully’’; and ‘‘slap’’ was subdivided into three categories.
In all three cases, the largest values were used to calculate gs.m These findings were from the same sample (National Youth Survey) assessed in 1983, 1986, 1989 and 1992:
The sample size increases as CTS data were only collected from those who were married or cohabiting. The values
used for the analyses were from time 4, which provided the largest sample size.n For this study, past relationships were used, as these yielded the largest sample size.o A longitudinal study: time 1 shows the values assessed at 1 month prior to marriage, time 2 at 18
months after marriage, and time 3 at 30 months after marriage. The mean of the three values was used in
the analysis.p The two sets of figures are from the first and third years of marriage for the same sample. The values used
in the analyses were means of the effect sizes calculated separately for the two time periods. In this study, kick,
bite, and punch were separate categories: The values shown here were derived from the highest value in any of
the three categories.
J. Archer / Aggression and Violent Behavior 7 (2002) 313–351346
References
Archer, J. (1999). Assessment of the reliability of the Conflict Tactics Scales: a meta-analytic review. Journal of
Interpersonal Violence, 14, 1263–1289.
Archer, J. (2000a). Sex differences in aggression between heterosexual partners: a meta-analytic review. Psycho-
logical Bulletin, 126, 651–680.
Archer, J. (2000b). Sex differences in partner aggression: a reply to Frieze (2000), O’Leary (2000), and White,
Smith, Koss and Figueredo (2000). Psychological Bulletin, 126, 697–702.
Archer, J., & Huntingford, F. (1994). Game theory models and escalation of animal fights. In M. Potegal, & J. F.
Knutson (Eds.), The dynamics of aggression: biological and social processes in dyads and groups (pp. 3–31).
Hillsdale, NJ: Erlbaum.
Bjorkqvist, K., Lagerspetz, K. M. J., & Kaukiainen, A. (1992). Do girls manipulate and boys fight? Develop-
mental trends in regard to direct and indirect aggression. Aggressive Behavior, 18, 117–127.
Bohannon, J R., Dosser, D. A., & Lindley, S. E. (1995). Using couple data to determine domestic violence rates:
an attempt to replicate previous work. Violence and Victims, 10, 133–141.
Bookwala, J., Frieze, I. H., Smith, C., & Ryan, K. (1992). Predictors of dating violence: a multivariate analysis.
Violence and Victims, 7, 297–311.
Breen, R. N. (1985). Premarital violence: a study of abuse within dating relationships of college students.
Unpublished master’s thesis, University of Texas at Arlington.
Breslin, F. C., Riggs, D. S., O’Leary, K. D., & Arias, I. (1990). Family precursors: expected and actual con-
sequences of dating aggression. Journal of Interpersonal Violence, 5, 247–258.
Brinkerhoff, M., & Lupri, E. (1988). Interspousal violence. Canadian Journal of Sociology, 13, 407–434.
Browning, J., & Dutton, D. (1986). Assessment of wife assault with the Conflict Tactics Scale: using couple data
to quantify the differential reporting effect. Journal of Marriage and the Family, 48, 375–379.
Buss, A. H., & Perry, M. (1992). The aggression questionnaire. Journal of Personality and Social Psychology, 63,
452–459.
Cantos, A. L., Neidig, P. H., & O’Leary, K. D. (1994). Injuries to women and men in a treatment program for
domestic violence. Journal of Family Violence, 9, 113–124.
Carrado, M., George, M. J., Loxam, E., Jones, L., & Templar, D. (1996). Aggression in British heterosexual
relationships: a descriptive analysis. Aggressive Behavior, 22, 401–415.
Claes, J. A., & Rosenthal, D. M. (1990). Men who batter: a study in power. Journal of Family Violence, 5, 215–
224.
q This study provided separate values for serious and casual dating relationships. The values for ‘‘serious’’ ones
are shown here.r In this study, ‘‘push, grab, shove’’ was replaced by ‘‘push’’ and ‘‘kick, bite or punch’’ by ‘‘kick,’’ and ‘‘beat
up’’ was replaced by ‘‘beat’’ and ‘‘use knife/gun’’ by ‘‘weapon used.’’s Separate figures were supplied for kick, bite and punch. The largest values were used to calculate gs.t Values were calculated from the percentages shown on pp. 56 and 57 (for partners), and on p. 75 (for self-
reports). There were problems in establishing the sample sizes, which were not presented in these tables. Earlier in
the book, it was stated that there were 86 couples studied, from a larger number who started the research program
in 1985. However, the data for self-reports also contain absolute numbers, which indicate that more than 86
couples were used to obtain these data. Since the sample sizes varied for each of the acts, it was decided to adopt a
conservative position treat the sample size as 86 men and 86 women. ‘‘Kick, bite, punch’’ was replaced by two
items for punch (to the face and to body), and separate for bite and kick. The largest values were used to calculate gs.u In this paper, the percentages for the men shown in their table were clearly incorrect (0.1% of 146). This
value is assumed to be 0.7% (i.e., 1), which would fit with the other percentages, which yield whole numbers.v Data also reported in Gelles and Cornell (1990) and Straus and Gelles (1986).w In this study, ‘‘slap’’ was included in with ‘‘push, grab, shove.’’
J. Archer / Aggression and Violent Behavior 7 (2002) 313–351 347
Cohen, J. (1988). Statistical power analysis for the behavioral sciences (2nd ed.). Hillsdale, NJ: Erlbaum.
de Vries Robbe, M., March, L., Vinen, J., Horner, D., & Roberts, G. (1996). Prevalence of domestic violence
among patients attending a hospital emergency department. Australian and New Zealand Journal of Public
Health, 20, 364–368.
Dobash, R. E., & Dobash, R. P. (1977–1978). Wives: the ‘‘appropriate’’ victims of marital violence. Victimology:
An International Journal, 2, 426–442.
Dobash, R. E., & Dobash, R. P. (1980). Violence against wives: a case against the patriarchy. London:
Open Books.
Dobash, R. P., Dobash, R. E., Wilson, M., & Daly, M. (1992). The myth of sexual symmetry in marital violence.
Social Problems, 39, 71–91.
Dutton, D. G. (1994). Patriarchy and wife assault: the ecological fallacy. Violence and Victims, 9, 167–182.
Eagly, A. H. (1995). The science and politics of comparing women and men. American Psychologist, 50, 145–158.
Eagly, A. H., & Wood, W. (1991). Explaining sex differences in social behavior: a meta-analytic perspective.
Personality and Social Psychology Bulletin, 17, 306–315.
Fagan, J., & Browne, A. (1994). Marital violence, physical aggression between women and men in intimate
relationships. In A. J. Reiss, & J. S. Roth (Eds.), Understanding and preventing violence: social influences,
(vol. 3, pp. 115–292). Washington, DC: National Academy Press.
Fiebert, M. S., & Gonzalez, D. M. (1997). College women who initiate assaults on their male partners and the
reasons offered for such behavior. Psychological Reports, 80, 583–590.
Fleiss, J. L. (1981). Statistical methods for rates and proportions (2nd ed.). New York: Wiley.
Foo, L., & Margolin, G. (1995). A multivariate investigation of dating aggression. Journal of Family Violence, 10,
351–377.
Frenkiel, O. (1999, January 23). If our women are unfaithful — we kill them. The Guardian (p. 18) (London):
The Editor.
Gaquin, D. A. (1977–1978). Spouse abuse: data from the National Crime Survey. Victimology, 2, 632–643.
Gelles, R. J. (1972). The violent home. Beverly Hills, CA: Sage.
Gelles, R. J., & Cornell, C. P. (1990). Intimate violence in families (2nd ed.). Beverly Hills, CA: Sage.
George, M. J. (1994). Riding the donkey backwards: men as the unacceptable victims of marital violence. The
Journal of Men’s Studies, 3, 137–159.
George, M. J. (1998). Beyond all help? Comments upon ‘Commonly held unhelpful beliefs’ in ‘Domestic violence:
a health care issue?’ Unpublished manuscript, Department of Physiology, St. Bartholomew’s and Royal
London Hospital Medical School, Queen Mary and Westfield College, London, UK.
Giles-Sims, J. (1983). Wife battering: a systems theory approach. New York: The Guilford Press.
Gryl, F. E., Stith, S. M., & Bird, G. W. (1991). Close dating relationships among college students: differences by
use of violence and by gender. Journal of Social and Personal Relationships, 8, 243–264.
Gwartney-Gibbs, P. A., Stockard, J., & Bohmer, S. (1987). Learning courtship aggression: the influence of
parents, peers, and personal experiences. Family Relations, 36, 276–282.
Haddock, C. K., Rindskopf, D., & Shadish, W. R. (1998). Using odds ratios as effect sizes for meta-analysis of
dichotomous data: a primer on methods and issues. Psychological Methods, 3, 339–353.
Hedges, L. V., & Becker, B. J. (1986). Statistical methods in the meta-analysis of research on gender differences.
In J. S. Hyde, & M. C. Linn (Eds.), The psychology of gender: advances through meta-analysis (pp. 14–50).
Baltimore, MD: Johns Hopkins University Press.
Hedges, L. V., & Olkin, I. (1985). Statistical methods for meta-analysis. San Diego, CA: Academic Press.
Hudson, W. W., & McIntosh, S. R. (1981). The assessment of spouse abuse: two quantifiable dimensions. Journal
of Marriage and the Family, 43, 873–888.
Johnson, B. T. (1989). Software for the meta-analytic review of research literatures. Hillsdale, NJ: Erlbaum.
Johnson, M. P. (1995). Patriarchal terrorism and common couple violence: two forms of violence against women.
Journal of Marriage and the Family, 57, 283–294.
Kim, K.-I., & Cho, Y.-G. (1992). Epidemiological survey of spousal abuse in Korea. In E. C. Viano (Ed.), Intimate
violence: interdisciplinary perspectives (pp. 277–282). Washington, DC: Hemisphere.
J. Archer / Aggression and Violent Behavior 7 (2002) 313–351348
Lane, K. E., & Gwartney-Gibbs, P. A. (1985). Violence in the context of dating and sex. Journal of Family Issues,
6, 45–59.
Laner, M. R. (1983). Courtship abuse and aggression: contextual aspects. Sociological Spectrum, 3, 69–83.
Laner, M. R. (1985). Unpleasant, aggressive, and abusive activities in courtship: a comparison of Mormon and
non-Mormon college students. Deviant Behavior: An International Journal, 6, 145–168.
Laner, M. R., & Thompson, J. (1982). Abuse and aggression in courting couples. Deviant Behavior: An Interna-
tional Journal, 3, 229–244.
LeBlanc, S. D. (1995). Abuse in dating relationships: an urban/rural comparison. Masters Abstracts International,
34 (3), 1057 (University Microfilms No. AAAAIM04609).
Lehr, R. F. (1988). Characteristics of couples in violent relationships: implications for predicting successful marital
therapy. (Doctoral dissertation, University of Alberta, Canada, 1988) Dissertation Abstracts International, 49
(5), 1063A.
Magdol, L., Moffitt, T. E., Caspi, A., Newman, D. L., Fagan, J., & Silva, P. A. (1997). Gender differences in
partner violence in a birth cohort of 21-year-olds: bridging the gap between clinical and epidemiological
approaches. Journal of Consulting and Clinical Psychology, 65, 68–78.
Makepeace, J. M. (1983). Life event stress and courtship violence. Family Relations, 32, 101–109.
Makepeace, J. M. (1986). Gender differences in courtship violence victimization. Family Relations, 35, 383–388.
Marshall, L. L. (1987a). Partnership abuse: Comparison of two studies using college students. Paper presented at
Conference on Personal Relationships, IA.
Marshall, L. L. (1987b). Gender differences in the prediction of courtship abuse from family of origin violence,
anxiety proneness and recent positive and negative stress. Paper presented at the Family Violence Research
Conference, Durham, NH.
Marshall, L. L. (1992a). Development of the Severity of Violence Against Women Scales. Journal of Family
Violence, 7, 103–121.
Marshall, L. L. (1992b). The Severity of Violence Against Men Scales. Journal of Family Violence, 7, 189–203.
Marshall, L. L. (1994). Physical and psychological abuse. In W. R. Cupach, & B. H. Spitzberg (Eds.), The dark
side of interpersonal communication (pp. 281–311). Hillsdale, NJ: Erlbaum.
Marshall, L. L., & Rose, P. (1988). Family of origin violence and courtship abuse. Journal of Counselling and
Development, 66, 414–418.
Marshall, L. L., & Rose, P. (1990). Premarital violence: the impact of family of origin violence, stress, and
reciprocity. Violence and Victims, 5, 51–64.
Masterson, N. C. (1987). The incidence and nature of dating violence among never-married students at one junior
college. Dissertation Abstracts International, 47, 4291A (University Microfilms No. AADAA87-07522).
McCrae, R. R., & Costa, P. T. (1990). Personality in adulthood. New York: Guilford Press.
Mihalic, S. W., & Elliott, D. (1997). If violence is domestic, does it really count? Journal of Family Violence, 12,
293–311.
Moin, B. (1998). Khomeini, life of the ayatollah. London: Tauris.
Mooney, J. (1994). The hidden figure: domestic violence in North London. London, UK: Islington Council.
Morse, B. J. (1995). Beyond the Conflict Tactics Scale: assessing gender differences in partner violence. Violence
and Victims, 10, 251–272.
Murphy, J. E. (1988). Date abuse and forced intercourse among college students. In G. T. Hotaling, D. Finkelhor,
J. T. Kirkpatrick, & M. A. Straus (Eds.), Family abuse and its consequences: new directions in research
(pp. 285–296). Newbury Park: Sage.
Nazroo, J. (1995). Uncovering gender differences in the use of marital violence: the effect of methodology.
Sociology, 29, 475–494.
O’ Connor, D. B., Archer, J., & Wu, F. W. C. (2001). Measuring aggression: self-reports, partner reports, and
responses to provoking scenarios. Aggressive Behavior, 27, 79–101.
O’Keefe, M. (1997). Predictors of dating violence among high school students. Journal of Interpersonal Violence,
12, 546–569.
O’Leary, K. D., Barling, J., Arias, I., Rosenbaum, A., Malone, J., & Tyree, A. (1989). Prevalence and stability of
J. Archer / Aggression and Violent Behavior 7 (2002) 313–351 349
physical aggression between spouses: a longitudinal analysis. Journal of Consulting and Clinical Psychology,
57, 263–268.
Pagelow, M. D. (1984). Family violence. New York: Praeger.
Papalia, D. (1994). Marital violence in the first three years of marriage: differential impact of wives’ and hus-
bands’ perception of the marital relationship and on their psychological well. Dissertation Abstracts Interna-
tional, 55 (6), 2409B (University Microfilms No. AAD94-29835).
Pedersen, P., & Thomas, C. D. (1992). Prevalence and correlates of dating violence in a Canadian university
sample. Canadian Journal of Behavioural Science, 24, 490–501.
Plass, M. S., & Gessner, J. C. (1983). Violence in courtship relations: a southern sample. Free Inquiry in Creative
Sociology, 11, 198–202.
Rhodes, N. R. (1992). The assessment of spousal abuse: an alternative to the Conflict Tactics Scale. In E. C. Viano
(Ed.), Intimate violence: interdisciplinary perspectives (pp. 27–35). Washington, DC: Hemisphere.
Riggs, D. S. (1993). Relationship problems and dating aggression: a potential treatment target. Journal of Inter-
personal Violence, 8, 18–35.
Riggs, D. S., Murphy, C. M., & O’Leary, K. D. (1989). Intentional falsification in reports of interpartner
aggression. Journal of Interpersonal Violence, 4, 220–232.
Riggs, D. S., & O’Leary, K. D. (1996). Aggression between heterosexual dating partners: an examination of a
causal model of courtship aggression. Journal of Interpersonal Violence, 11, 519–540.
Riggs, D. S., O’Leary, K. D., & Breslin, F. C. (1990). Multiple correlates of physical aggression in dating couples.
Journal of Interpersonal Violence, 5, 61–73.
Roberts, G. L., O’Toole, B. I., Raphael, B., Lawrence, J. M., & Ashby, R. (1996). Prevalence study of domestic
violence victims in an emergency department. Annals of Emergency Medicine, 27, 747–753.
Romkens, R. (1997). Prevalence of wife abuse in the Netherlands: combining quantitative and qualitative methods
in survey research. Journal of Interpersonal Violence, 12, 99–125.
Roscoe, B., & Callahan, J. E. (1985). Adolescents’ self-report of violence in families and dating relations.
Adolescence, 79, 545–553.
Rouse, L. P. (1988). Abuse in dating relationships: a comparison of blacks, whites, and Hispanics. Journal of
College Student Development, 29, 312–319.
Rouse, L. P., Breen, R., & Howell, M. (1988). Abuse in relationships: a comparison of married and dating college
students. Journal of Interpersonal Violence, 3, 414–429.
Schartz, H. A. G. (1995). Coercion in the lives of young adults: child abuse, dating violence and willingness to use
physical discipline. Dissertation Abstracts International, 55 (12), 4007A (University Microfilms No. AA-
DAAI95-13619).
Schwartz, M., O’Leary, S. G., & Kendziora, K. T. (1997). Dating aggression among high school students. Violence
and Victims, 12, 295–305.
Schwartz, M. D. (1987). Gender and injury in spousal assault. Sociological Focus, 20, 61–75.
Shackleford, T. K., & Buss, D. M. (1997). Marital satisfaction in evolutionary psychological perspective. In R. J.
Sternberg, & M. Hojjat (Eds.), Satisfaction in close relationships (pp. 7–25). New York: The Guilford Press.
Shadish, W. R., & Haddock, C. K. (1994). Combining estimates of effect size. In H. Cooper, & L. V. Hedges
(Eds.), The handbook of research synthesis (pp. 261–281). New York: Russell Sage Foundation.
Sigelman, C. K., Berry, C. J., & Wiles, K. A. (1984). Violence in college students’ dating relationships. Journal of
Applied Social Psychology, 5, 530–548.
Smith, P. H., Earp, J. A., & DeVellis, R. (1995). Measuring battering: development of the Women’s Experience
with Battering (WEB) Scale. Women’s Health: Research on Gender, Behavior, and Policy, 1, 273–288.
Stacey, W. A., Hazelwood, L. R., & Shupe, A. (1994). The violent couple. Westport, CT: Praeger.
Stacey, W. A., Shupe, A. (1983). The family secret: domestic violence in America. Boston: Beacon.
Stacy, C. L., Schandel, L. M., Flannery, W. S., Conlon, M., & Milardo, R. M. (1994). It’s not all moonlight and
roses: dating violence at the University of Maine 1982–1992. College Student Journal, 28, 2–9.
Stets, J. E., & Henderson, D. A. (1991). Contextual factors surrounding conflict resolution while dating: results
from a national study. Family Relations, 40, 29–36.
J. Archer / Aggression and Violent Behavior 7 (2002) 313–351350
Stets, J. E., & Pirog-Good, M. A. (1990). Interpersonal control and courtship aggression. Journal of Social and
Personal Relationships, 7, 371–394.
Straus, M. A. (1977–78). Wife beating: how common and why? Victimology: An International Journal, 2,
443–458.
Straus, M. A. (1979). Measuring intrafamily conflict and violence: the Conflict Tactics (CT) scales. Journal of
Marriage and the Family, 41, 75–88.
Straus, M. A. (1990). The Conflict Tactics Scales and its critics: an evaluation and new data on validity and
reliability. In M. A. Straus, & R. J. Gelles (Eds.), Physical violence in American societies: risk factors and
adaptations to violence in 8,145 families (pp. 49–73). New Brunswick: Transaction Publications.
Straus, M. A. (1997). Physical assaults by women partners: a major social problem. In M. R. Walsh (Ed.), Women,
men and gender: ongoing debates (pp. 210–221). New Haven, CT: Yale University Press.
Straus, M. A. (1998). Characteristics of the National Violence Against Women Study that might explain the low
assault rates for both sexes and the even lower rate for women. Unpublished manuscript, Family Research
Laboratory, University of New Hampshire, Durham, NH.
Straus, M. A. (1999). The controversy over domestic violence by women: a methodological, theoretical, and
sociology of science analysis. In X. B. Arriaga, & S. Oskamp (Eds.), Violence in intimate relationships
(pp. 17–44). Thousand Oaks, CA: Sage.
Straus, M. A., & Gelles, R. J. (1986). Societal change and change in family violence from 1975 to 1985 as
revealed by two national surveys. Journal of Marriage and the Family, 48, 465–479.
Straus, M. A., & Gelles, R. J. (1988a). Violence in American families: how much is there and why does it
occur? In E. W. Nunnally, C. S. Chilman, & F. M. Fox (Eds.), Troubled relationships (pp. 141–162).
Newbury Park: Sage.
Straus, M. A., & Gelles, R. J. (1988b). How violent are American families? Estimates from the National Family
Violence Resurvey and other studies. In G. T. Hotaling, D. Finkelhor, J. T. Kirkpatrick, & M. A. Straus (Eds.),
Family abuse and its consequences: new directions in research (pp. 14–36). Newbury Park: Sage.
Straus, M. A., Gelles, R. J., & Steinmetz, S. (1980). Behind closed doors: violence in the American family. New
York: Anchor Press.
Straus, M. A., Hamby, S. L., Boney-McCoy, S., & Sugarman, D. B. (1996). The revised Conflict Tactics Scales
(CTS2): development and preliminary psychometric data. Journal of Family Issues, 17, 283–316.
Sugarman, C. B., & Hotaling, G. T. (1997). Intimate violence and social desirability: a meta-analytic review.
Journal of Interpersonal Violence, 12, 275–290.
Szinovacz, M. E. (1983). Using couple data as a methodological tool: the case of marital abuse. Journal of
Marriage and the Family, 45, 633–644.
Walker, L. E. A. (1989). Psychology and violence against women. American Psychologist, 44, 659–702.
White, J. W., & Koss, M. P. (1991). Courtship violence: incidence in a national sample of higher education
students. Violence and Victims, 6, 247–256.
White, J. W., Smith, P. H., Koss, M. P., & Figueredo, A. J. (2000). Intimate partner aggression — what have we
learned? Comment on Archer (2000). Psychological Bulletin, 126, 690–696.
Wilson, M., & Daly, M. (1992). The man who mistook his wife for a chattel. In J. H. Barkow, L. Cosmides, & J.
Tooby (Eds.), The adapted mind (pp. 289–321). New York: Oxford University Press.
Worth, D. M., Matthews, P. A., & Coleman, W. R. (1990). Sex role, group affiliation, family background, and
courtship violence in college students. Journal of College Student Development, 31, 250–254.
J. Archer / Aggression and Violent Behavior 7 (2002) 313–351 351