Joe Kaeser, President and CEO - siemens.com · Strong order growth highlights successful first...
19
Strong order growth highlights successful first quarter Joe Kaeser, President and CEO | Ralf P. Thomas, CFO Q1 FY 2018 Analyst Call | Munich, January 31, 2018 siemens.com Unrestricted © Siemens AG
Transcript of Joe Kaeser, President and CEO - siemens.com · Strong order growth highlights successful first...

Strong order growth highlights successful first quarter
Joe Kaeser, President and CEO | Ralf P. Thomas, CFO
Q1 FY 2018 Analyst Call | Munich, January 31, 2018
siemens.com Unrestricted © Siemens AG

Unrestricted © Siemens AG 2018
Munich, January 31, 2018 Page 2 Q1 FY 2018 Analyst Call
Notes and forward looking statements
This presentation has been prepared solely for use at this meeting. This material is given in conjunction with an oral presentation and should not be taken out of context.
This presentation has been prepared for information purposes only and the information contained herein (unless otherwise indicated) has been provided by Siemens AG. It does not constitute or form part of, and should not be construed as, an
offer of, a solicitation of an offer to buy, or an invitation to subscribe for, underwrite or otherwise acquire, any securities of Siemens AG or any existing or future member of the Siemens Group (the “Group”), nor should it or any part of it form the
basis of, or be relied on in connection with, any contract to purchase or subscribe for any securities of Siemens AG or any member of the Group or with any other contract or commitment whatsoever. This presentation does not constitute a
prospectus in whole or in part, and any decision to invest in securities should be made solely on the basis of the information to be contained in a prospectus and on an independent analysis of the information contained therein.
Any assumptions, views or opinions (including statements, projections, forecasts or other forward-looking statements) contained in this presentation represent the assumptions, views or opinions of Siemens AG as of the date indicated and are
subject to change without notice. All information not separately sourced is from internal company data and estimates. Any data relating to past performance contained herein is no indication as to future performance. The information in this
presentation is not intended to predict actual results, and no assurances are given with respect thereto.
The information contained in this presentation has not been independently verified, and no representation or warranty, express or implied, is made as to the fairness, accuracy, completeness or correctness of the information contained herein and
no reliance should be placed on it. None of Siemens AG or any of its affiliates, advisers, connected persons or any other person accept any liability for any loss howsoever arising (in negligence or otherwise), directly or indirectly, from this
presentation or its contents or otherwise arising in connection with this presentation. This shall not, however, restrict or exclude or limit any duty or liability to a person under any applicable law or regulation of any jurisdiction which may not lawfully
be disclaimed (including in relation to fraudulent misrepresentation).
This presentation includes “'forward-looking statements.” These statements contain the words “anticipate”, “believe”, “intend”, “estimate”, “expect” and words of similar meaning. All statements other than statements of historical facts included in
this presentation, including, without limitation, those regarding Siemens AG’s financial position, business strategy, plans and objectives of management for future operations (including cost savings and productivity improvement plans) are forward-
looking statements. By their nature, such forward-looking statements involve known and unknown risks, uncertainties and other important factors that could cause the actual results, performance or achievements of Siemens AG to be materially
different from results, performance or achievements expressed or implied by such forward-looking statements. Such forward-looking statements are based on numerous assumptions regarding Siemens AG’s present and future business
strategies and the market environment in which Siemens AG will operate in the future. These forward-looking statements speak only as of the date of this presentation. Each of Siemens AG, the relevant Group entities and their respective agents,
employees and advisers, expressly disclaims any obligation or undertaking to update any forward-looking statements contained herein. Investors are urged to consider these factors carefully in evaluating the forward-looking statements in this
presentation and not to place undue reliance on such statements.
This presentation is not directed to, or intended for distribution to or use by, any person or entity that is a citizen or resident or located in any locality, state, country or other jurisdiction where such distribution, publication, availability or use would
be contrary to law or regulation of such jurisdiction or which would require any registration or licensing within such jurisdiction. This presentation or any part thereof is not for publication, release or distribution in the United States, Australia,
Canada or Japan. Any failure to comply with these restrictions may constitute a violation of the laws of other jurisdictions. This presentation must not be acted on or relied on by persons who are not eligible to invest in the securities. The
presentation and the information contained herein are not an offer of securities for sale in the United States. The securities described herein have not been and will not be registered under the under the U.S. Securities Act of 1933, as amended
(the “U.S. Securities Act”), or any state securities laws, and may not be offered or sold in the United States except pursuant to an exemption from, or transaction not subject to, the registration requirements of the U.S. Securities Act.
This presentation is only directed at persons who (i) have professional experience in matters relating to investments falling within Article 19(5) of the Financial Services and Markets Act 2000 (Financial Promotion) Order 2005, as amended, (the
“Financial Promotion Order”), (ii) are persons falling within Article 49(2)(a) to (d) (high net worth companies, unincorporated associations, etc.) of the Financial Promotion Order, (iii) are outside the United Kingdom, or (iv) are persons to whom an
invitation or inducement to engage in investment activity (within the meaning of Section 21 of the Financial Services and Markets Act 2000) in connection with the issue or sale of any securities may otherwise lawfully be communicated or caused
to be communicated (all such persons together being referred to as “relevant persons”). This presentation is directed only at relevant persons and must not be acted on or relied on by persons who are not relevant persons. In each member state
of the European Economic Area (“EEA”) which has implemented Directive 2003/71/EC (together with any amendments thereto and any relevant implementing measures, the “Prospectus Directive”), with effect from and including the date on
which the Prospectus Directive is implemented in such member state, this presentation is only directed at persons in member states of the EEA who are “qualified investors” within the meaning of Article 2(1)(e) of the Prospectus Directive.
The information contained in this presentation is provided as of the date of this presentation and is subject to change without notice.

Unrestricted © Siemens AG 2018
Munich, January 31, 2018 Page 3 Q1 FY 2018 Analyst Call
Q1 FY 2018
Strong order growth highlights successful quarter
Clear organic order growth +7% stands out
Compelling book-to-bill at 1.13x
Like for like revenues up 1% despite significant decline in Power businesses
Solid IB margin at 11.0% despite significant FX headwinds and PG decline
Net income up 12% to €2.2bn supported by one-off gains
EPS at €2.68, up +11%
Strong Free Cash Flow up 22% to €0.9bn highlights earnings quality

Unrestricted © Siemens AG 2018
Munich, January 31, 2018 Page 4 Q1 FY 2018 Analyst Call
PG: Further market contraction impacts top and bottom line
EM: Solid project execution stands out
1) Comparable, i.e. adjusted for currency translation and portfolio effects
Power and Gas (PG)
Declining new unit business and ongoing price pressure
Service remains a stable contributor
Energy Management (EM)
Solid revenue growth driven by LV & MV product biz
Adverse FX holds back earnings conversion
Orders
Revenue
Profit
3.23.9
-15%1)
Q1 FY 18 Q1 FY 17
-2%1)
Q1 FY 18
3.1
Q1 FY 17
3.3
238
471
-49%
Q1 FY 18 Q1 FY 17
€bn
€m -440bps
Q1 FY 18 Q1 FY 17
Profit margin
11-15%
Margin as reported Margin excl. severance x.x% x.x%
12.1%
12.0%
8.0%
7.6%
Orders
Revenue
Profit
2.82.8
+5%1)
Q1 FY 18 Q1 FY 17
-1%1)
Q1 FY 18
2.8
Q1 FY 17
3.0
187189
-1%
Q1 FY 18 Q1 FY 17
€bn
€m
flat
Q1 FY 18 Q1 FY 17
Profit margin
7-10%
7.2%
6.7%
6.8%
6.7%
Unrestricted © Siemens AG 2018
Munich, January 31, 2018 Page 5 Q1 FY 2018 Analyst Call
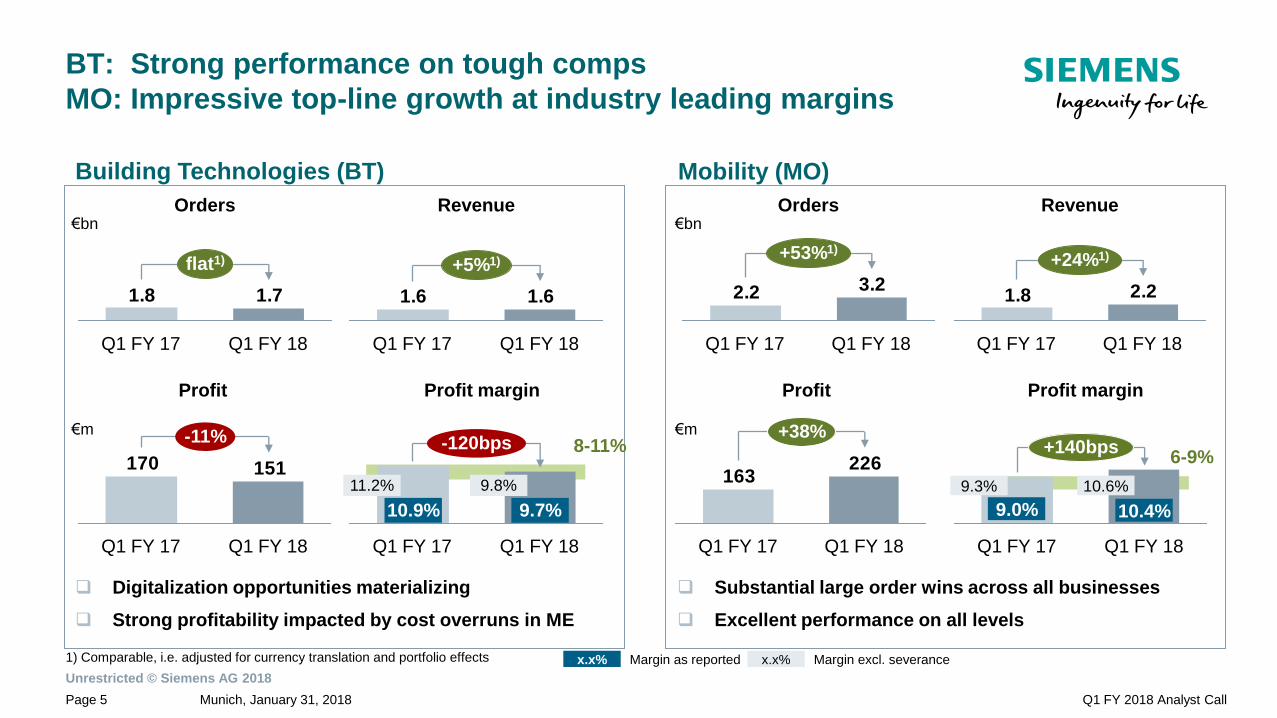
BT: Strong performance on tough comps
MO: Impressive top-line growth at industry leading margins
1) Comparable, i.e. adjusted for currency translation and portfolio effects
Building Technologies (BT)
Digitalization opportunities materializing
Strong profitability impacted by cost overruns in ME
Mobility (MO)
Substantial large order wins across all businesses
Excellent performance on all levels
Orders
Revenue
Profit
1.61.6
+5%1)
Q1 FY 18 Q1 FY 17
1.71.8
flat1)
Q1 FY 18 Q1 FY 17
151170
-11%
Q1 FY 18 Q1 FY 17
€bn
€m
-120bps
Q1 FY 18 Q1 FY 17
Profit margin
8-11%
Margin as reported Margin excl. severance x.x% x.x%
10.9% 9.7%
11.2% 9.8%
Orders
Revenue
Profit
2.21.8
+24%1)
Q1 FY 18 Q1 FY 17
3.22.2
+53%1)
Q1 FY 18 Q1 FY 17
226163
+38%
Q1 FY 18 Q1 FY 17
€bn
€m
+140bps
Q1 FY 18 Q1 FY 17
Profit margin
6-9%
9.3%
9.0%
10.6%
10.4%

Unrestricted © Siemens AG 2018
Munich, January 31, 2018 Page 6 Q1 FY 2018 Analyst Call
DF: Digital powerhouse with further market share gains
PD: Order growth and margin expansion highlights in recovery
1) Comparable, i.e. adjusted for currency translation and portfolio effects
Digital Factory (DF)
Strong short cycle and Mentor drive top and bottom line
MindSphere effect ~-130bps; Mentor effects ~-80bps
Process Industries and Drives (PD)
Process Automation business drives profit
Order growth recovery in commodity related markets
Orders
Revenue
Profit
+7%1)
Q1 FY 18
3.0
Q1 FY 17
2.6
606
-12%
Q1 FY 18 Q1 FY 17
692
€bn
€m -670bps
Q1 FY 18 Q1 FY 17
Profit margin
14-20%
Orders
Revenue
Profit
2.32.1
+10%1)
Q1 FY 18 Q1 FY 17
148135
+10%
Q1 FY 18 Q1 FY 17
€bn
€m
+90bps
Q1 FY 18 Q1 FY 17
Profit margin
8-12%
3.52.7
+17%1)
Q1 FY 18 Q1 FY 17
2.02.1
-1%1)
Q1 FY 18 Q1 FY 17
Margin as reported Margin excl. severance x.x% x.x%
27.0%
26.8%
20.6%
20.1% 6.4% 7.3%
6.7% 7.5%
eCar gain
€172m (670bps)

Unrestricted © Siemens AG 2018
Munich, January 31, 2018 Page 7 Q1 FY 2018 Analyst Call
HC: FX headwind and mix weigh on good execution
SGRE: Integration ongoing – right decisions taken
1) Comparable, i.e. adjusted for currency translation and portfolio effects
Siemens Gamesa Renewable Energy (SGRE)
Large offshore and onshore order wins
Profitability reflects continued onshore price pressure
Healthineers (HC)
IPO process well on its way
Successful Capital Market Day
Orders
Revenue
Profit
3.23.3
Q1 FY 18 Q1 FY 17
+2%1)
3.43.5
Q1 FY 18 Q1 FY 17
+2%1)
541638
Q1 FY 18
-15%
Q1 FY 17
€bn
€m -230bps
Q1 FY 18 Q1 FY 17
Profit margin
15-19%
Margin as reported Margin excl. severance x.x% x.x%
19.2% 16.9%
19.5% 17.4%
Orders
Revenue
Profit
2.11.4
Q1 FY 17
-10%1)
Q1 FY 18
2.91.4
Q1 FY 18
-24%1)
Q1 FY 17
110111
Q1 FY 17
-1%
Q1 FY 18
€bn
€m
Q1 FY 18
-280bps
Q1 FY 17
Profit margin
5-8%
8.0% 5.2%
8.1% 5.3%

Unrestricted © Siemens AG 2018
Munich, January 31, 2018 Page 8 Q1 FY 2018 Analyst Call
Below IB benefits from Osram gain and U. S. tax reform
in €m
12
48605
173
Net Income
2,211
Disc. Ops. Inc. Cont.
Ops
2,199
Tax
-147 -136
PPA
-298
Corp. Items
& Pen.
-255
SRE CMPA SFS IB
2,208
Elim. Corp.
Treas.,
Other
Below Industrial Business – Q1 FY 2018
Therein:
• -€82m Pensions
• -€174m Corp. Items
Tax rate@6%
€437m impact from
U. S. tax reform
€22m
Attributable to
non controlling
interest
€655m gain
Osram
disposal

Unrestricted © Siemens AG 2018
Munich, January 31, 2018 Page 9 Q1 FY 2018 Analyst Call
Guidance FY 2018 confirmed
Outlook
We expect a mixed picture in our market environment in fiscal 2018,
ranging from strong markets for our short-cycle businesses to unfavorable
dynamics in our energy generation markets, as well as geopolitical
uncertainties that may restrict investment sentiment.
For fiscal 2018 we expect modest growth in revenue, net of effects from
currency translation and portfolio transactions, and anticipate that orders will
exceed revenue for a book-to-bill ratio above 1.
We expect a profit margin of 11.0% to 12.0% for our Industrial Business
and basic EPS from net income in the range of €7.20 to €7.70, both
excluding severance charges.
This outlook excludes charges related to legal and regulatory matters,
effects on EPS associated with minorities holding shares in Healthineers
following the planned IPO, and potential effects which may follow the
introduction of a new strategic program.
Note: FY 2017 weighted average number of shares of ~812.2m
Earnings per share
in €
adj. EPS
FY17
EPS excl.
Severance
FY18
7.09 7.20
7.70 +9%
+2%

Unrestricted © Siemens AG 2018
Munich, January 31, 2018 Page 10 Q1 FY 2018 Analyst Call
Appendix

Unrestricted © Siemens AG 2018
Munich, January 31, 2018 Page 11 Q1 FY 2018 Analyst Call
One Siemens Financial Framework
Clear targets to measure success and accountability
1) ABB, GE, Schneider, MHI, Eaton, weighted; 2) Based on continuing and discontinued operations; 3) Productivity measures divided by functional costs (cost of sales, R&D, SG&A expenses) of the
group; 4) Of net income excluding exceptional non-cash items; 5) Excl. acquisition related amortization on intangibles; 6) SFS based on return on equity after tax
One Siemens
Financial Framework
Siemens
Capital efficiency (ROCE2))
Capital structure (Industrial net debt/EBITDA)
15 – 20%
Total cost productivity3)
3 – 5% p.a.
Dividend payout ratio
40 – 60%4)
up to 1.0x
Profit Margin ranges of businesses (excl. PPA)5)
PG
11 – 15%
SGRE
5 – 8%
EM
7 – 10%
BT
8 – 11%
MO
6 – 9%
DF
14 – 20%
PD
8 – 12%
HC
15 – 19%
SFS6)
15 – 20%
Growth:
Siemens > most
relevant competitors1)
(Comparable revenue growth)

Unrestricted © Siemens AG 2018
Munich, January 31, 2018 Page 12 Q1 FY 2018 Analyst Call
Siemens Vision 2020 execution well advanced
FY 2018 – Setting direction for next strategic level
2015 2016 2017 2018 2019 2020
Ownership culture driving leadership and people development
Value
Drive performance • Secure competitiveness in PG, PD and SGRE
• Agility and continuous productivity improvement
• Stringent project execution
Strengthen core • Healthcare IPO
• Setting up Siemens Alstom
• Successful integration of acquisitions
Scale up • Customer and market focus
• Digitalization at work
• Innovation push
Operational
consolidation
Strategic
direction Optimization
Accelerated growth
and outperformance
“Vision 2020+”

Unrestricted © Siemens AG 2018
Munich, January 31, 2018 Page 13 Q1 FY 2018 Analyst Call
Siemens Vision 2020 - Execution well underway, most targets
already achieved by FY 2017
Implement stringent company gover-
nance with effective support functions
Foster
Ownership Culture
Be an employer
of choice
Expand global
management
Strengthen
portfolio
Be a partner of choice
for our customers
Execute financial
target system
1
2
3
4
5
6
7
GOAL
Live lean governance and
drive continuous optimization
Ignite pride and passion for Siemens,
through a new mindset and equity ownership
Unleash the full potential
of our people
Get closer to our customers
and markets
Sharpen our business focus in
electrification, automation, and digitalization
Foster an intimate and trusting partnership
with our customers
Grow our company value
INTENT
1
€1bn cost savings by FY 2016 achieved
≥ 50% increase in number
of employee shareholders
> 75% approval rating in leadership
and diversity in global employee survey
> 30% of Division and Business Unit
management outside Germany
≥ 20% improvement in Net Promoter Score
15-20% ROCE
Tap growth fields
KPI
Growth > most relevant competitors
> 8% margin in underperforming businesses

Unrestricted © Siemens AG 2018
Munich, January 31, 2018 Page 14 Q1 FY 2018 Analyst Call
Financial cockpit – Q1 FY 2018
as reported excl. severance
Orders
in €bn
EPS
in €
Profit Industrial Business (IB)
in €bn
ROCE (“all-in”)
Net Income
in €bn
Capital structure
17.9%
Q1 FY 17 Q1 FY 18
19.2% 0.8x 0.7x
Q1 FY 18 Q1 FY 17
≤1 15 – 20%
2.2
+12%
Q1 FY 17 Q1 FY 18
2.0 2.2
-14%
Q1 FY 17 Q1 FY 18
2.6
Margin
Q1 FY 18
19.7 22.5
Q1 FY 17
19.8
Q1 FY 17
19.2
Q1 FY 18
1.13 1.03 B-t-B
Comp.
(nom.)
+7%
(+14%)
+1%
(+3%)
Revenue
2.682.41
Q1 FY 17
+11%
Q1 FY 18
13.4% 11.3%
13.2% 11.0%
x.x% x.x%
2.46 2.76
x.xx EPS excl. severance

Unrestricted © Siemens AG 2018
Munich, January 31, 2018 Page 15 Q1 FY 2018 Analyst Call
Q1 ΔQ4
• SFS Debt +22.5 +0.0
• Post emp. Benefits -9.7 -0.1
• Credit guarantees -0.4 +0.2
• Fair value adj. +0.4 0.0
(hedge accounting)
Adj. ind. Net Debt/
EBITDA (c/o)
0.8x (Q4 FY17: 0.9x)
Cash &
cash equiv.
€9.61)
Cash &
cash equiv.
€11.11)
Operating Activities
therein a.o.:
• Proceeds from Sales of
investment +1.2
• CAPEX -0.5
1) Including current available-for-sale financial assets
therein:
• Δ Inventories -0.6
• Δ Trade payables -0.8
• Δ Trade and other receivables -0.5
• Δ Contract Assets/ Liabilities +1.7
∆ Working
Capital
-0.1
-7.9
Financing and
other topics
Net Debt Q1 2018 Net Debt Q4 2017
12.8
Cash flows from op.
activities
(w/o ∆ working capital)
1.6 0.5
Net Debt adjustments Cash flows from
investing activities
-20.8
-0.2
-22.6
Adj. ind. Net Debt
Q1 2018
Net debt bridge – Q1 FY 2018
Unrestricted © Siemens AG 2018
Munich, January 31, 2018 Page 16 Q1 FY 2018 Analyst Call
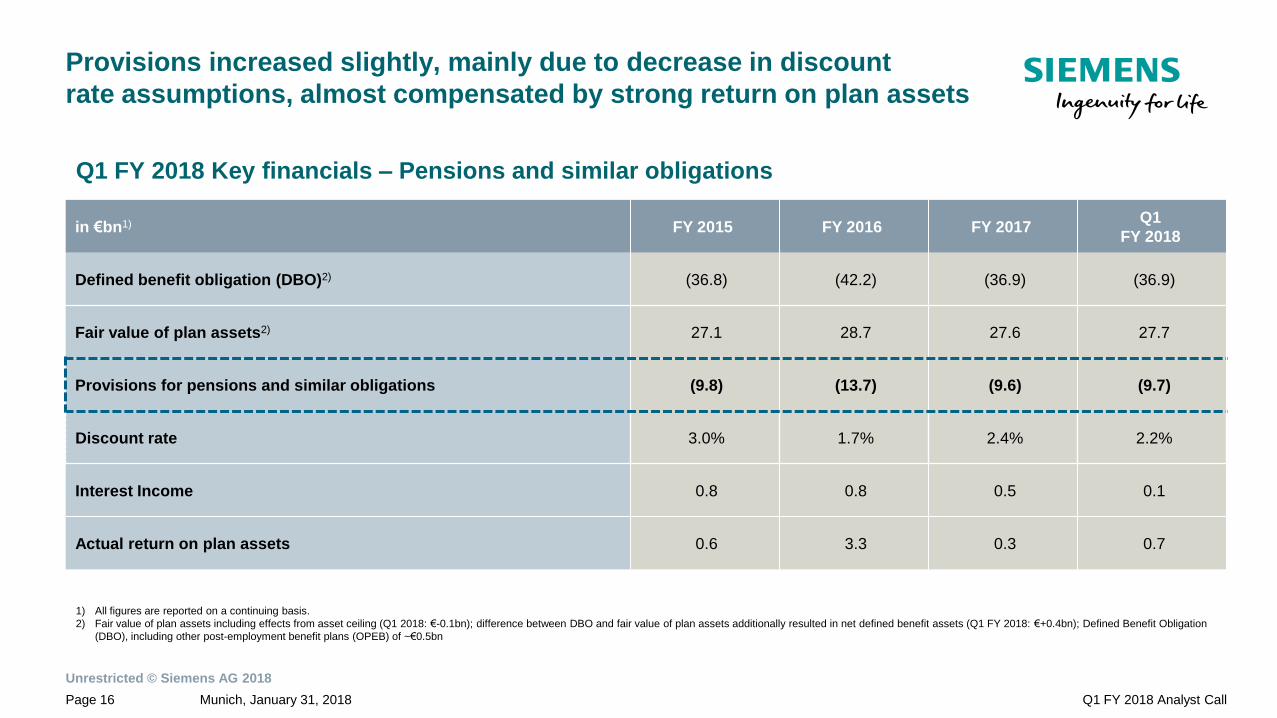
Provisions increased slightly, mainly due to decrease in discount
rate assumptions, almost compensated by strong return on plan assets
Q1 FY 2018 Key financials – Pensions and similar obligations
in €bn1) FY 2015 FY 2016 FY 2017 Q1
FY 2018
Defined benefit obligation (DBO)2) (36.8) (42.2) (36.9) (36.9)
Fair value of plan assets2) 27.1 28.7 27.6 27.7
Provisions for pensions and similar obligations (9.8) (13.7) (9.6) (9.7)
Discount rate 3.0% 1.7% 2.4% 2.2%
Interest Income 0.8 0.8 0.5 0.1
Actual return on plan assets 0.6 3.3 0.3 0.7
1) All figures are reported on a continuing basis.
2) Fair value of plan assets including effects from asset ceiling (Q1 2018: €-0.1bn); difference between DBO and fair value of plan assets additionally resulted in net defined benefit assets (Q1 FY 2018: €+0.4bn); Defined Benefit Obligation
(DBO), including other post-employment benefit plans (OPEB) of ~€0.5bn

Unrestricted © Siemens AG 2018
Munich, January 31, 2018 Page 17 Q1 FY 2018 Analyst Call
Q1 FY18 Profit Bridge from SGRE disclosure to SAG Profit disclosure Explanation of different profit definitions at SGRE and SAG to be considered in models
113110
35
133
83
15
SGRE
Profit (excl.
severance)
3
Severance SGRE Profit
(as reported)
Intercompany
Consolidation
2
Financial
Income
-10
Integration &
Restructuring
Cost
-15
SGRE
underl. EBIT
PPA effects Integration &
Restructuring
Cost
SGRE EBIT
Q1 FY18 Profit Bridge (in €m)
Revenue
2,127
Revenue
2,127
SGRE disclosure (as of Jan 30, 2018) SAG disclosure (as of Jan 31, 2018)
Revenue
2,127
Margin x.x%
1.6% 6.3% 5.2%
Revenue
2,127
5.3%

Unrestricted © Siemens AG 2018
Munich, January 31, 2018 Page 18 Q1 FY 2018 Analyst Call
Financial calendar
January 31, 2018
Annual General Meeting + Q1 Analyst call (Munich, Germany) January
February
March
February 21, 2018
Roadshow UK (Edinburgh)
February 22, 2018
Roadshow Switzerland (Zurich)
March 21/22, 2018
Bank of America Merrill Lynch Conference (London)

Unrestricted © Siemens AG 2018
Munich, January 31, 2018 Page 19 Q1 FY 2018 Analyst Call
Investor Relations contacts
Internet: www.siemens.com/investorrelations
Email: [email protected]
IR-Hotline: +49 89 636-32474
Fax: +49 89 636-1332474
Investor Relations